Article

Investigating the Influence of Consumer Behavior and Governmental Policy on the Diffusion of Electric Vehicles in Beijing, China

School of Economic and Management, North China Electric Power University, Beijing 102206, China
*
Author to whom correspondence should be addressed.
Sustainability 2019, 11(24), 6967; https://doi.org/10.3390/su11246967
Submission received: 23 October 2019 / Revised: 21 November 2019 / Accepted: 2 December 2019 / Published: 6 December 2019

Abstract

:
The adoption behavior of electric vehicles (EVs) has received considerable attention. However, the whole process of purchase behavior has not been well understood. In response, this paper investigates the uptake of EVs in Beijing, China, with a focus on the whole process of purchasing an EV, as well as the relevant policies. Specifically, the classical Howard–Sheth theory is used to the analyze the whole process of EV purchasing, which is divided into four stages here, namely, “Ignored and Neglected”, “Proactive Attention”, “Comparison and Selection of Vehicles” and “Usage Evaluation”. Furthermore, several “what-if” scenarios are set up to quantify the influence of some typical EV-related polices, including the license plate lottery policy and no traffic constriction on battery electric vehicles (BEVs). The results suggest: (1) 63.4% of BEV owners have rigid travel demands with cars; (2) BEVs with a driving range of 500 km, 30-minutes charging time and price of RMB 15,000 are the first choices for the majority of people; (3) 64% of BEV owners are influenced by positive comments from the users around them in the adoption of EVs; (4) the no traffic constriction on BEVs tends to be more influential than the license plate lottery policy in terms of the numbers of applications for the vehicle purchase permits and BEV purchasers, as well as energy saving and vehicular emission reduction. These findings should be helpful for different EV-related stakeholders, such as the government, to shape their policies and promote the development of EVs.

1. Introduction

In China, vehicle emissions have become a major source of Chinese air pollution [1]. Electric vehicles (EVs) have been regarded as one of the most prominent green technologies, touted to help reduce global energy consumption and carbon emissions [2]. However, EVs face many barriers to market expansion. EVs are relatively expensive due to the lack of economies of scale [3]. The charging infrastructure is underdeveloped, and the one-charge driving range is not far enough to meet consumer expectations [3,4,5]. The charging time is long, and battery replacement cost is a heavy burden on consumers [6,7]. Despite the potential for EVs to contribute substantial environmental benefits [8] and receive strong government support (considering purchase subsidy, infrastructure promotion and research and development), Chinese consumers have been hesitant to adopt EVs [9]. China promoted the large-scale adoption of Electric Vehicles (EVs) in its 13th five-year plan; however, this target faces many obstacles [10]. Therefore, it is of great practical significance to study the policy and purchase behavior of EVs in order to increase market share and achieve the goals of energy saving and emission reduction. The behavioral analyses and “what-if” scenario analyses will use the data from a questionnaire survey on EV purchase and semi-structured interviews with transport planners. Specifically, this paper will try to contribute to behavioral science, providing insights into the whole process of EV purchase among consumers. The behavioral evidence will further inform policymaking, so as to promote the development of EV market.
This paper will use Beijing, China as a case study, as the Beijing government tends to put more effort into the development of EVs among Chinese cities, as evident from several typical EV-related policies such as the license lottery policy, usage restriction (also known as the end-number license plate policy) and EV subsides [11]. Specifically, the license lottery policy allocates purchase permits between potential battery electric vehicle (BEV) and conventional vehicle (CV) buyers. In addition, BEV buyers can receive purchase subsides from both the central and Beijing governments. Both of the purchase-related policies are expected to increase the adoption of BEVs. In terms of usage, the end-number license plate policy puts a restriction on the usage of CVs: drivers are not allowed to use their CVs on a specific weekday according to the end-number of their license plates. However, BEV drivers are allowed to use their BEVs every day throughout a whole week.

2. Literature Review

2.1. Influential Factors to the Adoption of Electric Vehicles (EVs)

There are many factors that influence electric vehicle purchasing behavior [12]. Li et al. [13] divided the factors influencing battery electric vehicle (BEV) adoption intentions into three categories: (1) demographic factors including individual variables and family variables; (2) situational factors; and (3) psychological factors.
In terms of demographic factors, Nie [14] and Cheng et al. [15] have considered gender, age, education, type of job, income [16,17], residential area, and car ownership status to be influential factors, while Javid et al. [18] stated that the personal characteristics of age, gender, and employment are insignificant. Abotalebi [19] and Hidrue [6] assert that increases with age, education, green life style, income and number of cars owned do not contribute to a person’s propensity to purchase an electric vehicle. Plötz et al. [20] have claimed the most likely group of private EV buyers in Germany to be middle-aged men. Orlov et al. [21] have determined the number of children in a family to be an additional influencing factor.
Regarding situational factors, technical features (including charging time, charging infrastructure, driving range and vehicle performance [22,23,24,25,26,27]), cost (including purchase price and usage costs [28,29,30,31]), environmental attributes [32,33] and government policy [33,34] have been put forward as the main influencing factors. Li [35] and Matthews [36] have stated that professional pre-sale consulting and experience services are key factors. Except for the above, Higgins el al. [37] consider vehicle body size or type to be an influencing factor.
Regarding psychological factors, Du et al. [38] have suggested that attitudes towards behavior, subjective norms, perceived behavioral control and personal norms are strong determinants of intention to purchase an EV. Qian [2] has deemed the use of sustainable products as compatible with a consumer’s values and beliefs to be an important factor.

2.2. Policies Realted to Electric Vehicles (EVs)

EV-related policies have been found to be a driving factor in EV purchase: Wang et al. [39] divided policy measures into three categories (i.e., financial incentive policy measures, information provision policy measures and convenience policy measures) that are positively and significantly related to EVs adoption intention, with convenience policy measures being the most important policy measure in promoting EVs. On the other hand, current research has found that financial subsidy policy measures (subsidies of operation and subsidies of purchase) tend to be the most effective measure [40,41]. Orlov et al. [21] have claimed that the government provides incentives to use electric vehicles by reducing the loan rate for purchasing them. Zhang et al. [42] have asserted that whether subsidized adoption is sustainable largely depends on consumers’ perceptions and motivations towards purchasing an EV. Zhang et al. [43] have theorized that the subsidies provided by the government might only be attractive when they are large enough to compensate the relative disadvantage of an EV’s performance. Wang et al. [25] have suggested that a drop in financial incentives would not cause a significant decline in the future adoption of EVs. In terms of information provision policy measures, Carlucci et al. [44] have asserted that information policy on environmental protection and publicity of electric vehicles is conducive to the marketing of electric vehicles. In regards to convenience policy measures, Wolbertus [16] and Higgins [24] have suggested that free parking policies and slots reserved for EVs can be effective in boosting the demand for EVs. Nie et al. [14] have suggested that when comparing with subsidy policies, a free license plate for an EV seems attractive to consumers. In general, the acceptability of policy has a positive significant influence on intention of purchasing BEVs [38].

2.3. Idenfitying Research Gaps and Objectives

As reviewed above, the purchase behavior of EVs has received considerable attention in the previous studies of EVs. However, these studies have tended to focus on the influential factors on the uptake of EVs, and paid significantly less attention to the behavioral transitions of potential EV purchasers over time. Specifically, the potential EV purchasers may experience several stages from the initial stage when EVs are quite new to them, to the final stage when they decide to purchase EVs. This paper will try to provide insight into these behavioral changes and explore how these changes happen and what the causes are, using the classical Howard–Sheth theory. According to this theory, the whole process of decision-making during EV purchase will be divided into four stages: “Ignored and Neglected”, “Proactive Attention”, “Comparison and Selection of Vehicles” and “Usage Evaluation”. The key behavioral characteristics of consumers at each stage will be characterized based on a questionnaire survey in Beijing. With the results from the behavioral analyses, “what-if” scenarios will be set up to explore the influence of some typical EV-related polices on the purchase behavior of EVs, and further environment and energy systems at a global level.
In brief, the paper aims to make contributions to the studies of EVs in the following two aspects: first, it will provide insights into the whole process of decision-making during EV purchase at the individual level through behavioral analysis; second, it will evaluate several typical EV-related policies through “what-if” scenarios in terms of their influences on individual purchase behavior to further environmental and energy systems. The outcomes are expected to inform policymaking and to promote the development of EVs. Therefore, this paper has both theoretical and practical contributions.

3. Methodology

3.1. Howard–Sheth Purchase Behavior Chain Theory

3.1.1. Introduction to the Theory

Howard and Sheth proposed "Howard–Sheth" consumer behavioral analysis theory in 1963, and the theory holds that input factors and external factors are the stimuli of purchasing that provide the information on various options by evoking and forming motivations, and that affect the psychological activities of purchasers (intrinsic factors) [45]. Under the influence of stimuli and past purchasing experiences, consumers begin to accept information and generate a variety of motivations, producing a series of reactions to selectable products. A series of purchasing-decision intermediary factors (e.g., the options’ evaluation criteria, intentions, etc.) can then be formed, and certain tendencies and attitudes can be generated due to the interactions among motivation, purchase plans and intermediary factors [46]. The purchasing decision is generated when this tendency or attitude is combined with other factors, such as the limiting factors of the purchase behavior. The feeling information formed by the purchase results will also be fed back to the consumers, and will further affect the psychology of consumers and their next purchases [47].
As a new product to the majority of citizens, the influence and technical identity of BEVs have not yet been formed, and the government and enterprises have mainly taken external incentive measures to promote the adoption of EVs, including car-purchasing subsidies, pass exemptions, a lottery, and community propaganda. The acceptability of BEVs was well matched by the essence of the Howard–Sheth theory. Therefore, this theory is adopted here to establish an analytical framework.

3.1.2. Applying the Theory in the Purchase of Electric Vehicle

The changes affecting the purchase decisions and usage characteristics of BEVs were analyzed using the Howard–Sheth theory. It was found that consumers experience the following stages: (1) Ignored and Neglected, (2) Proactive Attention, (3) Comparison and Selection of Vehicles and (4) Usage Evaluation, as illustrated in Figure 1. Each stage is introduced and detailed in Table 1. Within the whole process of vehicle purchase and usage, there are several key transitions below (see Figure 1): The transition from the Ignored and Neglected stage to the Proactive Attention stage is to begin to proactively collect relevant information; the transition from the Proactive Attention stage to the Comparison and Selection stage is to begin to participate in the license plate lottery policy; the transition from the Comparison and Selection stage to the Usage Evaluation stage is to complete the purchase of an EV.
In order to figure out the behavioral characteristics of each stage, the corresponding survey questions need to be set up for special populations. The Ignored and Neglected stage is mainly aimed at those people who have always been involved with the lottery for conventional vehicles (CVs), and asking them their existing concerns about BEVs; the Proactive Attention stage is mainly aimed at those people who did not purchase vehicles despite holding BEV indicators, and also asking vehicle owners about the demand intensity of the vehicle, the source of information channels, the technical factors focused on, and so on. The Comparison and Selection stage is mainly aimed at those people who did not purchase vehicles while holding BEV indicators, while asking vehicle owners about the key factors in car purchase decisions; the Usage Evaluation stage is mainly aimed at owners of BEVs, and asking them about actual travel characteristics, charging behaviors, usage evaluation of the vehicle, policy implications, and so on.

3.2. “What-If” Scenario Analysis: Quantifying the Influence of Policies

A “what-if” scenario analysis is a typical approach to evaluating policies. In general, a reference scenario (or baseline) needs to be set up, then several other scenarios with different policies will be examined and compared to the baseline, so as to understand the influence of the policies tested. This method can be applied to those scenarios with multiple policies, so as to understand the overall influence. In addition, in order to better understand the way policymakers design EV-related policies, a semi-structured interview [48] was conducted with eight transport planners from the Beijing Transport Institute, which is a research institute related to the transport planning and policymaking of Beijing. Note that the interviewers were anonymous, and the responses of the transport planners were purely their own personal views, which had no connections with any organizations (e.g., the research institute) or any policies under design. The results from the interviews were used to better set up the “what-if” scenarios and estimate some relevant model parameters, such as impact factors for each policy.
Figure 2 shows the method used to quantify the influence of different policies within “what-if” scenarios. The key input is the historical data on the number of applicants under different policies. Next, a linear model and the results from the semi-structured interviews with transport planners are used to estimate the number of EV applicants per month, as well as the impact factor of different EV-related polices. Here, the method assumes that the number of EV applicants per month increases linearly within a short period (say 12 months). With the linear model and policy impact factors, the actual number of EV purchasers can be further estimated, taking into account the possible constraint on the total number of purchase permits (due to the license plate lottery policy). Finally, the potential impacts of the adoption of EV on the environment and energy systems can be assessed, given the actual number of EV purchasers.

3.3. Design of Questionnaire Survey

According to the cognitive level and behavior characteristics of people for the BEVs at the four different stages of the behavioral chain, the corresponding survey contents were respectively designed, and the data on purchase intention and usage of BEVs were collected by applying a typical survey method of a pre-interview questionnaire survey/in-depth interview, based on which the characteristics of each stage were quantitatively analyzed.
This study determined the contents of the questionnaire by conducting the pre-interview and organized online surveys through WeChat (one of the most popular apps in China). Consumers with specific features were selected to participate in in-depth interviews that would later be used for analysis of the behavioral chain. At the beginning of the questionnaire survey, we used three filter questions to verify the identity of the respondents: (1) age; (2) gender; (3) district where the respondent lived.
According to the requirements of the analysis of behavioral chain, three groups of people were surveyed through a stratified sampling method: the first group was owners who had purchased BEVs; the second group was people who were holding the plate numbers of BEVs, but had not purchased yet; the third group was people insisting on the plate lottery for conventional vehicles (CVs), such as petrol cars. The survey covered six vehicle models from five mainstream brands, namely BAIC, JAC, BYD, Denza and Tesla. The survey was composed of five key aspects—participants’ socio-characteristics, purchase intentions, policy sensitivities, usage intentions for their vehicles and satisfaction towards charging facilities—which are summarized in Table A1 in Appendix A.
Furthermore, a specific number of participants in each of the three groups were asked to participant in in-depth interviewers, in order to better understand their viewpoints towards vehicle purchase, influential factors, usage behavior and vehicle performance. We contacted participants at random, but only 52 of them agreed to do the follow-up in-depth interviews. We do not use the results from the in-depth interviews directly here. Instead, they were used to help us interpret the results from the questionnaire survey.

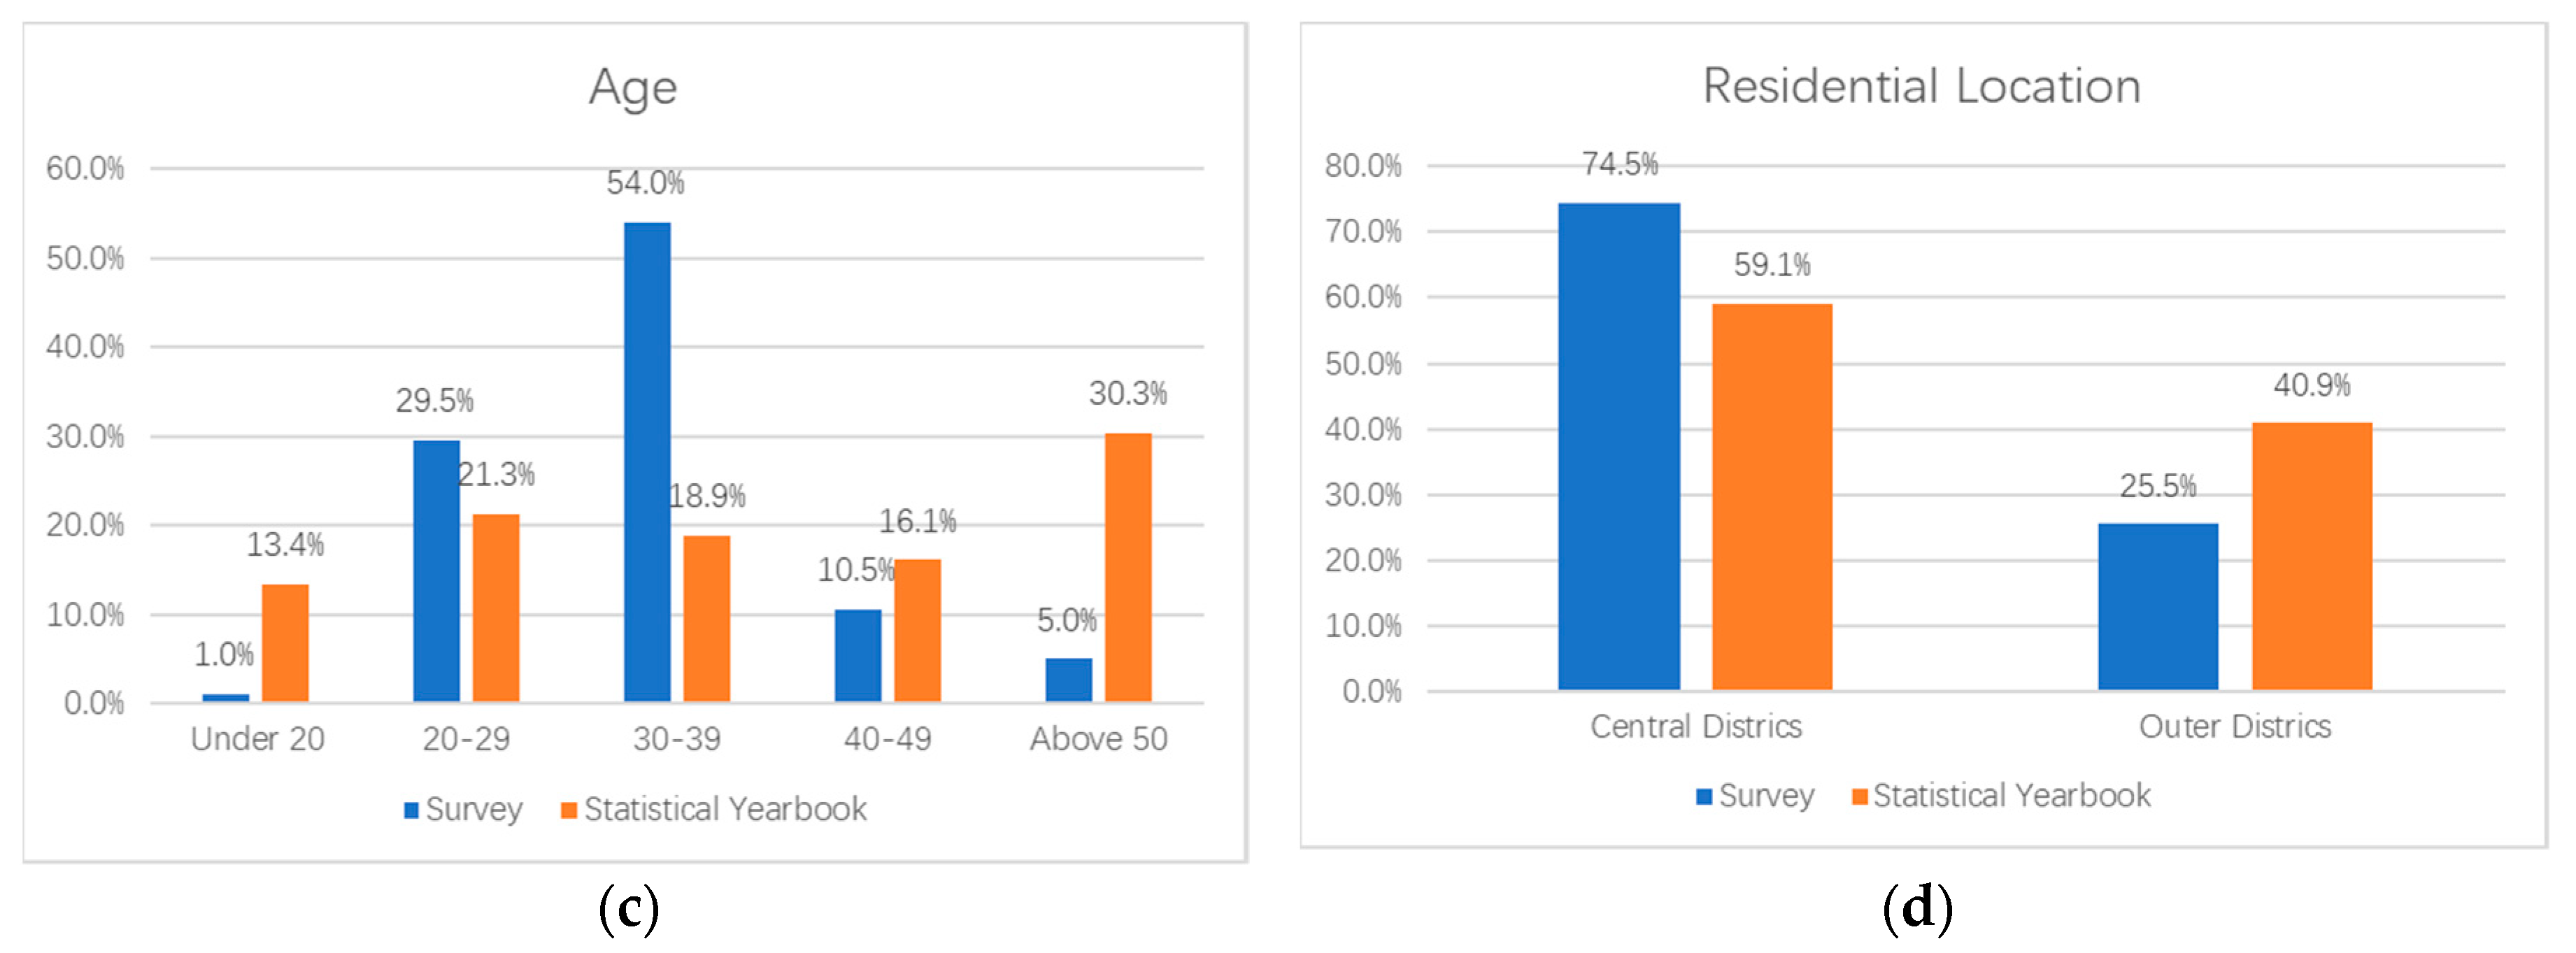
4. General Results of Survey in Beijing

In total, 500 questionnaires were distributed, but only 360 of them are valid samples, with a valid response rate of 72%. In order to examine the representation of the samples, the distributions of gender, education, age and residential location from our survey and the 2016 Beijing Statistical Yearbook are compared (see Figure A1), and the survey basis is discussed in detail in Appendix A. As mentioned above, the participants were grouped into three categories; namely, owners who had purchased BEVs (denoted as Group 1-BEV Owner); those who were holding plate numbers of BEVs, but had not purchased yet (denoted as Group 2-BEV Plate Holder); and those insisting on the plate lottery for conventional vehicles (CVs), such as petrol cars (denoted as Group 3-CV Purchaser). The sociodemographic characteristics of participants are compared in Figure 3. Socio-demographic characteristics were found to be an influential factor on the uptake of EVs in many other studies [13,49,50]; however, in our study the following conclusions can be drawn regarding the relationship between socio-demographic characteristics and EV purchase behavior: (1) male participants were more willing to purchase CVs, which differs from the finding that that male consumers tended to adopt EVs in [13]; (2) participants with a higher education level (e.g., master’s and PhD) tended to purchase CVs (this finding is consistent with the other studies; see [13] for a specific example); (3) there was no significant spatial difference in the choice of vehicle type (such spatial analyses tended to receive less attention in the previous studies [12]); and (4) participants with a lower household income were more likely to purchase EVs, which is different from some of the other studies that suggested income is not an influential factor in the uptake of EVs [6,41,51].

5. Purchase Behavior of EVs in Beijing

Based on the survey results, it was found that consumers of BEVs had significant behavioral characteristics and key factors affecting their transition from one stage to the next in regards to the four stages of car purchase behavior. The detailed analyses are as follows.

5.1. Stage 1: Ignored and Neglected Stage

People at this stage passively receive information about BEVs, and the main manifestations are hearsay, nonchalance and concern. As shown in Figure 4, range anxiety is the primary factor affecting the decision-making of consumers who are in the license plate lottery for CVs, accounting for 55%. The second influential factor is access to charging facilities, accounting for 30%. Range anxiety is closely associated with access to charging facilities, as range anxiety can be addressed in those cases where charging infrastructures are widely deployed [52]. Both range anxiety and the deployment of charging facilities have been commonly reviewed as significantly influential factors in the adoption of EVs (see [13,53,54,55] for specific examples). Other factors, such as battery recycling (2%), vehicle price (9%) and vehicle maintenance (4%), however, have tended to be less influential. Vehicle price was found to be not as influential as range anxiety in this study, although in some other studies vehicle price has been found to be more influential [12,56].

5.2. Stage 2: Proactive Attention

The main motivations that stimulate people at the Ignored and Neglected stage to move to the Proactive Attention stage (namely, the stimulus factor in the Howard–Sheth theory) are as follows:
(1)
The increasing policy stimulus. The survey showed that 62% of BEV owners made purchases primarily based on policy incentives. Among the incentives, the stimuli with most obvious effects were the policies of a separate lottery and no traffic restrictions for BEVs, which accounted for about 65.8% in total. In the study by [12], both the separate lottery policy and the absence of traffic restrictions were also found to be influential in Beijing. In addition, air quality was important. Specifically, after the red alert of heavy pollution weather, 43% of potential CV users said they would consider buying BEVs. Figure 5 shows the points where different EV-related polices were issued in Beijing, including a tax exemption policy (issued September 2014) and traffic un-restriction (issued in June 2015). Among the policies, the traffic un-restriction tended to be much more influential, as the total number of valid applications increased heavily after the point when the policy was issued. This is consistent to the findings above from our survey.
(2)
The demand for vehicles has become urgently strong. According to the survey, those households willing to purchase BEVs did so mainly because of rigid travel demands triggered by a location change, marriage, birth or increase in the number of members driving cars.
(3)
Effective access to information. The introduction through friends and family has become the primary factor to induce consumer to pay attention to EVs, accounting for about 64%. Other dissemination modes that were mainly dominant were professional vertical media and the websites of car enterprises. Actual user experience greatly affects the reputation of the brand and the market prospects of the model, and car enterprises should pay close attention. This sort of social influence has also been found in the other studies [57,58], and is considered to be a variable in the EV market model [8,59].
(4)
The access to relevant sources of information, such as government decisions, and realization of the scarcity of resources. Some staff in government agencies, public institutions, and state-owned enterprises have stronger desires to possess resources because they are more aware of the direction BEV development policies are headed.

5.3. Stage 3: Comparison and Selection of Vehicles

The Comparison and Selection (of vehicles) stage is focused on those people who have received a purchase permit and are looking for a vehicle in the market. In general, these people have a clear demand in terms of vehicle usage, as well as relatively clear expectations of the key vehicle characteristics. They begin to compare different vehicles and eventually select one, considering both the key characteristics and also access to charging facilities. As mentioned above, driving range is a key factor influencing the purchase of BEVs. As shown in Figure 6, of those households with only one vehicle, 60% of them could accept a driving range from 175 to 525 km. The most ideal price of models was around RMB 150,000, with a driving range of 500 km. The preferred driving range in Beijing was a bit higher than in other surveys, such as 308 km in the EU and 437 km at the world level [60].

5.4. Stage 4: Usage Evaluation

People who own and use an EV become more familiar with the vehicle performance and gradually adapt to their vehicle. Motivating people to transition from the stage of Comparison and Selection to the stage of Usage Evaluation is the incentive of the BEV policies. BEV users show more distinctive usage characteristics because of the influence of relevant traffic demand management policies.
(1) Characteristics of Travel Behavior
The survey suggests that the travel characteristics of BEV owners were mainly divided into three categories. The first category is a group of people with rigid demands for their vehicles. They only have one BEV, accounting for 63.4% of respondents. The second category is a group of people with supplementary travel demands. To them, the BEV is not their first car, and the number of car users increases after purchasing a BEV, with the average daily travel mileage of the family’s total passenger vehicles increasing by 42.2% (from 51.7 to 73.5 km/day). The third category is a group of people with alternative travel demands. To them, the BEV is not their first car, and the number of vehicle users does not change after purchasing a BEV. The travel mileage of the family’s total passenger vehicles increases slightly (see Figure 7), and the average daily mileage of the original CV drops (in this survey from 59.4 to 12.5 km/day, which is only 21.5% before purchasing the EV). The purchase and use of BEVs significantly affected passenger vehicle travel in households, and changes in travel characteristics affected the effectiveness of traffic policy formulation and implementation.
(2) Characteristics of Charging Behavior
Over half of car owners did not have their own private charging facilities (e.g., charging posts). The construction of private charging points was controlled, because car owners did not have their own dedicated parking spaces, or because property operators did not approve the construction. For those BEV owners that did have private charging points, the frequency of charging at home was 13 times per month, accounting for 81.3% of total charging times (which was 16 on average). For those without private charging points, their acceptable charging frequency was once per week, but in winter they would require nearly two to three charges per week. At present, due to the low density of public charging points, it takes a long time to find charging points. From looking for a social charging pile to leaving the charging station, the maximum acceptable time in the survey was within two hours, while the maximum acceptable charging time was within 32.5 min. It is better to manage to charge through fast charging points within a range from 5 to 15 min. This is consistent with the finding in [61] stating that EV drivers in Beijing preferred charging times ranging from 8 to 10 min.
(3) Costs and Benefits of Using Cars
According to the survey (see Figure 8), the energy cost per 100 km for CVs was about RMB 53.3, while it was only RMB 15.5 for BEVs. The low operation cost was also one of the reasons why many households choose BEVs as their preferred second vehicle. As per the survey, a CV consumed 9.4 L gasoline per 100 km, which is equivalent to 10.2 kgce of standard coal. Meanwhile, a BEV consumes 20.4 kWh electricity per 100 km, which is equivalent to 2.6 kgce of standard coal. The BEV has a significant benefit in terms of energy saving. Moreover, compared with CVs, BEVs also have another obvious advantage of vehicular emission reduction, due to the characteristics of producing zero emissions.

6. The Role of Various Policies in the Uptake of EVs in Beijing

6.1. General Results about the Role of Policy in the EV Adoption

The survey showed that policy incentives were the decisive factor stimulating consumers to buy BEVs (see Figure 9). The number of people who chose policy as the primary factor to stimulate the purchase of BEVs accounted for 62%. Here, the policy incentives included BEV purchase subsidies [62] provided by both the central and Beijing governments, the license plate lottery policy [63] and the end-number license plate policy [12]. The former two are associated with the vehicle purchase; the latter is associated with the vehicle usage. Both purchase- and usage-related factors have also been found influential to the uptake of EVs in Beijing [12]. The rest selected by people were “interested in new technologies” (20%), “energy saving and environmental protection” (9%), and so on.
According to the survey on the influence of current policies (see Figure 10), the separate plate lottery policy had a decisive impact on purchase decision, and the people who selected traffic policies (including the separate plate lottery policy and no-traffic restriction on BEVs) as the primary factor behind BEV purchase accounted for about 80% of respondents.
In summary, technical performance of vehicles (e.g., driving range) was the primary consideration for consumers to purchase cars. At the present stage, the technical performance of BEVs can basically meet consumers’ requirements for their daily commuting trips, but compared with CVs, they are still not competitive. Given the current vehicle technologies, policy factors have become the primary factors influencing consumers to buy BEVs. Among those policy factors, the separate plate lottery policy has a decisive impact on consumer purchases of BEVs. The end-number plate policy (that has no traffic restriction on EVs) has played an important role in promoting BEVs.

6.2. “What-If” Scenario Analysis: Policy Implication and Environment Impact

As introduced in Section 2.3, this paper will set up several “what-if” scenarios to test the influence of different policies during the period from 2016 to 2020, as well as the associated environmental impacts involved. We calculated the monthly growth rate of applicants with different policies within the four cases, shown in Table 2. The calculation method is described as follows:
Step 1.
The monthly growth rate of applicants is computed for Case 1 (Separate Plate Lottery) and Case 3 (No Traffic Restriction & Separate Plate Lottery) according the number of applicants at different points. Take Case 1, for example: The number of applicants increased by 1101 from January 2014 to May 2015. Thus, the monthly growth rate of new applicants was 64.76. Similarly, we can get the monthly growth rate of new applicants for Case 3, which was 158.60.
Step 2.
Estimating the monthly growth rate of applicants for Case 2 (No Traffic Restriction) should be the difference between the monthly growth rates in Case 1 and Case 3. As a result, we get a growth rate of 93.84. Further, we can compute the policy impact factors for Cases 1 and 3, which are 0.33 and 0.47, respectively, according to the growth rates.
Step 3.
Based on the interviews with eight transport planners in Beijing, the influential weights of Case 3 (No Traffic Restriction & Separate Plate Lottery) and Case 4 (Other Policies) are set to 0.8 and 0.2, respectively. Therefore, we can get 39.65 as monthly growth rate of new applicants for Case 4 (Other Policies).

6.2.1. EV Market Share in Different Scenarios

Limited by existing policies, the quota for BEVs was set at 60,000 vehicles during 2016–2017. At the same time, assuming that the total number of motor vehicles is still restricted by regulatory policies and that the quota for BEVs is still 60,000 vehicles per year, we can calculate the present scenarios for above four policies, with the results shown in Table 3.
With the influential policy factors extracted above and the number of new plates per month, the promotion scale of BEVs from 2016 to 2020 can be predicted, as shown in Table 4 and Table 5. Specifically, Table 4 presents the predicted number of people who would apply for vehicle purchase permits within the four difference scenarios responding to the different polices; Table 5 shows the predicted total number of EV purchasers from 2016 to 2020 under the scenarios, considering the fixed number of vehicle purchase permits (namely 60,000). For example, the number of applicants in 2017 in Scenario A is 88,000 (see Table 4). However, the precited actual number of purchasers in 2017 is 60,000 (see Table 5), due to the constraint on the total number of purchase permits available (which is 60,000). Overall, it can be seen from Scenario A that a larger number of polices tends to attract higher numbers of applicants and purchasers. By comparing Scenarios B and C, it can be found that Scenario C (including the no traffic rustication policy) tends to have higher numbers of applicants and purchasers, suggesting that the no traffic rustication policy tends to be more influential than the separate plate lottery policy.

6.2.2. Environmental Impacts in Different Scenarios

The effect on energy saving and emission reductions under different mixes of policies was calculated according to the predicted development trend of the total number of BEVs during the period 2016–2020 and the usage intensity of BEVs and traditional CVs (Table 6). Scenario A demonstrates that a higher number of applicants and purchasers of BEVs tends to also save more energy and reduce a higher amount of vehicular emissions (including NOx, CO and HC).

7. Conclusions

This paper tried to provide insight into the behavioral transitions of potential purchasers in the whole process of EV purchasing, using the classical Howard–Sheth theory. Based on the results from the behavioral analyses together with the information from semi-structured interviews with transport planners, several “what-if” scenarios were set up to explore the roles of different EV-related policies, as well as the associated energy and environmental impacts.
According the behavioral analyses of EV purchasing, the following conclusions can be drawn:
(1)
The addition of BEVs into households has an impact on car trips, and the change of travel mode is mainly reflected in the following three situations. (a) It is found that 63.4% of the owners of BEVs bought their cars with the purpose of meeting rigid travel demands. The average daily travel mileage was about 50.8 km, which is obviously higher than that of CVs. (b) It is found that 12.2% of the owners of BEVs bought their cars for the purpose of supplementing their travel demands. After purchasing the BEV, the numbers of people travelling by car increased, and the total average daily travel mileage by car increased from 51.7 to 73.5 km/day, at a growth rate of 42.2%. (c) It is found that 24.3% of the owners of BEVs bought their cars for the purpose of replacing their CV. The total average daily travel mileage by family car then increased slightly. The original average daily travel mileage by CV was reduced from 59.4 to 12.5 km/day, which only accounts for 21.5% of that before the purchase of the BEV.
(2)
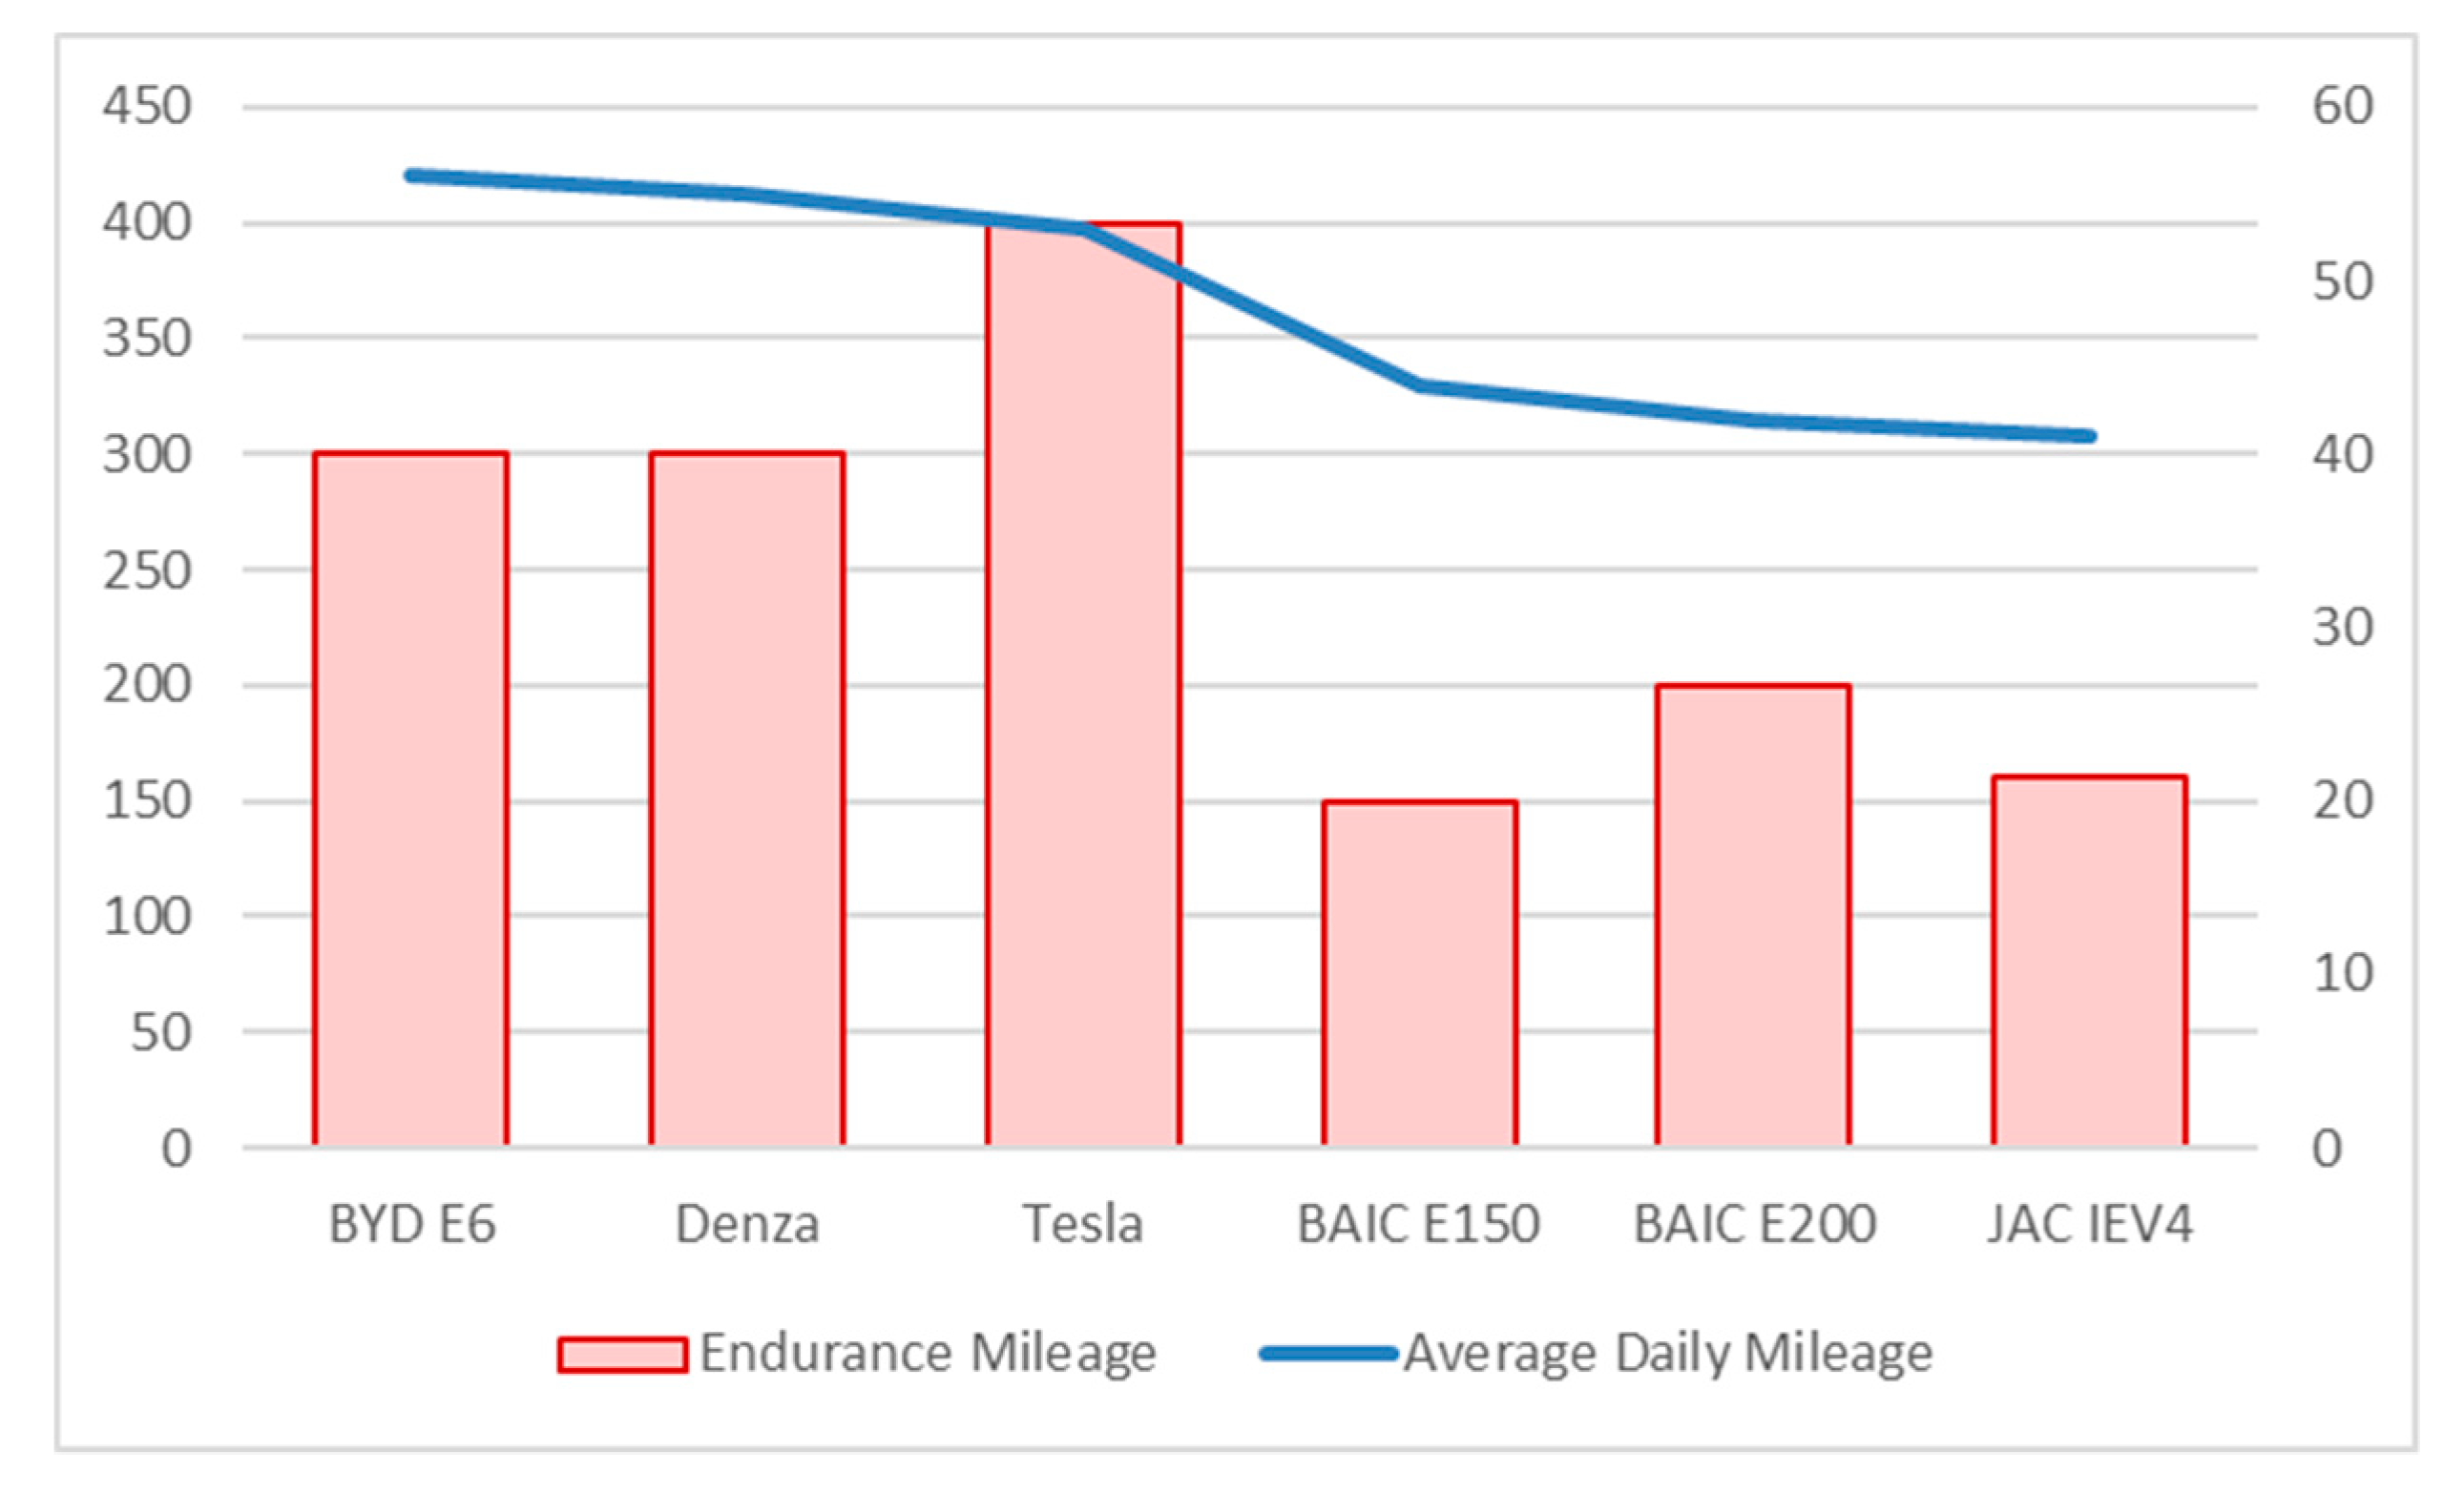
BEVs with a driving range of 500 km, a 30-minute charging time and cost of RMB 15,000 were the first choices for the majority of respondents. Most of BEVs available in the market have a driving range between 200 to 300 km and a price range between RMB 200,000 to 300,000, which is still a certain disparity from consumers’ expectations of the preferred models.
(3)
Word-of-mouth promotion by relatives and friends is one of the primary factors influencing consumers’ car purchasing decisions. It was found in studies that 64% of car owners started to pay attention to/decided to buy BEVs after being influenced by the positive comments from the users around them.
Furthermore, the following “what-if” scenario analyses also offer valuable suggestions:
(1)
Large cities in China are in the process of rapid motorization. Although Beijing and other big cities have implemented the policy of total quantity control of motor vehicles, the total number of vehicles keeps rising as it did before. With this in mind, the existing policy stimuli for BEVs focus on new cars, and exert a positive effect on controlling he growth rate of total energy consumption emissions in the urban traffic sector.
(2)
At present, the incentive policy for BEVs is only for new vehicles, with no incentive policy for replacing BEVs with existing vehicles. As a result, there are insufficient incentives for developing BEVs among existing vehicle owners. BEVs contribute much less than they might to the reduction of energy consumption and pollutant emissions in the existing urban traffic sector, and innovative policies and vehicle technologies remain to be developed that can compete against CVs.
(3)
The incentive effect of the separate plate lottery policy and the incentive effect of no traffic restriction of BEVs on the promotion of BEVs reflect a phenomenon of mutual complementarity and mutual influence. The separate plate lottery policy is a fundamental reason for consumers to switch to BEVs, but the impact on promoting BEVs requires long-term accumulation. The duplicate effect of no traffic restriction can shorten the cycle of promoting BEVs and further enhance the benefits of energy conservation and emission reduction that are made possible by BEVs.
(4)
At present, the promotion of BEVs exists mainly to solve the problem of vehicular emissions. However, as a motor vehicle, BEVs occupy road resources just as CVs do, which is not beneficial to traffic jams. At the same time, BEVs can enjoy the no traffic restriction policy and other traffic exemption policies, and the use of BEVs has significantly increased compared with CVs. As the scale of promoting BEVs expands, it will lead to traffic jam pressure in urban cities. In the long run, it will be necessary to adopt a method of optimizing traffic structure to achieve the traffic development goal of combining pollution control with traffic jam control.
According to the findings above, it can be further concluded that the whole process of purchasing an EV is quite complicated, and the influential factors can vary across the four stages of Ignored and Neglected, Proactive Attention, Comparison and Selection of Vehicles and Usage Evaluation. This finding can help local authorities develop more-efficient and more-effective approaches to promoting the adoption of EVs at different stages. In addition, policies have been found to be one of the most influential factors in the whole process of purchase behavior regarding EVs. Furthermore, the "what-if" scenarios considering different policies, including the license plate lottery policy and traffic restrictions, provide insights into the extent to which these polices can influence the uptake of EVs. The analysis results indicate that the license plate lottery policy tends to be more influential than traffic restrictions. Although these findings are from Beijing, they should be useful for other cities across the globe, especially those cities that are or will be promoting the development of EVs.
Based on the findings above, four suggestions are put forward for the sustainable development of BEVs in Beijing. Firstly, it is suggested that the Transportation Department should regularly analyze the differences between the purchase and use characteristics of BEVs and CVs and continuously pay attention to the effects of certain policies, while also evaluating the impact of the purchase and use of BEVs on traffic jams in urban cities. Secondly, it is suggested that vehicle manufacturers should pay more attention to the requirements of users. On the premise of improving vehicle technologies, vehicle manufacturers should control vehicle costs and gradually realize the replacement of existing CVs with BEVs, so as to truly achieve energy conservation and emission reduction. Thirdly, it is suggested that vehicle manufacturers should pay high attention to post-sales service quality, battery recycling and other issues on the basis of increasing driving ranges and reducing vehicle charging times to improve vehicle quality and service. Fourthly, although the findings above are from Beijing, they should also be useful for other cities that aim to promote the development of EVs. This is because Beijing has become one of the largest markets for EVs. Insight into its purchase behavior and policy implications can help other cities encourage people to purchase and use EVs in an efficient and effective way.
The limitations of this study and the future work are discussed as follows. First, in the questionnaire survey, young people and people with higher education levels were disproportionately surveyed, according to the comparisons between the distributions from our survey and the statistical yearbook. Although this might not add too much bias in this study of EVs, the potential influence of the bias on the results should be borne in mind when the empirical findings are used. Second, rich information on the individual purchasing behavior of EVs was obtained from the empirical analysis. Such empirical evidence would be particularly useful for developing a data-driven model of EV adoption, such as using agent-based modelling [64]. An agent-based model is a typical approach to investigating complex dynamic systems at the individual level, and has been applied in various research fields such as economy [65,66] and transport [67,68] studies. It has also been applied to simulate the diffusion of EVs at a micro scale [69]. The resulting empirically agent-based EV purchase model would be more behaviorally sound and thus useful, for example, for policymaking.

Author Contributions

Y.Y.: Conceptualization, Software, Visualization, Methodology, Writing—original draft. Z.T.: Conceptualization, Supervision, Investigation, Writing—review & editing.

Funding

This research received no external funding.

Conflicts of Interest

The authors declare no conflict of interest.

Appendix A

The questionnaire contained two question types, namely, questions with single choices and multiple choices. More details on the type of each question can be found in Table A1.
Table A1. Design of questionnaire.
NoSurvey FrameSubject
Questions with a Single Choice Questions with Multiple Choices
1Crowd Characteristics [4]Name; Mobile; Gender; Age; Educational background; Company; Number of family members and income; ResidenceN/A
2Existing Concerns Vehicle performance; Infrastructure
3Purchase IntentionStatus of lottery; Purchasing time; Purchased model; Purchasing price; Vehicle ownership;Purchasing cause; Existing prejudices and doubts
4Policy SensitivityOrder of policy impact;Implemented policy; Policies to be implemented
5Usage Characteristics of VehiclesTrip mileage; Trip distance; No. of trips; Trip mileage in Winter and SummerN/A
6Satisfaction of Charging FacilitiesMonthly electricity expenditure; Charging times; Charging habitsProcess of constructing Points after Purchasing; Satisfaction for social Charging Points; Successful experiences; Unsuccessful reason
Figure A1 compares the distributions of gender, education, age and residential location from both our survey and the 2016 Beijing Statistical Yearbook. Roughly, the differences in the distributions of gender and residential locations tend to be small. However, our survey got more respondents with higher education levels (e.g., master’s and bachelor’s degrees) and more young people (aged 20–39). These might not add too much bias to this study looking at the purchase behavior of EVs, as EVs tends to be more preferable to those young people and people with higher education levels.
Figure A1. Sociodemographic characteristics of participants: (a) gender; (b) education level; (c) age; (d) residential location.
Sustainability 11 06967 g0a1aSustainability 11 06967 g0a1b

References

  1. Peng, B.; Du, H.; Ma, S.; Fan, Y.; Broadstock, D.C. Urban passenger transport energy saving and emission reduction potential: A case study for Tianjin, China. Energy Convers. Manag. 2015, 102, 4–16. [Google Scholar] [CrossRef]
  2. Qian, L.; Yin, J. Linking Chinese cultural values and the adoption of electric vehicles: The mediating role of ethical evaluation. Transp. Res. Part D Transp. Environ. 2017, 56, 175–188. [Google Scholar] [CrossRef]
  3. Junquera, B.; Moreno, B.; Álvarez, R. Analyzing consumer attitudes towards electric vehicle purchasing intentions in Spain: Technological limitations and vehicle confidence. Technol. Forecast. Soc. Chang. 2016, 109, 6–14. [Google Scholar] [CrossRef]
  4. Carley, S.; Krause, R.M.; Lane, B.W.; Graham, J.D. Intent to purchase a plug-in electric vehicle: A survey of early impressions in large US cites. Transp. Res. Part D Transp. Environ. 2013, 18, 39–45. [Google Scholar] [CrossRef]
  5. Steinhilber, S.; Wells, P.; Thankappan, S. Socio-technical inertia: Understanding the barriers to electric vehicles. Energy Policy 2013, 60, 531–539. [Google Scholar] [CrossRef]
  6. Hidrue, M.K.; Parsons, G.R.; Kempton, W.; Gardner, M.P. Willingness to pay for electric vehicles and their attributes. Resour. Energy Econ. 2011, 33, 686–705. [Google Scholar] [CrossRef] [Green Version]
  7. She, Z.; Sun, Q.; Ma, J.; Xie, B. What are the barriers to widespread adoption of battery electric vehicles? A survey of public perception in Tianjin, China. Transp. Policy 2017, 56, 29–40. [Google Scholar] [CrossRef]
  8. Zhuge, C.; Wei, B.; Dong, C.; Shao, C.; Shan, Y. Exploring the future electric vehicle market and its impacts with an agent-based spatial integrated framework: A case study of Beijing, China. J. Clean. Prod. 2019, 221, 710–737. [Google Scholar] [CrossRef] [Green Version]
  9. Zhang, X.; Liang, Y.; Yu, E.; Rao, R.; Xie, J. Review of electric vehicle policies in China: Content summary and effect analysis. Renew. Sustain. Energy Rev. 2017, 70, 698–714. [Google Scholar] [CrossRef]
  10. Zhuge, C.; Wei, B.; Shao, C.; Dong, C.; Meng, M.; Zhang, J. The potential influence of cost-related factors on the adoption of electric vehicle: An integrated micro-simulation approach. J. Clean. Prod. 2019, 119479. [Google Scholar] [CrossRef]
  11. Zhuge, C.; Shao, C.; Li, X. Empirical analysis of parking behaviour of conventional and electric vehicles for parking modelling: A case study of Beijing, China. Energies 2019, 12, 3073. [Google Scholar] [CrossRef] [Green Version]
  12. Zhuge, C.; Shao, C. Investigating the factors influencing the uptake of electric vehicles in Beijing, China: Statistical and spatial perspectives. J. Clean. Prod. 2019, 213, 199–216. [Google Scholar] [CrossRef] [Green Version]
  13. Li, W.; Long, R.; Chen, H.; Geng, J. A review of factors influencing consumer intentions to adopt battery electric vehicles. Renew. Sustain. Energy Rev. 2017, 78, 318–328. [Google Scholar] [CrossRef]
  14. Nie, Y.; Wang, E.; Guo, Q.; Shen, J. Examining Shanghai Consumer Preferences for Electric Vehicles and Their Attributes. Sustainability 2018, 10, 2036. [Google Scholar] [CrossRef] [Green Version]
  15. Cheng, Y.; Chen, J.; Lin, K. Exploring consumer attitudes and public opinions on battery electric vehicles. J. Renew. Sustain. Energy Rev. 2015, 7, 043122. [Google Scholar] [CrossRef]
  16. Wolbertus, R.; Kroesen, M.; van den Hoed, R.; Chorus, C.G. Policy effects on charging behaviour of electric vehicle owners and on purchase intentions of prospective owners: Natural and stated choice experiments. Transp. Res. Part D Transp. Environ. 2018, 62, 283–297. [Google Scholar] [CrossRef] [Green Version]
  17. Bauer, G. The impact of battery electric vehicles on vehicle purchase and driving behavior in Norway. Transp. Res. Part D Transp. Environ. 2018, 58, 239–258. [Google Scholar] [CrossRef]
  18. Hackbarth, A.; Madlener, R. Willingness-to-pay for alternative fuel vehicle characteristics: A stated choice study for Germany. Transp. Res. Part A Policy Pract. 2016, 85, 89–111. [Google Scholar] [CrossRef]
  19. Abotalebi, E.; Scott, D.M.; Ferguson, M.R. Why is electric vehicle uptake low in Atlantic Canada? A comparison to leading adoption provinces. J. Transp. Geogr. 2019, 74, 289–298. [Google Scholar] [CrossRef]
  20. Plötz, P.; Schneider, U.; Globisch, J.; Dütschke, E. Who will buy electric vehicles? Identifying early adopters in Germany. Transp. Res. Part A Policy Pract. 2014, 67, 96–109. [Google Scholar] [CrossRef]
  21. Orlov, A.; Kallbekken, S. The impact of consumer attitudes towards energy efficiency on car choice: Survey results from Norway. J. Clean. Prod. 2019, 214, 816–822. [Google Scholar] [CrossRef]
  22. Kwon, Y.; Son, S.; Jang, K. Evaluation of incentive policies for electric vehicles: An experimental study on Jeju Island. Transp. Res. Part A Policy Pract. 2018, 116, 404–412. [Google Scholar] [CrossRef]
  23. Kim, M.; Oh, J.; Park, J.; Joo, C. Perceived value and adoption intention for electric vehicles in Korea: Moderating effects of environmental traits and government supports. Energy 2018, 159, 799–809. [Google Scholar] [CrossRef]
  24. Cherchi, E. A stated choice experiment to measure the effect of informational and normative conformity in the preference for electric vehicles. Transp. Res. Part A Policy Pract. 2017, 100, 88–104. [Google Scholar] [CrossRef] [Green Version]
  25. Wang, F.; Yu, J.; Yang, P.; Miao, L.; Ye, B. Analysis of the Barriers to Widespread Adoption of Electric Vehicles in Shenzhen China. Sustainability 2017, 9, 522. [Google Scholar] [CrossRef] [Green Version]
  26. Liao, F.; Molin, E.; Wee, B. Consumer preferences for electric vehicles: A literature review. Transp. Rev. 2017, 37, 252–275. [Google Scholar] [CrossRef] [Green Version]
  27. Tan, Q.; Wang, M.; Deng, Y.; Yang, H.; Rao, R.; Zhang, X. The Cultivation of Electric Vehicles Market in China: Dilemma and Solution. Sustainability 2014, 6, 5493–5511. [Google Scholar] [CrossRef] [Green Version]
  28. Liu, Y.; Cirillo, C. A generalized dynamic discrete choice model for green vehicle adoption. Transp. Res. Part A Policy Pract. 2018, 114, 288–302. [Google Scholar] [CrossRef]
  29. Chowdhury, M.; Salam, K.; Tay, R. Consumer preferences and policy implications for the green car market. Mark. Intell. Plan. 2016, 34, 810–827. [Google Scholar] [CrossRef]
  30. Huang, Y.; Qian, L. Consumer preferences for electric vehicles in lower tier cities of China: Evidences from south Jiangsu region. Transp. Res. Part D Transp. Environ. 2018, 63, 482–497. [Google Scholar] [CrossRef]
  31. Lopes, M.M.; Moura, F.; Martinez, L.M. A rule-based approach for determining the plausible universe of electric vehicle buyers in the Lisbon Metropolitan Area. Transp. Res. Part A Policy Pract. 2014, 59, 22–36. [Google Scholar] [CrossRef]
  32. Degirmenci, K.; Breitner, M.H. Consumer purchase intentions for electric vehicles: Is green more important than price and range? Transp. Res. Part D Transp. Environ. 2017, 51, 250–260. [Google Scholar] [CrossRef] [Green Version]
  33. Lai, I.; Liu, Y.; Sun, X.; Zhang, H.; Xu, W. Factors Influencing the Behavioural Intention towards Full Electric Vehicles: An Empirical Study in Macau. Sustainability 2015, 7, 12564–12585. [Google Scholar] [CrossRef] [Green Version]
  34. Sang, Y.; Bekhet, H.A. Modelling electric vehicle usage intentions: An empirical study in Malaysia. J. Clean. Prod. 2015, 92, 75–83. [Google Scholar] [CrossRef]
  35. Li, Q.W.; Long, R.Y.; Chen, H.; Geng, J.C. Low Purchase Willingness for Battery Electric Vehicles: Analysis and Simulation Based on the Fault Tree Model. Sustainability 2017, 9, 809. [Google Scholar]
  36. Matthews, L.; Lynes, J.; Riemer, M.; Del Matto, T.; Cloet, N. Do we have a car for you? Encouraging the uptake of electric vehicles at point of sale. Energy Policy 2017, 100, 79–88. [Google Scholar] [CrossRef]
  37. Higgins, C.D.; Mohamed, M.; Ferguson, M.R. Size matters: How vehicle body type affects consumer preferences for electric vehicles. Transp. Res. Part A Policy Pract. 2017, 100, 182–201. [Google Scholar] [CrossRef]
  38. Du, H.; Liu, D.; Sovacool, B.K.; Wang, Y.; Ma, S.; Li, R.Y.M. Who buys New Energy Vehicles in China? Assessing social-psychological predictors of purchasing awareness, intention, and policy. Transp. Res. Part F Traffic Psychol. Behav. 2018, 58, 56–69. [Google Scholar] [CrossRef] [Green Version]
  39. Wang, S.; Li, J.; Zhao, D. The impact of policy measures on consumer intention to adopt electric vehicles: Evidence from China. Transp. Res. Part A Policy Pract. 2017, 105, 14–26. [Google Scholar] [CrossRef]
  40. Shafiei, E.; Davidsdottir, B.; Fazeli, R.; Leaver, J.; Stefansson, H.; Asgeirsson, E.I. Macroeconomic effects of fiscal incentives to promote electric vehicles in Iceland: Implications for government and consumer costs. Energy Policy 2018, 114, 431–443. [Google Scholar] [CrossRef]
  41. Bjerkan, K.Y.; Nørbech, T.E.; Nordtømme, M.E. Incentives for promoting Battery Electric Vehicle (BEV) adoption in Norway. Transp. Res. Part D Transp. Environ. 2016, 43, 169–180. [Google Scholar] [CrossRef] [Green Version]
  42. Zhang, X.; Bai, X.; Shang, J. Is subsidized electric vehicles adoption sustainable: Consumers’ perceptions and motivation toward incentive policies, environmental benefits, and risks. J. Clean. Prod. 2018, 192, 71–79. [Google Scholar] [CrossRef]
  43. Zhang, X.; Wang, K.; Hao, Y.; Fan, J.; Wei, Y. The impact of government policy on preference for NEVs: The evidence from China. Energy Policy 2013, 61, 382–393. [Google Scholar] [CrossRef]
  44. Carlucci, F.; Cirà, A.; Lanza, G. Hybrid Electric Vehicles: Some Theoretical Considerations on Consumption Behaviour. Sustainability 2018, 10, 1302. [Google Scholar] [CrossRef] [Green Version]
  45. Farley, J.U.; Ring, L.W. An Empirical Test of the Howard-Sheth Model of Buyer Behavior. J. Mark. Res. 1970, 7, 427–438. [Google Scholar] [CrossRef]
  46. Lutz, R.J.; Resek, R.W. More on Testing the Howard-Sheth Model of Buyer Behavior. J. Mark. Res. 1972, 9, 344–345. [Google Scholar] [CrossRef]
  47. Hunt, S.D.; Pappas, J.L. A Crucial Test for the Howard-Sheth Model of Buyer Behavior. J. Mark. Res. 1972, 9, 346–348. [Google Scholar] [CrossRef]
  48. Barriball, K.L.; While, A. Collecting data using a semi-structured interview: A discussion paper. J. Adv. Nurs. 1994, 19, 328–335. [Google Scholar] [CrossRef]
  49. Sovacool, B.K.; Kester, J.; Noel, L.; de Rubens, G.Z. The demographics of decarbonizing transport: The influence of gender, education, occupation, age, and household size on electric mobility preferences in the Nordic region. Glob. Environ. Chang. 2018, 52, 86–100. [Google Scholar] [CrossRef]
  50. Westin, K.; Jansson, J.; Nordlund, A. The importance of socio-demographic characteristics, geographic setting, and attitudes for adoption of electric vehicles in Sweden. Travel Behav. Soc. 2018, 13, 118–127. [Google Scholar] [CrossRef]
  51. Zhang, Y.; Yu, Y.; Zou, B. Analyzing public awareness and acceptance of alternative fuel vehicles in China: The case of EV. Energy Policy 2011, 39, 7015–7024. [Google Scholar] [CrossRef]
  52. Zhuge, C.; Shao, C. Agent-based modelling of locating public transport facilities for conventional and electric vehicles. Netw. Spat. Econ. 2018, 18, 875–908. [Google Scholar] [CrossRef]
  53. Coffman, M.; Bernstein, P.; Wee, S. Electric vehicles revisited: A review of factors that affect adoption. Transp. Rev. 2017, 37, 79–93. [Google Scholar] [CrossRef]
  54. Egbue, O.; Long, S. Barriers to widespread adoption of electric vehicles: An analysis of consumer attitudes and perceptions. Energy Policy 2012, 48, 717–729. [Google Scholar] [CrossRef]
  55. Lim, M.K.; Mak, H.Y.; Rong, Y. Toward mass adoption of electric vehicles: Impact of the range and resale anxieties. Manuf. Serv. Oper. Manag. 2014, 17, 101–119. [Google Scholar] [CrossRef]
  56. Adepetu, A.; Keshav, S. The relative importance of price and driving range on electric vehicle adoption: Los Angeles case study. Transportation 2017, 44, 353–373. [Google Scholar] [CrossRef]
  57. Axsen, J.; Orlebar, C.; Skippon, S. Social influence and consumer preference formation for pro-environmental technology: The case of a UK workplace electric-vehicle study. Ecol. Econ. 2013, 95, 96–107. [Google Scholar] [CrossRef]
  58. Pettifor, H.; Wilson, C.; Axsen, J.; Abrahamse, W.; Anable, J. Social influence in the global diffusion of alternative fuel vehicles—A meta-analysis. J. Transp. Geogr. 2017, 62, 247–261. [Google Scholar] [CrossRef]
  59. Zhuge, C.; Shao, C.; Wei, B. An agent-based spatial urban social network generator: A case study of Beijing, China. J. Comp. Sci. 2018, 29, 46–58. [Google Scholar] [CrossRef]
  60. Franke, T.; Krems, J.F. What drives range preferences in electric vehicle users? Transp. Policy 2013, 30, 56–62. [Google Scholar] [CrossRef]
  61. Zhuge, C.; Shao, C.; Li, X. A comparative study of en route refuelling behaviours of conventional and electric vehicles in Beijing, China. Sustainability 2019, 11, 3869. [Google Scholar] [CrossRef] [Green Version]
  62. Helveston, J.P.; Liu, Y.; Feit, E.M.; Fuchs, E.; Klampfl, E.; Michalek, J.J. Will subsidies drive electric vehicle adoption? Measuring consumer preferences in the US and China. Transp. Res. Part A Policy Pract. 2015, 73, 96–112. [Google Scholar] [CrossRef] [Green Version]
  63. Zhang, X.; Bai, X.; Zhong, H. Electric vehicle adoption in license plate-controlled big cities: Evidence from Beijing. J. Clean. Prod. 2018, 202, 191–196. [Google Scholar] [CrossRef]
  64. Macal, C.M.; North, M.J. Tutorial on agent-based modelling and simulation. J. Simul. 2010, 4, 151–162. [Google Scholar] [CrossRef]
  65. Farmer, J.D.; Foley, D. The economy needs agent-based modelling. Nature 2009, 460, 685–686. [Google Scholar] [CrossRef] [PubMed]
  66. Zhuge, C.; Shao, C.; Gao, J.; Dong, C.; Zhang, H. Agent-based joint model of residential location choice and real estate price for land use and transport model. Comput. Environ. Urban Syst. 2016, 57, 93–105. [Google Scholar] [CrossRef]
  67. Horni, A.; Nagel, K. The Multi-Agent Transport Simulation MATSim; Axhausen, K.W., Ed.; Ubiquity Press: London, UK, 2016; pp. 1–618. [Google Scholar]
  68. Zhuge, C.; Shao, C.; Yang, X. Agent-and Activity-based Large-Scale Simulation of Enroute Travel, Enroute Refuelling and Parking Behaviours in Beijing, China. J. Comput. Sci. 2019, 38, 101046. [Google Scholar] [CrossRef]
  69. Eppstein, M.J.; Grover, D.K.; Marshall, J.S.; Rizzo, D.M. An agent-based model to study market penetration of plug-in hybrid electric vehicles. Energy Policy 2011, 39, 3789–3802. [Google Scholar] [CrossRef]
Figure 1. The four stages of purchasing a battery electric vehicle (BEV).
Sustainability 11 06967 g001
Figure 2. The method used to quantify the influence of different policies through “what-if” scenario analysis.
Sustainability 11 06967 g002
Figure 3. Sociodemographic characteristics of participants. (a) Gender; (b) education level; (c) age; (d) residential location; (e) occupation; (f) household income.
Sustainability 11 06967 g003aSustainability 11 06967 g003b
Figure 4. Factors affecting the decision-making of consumers on vehicle purchase.
Sustainability 11 06967 g004
Figure 5. The influence of different EV-related policies on the numbers of EV purchasers and EV purchase permits.
Sustainability 11 06967 g005
Figure 6. Vehicle Models expected by EV Purchasers.
Sustainability 11 06967 g006
Figure 7. The driving range and average daily travel distance of different vehicle models.
Sustainability 11 06967 g007
Figure 8. Comparison between CVs and BEVs in terms of energy cost.
Sustainability 11 06967 g008
Figure 9. Factors affecting consumers’ purchase decision.
Sustainability 11 06967 g009
Figure 10. The typical policy influence proportion.
Sustainability 11 06967 g010
Table 1. Description of the four stages of BEV.
StageBehavioral CharacteristicCognitive Level of BEV
Ignored and NeglectedDon’t care about BEVs, hearsay of BEV information, unclear about the current level of technology.Nonchalant about BEVs, existence of prejudice, some are even seriously questioned
Proactive AttentionProactively carry out information collection, conduct proactive counselling, learn about the relevant preferential and exemption policies, personally test drive related models.Have clear and objective understanding and insights into the technical level of BEVs
Comparison and Selection of VehiclesHave clear needs for the usage of vehicles, check the charging conditions and select the model by comparing some key indicators of the vehicles.Have relatively clear expectations and judgment of acceptable vehicle models for key indicators of vehicles
Usage EvaluationAfter purchasing a BEV, gradually generate characteristics of usage adapting to the performance of BEVs, feedback activities begin to appear such as external publicity, etc.Familiar with vehicle performance, have a clear, objective and in-depth evaluation of the model
Table 2. The monthly growth rates of applicant and impact factors according to different policies.
PolicyNumber of Applicants at Different PointsMonthly Growth Rate of New Plates (Plate/Month)Policy Impact Factor
Case 1:
Separate Plate Lottery
January 2014May 201564.760.33
(0 applicants)(1101 applicants)
Case 2:
No Traffic Restriction
--93.840.47
Case 3:
No Traffic Restriction & Separate Plate Lottery
May 2015
(1101 applicants)
October 2015
(1894 applicants)
158.600.80
Case 4:
Other Policies
--39.650.20
Table 3. Scenarios with different polices applied.
ScenarioOther PoliciesSeparate Plate LotteryNo Traffic RestrictionNumber of New Plates per Month (10 Thousands)
A0.0198
B×0.0104
C×0.0133
D××0.0039
Table 4. Forecast number of people applying for purchase permits (unit: thousands).
Scenario2015 (Base Year)20162017201820192020
A166088117145174
B163247627792
C1640607998117
D161117232834
Table 5. Forecast total number of EV purchasers from 2016 to 2020 (unit: thousands).
ScenarioActual Configuration QuotaEstimated Number of Plates between 2016–2020Forecast of the Total Number of EV Purchasers
20162017201820192020
A606060606098.4114.8
B324760606085.0101.4
C406060606091.8108.2
D111723283437.153.5
Table 6. Energy saving and emission reductions under different scenarios.
ScenarioFuel Saving
(Billion Liters)
Energy Saving
(10 Thousands tce)
NOx (t)CO (t)HC (t)
A4.0128.52181.021099.6863.36
B3.1522.44142.40865.0849.84
C3.5625.35160.90977.4956.32
D1.268.9456.72344.5719.85

