GIS-Based Livelihood Vulnerability Index Mapping of the Socioeconomy of the Pekan Community


Abstract
1. Introduction
2. Materials and Methods
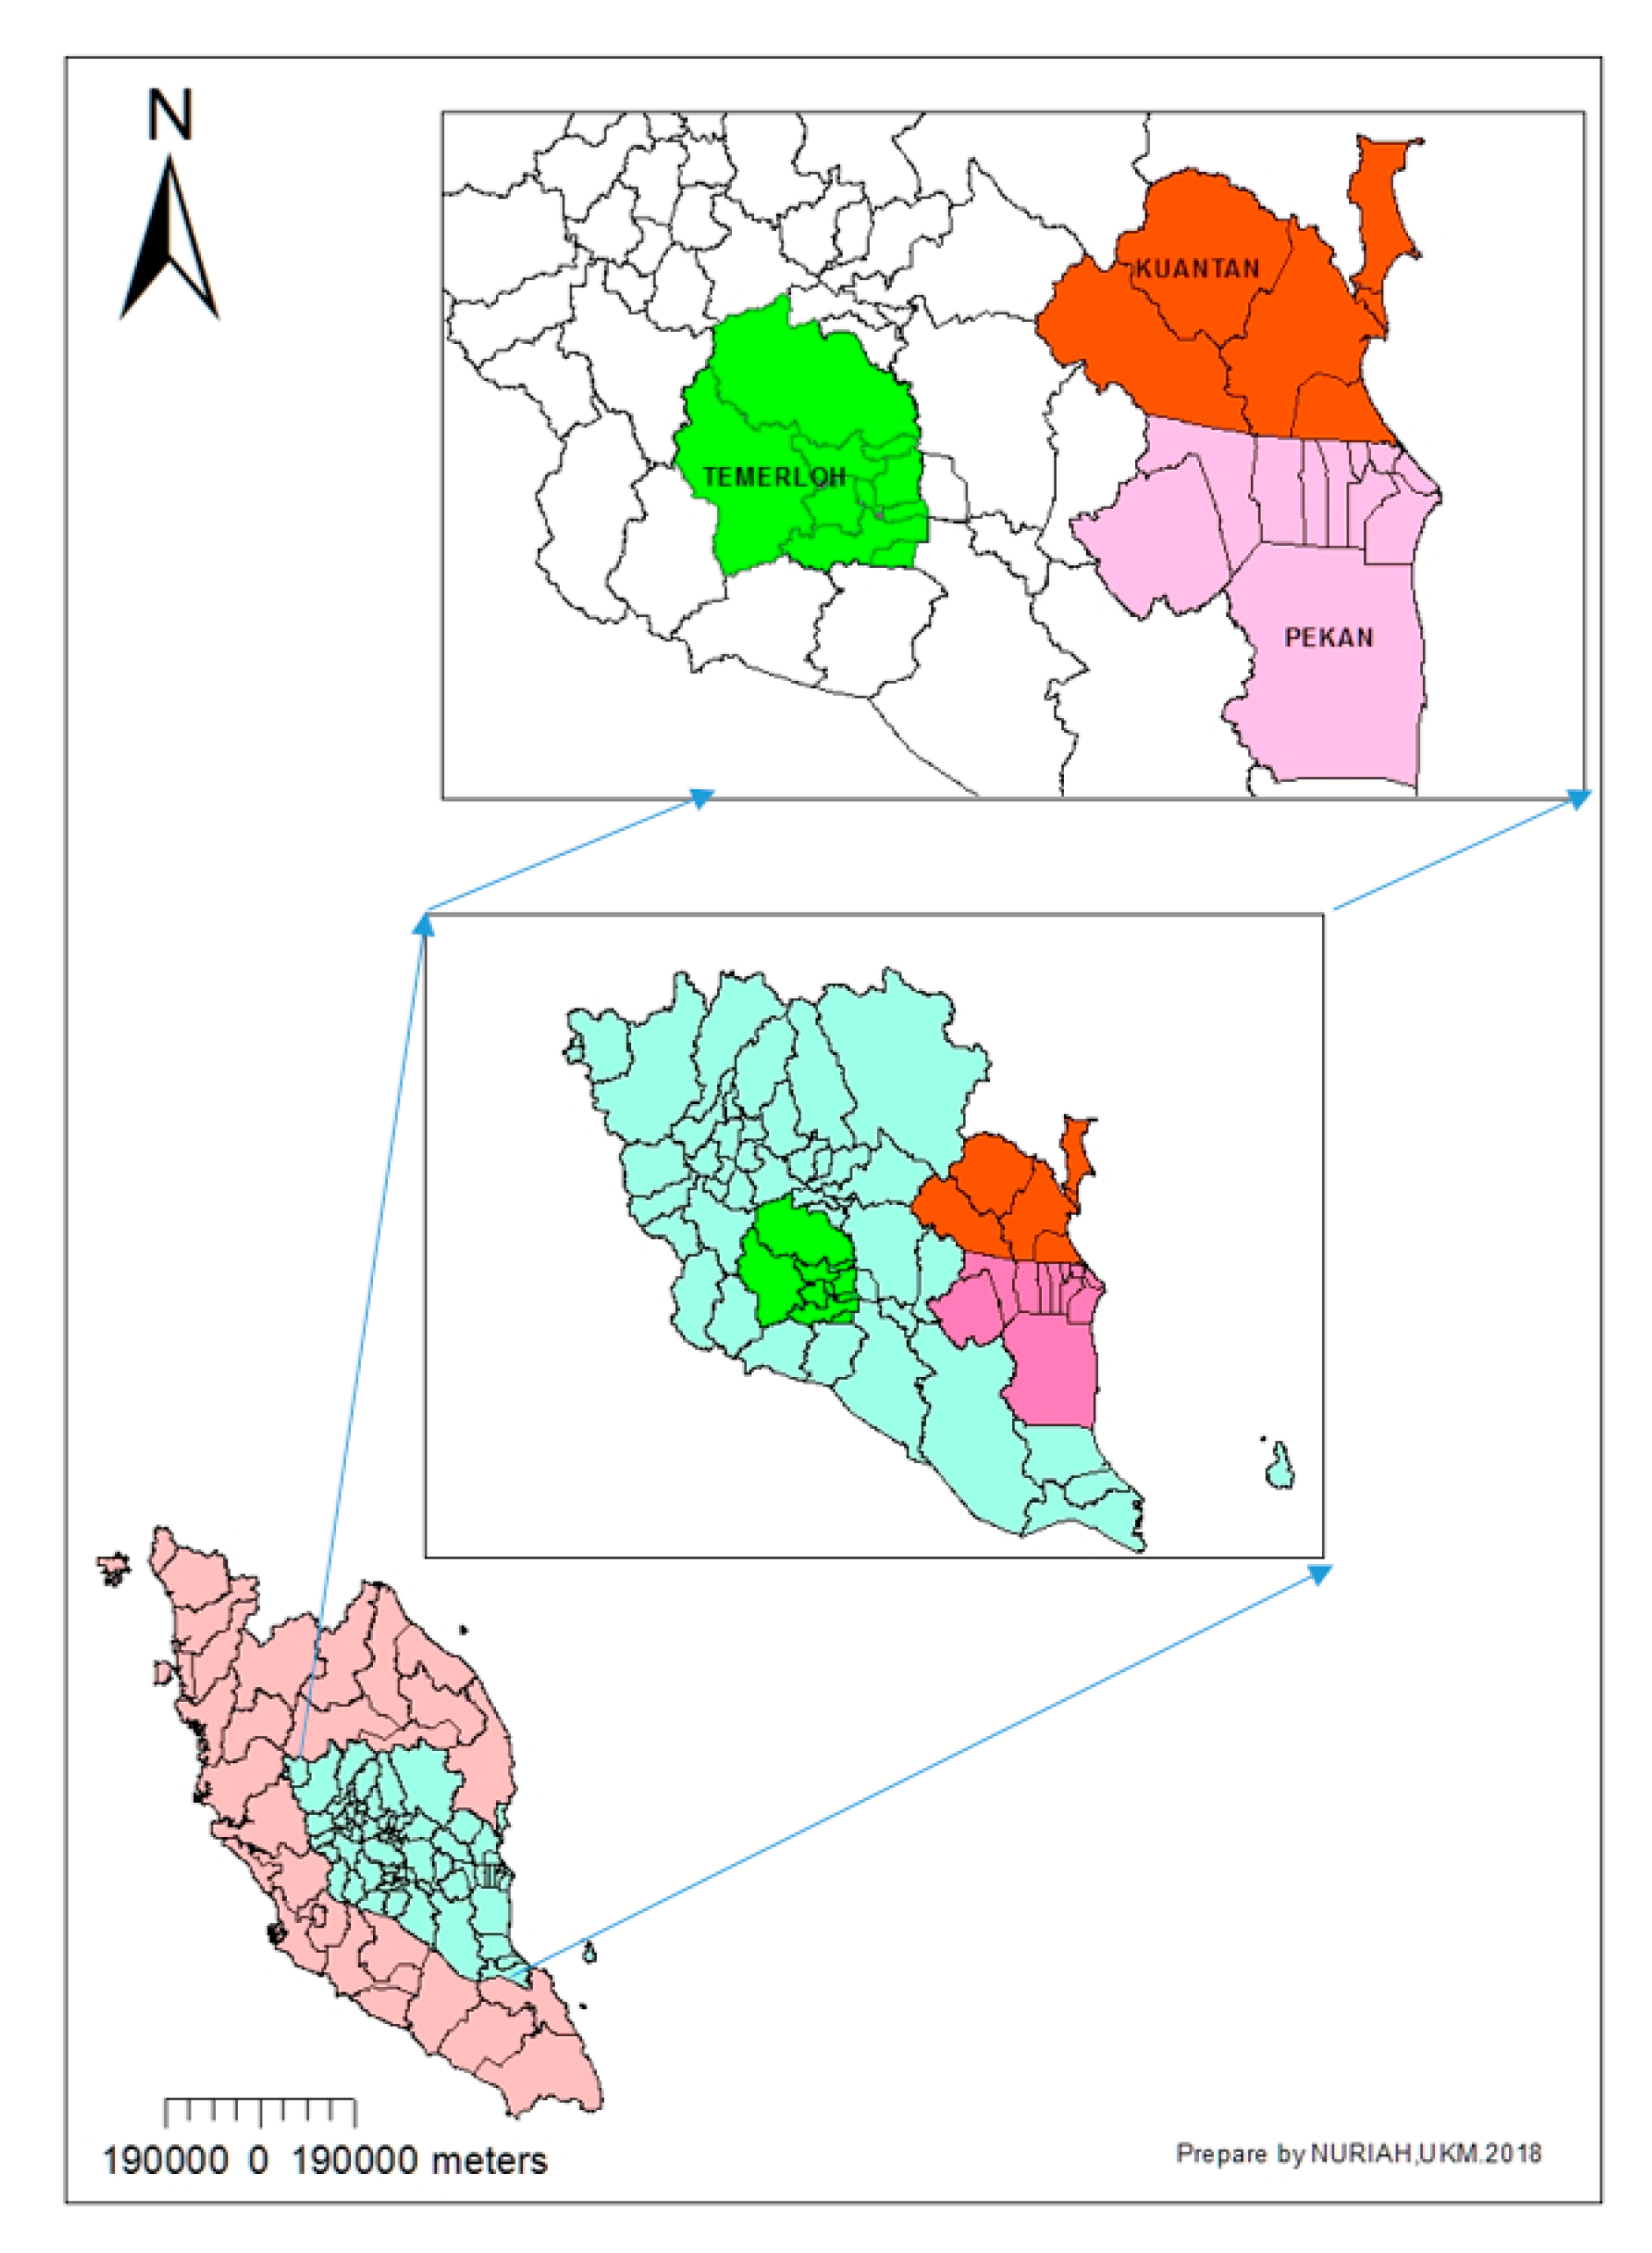
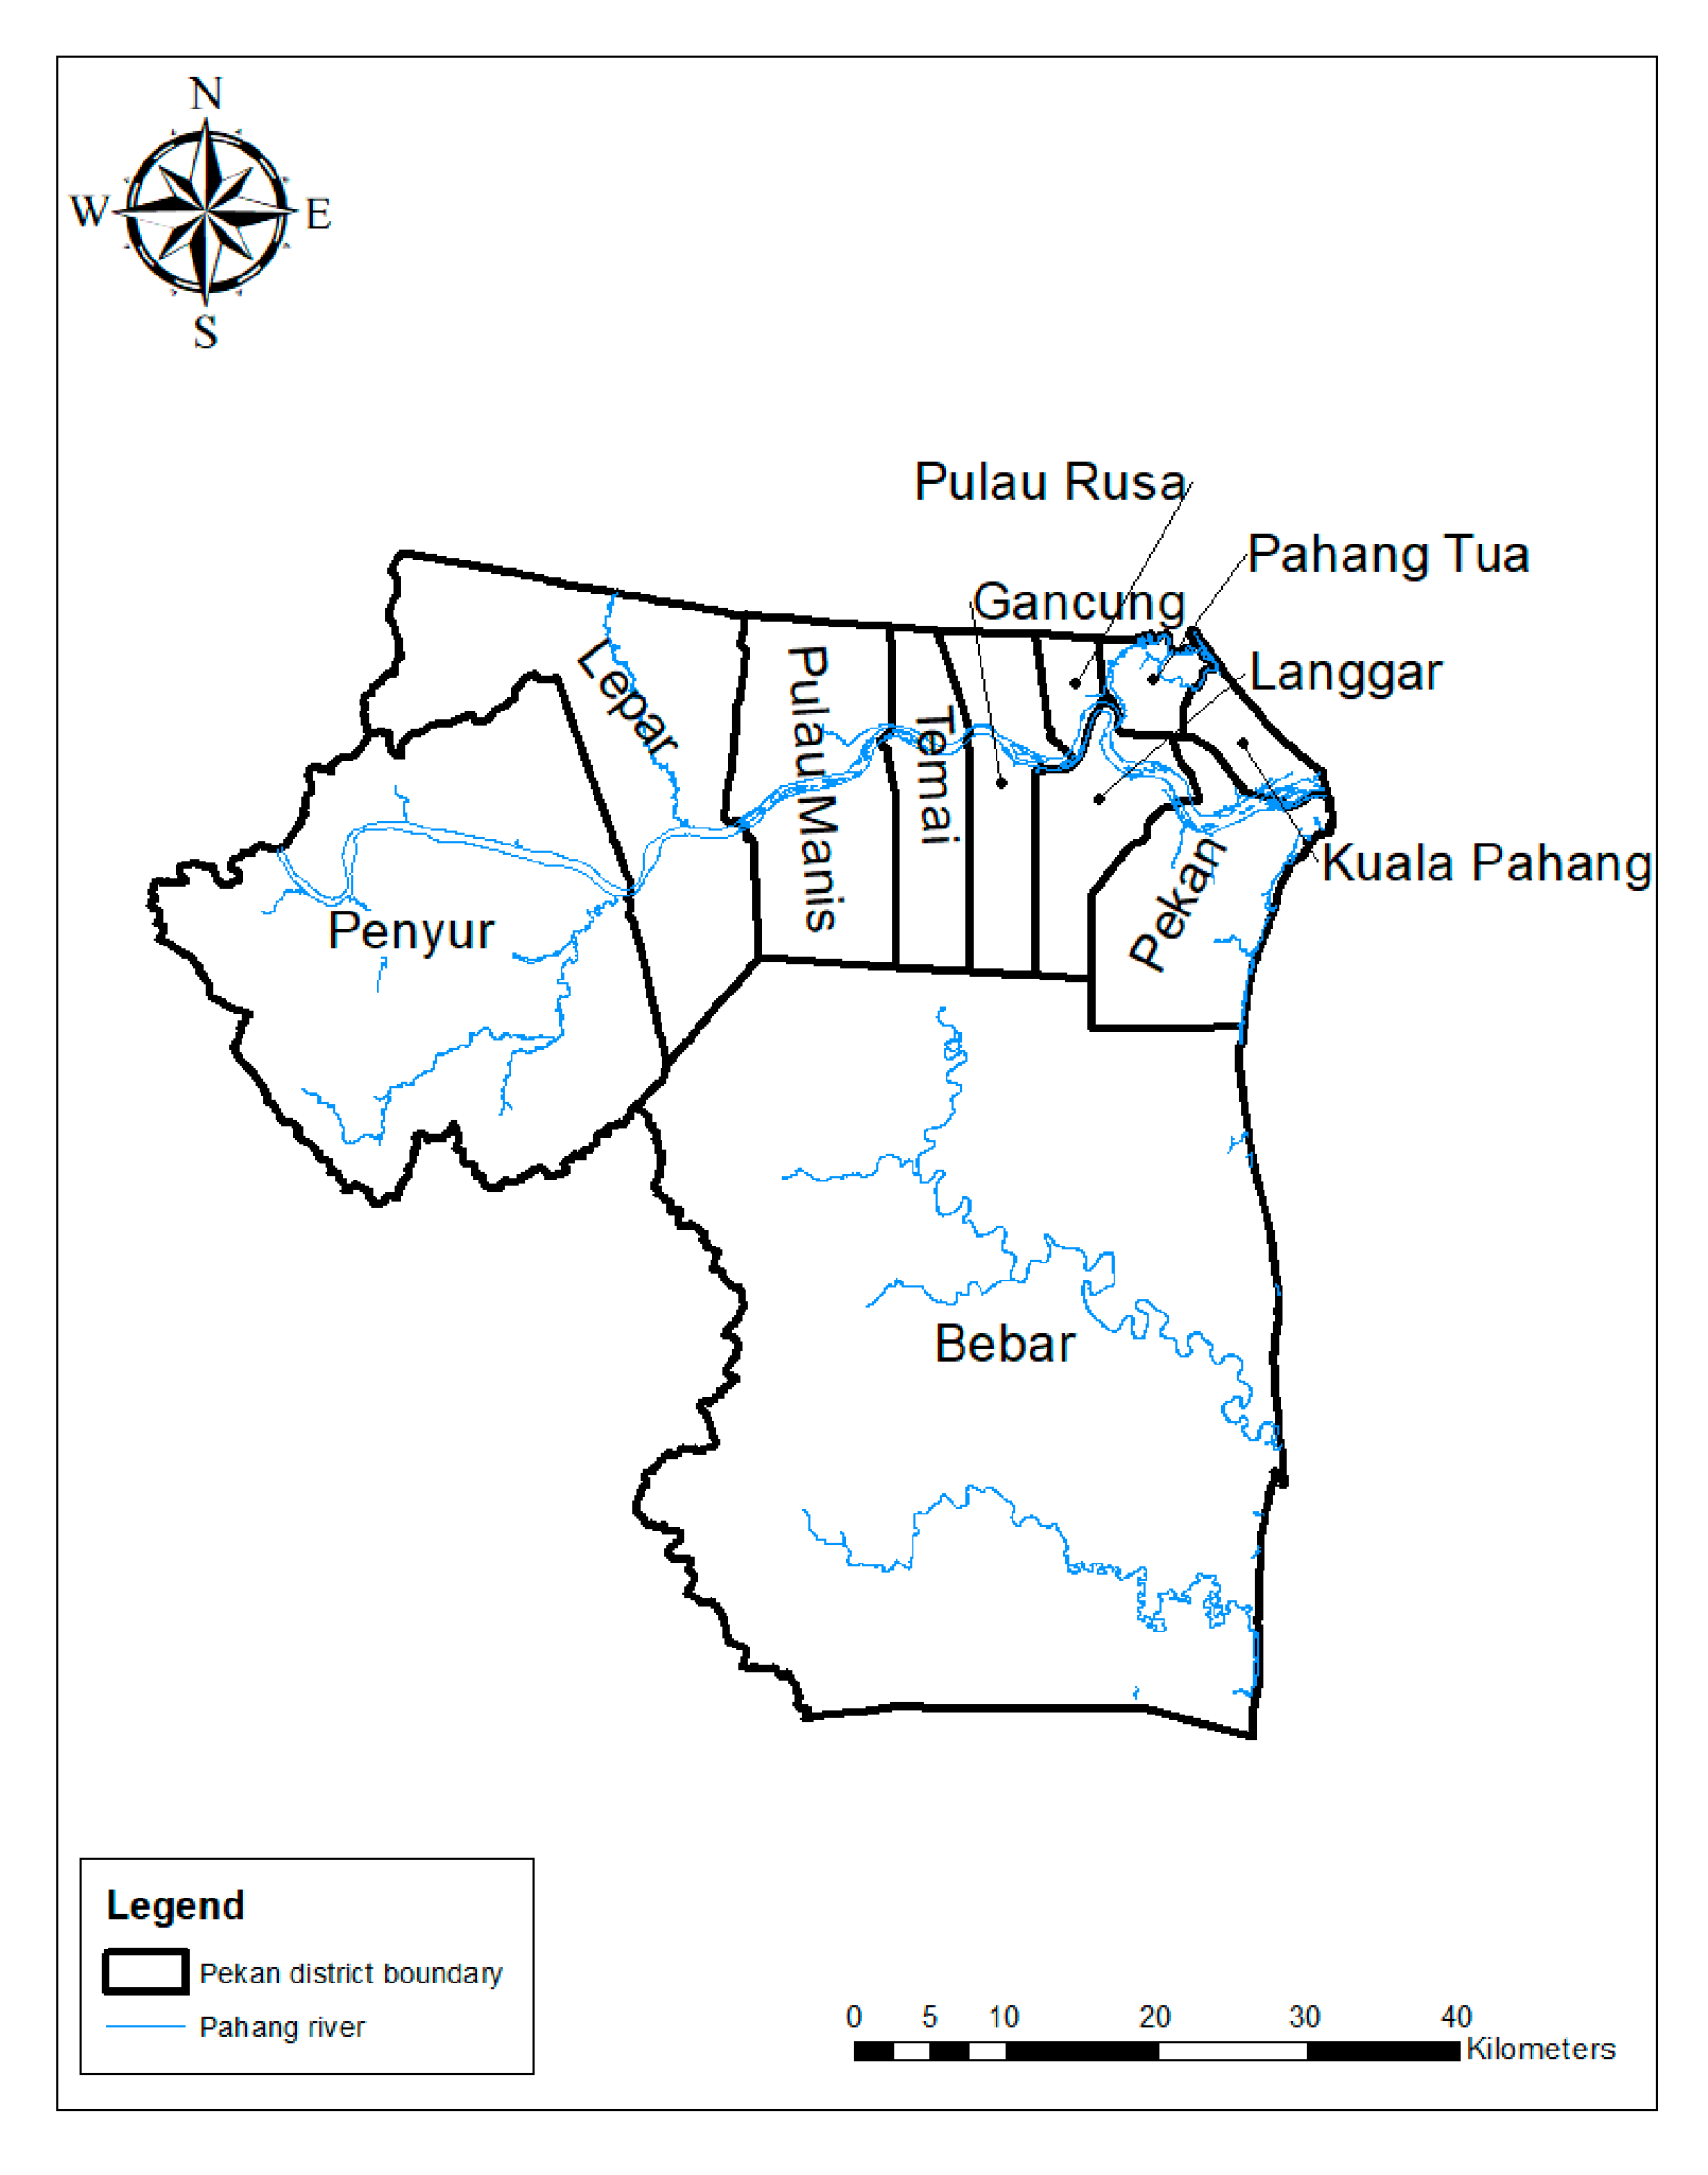
2.1. Study Area
2.2. Household Surveys
2.3. LVI Calculation
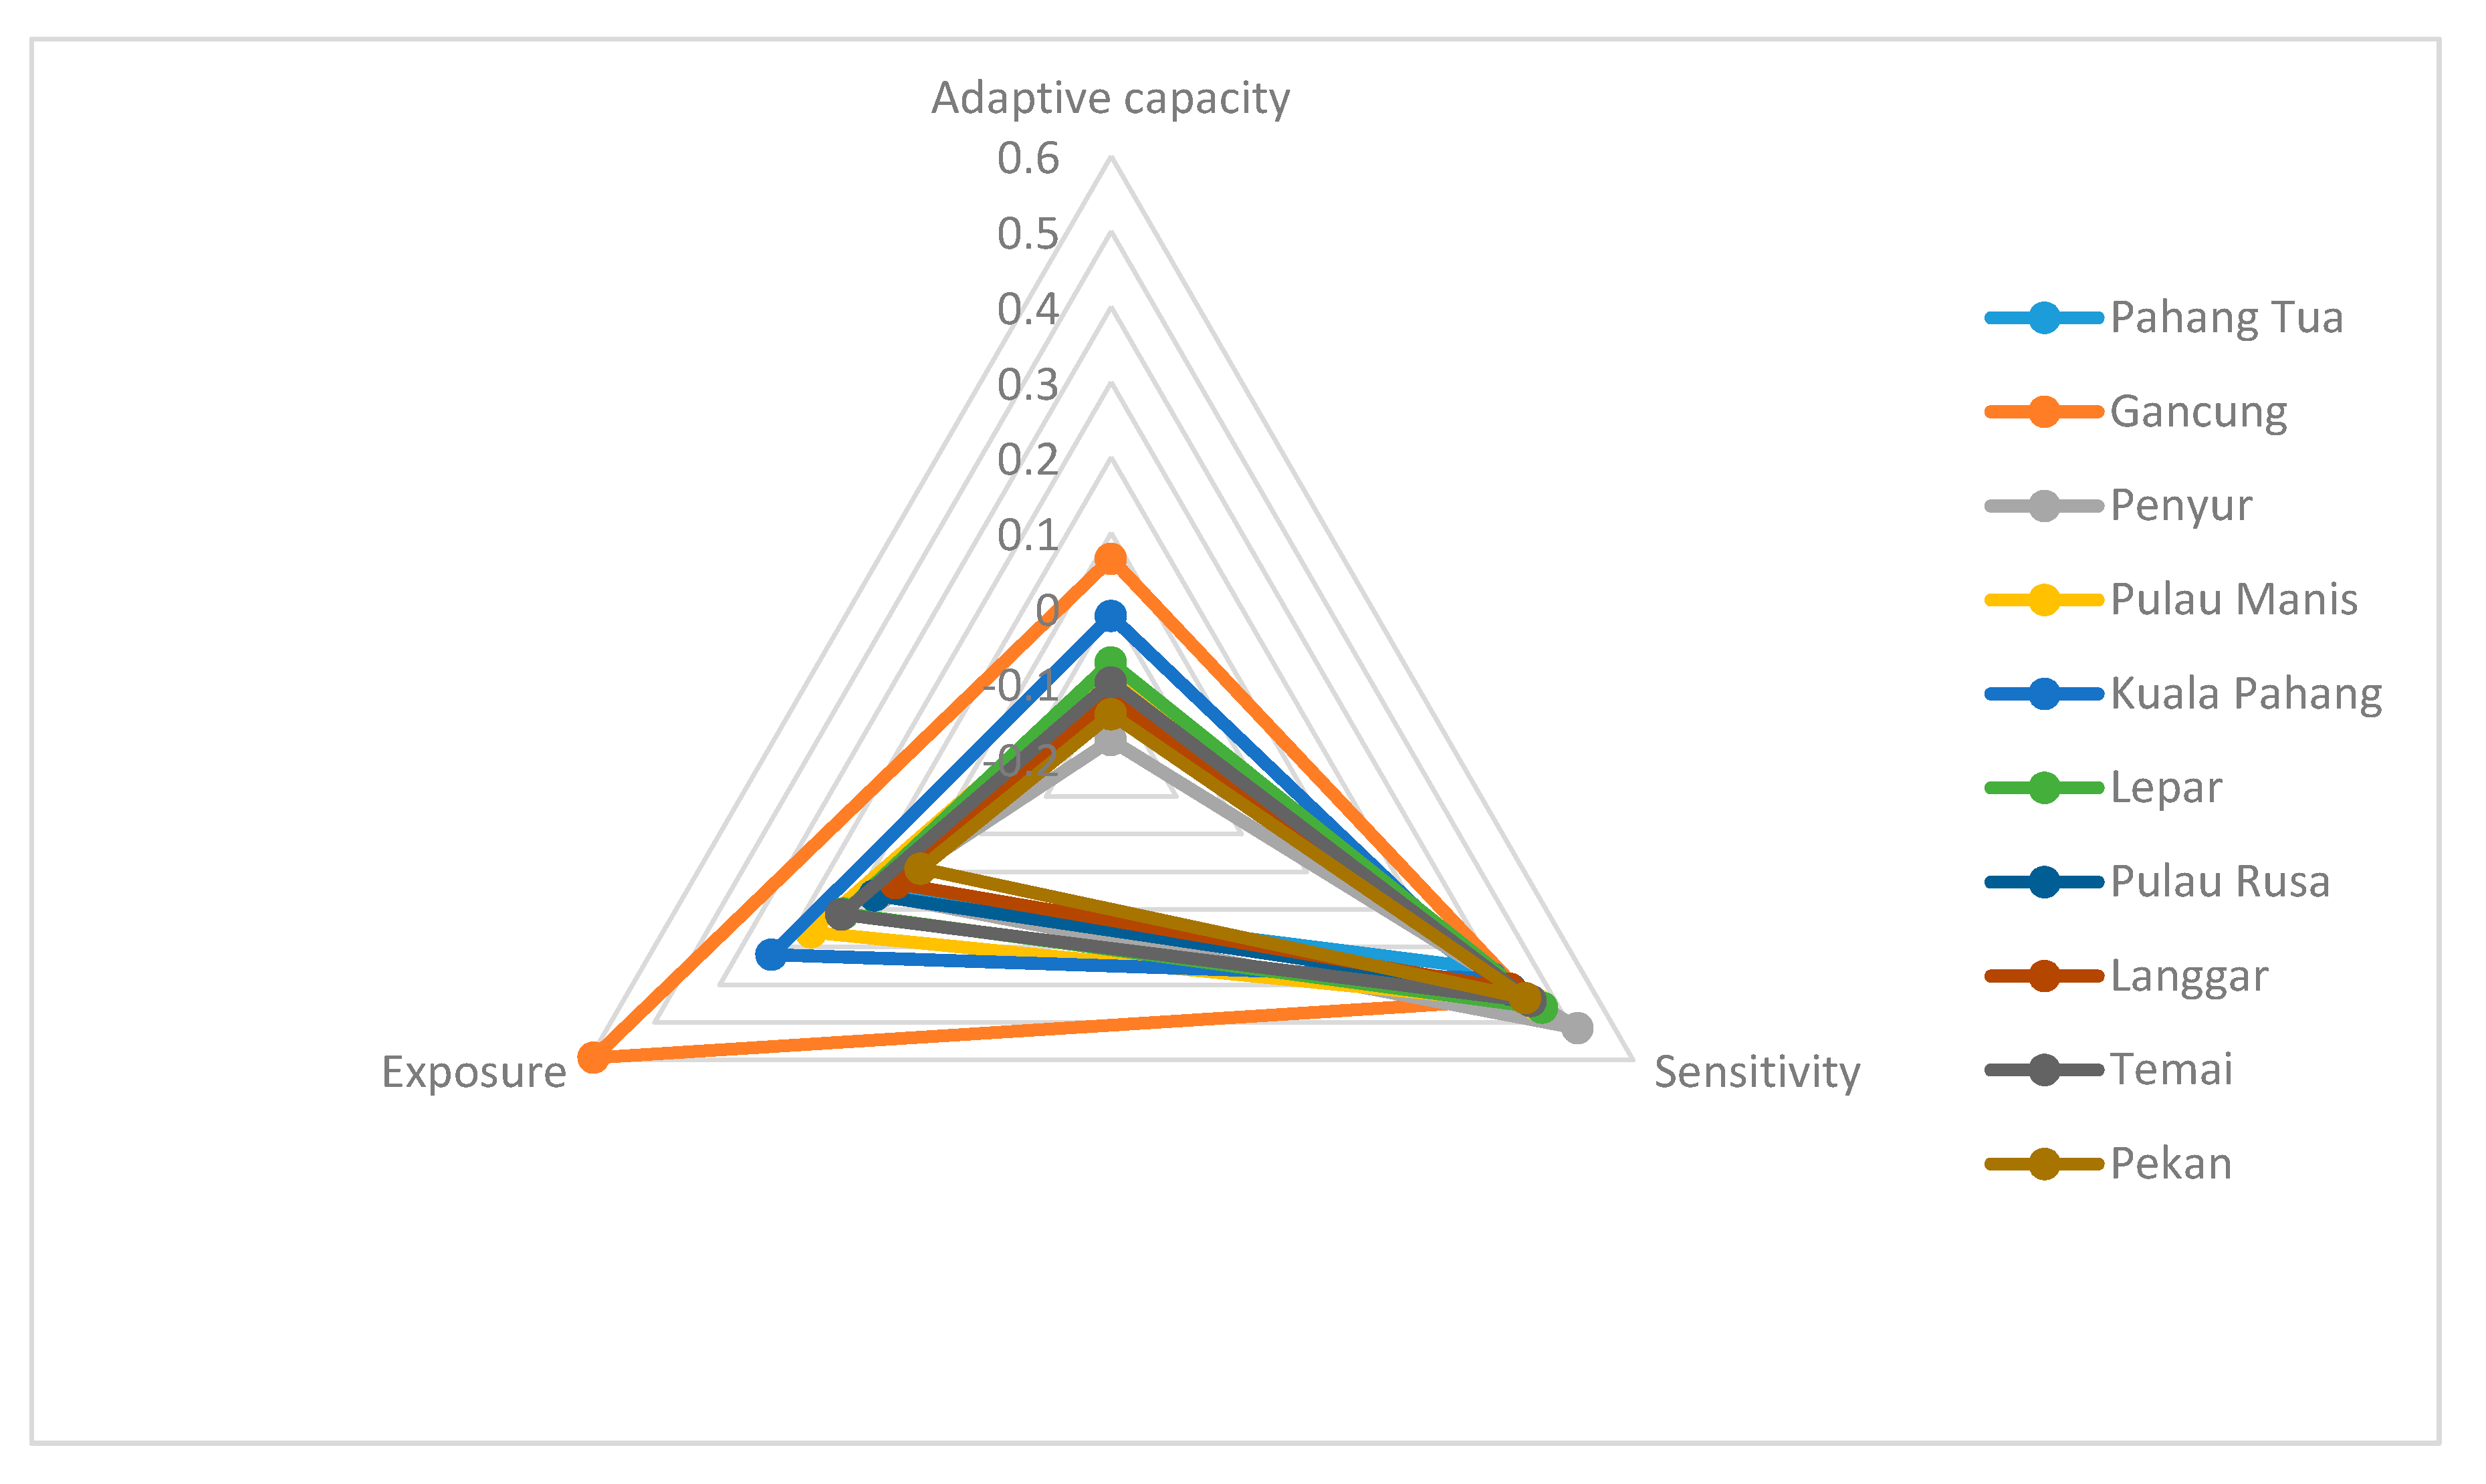
2.4. Incorporating the LVI–IPCC Framework Approach
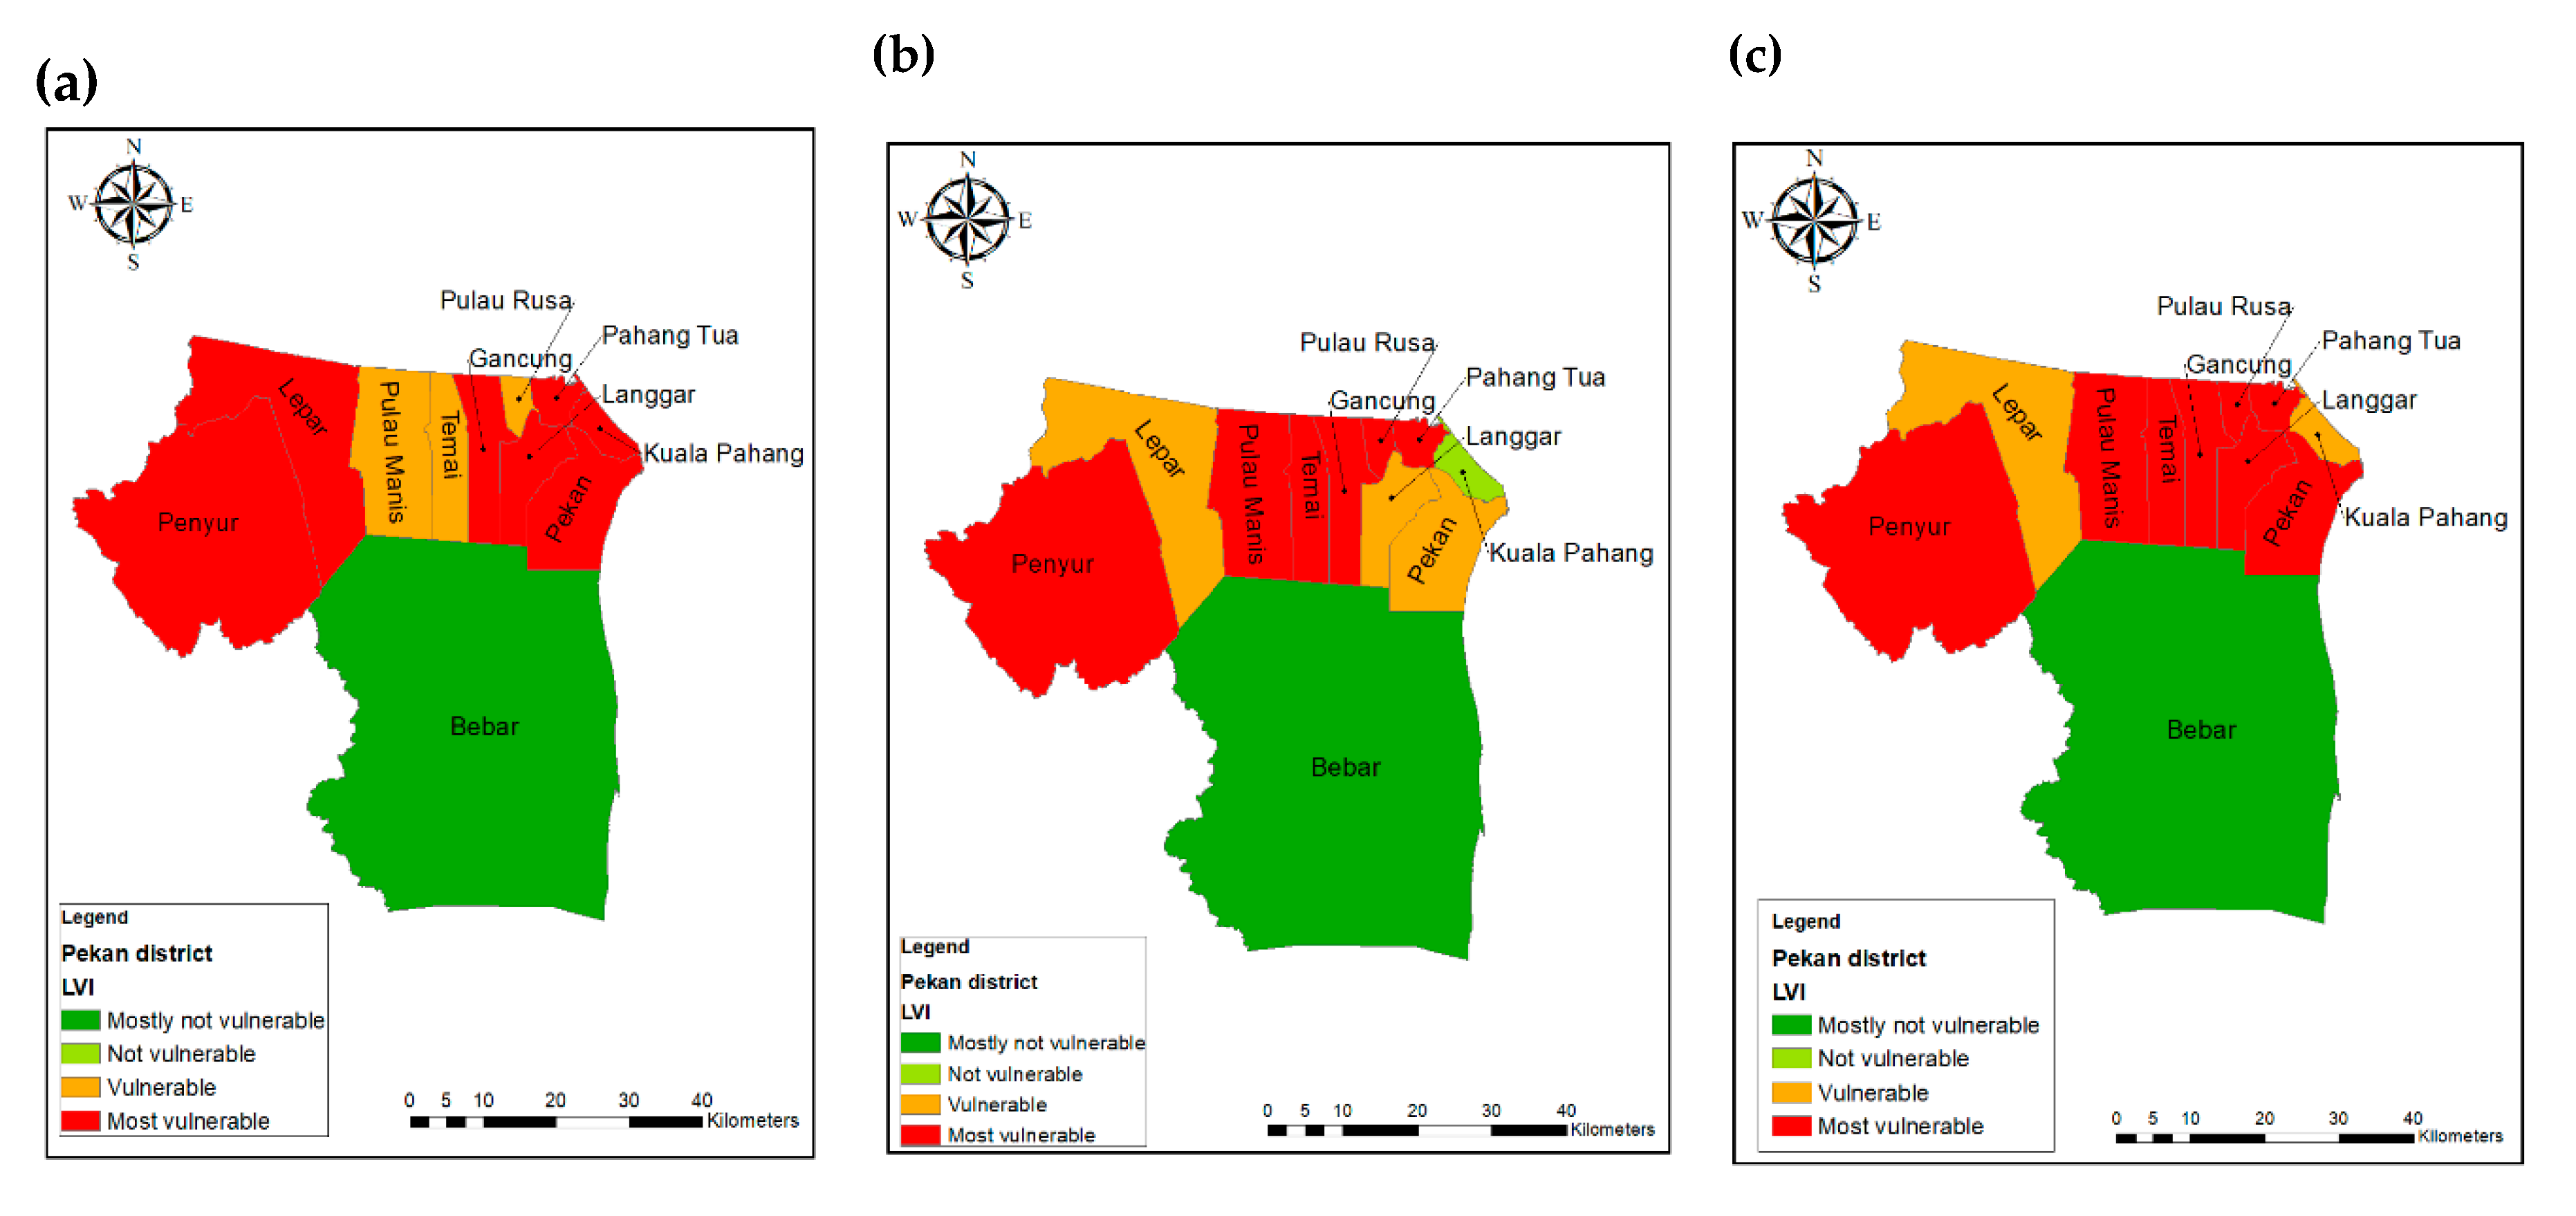
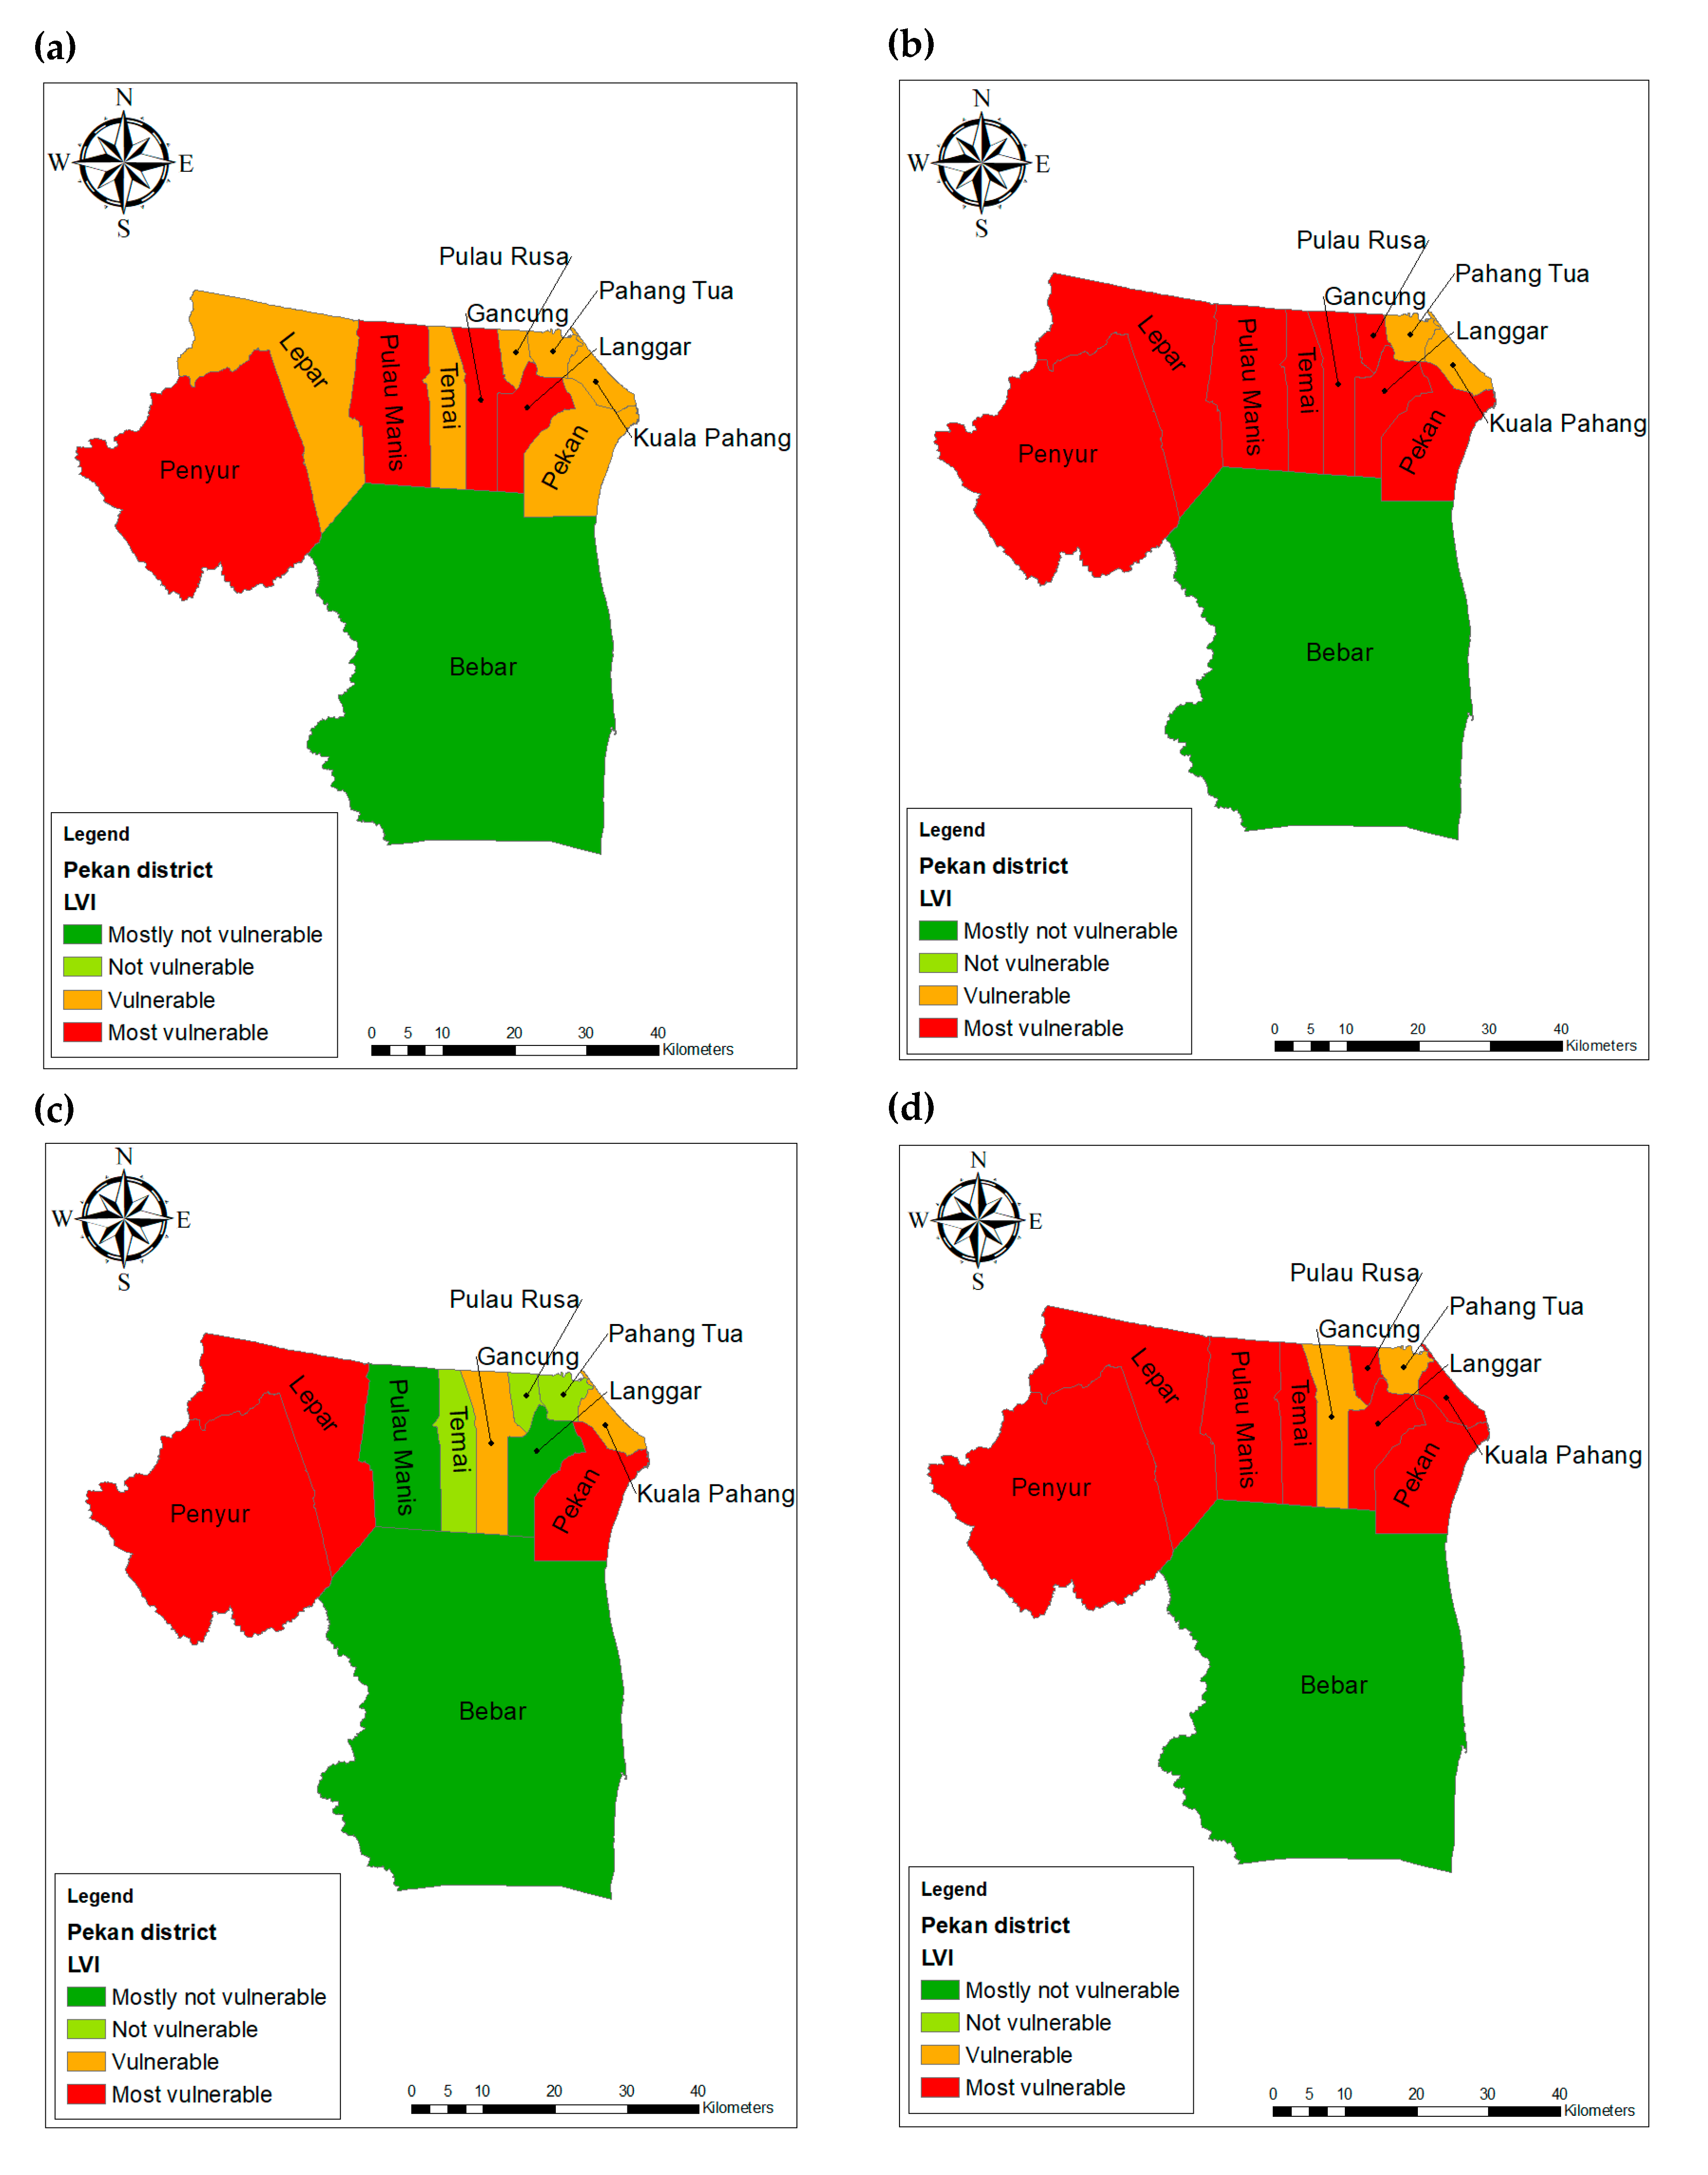
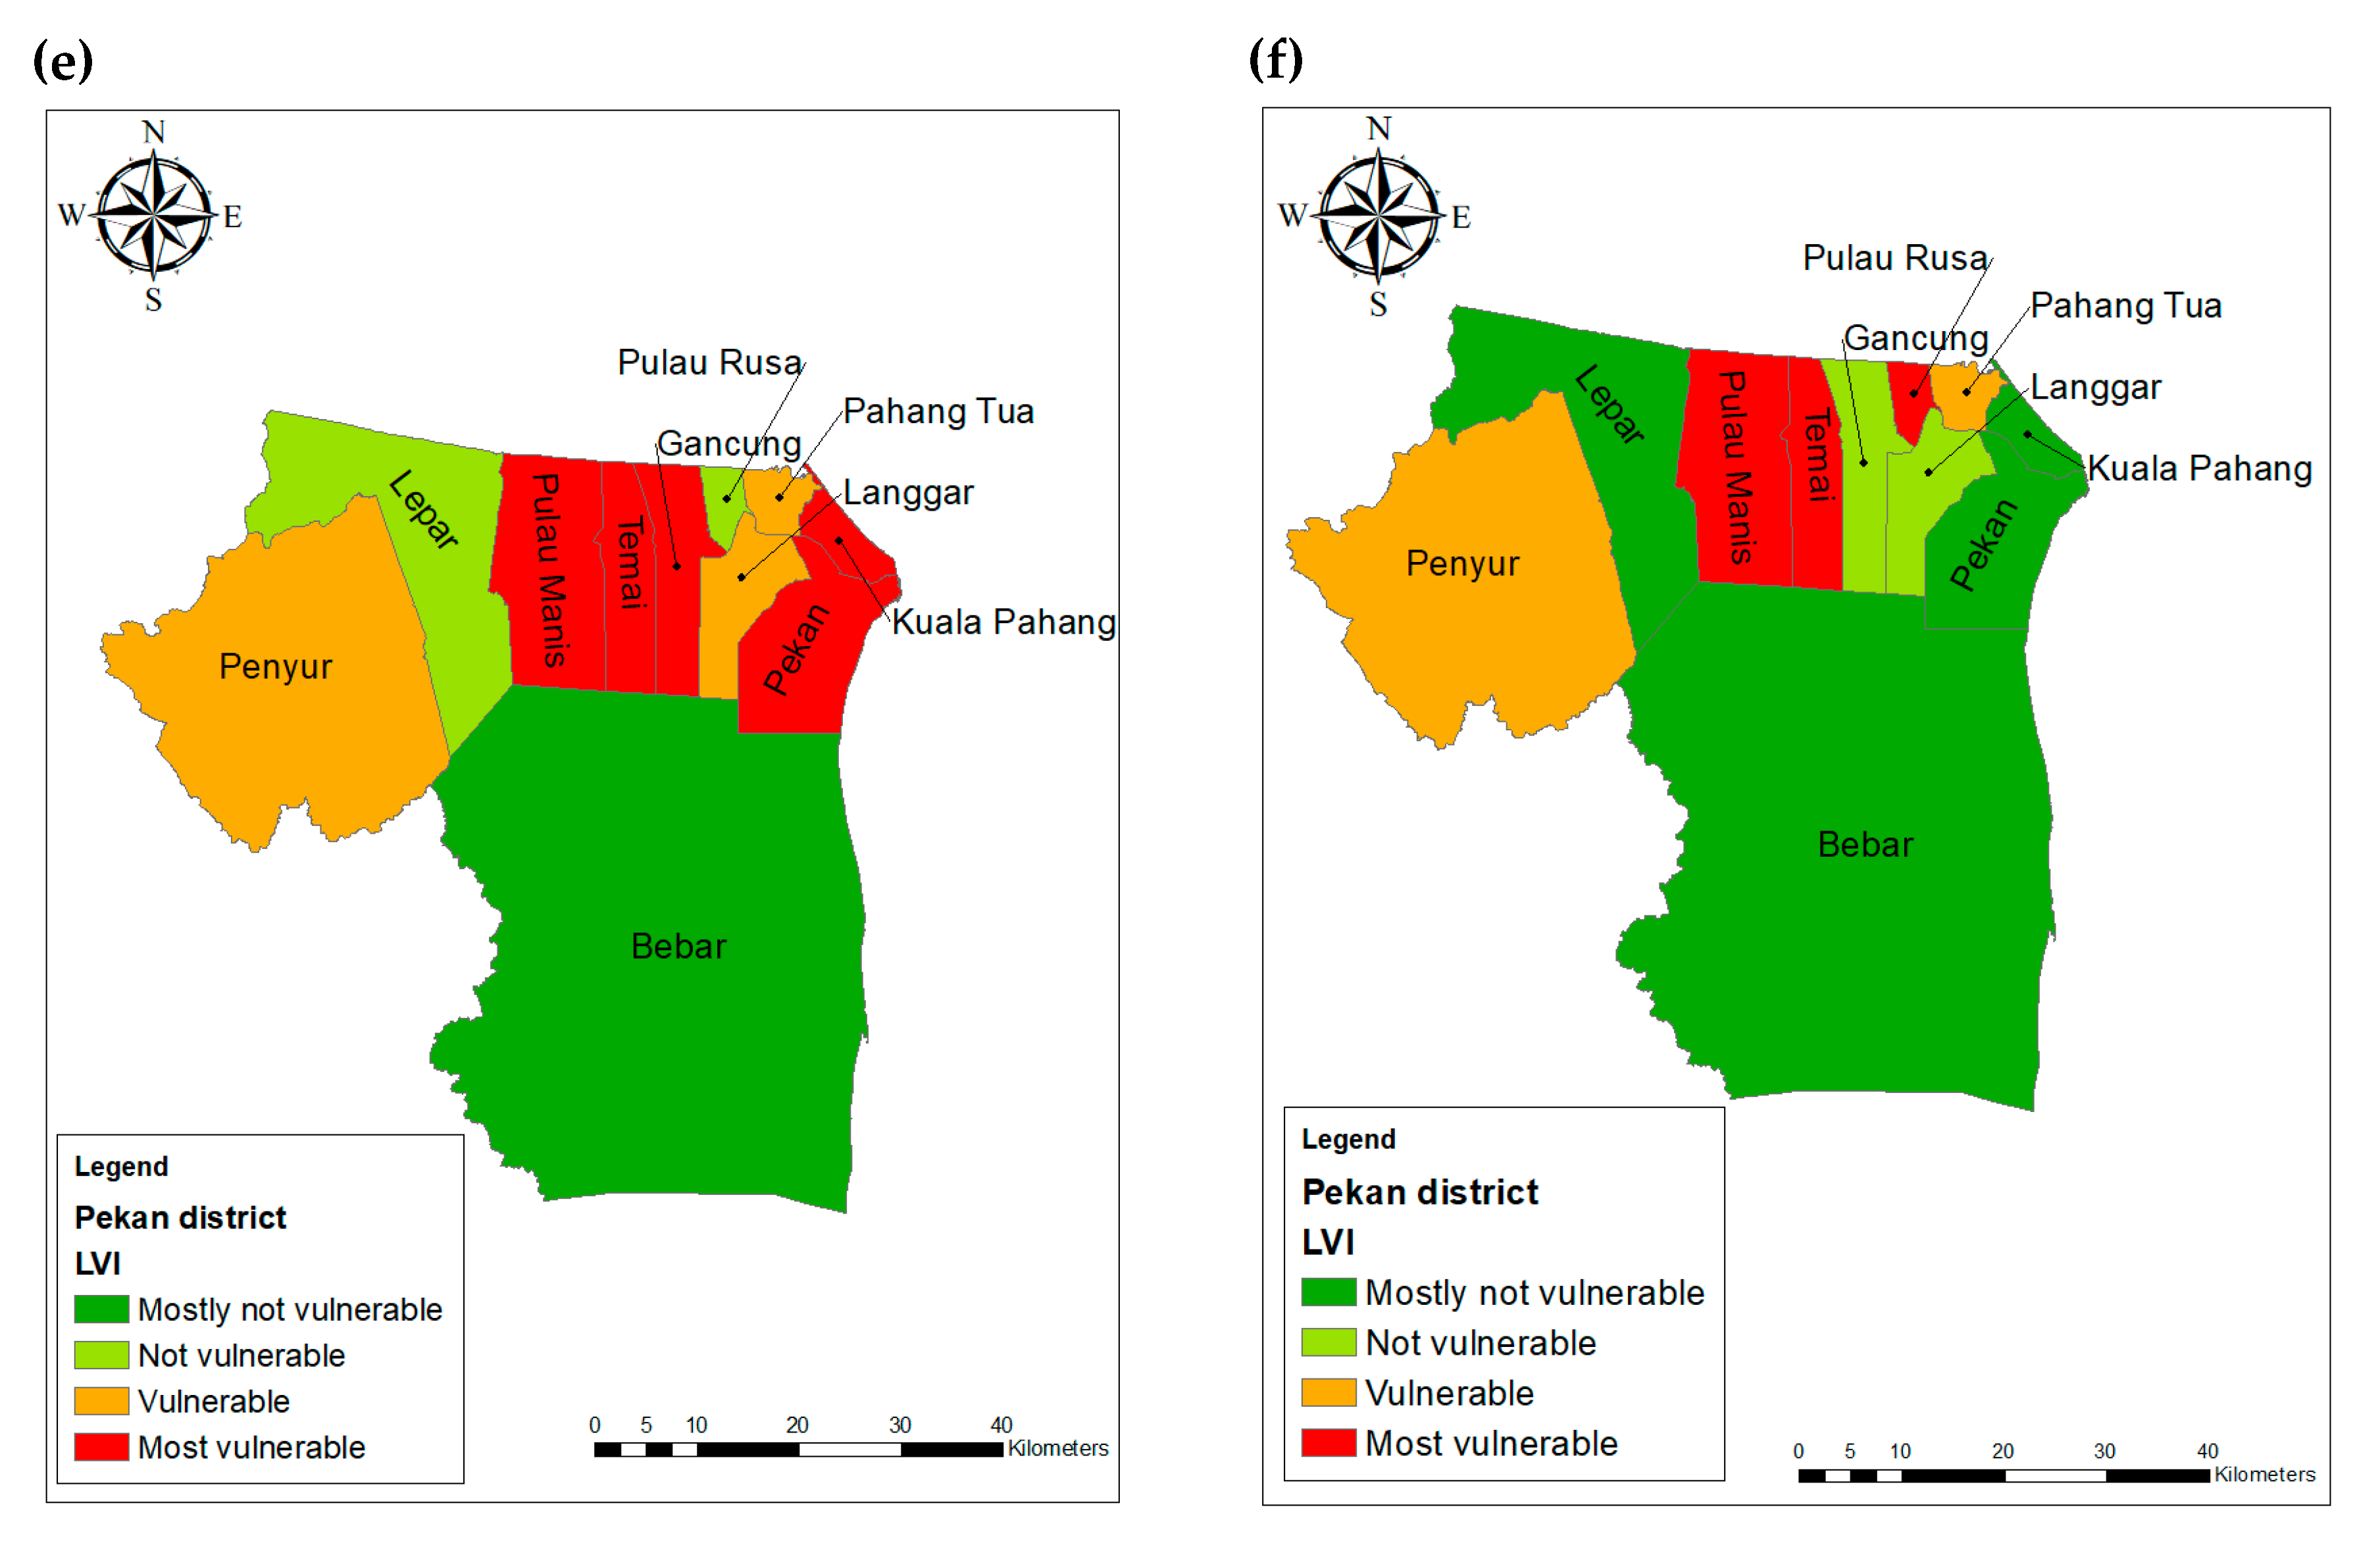
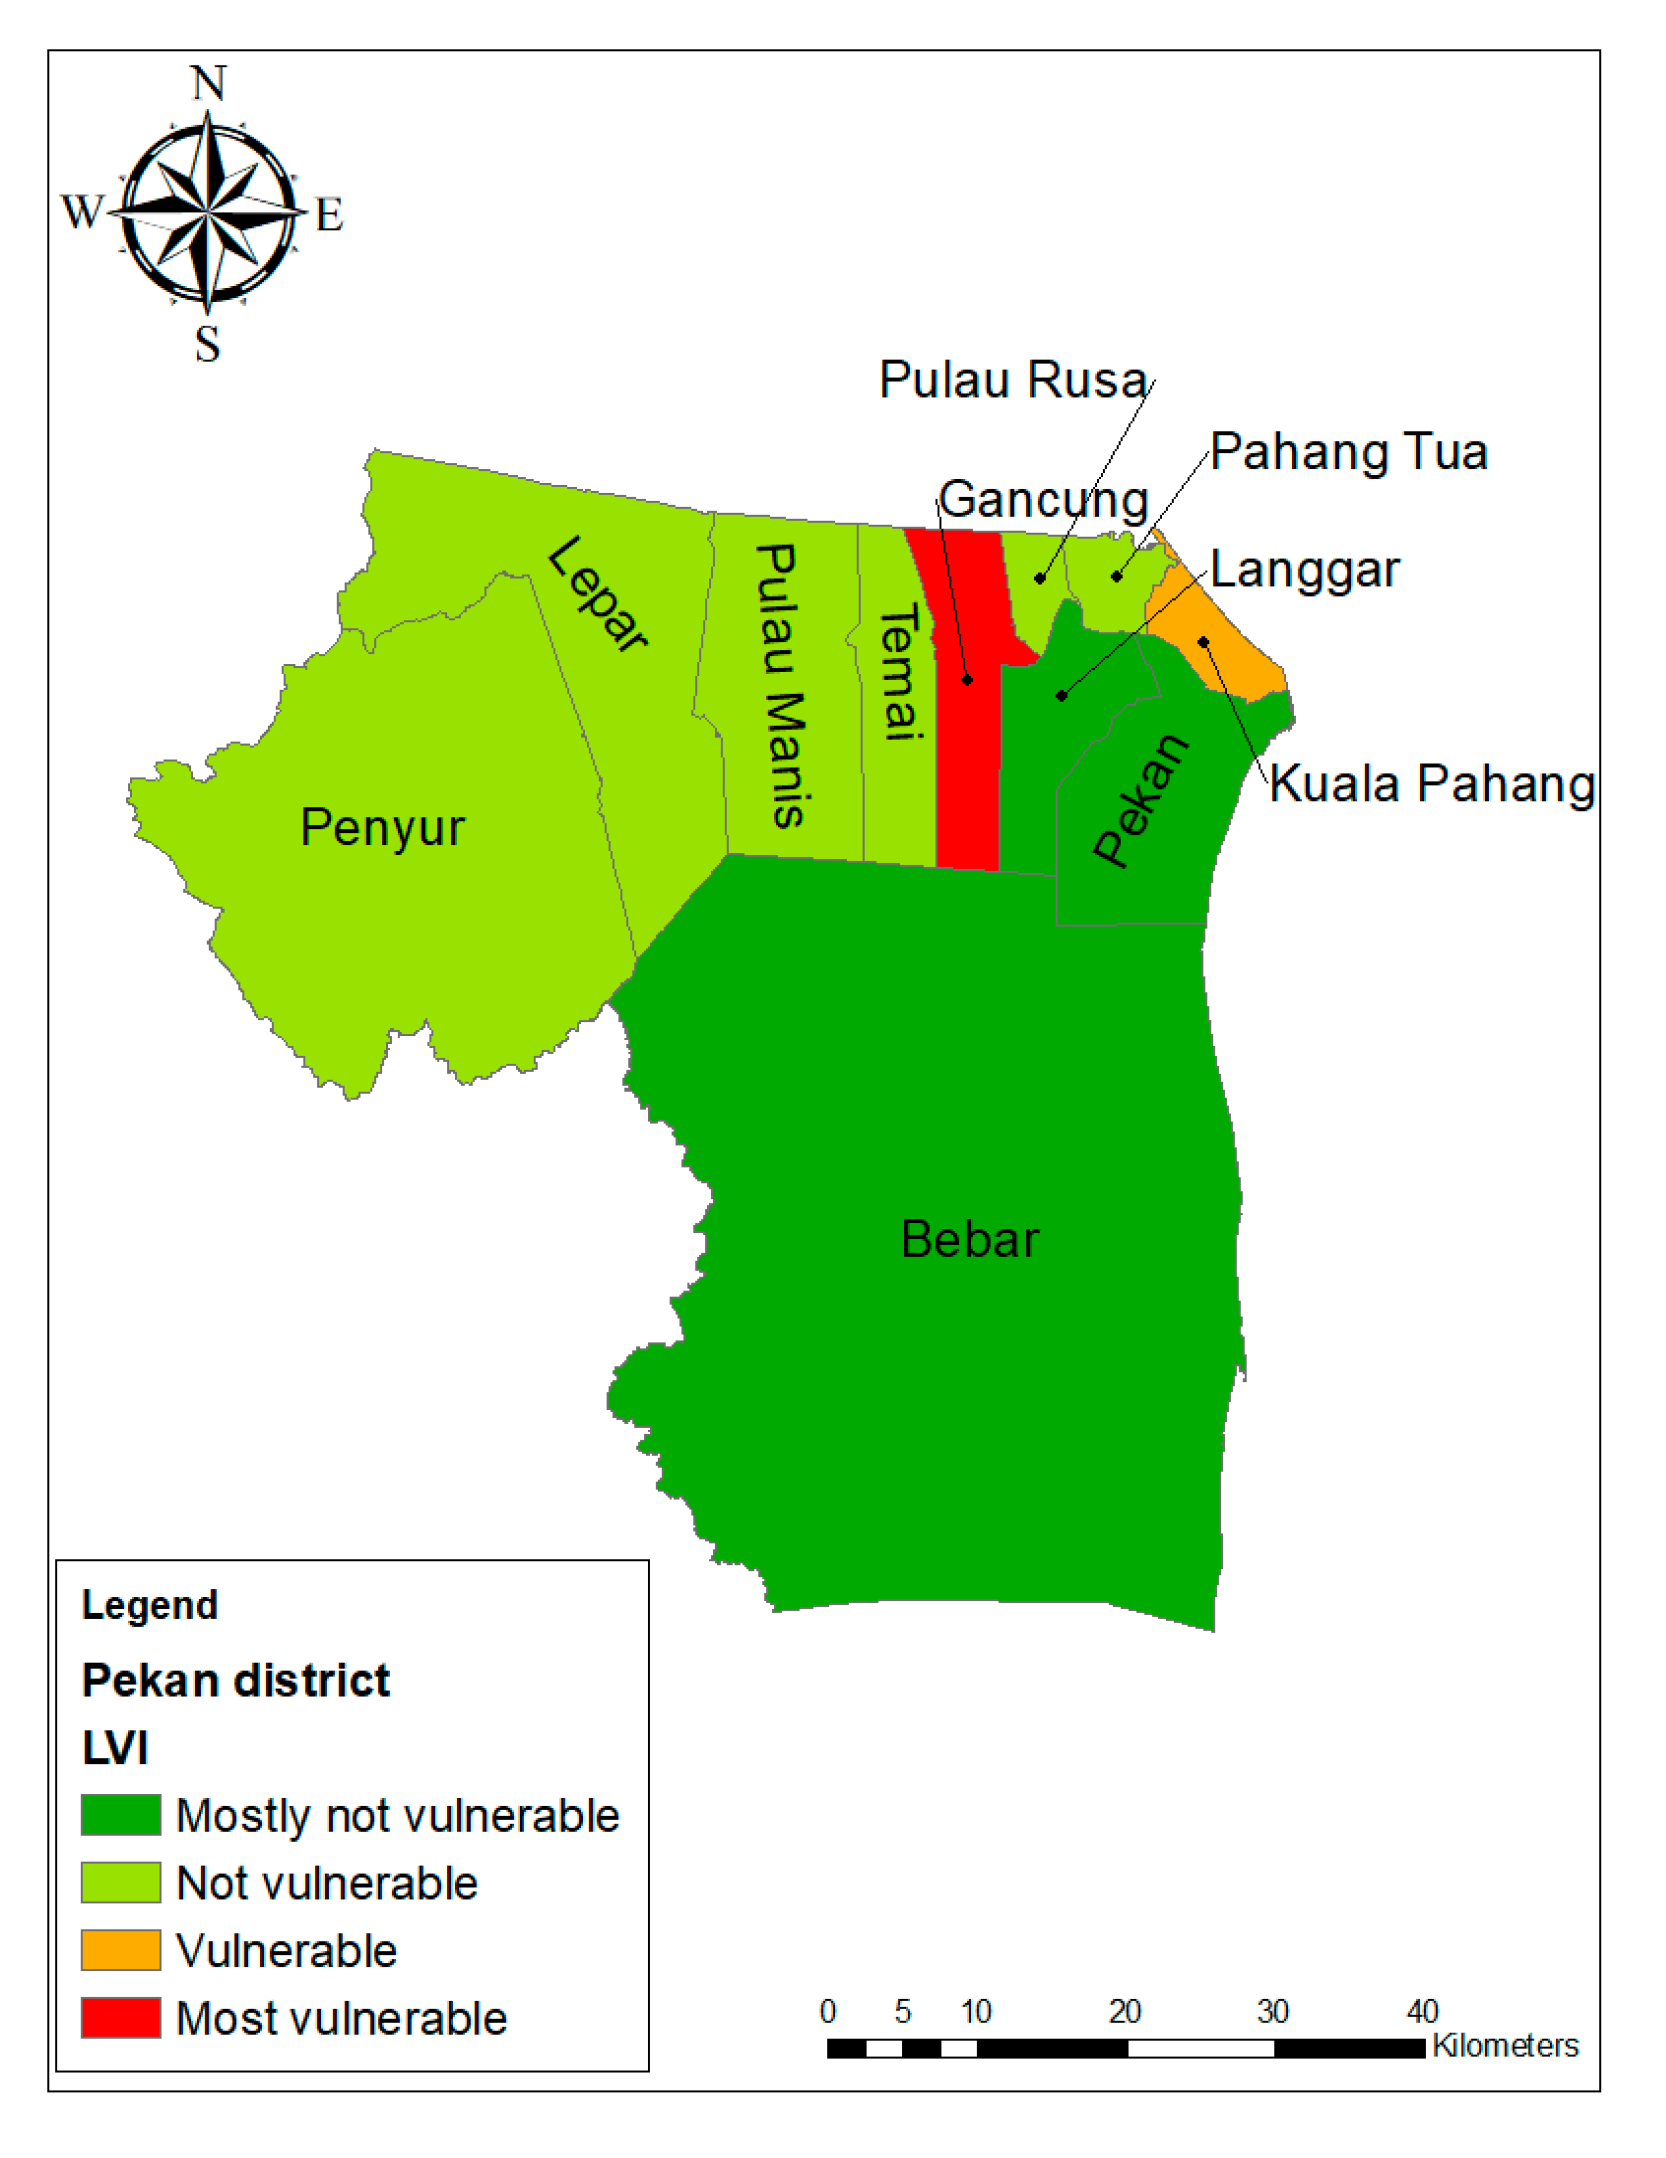
2.5. LVI Mapping Using GIS
3. Results
4. Discussion
5. Conclusions
Author Contributions
Funding
Conflicts of Interest
References
- Utaberta, N.; Spalie, N.; Abdullah, N.G. Design Flexibility of Growing and Transformable House in Malaysia. Adv. Mater. Res. 2010, 168, 545–548. [Google Scholar] [CrossRef]
- Ali, A.M. Flood Inundation Modeling and Hazard Mapping under Uncertainty in the Sungai Johor Basin, Malaysia; CRC Press/Balkema—Taylor & Francis Group: Delft, The Netherlands, 2018. [Google Scholar]
- Idrus, S.; Ismail, S.M.; Hami, A.S.; Mohamed, A.F.; Abu-Bakar, N.; Rameli, N.L.F.; Sulaiman, S.U.; Zubir, F.I. Cabaran Banjir Luar Biasa dan Implikasi Terhadap Dayahuni bandar Kecil di Malaysia. Persidangan Kebangsaan Geografi Alam Sekitar 2015, 5, 946–954. [Google Scholar]
- Floods: Six Districts Still Affected in Pahang. 2015. Available online: http://www.thestar.com.my/News/Nation/2015/01/06/Floods-Six-districts-Pahang/ (accessed on 1 August 2019).
- Ainullotfi, A.A.; Ibrahim, A.L.; Masron, T. A Study on Integrated Community Based Flood Mitigation with Remote Sensing Technique in Kota Bharu, Kelantan. In IOP Conference Series: Earth and Environmental Science; IOP Publishing: Bristol, UK, 2014; Volume 18, p. 012133. [Google Scholar]
- Hanh, M.B.; Riederer, A.M.; Foster, S.O. The livelihood vulnerability index: A pragmatic approach to assessing risks from climate variability and change—A case study in Mozambique. Glob. Environ. Chang. 2009, 19, 74–88. [Google Scholar]
- IPCC. Climate change 2007: The physical science basis. In Contribution of Working Group II to the Forth Assessment Report of the Intergovernmental Panel on Climate Change (Ch.9); Cambridge University Press: Cambridge, UK, 2007. [Google Scholar]
- IPCC. Climate change 2001: Impacts, adaptation and vulnerability. In Contribution of Working Group II to the Third Assessment Report; Cambridge University Press: Cambridge, UK, 2001. [Google Scholar]
- Marin, G.; Modica, M. Socio-economic exposure to natural disasters. Environ. Impact Assess. Rev. 2017, 64, 57–66. [Google Scholar] [CrossRef]
- Patterson, L.A.; Doyle, M.W. Assessing Effectiveness of National Flood Policy through Spatiotemporal Monitoring of Socioeconomic Exposure. J. Am. Water Resour. Assoc. 2009, 45, 237–252. [Google Scholar] [CrossRef]
- Adger, W.N. Vulnerability. Glob. Environ. Chang. 2006, 16, 268–281. [Google Scholar] [CrossRef]
- Adger, W.N.; Arnell, N.W.; Tompkins, E.L. Successful adaptation to climate change across scales. Glob. Environ. Chang. 2005, 15, 77–86. [Google Scholar] [CrossRef]
- Tao, S.; Xu, Y.; Liu, K.; Pan, J.; Gou, S. Research progress in agricultural vulnerability to climate change. Adv. Clim. Chang. Res. 2011, 2, 203–210. [Google Scholar] [CrossRef]
- Millari, A.E. Climate change vulnerability assessment in the Agriculture sector: Typhoon Santi Experience. Procedia-Soc. Behav. Sci. 2016, 216, 440–451. [Google Scholar] [CrossRef]
- Sabine, L.P.-N. The vulnerability of beach tourism to climate change—An index approach. Clim. Chang. 2010, 100, 579–606. [Google Scholar]
- Raquel, S.L.; Clave, S.A.; Saladie, O. The vulnerability of coastal tourism destination to climate change: The usefulness of policy analysis. Sustainability 2017, 9, 2062. [Google Scholar]
- Malik, S.M.; Awan, H.; Khan, N. Mapping vulnerability to climate change and its repercussions on human health in Pakistan. Glob. Health 2012, 8, 31. [Google Scholar] [CrossRef] [PubMed]
- Contreras, D.; Chamorro, A. The spatial dimension in the assessment of socio-economic vulnerability challenges for an application on an urban scale, a systematic review. Nat. Hazards Earth Syst. Sci. Discuss. 2019, 147, 1–43. [Google Scholar] [CrossRef]
- Hinkel, J. “Indicators of vulnerability and adaptive capacity”: Towards a clarification of the science-policy interface. Glob. Environ. Chang. 2011, 21, 198–208. [Google Scholar] [CrossRef]
- Pattusamy, S.; Purusothaman, B.M. Disaster management and mapping using Remote Sensing and GIS. J. Comput. Biosci. Eng. 2014, 1, 1–7. [Google Scholar]
- Tam, T.H. Development of flood risk mapping in Kota Tinggi, Malaysia. In IOP Conference Series: Earth and Environmental Science; IOP Publishing: Bristol, UK, 2014; Volume 18, p. 012192. [Google Scholar]
- Katami, S.; Khazaei, B. Benefits of GIS Application in Hydrological Modeling: A Brief Summary. VATTEN J. Water Manag. Res. 2014, 70, 41–49. [Google Scholar]
- Abd Majid, N.; Rainis, R. Application of Geographical Information Systems (GIS) and Discriminant Analysis in Modelling Slope Failure Incidence in Pulau Pinang, Malaysia. Sains Malaysiana. 2019, 48, 1367–1381. [Google Scholar] [CrossRef]
- Abd Majid, N.; Rainis, R.; Ibrahim, W.M.M.W. Spatial modeling various types of slope failure using Artificial Neural Network (ANN) in Pulau Pinang, Malaysia. J. Teknologi. 2018, 80, 135–146. [Google Scholar] [CrossRef]
- Abd Majid, N.; Rainis, R.; Ibrahim, W.M.M.W. Pemodelan ruangan pelbagai jenis kegagalan cerun di Pulau Pinang menggunakan kaedah nisbah kekerapan. Geografi 2017, 5, 13–26. [Google Scholar]
- Nasiri, H.; Shahmohammadi-Kalalagh, S. Flood vulnerability index as a knowledge base for flood risk assessment in urban area. J. Nov. Appl. Sci. 2013, 2, 269–272. [Google Scholar]
- Nor-Diana, M.I.; Chamhuri, S.; Raihan, T.M.; Ashikin, A.N. Assessing local vulnerability to climate change by using Livelihood Vulnerability Index: Case study in Pahang region, Malaysia. In IOP Conference Series: Materials Science and Engineering; IOP Publishing: Bristol, UK, 2019; Volume 506, p. 012059. [Google Scholar]
- Siwar, C.; Mohd-Idris, N.D.; Ghazali, R.; Alias, N.A. Kajian Impak Sosioekonomi Golongan Terjejas Banjir. In Kajian Banjir Pahang 2014: Pendekatan Dan Impak Terhadap Sosioekonomi, Kesihatan Dan Alam Sekitar; Penerbit Universiti Kebangsaan Malaysia: Selangor, Malaysia, 2017. [Google Scholar]
- Department of Statistics Malaysia. Preliminary Count Report—Population and Housing Census Malaysia 2010. 2017. Available online: https://www.dosm.gov.my/v1/index.php?r=column/cone&menu_id=VE92aHBpclBjMGw0S0N0NkZyVkFIdz09 (accessed on 1 August 2019).
- Mohit, M.A.; Sellu, G.M. Development of Non-structural Flood Mitigation Policies and Measures for Pekan town, Malaysia. Asian J. Behav. Stud. 2017, 2, 9–20. [Google Scholar] [CrossRef][Green Version]
- Manap, N.; Govindasamy, G.; Mohamed, S.; Kasim, N.; Musa, S.M.S.; Yahya, M.Y. Performance of Dredged Sediment as a Replacement for Fine Aggregates in Concrete Mixture: Case Study at Sungai Pekan, Pahang. In MATEC Web of Conferences; EDP Sciences: Les Ulis, France, 2019; Volume 266, p. 1017. [Google Scholar]
- Sullivan, C. Calculating a water poverty index. World Dev. 2002, 30, 1195–1210. [Google Scholar] [CrossRef]
- Madhuri-Tewar, H.R.; Bhowmick, P.K. Livelihood vulnerability index analysis: An approach to study vulnerability in the context of Bihar. Jamba J. Disaster Risk Stud. 2014, 6, 1–13. [Google Scholar]
- Mohammed-Nawi, A.; Wan-Puteh, S.E.; Ahmad, I.S.; Idris, I.B.; Hod, R. Banjir Dan Kesan Kesihatan Terhadap Manusia. In Kajian Banjir Pahang 2014: Pendekatan Dan Impak Terhadap Sosioekonomi, Kesihatan Dan Alam Sekitar; Penerbit Universiti Kebangsaan Malaysia: Selangor, Malaysia, 2017. [Google Scholar]
- Heng, L.Y.; Zainuddin, M.S.; Abdullah, N.F.; Reza, M.I.H.; Choy, E.A.; Elfitri, R.; Siwar, C.; Sharifah, E.; Nurul, A. Sistem Sokongan Keputusan (DSS) untuk Pengurusan Risiko Bencana Banjir di Pahang. In Kajian Banjir Pahang 2014: Pendekatan Dan Impak Terhadap Sosioekonomi, Kesihatan Dan Alam Sekitar; Penerbit Universiti Kebangsaan Malaysia: Selangor, Malaysia, 2017. [Google Scholar]
- Isahak, A.; Reza, M.; Siwar, C.; Ismail, S.M.; Sulaiman, N.; Hanafi, Z.; Zainuddin, M.S.; Taha, M.R. Delineating risk zones and evaluation of shelter centres for flood disaster management along the Pahang River Basin, Malaysia. Jàmbá J. Disaster Risk Stud. 2018, 10, a501. [Google Scholar] [CrossRef] [PubMed]
- Fussel, H.M. Vulnerability: A generally applicable conceptual framework for climate change research. Glob. Environ. Chang. 2007, 17, 155–167. [Google Scholar] [CrossRef]
- Elfithri, R.; Halimshah, S.; Abdullah, M.P.; Mokhtar, M.; Toriman, M.E.; Embi, A.F.; Abdullah, M.; Heng, L.Y.; Ahmad-Maulud, K.N.; Salleh, S.; et al. Pahang Flood Disaster: The Potential Flood Drivers. Malays. J. Geosci. 2017, 1, 34–37. [Google Scholar] [CrossRef]
- East Coast Economic Region Development Council (ECERDC). ECER Master Plan 2.0. In The Next Leap 2018–2025; UKM Pakarunding Sdn Bhd: Selangor, Malaysia, 2019. [Google Scholar]
- Idrus, S.; Mohamad-Ismail, S.; Zubir, F.I.; Rameli, N.F. Bencana Banjir. In Kajian Banjir Pahang 2014: Pendekatan Dan Impak Terhadap Sosioekonomi, Kesihatan Dan Alam Sekitar; Penerbit Universiti Kebangsaan Malaysia: Selangor, Malaysia, 2017. [Google Scholar]
- Abdullah, M.P.; Salleh, S.; Elfithri, R.; Mokhtar, M.; Toriman, M.E.; Embi, A.F.; Abdul-Maulud, K.N.; Maimon, A.; Heng, L.Y.; Halimshah, S.; et al. Stakeholders′ Response and Perspectives on Flood Disaster of Pahang River Basin. Malays. J. Geosci. 2017, 1, 43–49. [Google Scholar] [CrossRef]


| IPCC Contributing Factors to Vulnerability | Major Components | Sub-components | Units |
|---|---|---|---|
| Adaptive capacity | Socio-demographic profile | Dependency ratio | Ratio |
| Percent of female-headed households | % | ||
| Average age of female head of household | count | ||
| Percent of households where head of household has not attended school | % | ||
| Percent of households with orphans | % | ||
| Percent of poor households (income below RM940) | % | ||
| Average number of family members in a household | count | ||
| Livelihood strategies | Percent of households with a family member working in a different community | % | |
| Percent of households dependent solely on agriculture as a source of income | % | ||
| Percent of households with no job during flood season | % | ||
| Average agriculture livelihood diversification index (range: 0.20–1) | 1/#livelihoods | ||
| Percent of households without a non-agricultural livelihood income contribution | % | ||
| Percent of households exploring NR (during flood seasons) | % | ||
| Percent of households that fish (during flood season) | % | ||
| Social network | Average money borrowing–lending ratio | Ratio | |
| Percent of households that receive help due to flooding | % | ||
| Percent of households participating as volunteers during floods | % | ||
| Percent of households that have not been participating in any organizations | % | ||
| Percent of households that have not gone to their local government for assistance | % | ||
| Sensitivity | Health | Average time to get to a health facility | Minutes |
| Percent of households with a family member with a chronic illness | % | ||
| Percent of households where a family had to miss work or school in the last 2 weeks due to illness | % | ||
| Percent of households with a family member who got ill due to flooding | % | ||
| Food | Average crop diversity index | 1/#crops | |
| Percent of households that do not save food | % | ||
| Percent of households that not cultivate 3rd crops | % | ||
| Percent of households that do not sell/barter crops for other food supplies | % | ||
| Water | Percent of households that utilize a natural water source | % | |
| Percent of households that do not have a consistent water supply | % | ||
| Average time to water sources | Minutes | ||
| Inverse of the average number of liters of water stored per household (range: 0–1) | 1/Liters | ||
| Housing | Percent of households with non-solid houses (wood) | % | |
| Percent of households with houses not elevated by high ground to avoid floods | % | ||
| Percent of households with housing affected by floods | % | ||
| Land | Percent of households without ownership of the lands they live on (landless) | % | |
| Percent of households with small land area (0.1–0.5 ha) | % | ||
| Finance & Income | Percent of households that borrow money | % | |
| Percent of households with income affected due to flooding | % | ||
| Exposure | Natural Disasters and Climate Variability | Average number of floods in the past 7 years | count |
| Percent of households with losses of physical assets (machinery) due to flooding | % | ||
| Percent of households with injuries or deaths from natural disasters in the last 7 years | % | ||
| Percent of households that did not receive a warning about flooding | % |
| Classification | Range |
|---|---|
| Most invulnerable | 0.000000–0.239500 |
| Not vulnerable | 0.239501–0.479000 |
| Vulnerable | 0.479001–0.718500 |
| Most vulnerable | 0.718501–1.000000 |
| Major Components | Sub-Components | Pahang Tua | Penyur | Gancung | Langgar | Pulau Manis | Pekan | Kuala Pahang | Lepar | Pulau Rusa | Temai | Maximum Value in all Sub-Districts | Minimum Value in all Sub-Districts |
|---|---|---|---|---|---|---|---|---|---|---|---|---|---|
| Socio-Demographic Profile | Dependency ratio | 0.33 | 0.30 | 0.20 | 0.53 | 0.04 | 1.44 | 0.33 | 0.25 | 0.18 | 0.19 | 3 | 0 |
| Percent of female-headed households | 25 | 31.50 | 27 | 31 | 23 | 14 | 30 | 20 | 5 | 8 | 100 | 0 | |
| Average age of female head of household | 70.60 | 59.50 | 51 | 61.60 | 50.10 | 61.60 | 62 | 63.30 | 41 | 60.50 | 71 | 0 | |
| Percent of households where head of household has not attended school | 5 | 5 | 0 | 5 | 0 | 3.5 | 10 | 7 | 5 | 0 | 100 | 0 | |
| Percent of households with orphans | 5 | 7 | 7 | 13 | 15 | 0 | 5 | 0 | 0 | 12 | 100 | 0 | |
| Percent of poor households (income below RM940) | 45 | 49.30 | 60 | 33.70 | 30.80 | 27.30 | 45 | 30 | 20 | 28 | 100 | 0 | |
| Average number of family members in a household | 4.40 | 3 | 1.90 | 4.30 | 3 | 4.10 | 2.25 | 2.93 | 5.15 | 3.08 | 7 | 0 | |
| Livelihood Strategies | Percent of households with a family member working in a different community | 50 | 39.50 | 30 | 41 | 46 | 32 | 0 | 30 | 30 | 28 | 100 | 0 |
| Percent of households dependent solely on agriculture as a source of income | 20 | 16.50 | 23 | 5 | 23 | 3.5 | 20 | 13 | 25 | 0 | 100 | 0 | |
| Percent of households with no job during flood season | 25 | 36.55 | 20 | 20.15 | 46.20 | 7.35 | 0 | 3.30 | 30 | 60 | 100 | 0 | |
| Average agriculture livelihood diversification index (range: 0.20–1) | 0.98 | 0.99 | 1 | 1 | 1 | 1 | 1 | 1 | 0.98 | 1 | 1 | 0.2 | |
| Percent households without non-agricultural livelihood income contributions | 5 | 19.50 | 23.30 | 15.40 | 11.50 | 0 | 0 | 0 | 0 | 12 | 100 | 0 | |
| Percent of households exploring NR (during flood seasons) | 15 | 4.75 | 3.30 | 2.65 | 19.20 | 46.65 | 5 | 0 | 5 | 12 | 100 | 0 | |
| Percent of households that fish (during flood season) | 30 | 34.05 | 33.30 | 20.15 | 19.20 | 2 | 0 | 23.30 | 50 | 32 | 100 | 0 | |
| Social Network | Average money borrowing–lending ratio | 1.25 | 1.21 | 1.2 | 1.15 | 1.46 | 1.26 | 0.90 | 0.88 | 1.35 | 1.18 | 2 | 0.5 |
| Percent of households that receive help due to flooding | 100 | 100 | 96.70 | 92.35 | 100 | 100 | 70 | 100 | 95 | 100 | 100 | 0 | |
| Percent of households that participate as volunteers during floods | 20 | 53.55 | 26.70 | 7.65 | 46.20 | 10 | 20 | 23.30 | 45 | 60 | 100 | 0 | |
| Percent of households that are in any organizations | 80 | 73.55 | 90 | 76.95 | 57.70 | 98 | 50 | 30 | 65 | 60 | 100 | 0 | |
| Percent of households that have not gone to their local government for assistance | 70 | 92.60 | 90 | 76.95 | 69.20 | 32 | 90 | 86.70 | 95 | 76 | 100 | 0 | |
| Health | Average time to get to a health facility | 4.25 | 8.31 | 9.40 | 9.64 | 12.08 | 14.8 | 6.30 | 7.33 | 12.45 | 11.84 | 22 | 0 |
| Percent of households with family members with chronic illness | 65 | 36.80 | 46.70 | 61.45 | 42.30 | 27.35 | 70 | 43.30 | 40 | 36 | 100 | 0 | |
| Percent of households where a family member had to miss work or school in the last 2 weeks due to illness | 30 | 36.55 | 56.70 | 25.15 | 69.20 | 16 | 0 | 40 | 25 | 40 | 100 | 0 | |
| Percent of households with a family member contract an illness due to floods | 15 | 21.55 | 10 | 27.75 | 34.60 | 5.35 | 25 | 0 | 10 | 16 | 100 | 0 | |
| Food | Average crop diversity index | 0.20 | 0.41 | 0.20 | 0.33 | 0.25 | 0 | 0 | 0.50 | 0.33 | 0.33 | 0.5 | 0 |
| Percent of households that do not save food | 75 | 100 | 96.70 | 97.50 | 80.80 | 100 | 60 | 100 | 100 | 76 | 100 | 0 | |
| Percent of households that do not cultivate 3rd crops | 80 | 97.50 | 93.30 | 97.50 | 96.20 | 100 | 100 | 100 | 90 | 100 | 100 | 0 | |
| Percent of households that do not sell/barter crops for other food supplies | 65 | 92.75 | 90 | 94.85 | 69.20 | 100 | 85 | 83.30 | 75 | 76 | 100 | 0 | |
| Water | Percent of households that utilize a natural water source | 10 | 71.30 | 80 | 5.25 | 11.50 | 0 | 10 | 73.30 | 35 | 12 | 100 | 0 |
| Percent of households that do not have a consistent water supply | 20 | 21.55 | 0 | 5 | 23.10 | 36.65 | 0 | 96.70 | 10 | 20 | 100 | 0 | |
| Average time to get to water sources | 0.78 | 20.68 | 6 | 2.41 | 4.15 | 24.66 | 1.5 | 11.67 | 0.13 | 9.08 | 49 | 0 | |
| Inverse of the average number of liters of water stored per household (range: 0–1) | 0.19 | 0.08 | 0.05 | 0.22 | 0.01 | 0.82 | 1 | 0 | 0.19 | 0.07 | 1 | 0 | |
| Housing | Percent of households with non-solid houses (wood) | 15 | 11.90 | 3.30 | 36.60 | 11.50 | 16 | 0 | 3.30 | 20 | 24 | 100 | 0 |
| Percent of households with houses not elevated by high ground to avoid floods | 20 | 60.1 | 56.7 | 25.25 | 46.2 | 94 | 25 | 30 | 60 | 28 | 100 | 0 | |
| Percent of households with housing affected by floods | 65 | 75.60 | 50 | 61.20 | 76.90 | 6 | 95 | 83.30 | 60 | 92 | 100 | 0 | |
| Land | Percent of households without ownership of the lands they live on (landless) | 15 | 21.50 | 9.90 | 15.25 | 38.50 | 29.35 | 30 | 16.63 | 5 | 12 | 100 | 0 |
| Percent of households with small land area (0.1–0.5 ha) | 65 | 56.55 | 93.30 | 51.20 | 50 | 76.65 | 85 | 36.30 | 40 | 80 | 100 | 0 | |
| Finance & Income | Percent of households that borrow money | 25 | 21.65 | 23.30 | 17.75 | 46.20 | 11.35 | 10 | 10 | 40 | 24 | 100 | 0 |
| Percent of households with income affected due to floods | 25 | 36.55 | 20 | 20.15 | 46.2 | 7.35 | 0 | 3.30 | 30 | 60 | 100 | 0 | |
| Natural Disasters and Climate Variability | Average number of floods in the past 7 years | 2.15 | 0.73 | 3.57 | 2.06 | 2.69 | 1.42 | 6.50 | 2.20 | 2.45 | 3.44 | 7 | 0 |
| Percent of households with losses to physical assets (house/machinery) due to flooding | 25 | 36.20 | 33.30 | 20.15 | 61.50 | 10 | 35 | 50 | 20 | 16 | 100 | 0 | |
| Percent of households with injury or death from natural disasters in the last 7 years | 5 | 0 | 0 | 0 | 3.80 | 0 | 0 | 0 | 0 | 4 | 100 | 0 | |
| Percent of households that did not receive a warning about flooding | 0 | 16.90 | 0 | 2.65 | 0 | 6 | 0 | 3.30 | 10 | 16 | 100 | 0 |
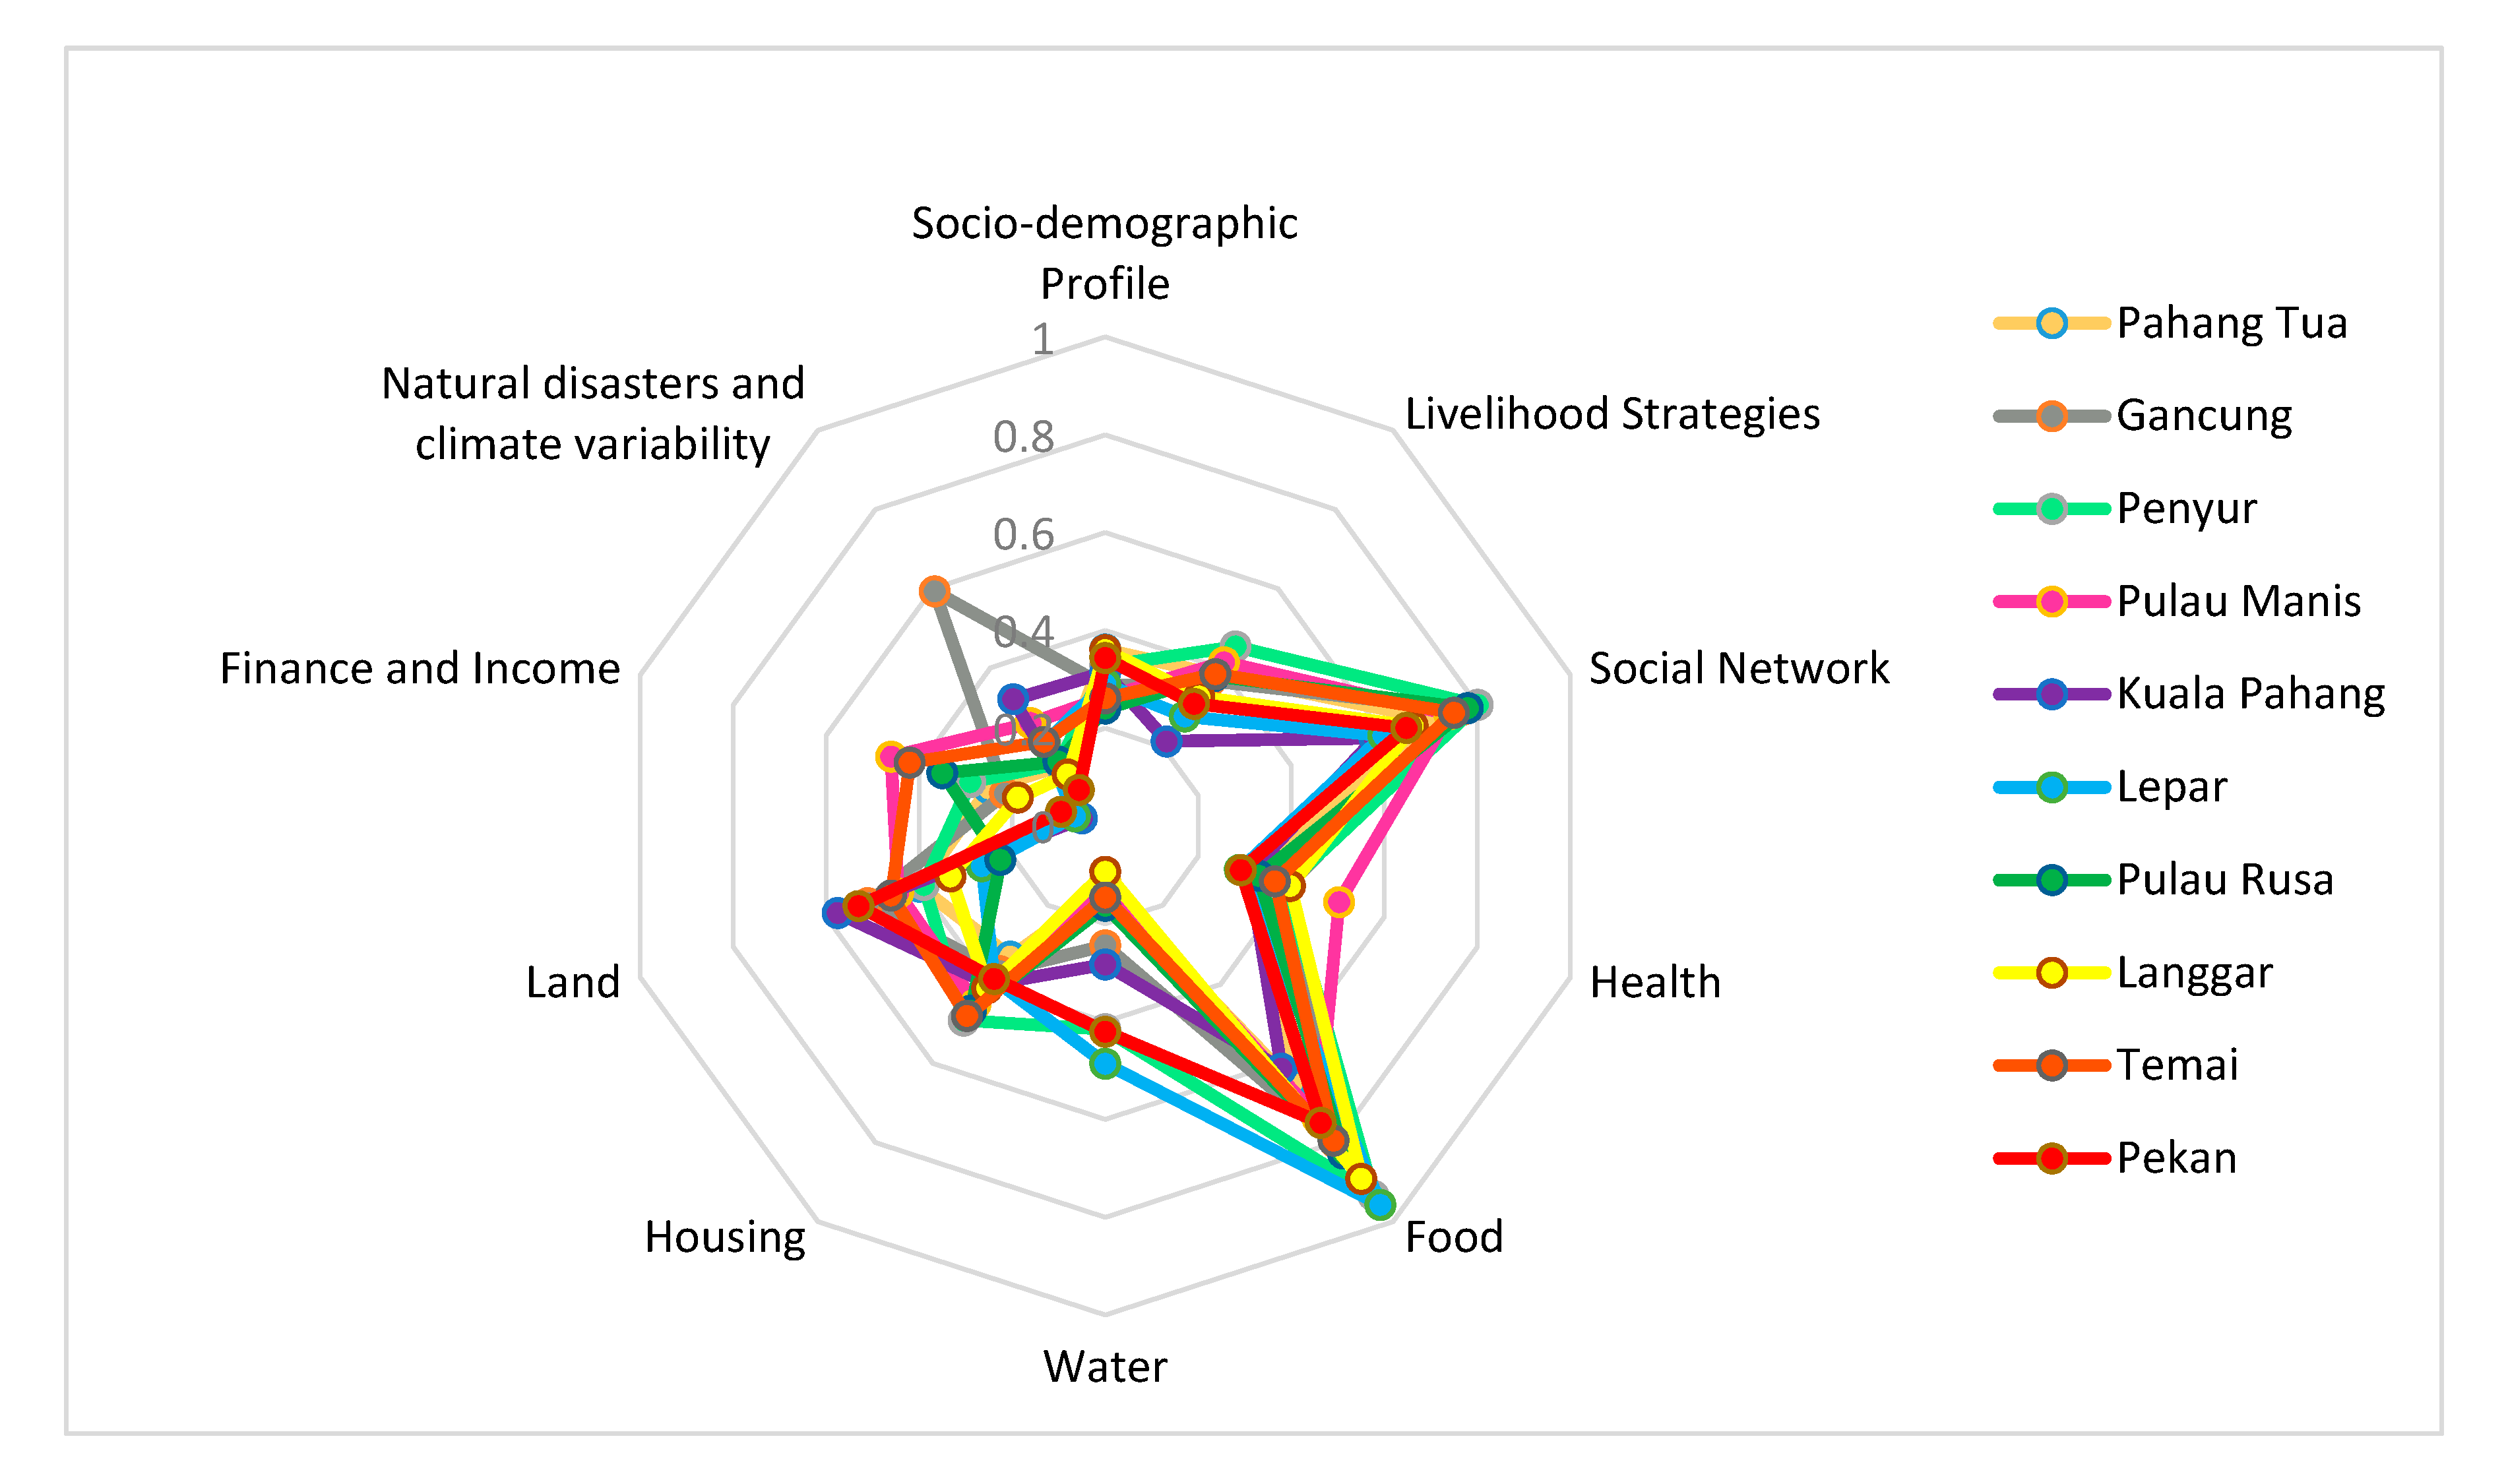
| Major Component | Pahang Tua | Gancung | Penyur | Pulau Manis | Kuala Pahang | Lepar | Pulau Rusa | Langgar | Temai | Pekan |
|---|---|---|---|---|---|---|---|---|---|---|
| Socio-Demographic Profile | 0.36 | 0.28 | 0.32 | 0.26 | 0.31 | 0.29 | 0.24 | 0.35 | 0.26 | 0.34 |
| Livelihood Strategies | 0.38 | 0.36 | 0.45 | 0.41 | 0.21 | 0.27 | 0.37 | 0.32 | 0.38 | 0.30 |
| Social Network | 0.70 | 0.76 | 0.80 | 0.74 | 0.58 | 0.59 | 0.78 | 0.66 | 0.75 | 0.64 |
| Health | 0.32 | 0.39 | 0.38 | 0.50 | 0.31 | 0.29 | 0.33 | 0.39 | 0.36 | 0.29 |
| Food | 0.65 | 0.80 | 0.93 | 0.74 | 0.61 | 0.95 | 0.82 | 0.89 | 0.79 | 0.75 |
| Water | 0.12 | 0.24 | 0.41 | 0.11 | 0.28 | 0.48 | 0.16 | 0.09 | 0.14 | 0.42 |
| Housing | 0.33 | 0.36 | 0.49 | 0.45 | 0.40 | 0.38 | 0.46 | 0.41 | 0.48 | 0.38 |
| Land | 0.40 | 0.51 | 0.39 | 0.44 | 0.57 | 0.26 | 0.22 | 0.33 | 0.46 | 0.53 |
| Finance and Income | 0.25 | 0.21 | 0.29 | 0.46 | 0.05 | 0.06 | 0.35 | 0.18 | 0.42 | 0.09 |
| Natural Disasters and Climate Variability | 0.15 | 0.59 | 0.15 | 0.26 | 0.32 | 0.21 | 0.16 | 0.13 | 0.21 | 0.09 |
| LVI | 0.38 | 0.45 | 0.47 | 0.43 | 0.35 | 0.39 | 0.39 | 0.78 | 0.41 | 0.61 |
| IPCC Contributing Factors to Vulnerability | Pahang Tua | Gancung | Penyur | Pulau Manis | Kuala Pahang | Lepar | Pulau Rusa | Langgar | Temai | Pekan |
|---|---|---|---|---|---|---|---|---|---|---|
| Adaptive capacity | −0.10 | 0.06 | −0.17 | −0.08 | −0.01 | −0.07 | −0.11 | −0.12 | −0.09 | −0.14 |
| Sensitivity | 0.35 | 0.43 | 0.51 | 0.45 | 0.38 | 0.46 | 0.41 | 0.41 | 0.44 | 0.43 |
| Exposure | 0.15 | 0.59 | 0.15 | 0.26 | 0.32 | 0.21 | 0.16 | 0.13 | 0.21 | 0.09 |
| LVI–IPCC | −0.10 | 0.06 | −0.17 | −0.08 | −0.01 | −0.07 | −0.11 | −0.12 | −0.09 | −0.14 |
© 2019 by the authors. Licensee MDPI, Basel, Switzerland. This article is an open access article distributed under the terms and conditions of the Creative Commons Attribution (CC BY) license (http://creativecommons.org/licenses/by/4.0/).
Share and Cite
Abd Majid, N.; Muhamad Nazi, N.; Mohd Idris, N.D.; Taha, M.R. GIS-Based Livelihood Vulnerability Index Mapping of the Socioeconomy of the Pekan Community. Sustainability 2019, 11, 6935. https://doi.org/10.3390/su11246935
Abd Majid N, Muhamad Nazi N, Mohd Idris ND, Taha MR. GIS-Based Livelihood Vulnerability Index Mapping of the Socioeconomy of the Pekan Community. Sustainability. 2019; 11(24):6935. https://doi.org/10.3390/su11246935
Chicago/Turabian StyleAbd Majid, Nuriah, Nurafiqah Muhamad Nazi, Nor Diana Mohd Idris, and Mohd. Raihan Taha. 2019. "GIS-Based Livelihood Vulnerability Index Mapping of the Socioeconomy of the Pekan Community" Sustainability 11, no. 24: 6935. https://doi.org/10.3390/su11246935
APA StyleAbd Majid, N., Muhamad Nazi, N., Mohd Idris, N. D., & Taha, M. R. (2019). GIS-Based Livelihood Vulnerability Index Mapping of the Socioeconomy of the Pekan Community. Sustainability, 11(24), 6935. https://doi.org/10.3390/su11246935