1. Introduction
According to the UN 2014 report, the world population in urban areas will increase from 54% to 66% by 2050. The speed of growth presents a great challenge for all those involved in designing, planning, constructing, and managing the built environment to provide sustainable and liveable cities. As expected, the wave of urbanization has reached cities in the Middle East. Countries such as the United Arab Emirates (UAE), Saudi Arabia, Qatar, Bahrain, Kuwait, and Oman are developing very fast in terms of construction and urban growth. One of the main challenges in emerging countries is the energy demand in the built environment. As a response to this, the UAE is committed to reducing energy consumption in buildings [
1,
2].
In the UAE, Abu Dhabi, its capital city, is mainly concentrated on an island while other important cities in the country, such as Dubai, have a linear development. Major cities in the UAE have a clearly defined building typology. However, the district typology distribution greatly differs from one city to the next. In Abu Dhabi, villa districts are located in the entrance of the main island, while in Dubai they are in the middle of the two main financial centres [
3,
4].
The main cities of the UAE, Abu Dhabi and Dubai, follow different energy guidelines to reduce building cooling loads. Abu Dhabi’s local authorities, such as the Urban Planning Council (UPC), have launched several major initiatives since 2010, such as the Abu Dhabi 2030 plan and the Estidama sustainability rating system part of such initiatives. According to these new regulations, new expansion areas on the suburbs of the main island must be, at a minimum, compliant with Estidama’s mandatory requirements (lowest rating level). Government buildings are compelled to achieve an even higher rating level. Estidama specifies the main building characteristic, materials, area, orientation etc, for new construction. However, there is also a continuous attempt at improving energy savings in existing buildings through different retrofit measures. Currently, building energy consumption takes 80% of the total electricity consumption in the emirate of Abu Dhabi. The cooling load constitutes 70% of this energy use [
5,
6,
7]. Since the cooling load cannot be mitigated without improving existing buildings, finding optimal retrofit strategies is a priority [
8,
9].
1.1. Cooling Demand Reduction Strategies
Retrofit strategies contribute to obtaining a reduced energy consumption. In recent years, different strategies have been assessed to figure out the best configuration that allows a consistent increase in efficiency [
10]. We summarize some meaningful strategies below.
1.1.1. Cool Roof
Cool roofs have been applied in many building typologies in different climates. Not only do they have a positive impact in reducing the cooling load but they also improve the urban air temperature providing an indirect benefit to the building. A study done in Sacramento (CA, USA), showed a 30% cooling load reduction by using cool roofs in a residential building and 40% in a school building [
11].
1.1.2. Cool Walls
Even though cool walls are a very well-known retrofit strategy in several countries in different climate zones, they are quite new for the city of Abu Dhabi. Due to the rapid development, there is a lack of information and analysis on the impact of the cool wall; however, the literature shows that the impact of cool walls may sometimes be more significant than that of cool roofs. A coupled model simulation in Nantes, France, shows the impact of cool materials on energy demand. This strategy can have a bigger impact if combined with a proper inner ventilation system to remove the heat from inside the buildings [
12].
1.1.3. Air Conditioning (AC) Setpoint
There are several studies done in different climates that analyse the impact of AC setpoints on reducing the cooling load in buildings. Some reference models are used to compare the change in indoor thermal comfort and cooling load savings. According to one study, a setpoint change from 22.2°C to 25°C in an office building can result in a 29% cooling reduction [
13]. Modifying the AC set-point by a few degrees can save up to 20% of the cooling energy in the case of a non-insulated villa [
14,
15].
Another analysis done in a residential district and a villa district in Abu Dhabi shows the impact of changing the set-points. In this case, the internal air temperature setpoint takes 3 different values. 20°C is the base case scenario used in the ENVI-met models, 22°C is the setpoint mostly used on the main island of Abu Dhabi and 26°C is the optimal one. The results show that by changing the indoor temperature setpoint, the cooling load can get reduced by up to 13.9% from the base case [
10].
1.1.4. Window Louvres
Applying shading devices on the glazing areas is a comment practice in Middle Eastern countries. The masharabiya has been part of the building envelope throughout the history of architecture in hot climate countries [
16,
17,
18,
19]. An analysis done for the European Union suggests guidelines for maximizing natural light while reducing the cooling load. According to the study, the energy gained via glazed building components is reduced by using traditional sun protection strategies. However, excessive use of shading can result in higher electricity consumption due to the increased need for artificial lighting. The authors of the study don’t recommend manual louvres in the building as the occupants might modify them in sub-optimal ways. A centralized automatic system proves to be more effective in reducing the cooling load [
20].
1.1.5. UHI Effect
Building energy performance is strictly connected to the urban microclimate and its changes. The urban heat island (UHI) effect, broadly defined as the increased temperature in urban areas compared to its surroundings due to anthropogenic heat, has been linked to an increase in cooling demand. Studies have shown that UHI alone can increase the cooling loads of building up to 50% [
21]. Hence, building retrofit strategies such as solar reflective materials, shading trees around buildings, ambient cooling achieved by urban vegetation and high albedo surfaces can contribute to mitigating the UHI effect, which in turn contributes to reducing building cooling loads [
22].
1.2. Building Energy Models (BEMs) and Calibration
Building typology, size and end-use are good predictors of the energy consumption required for cooling. BEMs take advantage of these known properties and can be used as decision-making tools for retrofit strategies. For example, the building envelope plays an important role in the building cooling load. It is proven that a compact building envelope can save up to 10% in the cooling load energy use. However, using glazing and roof insulation have different impacts in different climates [
23,
24,
25]. These types of “what if” scenarios can be only estimated using modern BEMs to explore how a virtual building interacts not only with its occupants but also with its surroundings. Information such as building geometry, envelope properties, internal gains, infiltration rates, type of HVAC system and system efficiencies, among others, are included in BEMs to attempt to represent the actual energy demand behaviour of the building.
In addition, boundary conditions have an important impact on building cooling load calculations. A study shows the effect of different microclimate changes on the building energy use in a district in Abu Dhabi. A second study done in Italy and Switzerland uses GIS (geographic information system) data to estimate the energy consumption at the district scale using a decoupled model, meaning the energy simulation runs separately from the microclimate simulation model [
26,
27,
28]. Hence, BEMs should ideally consider urban microclimate parameters (local temperature, wind pressure, solar irradiation) as boundary conditions. In practice, using weather information that accounts for microclimate effects, such as the UHI effect, is often overlooked due to the lack of locally installed weather stations and underestimating their importance.
In order to ensure that a building energy model represents a real building, there must be acceptable levels on the prediction uncertainty. Model calibration consists of quantification and reduction of uncertainty through fine-tuning little-known or highly uncertain model parameters. The following table (
Table 1) presents the maximum allowed normalized mean biased error (NMBE) and coefficient of variation of the root mean squared error (CVRMSE) values required for properly calibrated models according to ASHRAE Guideline 14.
2. Methodology
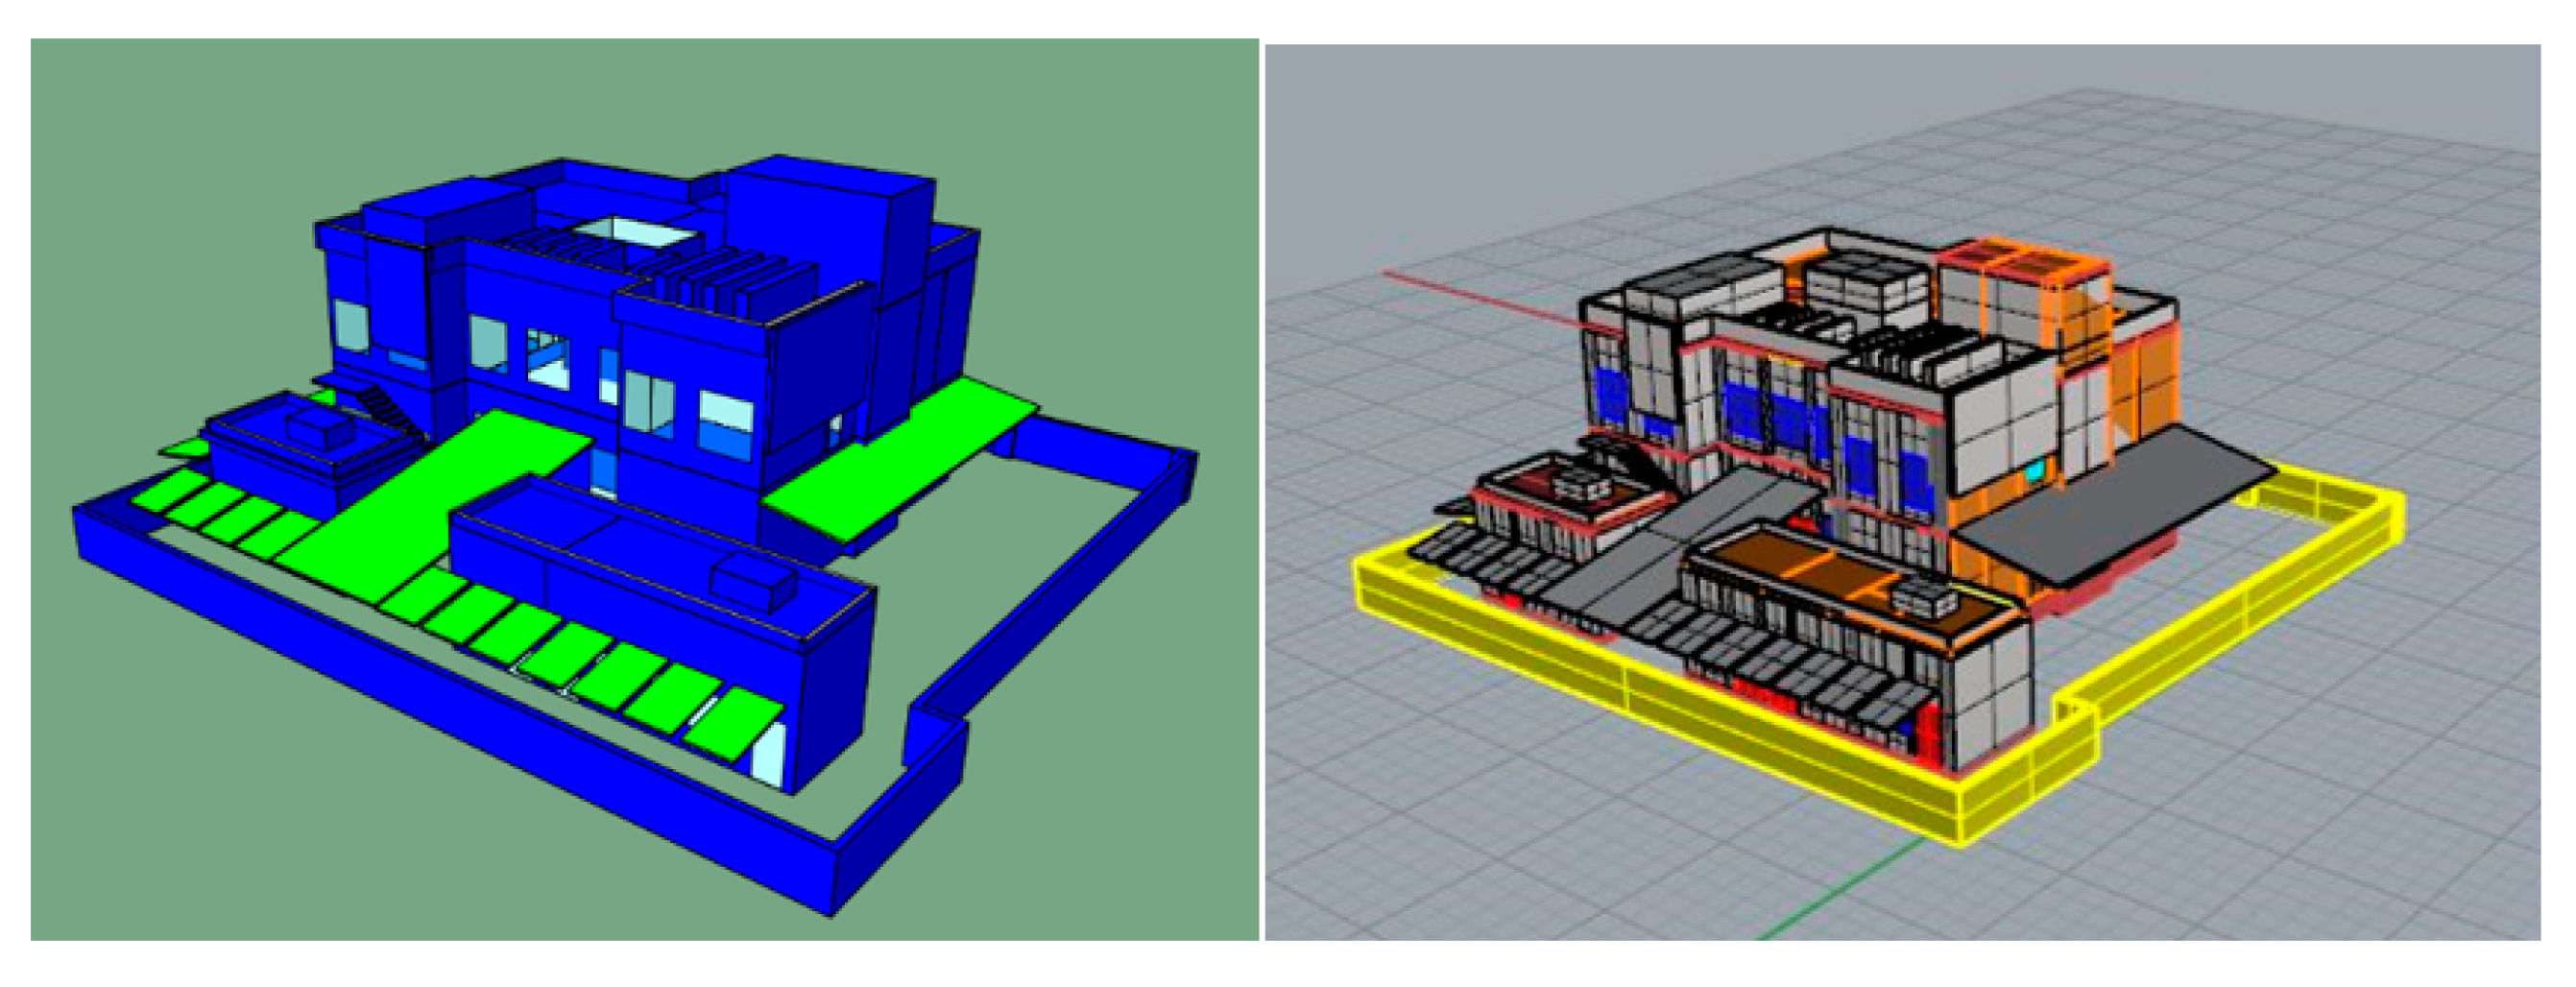
This study explored typical retrofit strategies for a typical villa building located in Abu Dhabi. Calibration, retrofit scenario simulation and sensitivity analysis were carried out. The geometry model was created using the software Rhinoceros 5 (Robert McNeel &Associates, Seattle, WA, USA) and it was imported to IES-VE using the GEM (graphical environment manager) format, which contains vector image information.
Integrated Environmental Solution-Virtual Environment (IES-VE) is a suite of applications used to run and accurately predict thermal simulations and perform quick load calculations and equipment sizing from the early design stages. Among its applications, users can find solar shading, building energy simulation, daylight simulation and lighting design, HVAC system sizing, airflow, life-cycle cost analysis and parametric and model optimization. The tool aims to help sustainable design experts run fast and accurate sub-hourly simulations.
For this project, an energy model was created and calibrated. Then, the different retrofit strategies were applied separately and all together to analyse the impact that they have on the cooling load. This application helps the decision-making process of choosing one strategy over another [
30].
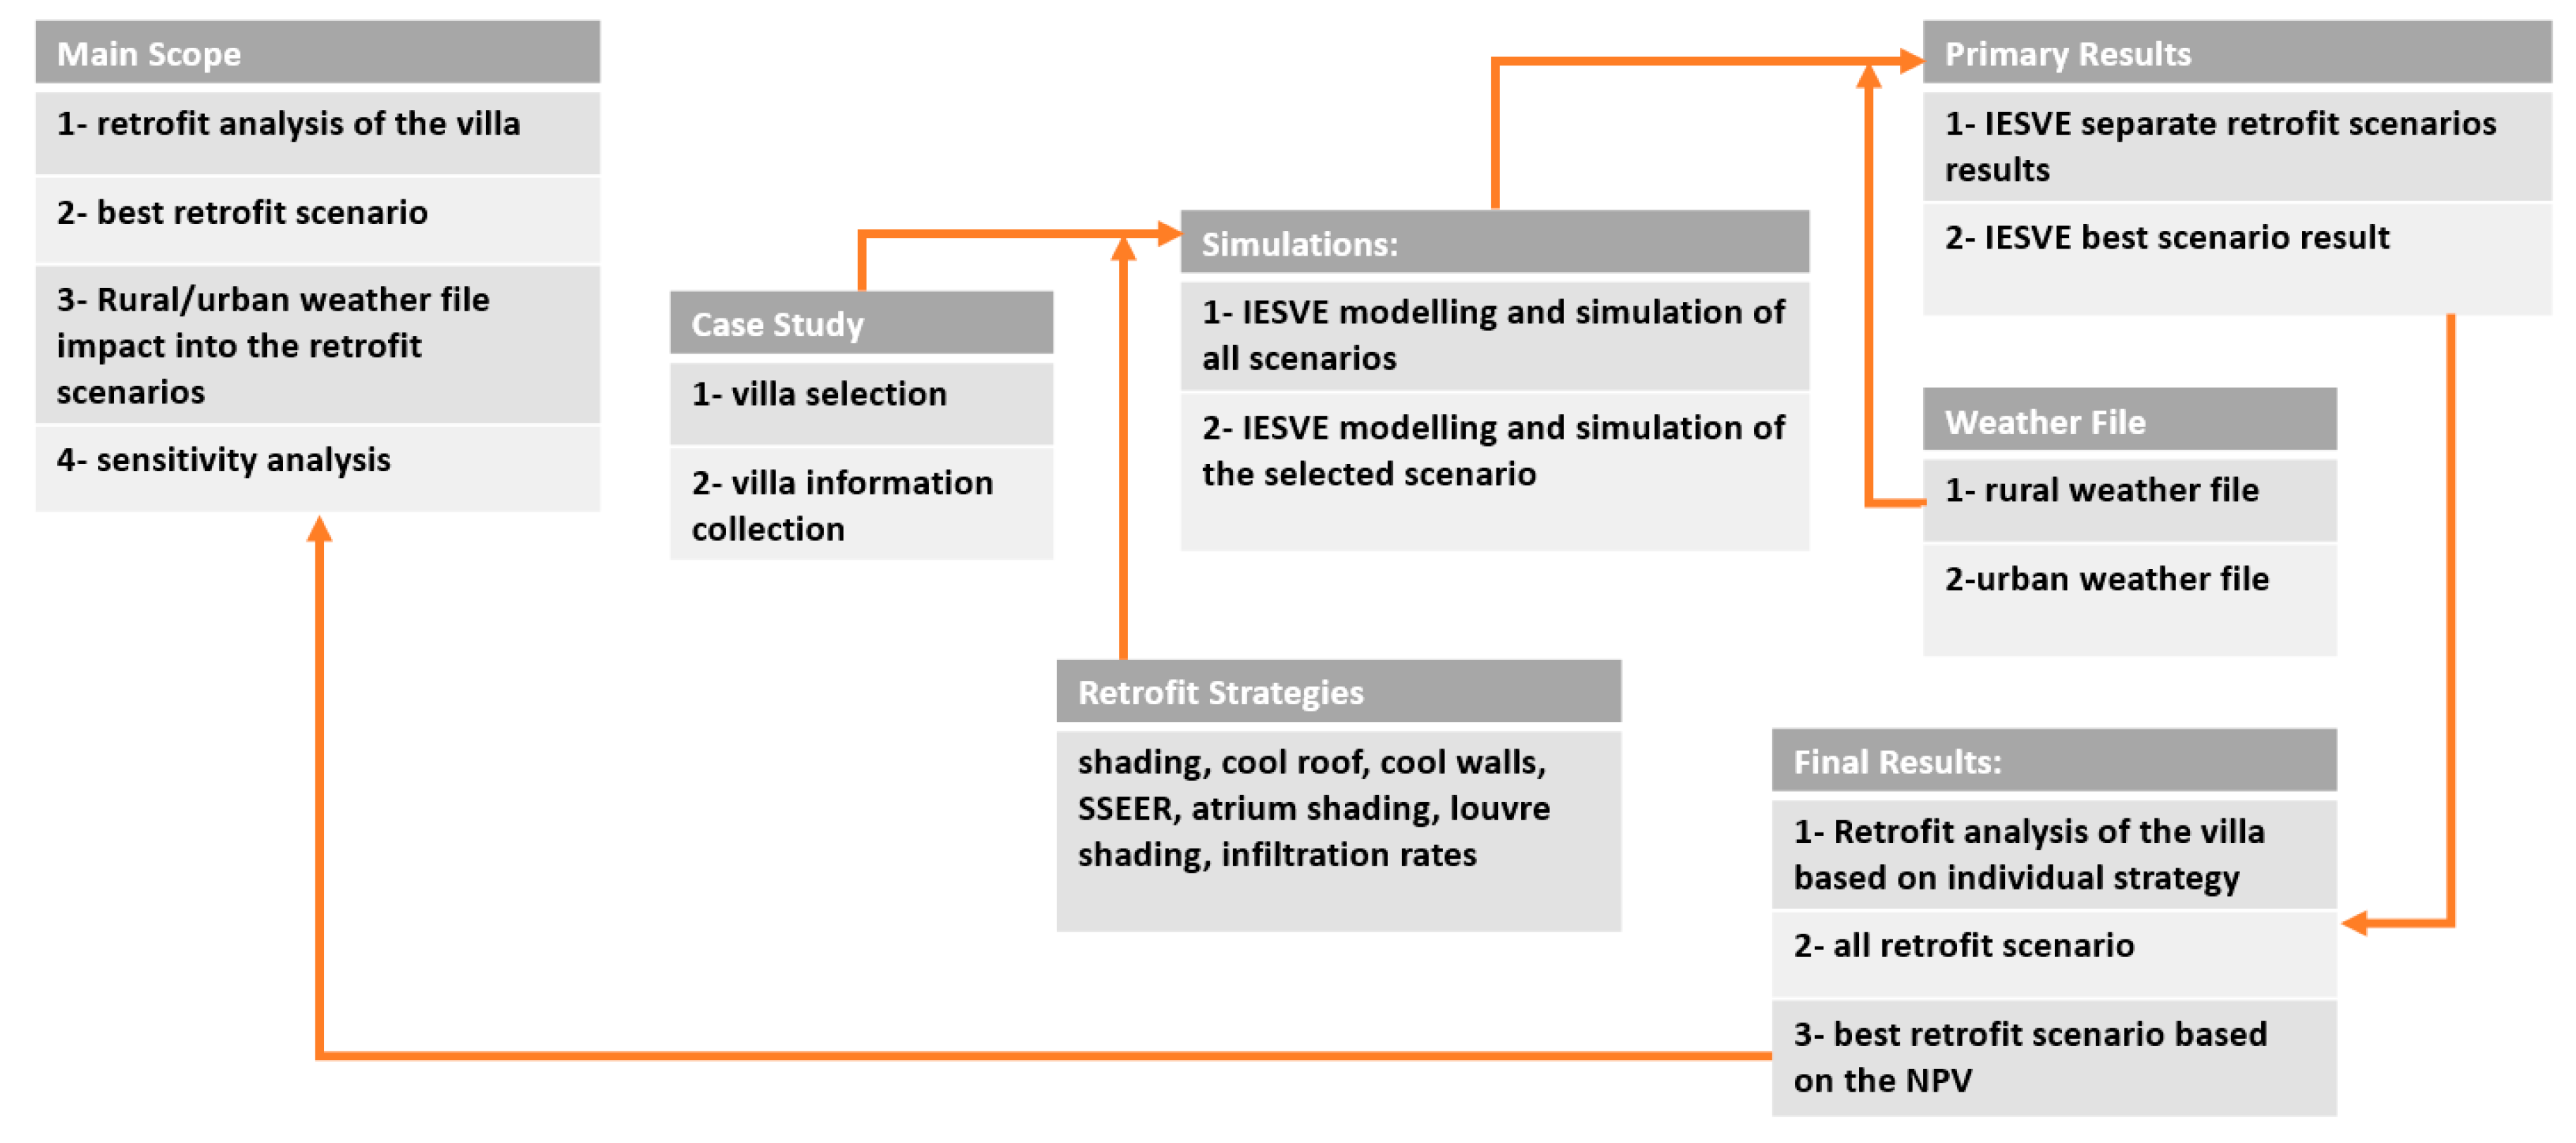
The project has been organized as follows:
Figure 1 shows more clearly the flow chart followed in this study. The comparison of the results between the urban and rural file is one of the main aims of this study.
2.1. Weather Data Customization
The weather data were customized by combining rural weather data with the humidity recorded by a monitoring station located on the villa’s roof. In similar energy simulations the weather file considered is the typical one taken from the airport weather station. In this study a weather station was placed in the villa roof in order to have site weather measurements. The reason for this process was to try to take the UHI phenomena into account. To construct “hybrid” weather data to account for the UHI effect, dry bulb temperature and wet bulb temperature were taken from the weather station installed on the villa roof, other variables, such as solar radiation, wind direction and wind speed, were taken from the Masdar city weather station (
Figure 2).
2.2. Calibrated Simulation
Calibration, instead of predicting a future variable, consist of matching a series of observed variables. For this purpose, the HONE tool was used. This is a standalone tool that references an IES-VE model. It discovers the optimal building design parameters that satisfy selected objectives using NSGA-II (non-dominated sorting genetic algorithm), which is a type of genetic algorithm (GA). The model is calibrated once it has reached NMBE <5% and CVRMSE <15%, as defined by the International Performance Measurement and Verification Protocol (IPMVP) for monthly energy values. The associated ELEMENTS TOOL provides one central location to manage both HONE and the PARAMETRICS TOOL. Within ELEMENTS, you can set, edit, define and store all parameters and variables. The tool helps select variables and outputs, which are then converted into scripts for use in the tools. The results can be tracked using the Pareto curve graph, which is updated after every evaluation to represent the latest set of optimal solutions.
2.3. Retrofit Strategies Simulation
Once the model was calibrated, a baseline model was created and modified with several retrofit strategies. This creates variant models that were, in turn, compared to each other for energy consumption assessment.
2.4. Sensitivity Analysis
Sensitivity analysis is a technique used to find out how a particular dependent variable is influenced by the variation of an independent variable. This analysis was done using PARAMETRIC TOOL, a standalone module belonging to IES-VE. This runs a series of thermal simulations, simulating multiple design scenarios. It creates and automatically runs a series of Apache simulations. It simulates multiple design scenarios and combinations of building design inputs. Within this tool, you have the option to combine or link variables, combining two or more parameters will result in running a simulation for each change of the combination of parameters. Linked parameters, instead, must be associated with a parent “combined” parameter. This will result in adding an extra set of simulations to each of the parameter combinations.
3. Case Study: Emirati Villa
The villa analysed in this study is located on the east side of the main island of Abu Dhabi. The unit is part of a villa neighbourhood designed with reference to typical Emirati specifications, with final users assumed to be Emirati Families. The villa is located close to the mangrove area (a protected natural site) allows the neighbourhood to have more ventilation compared to the districts downtown. Large streets and external parking lots characterize the neighbourhood. Very few trees surround the villa and they can be assumed to have no significant impact on the microclimate. The main streets surrounding the district are Dalma Street and Hazza Bin Zayed Street.
The villa is designed for a large family of five to six members. The service areas are located in the ground floor (laundry, kitchen). The day zones (man sitting area and ladies sitting area) are oriented towards the north and are located close to the main entrance. A central hall that connects both floors has natural daylight. There is a guest room located to the south east. The four bedrooms are located in the first floor. Each bedroom has a separate bathroom. The villa has also two external units with only a ground floor, an external kitchen and external second laundry room. The house was converted in a nursery that serves the neighbourhood. The air conditioning system is central, and the main unit is located on the rooftop. The rooftop has a one-meter parapet of surrounding the house. The details of the material properties are shown in the sections below.
3.1. Site Measurements
Weather Data
● Rural Data
The data used for this validation was taken from the Masdar City weather station. This station undergoes regular maintenance to ensure data quality and continuity. The weather station is located near the Abu Dhabi Airport. The area is surrounded by a desert that connects Abu Dhabi to Dubai and Al Ain. The Abu Dhabi airport is located 28 km from the downtown area [
31].
● Villa Weather Data
Due to the UHI phenomena present in Abu Dhabi, weather data taken from a station above the rooftop of the villa was used. To compensate for the UHI effect, dry and wet bulb temperatures were taken from the weather station located on the roof of the villa. Other variables (such as solar radiation, wind speed and wind direction) were taken from the Masdar City weather station.
3.2. Geometry Model
The original model,
Figure 3, was made using Rhinoceros 5 and imported into IES-VE. The export-import process was carried out using the GEM format.
3.3. Cooling and Operation Schedule
This data was not available, so the method that has been was carried out used reverse engineering and on-site inspection and surveys. The following tables (
Table 2 and
Table 3) summarize this information.
3.4. Construction Properties
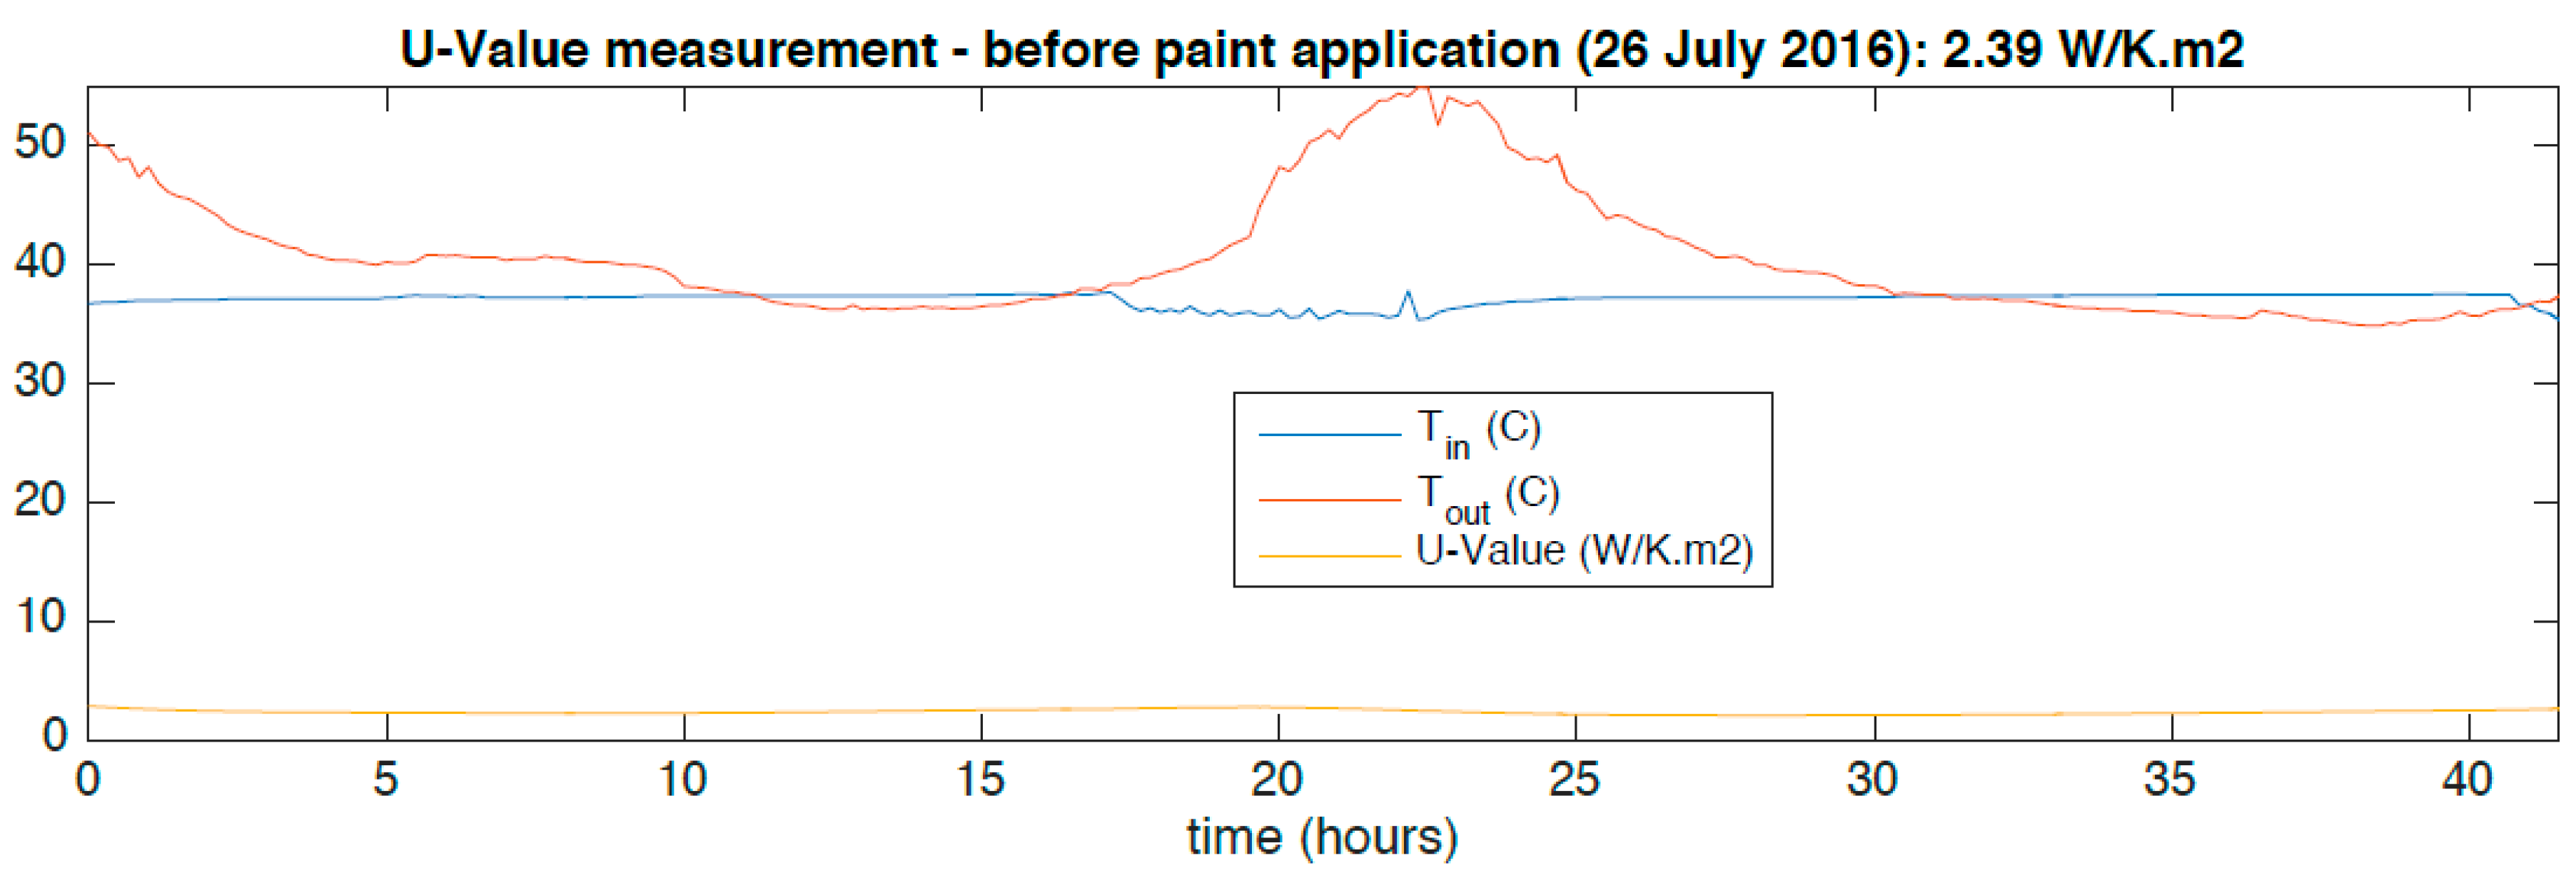
The material properties of this case study are based on the UPC (Urban Planning Council) study of typical Abu Dhabi buildings, a survey conducted by Abu Dhabi Municipality and on a report by the Executive Affairs Authority. Additionally, on-site U-value measurements were conducted
Figure 4 shows the U-value measurements and the indoor outdoor temperature (y-axes). The U-value is measured using a sensor with two components, placed above and under the roof of the second floor [
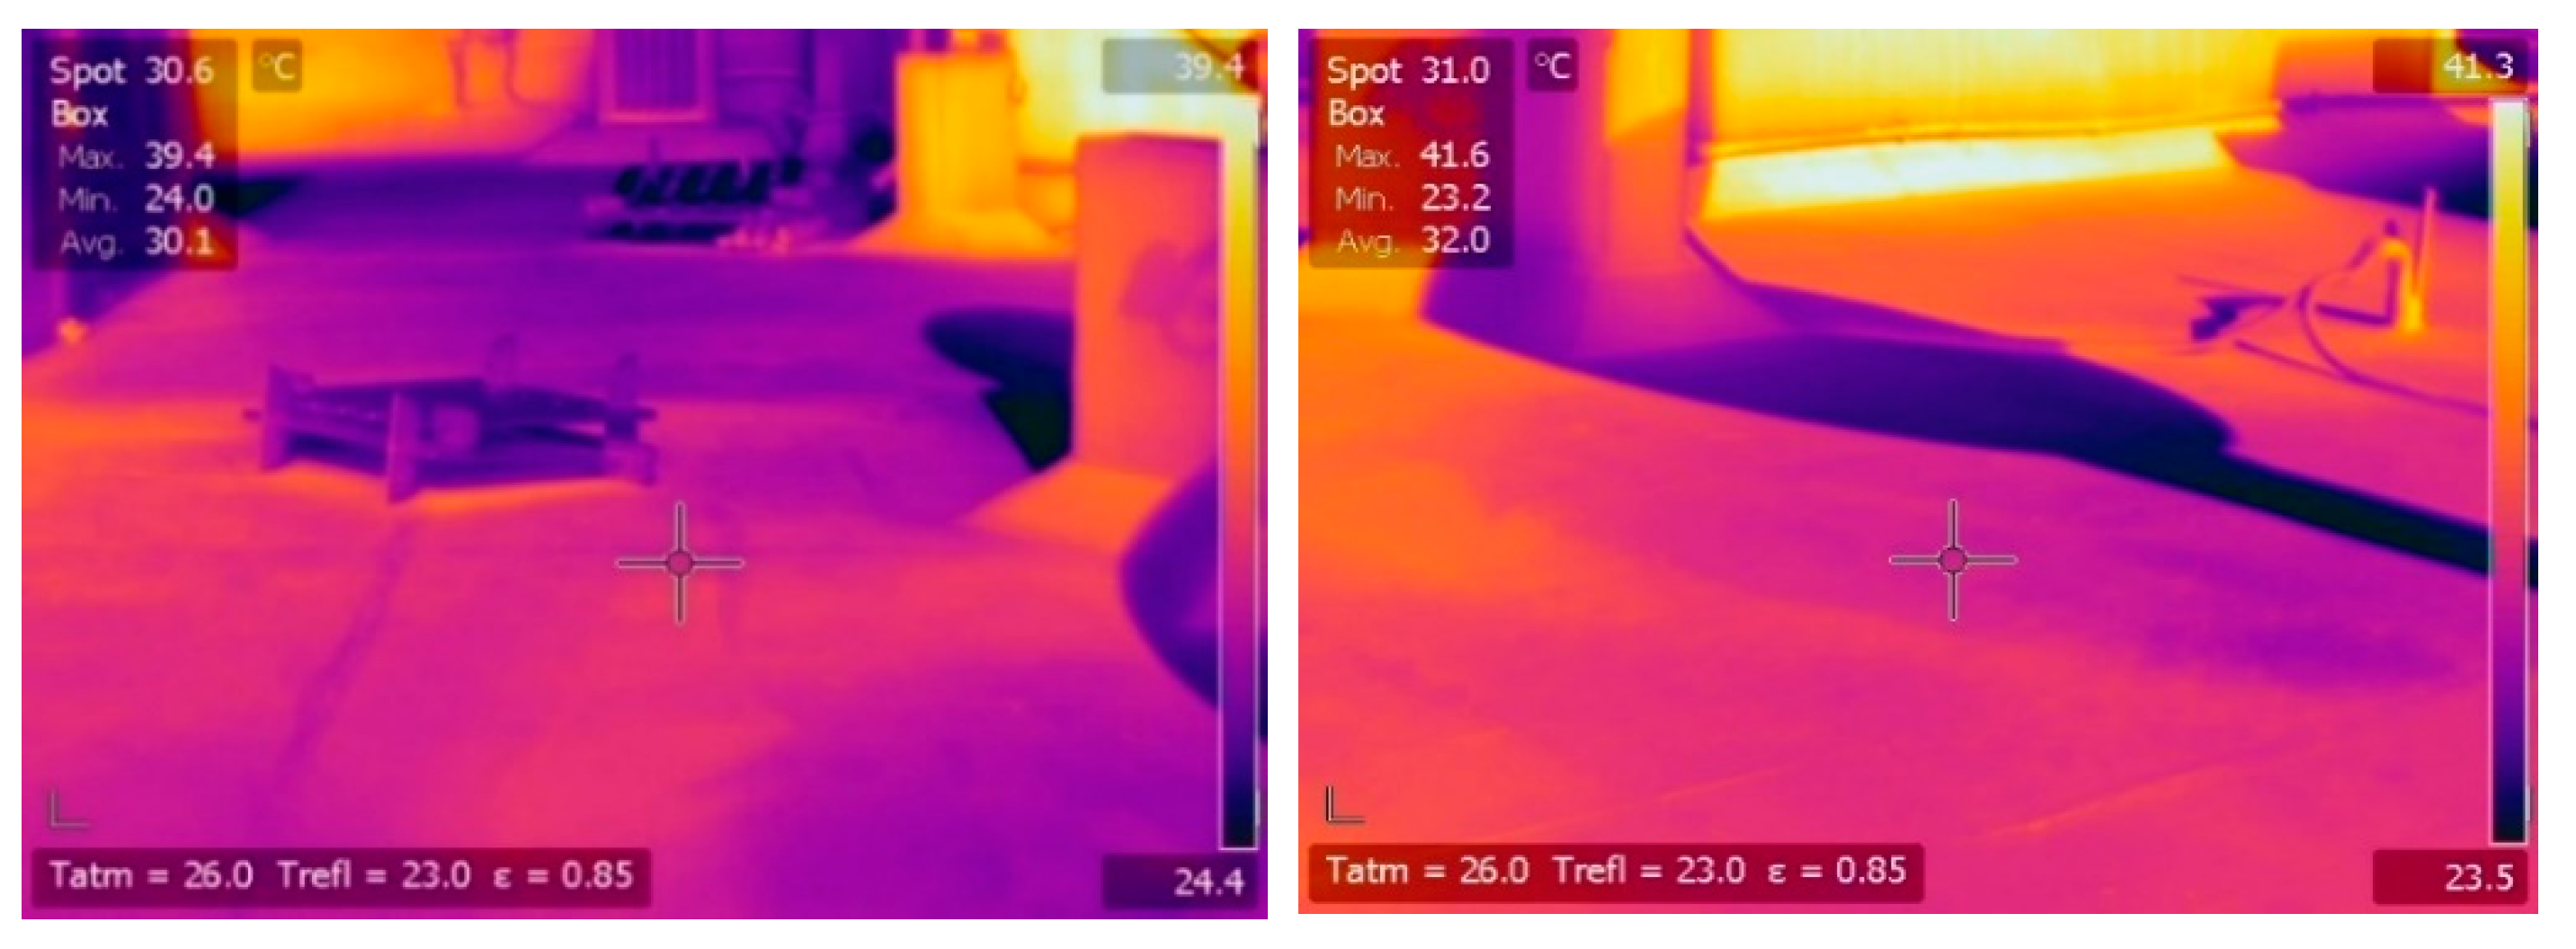
32]. Infra-red inspections are shown in
Figure 5.
Figure 5 also shows that the emissivity of both paints before and after the intervention is 0.85. This picture is taken on the roof of the second floor of the villa. A table of these values has been created in
Table 4.
3.5. Electricity Bills
Electric bill data is available from January 2017 to March 2018.
3.6. HVAC Configuration
The
Table 5 sows the parameter values used in the model and the last column shows the ones that were calibrated through Hone.
Based on this data, we were able to run the energy simulation in IES-VE and to start the calibration step.
3.7. Calibration
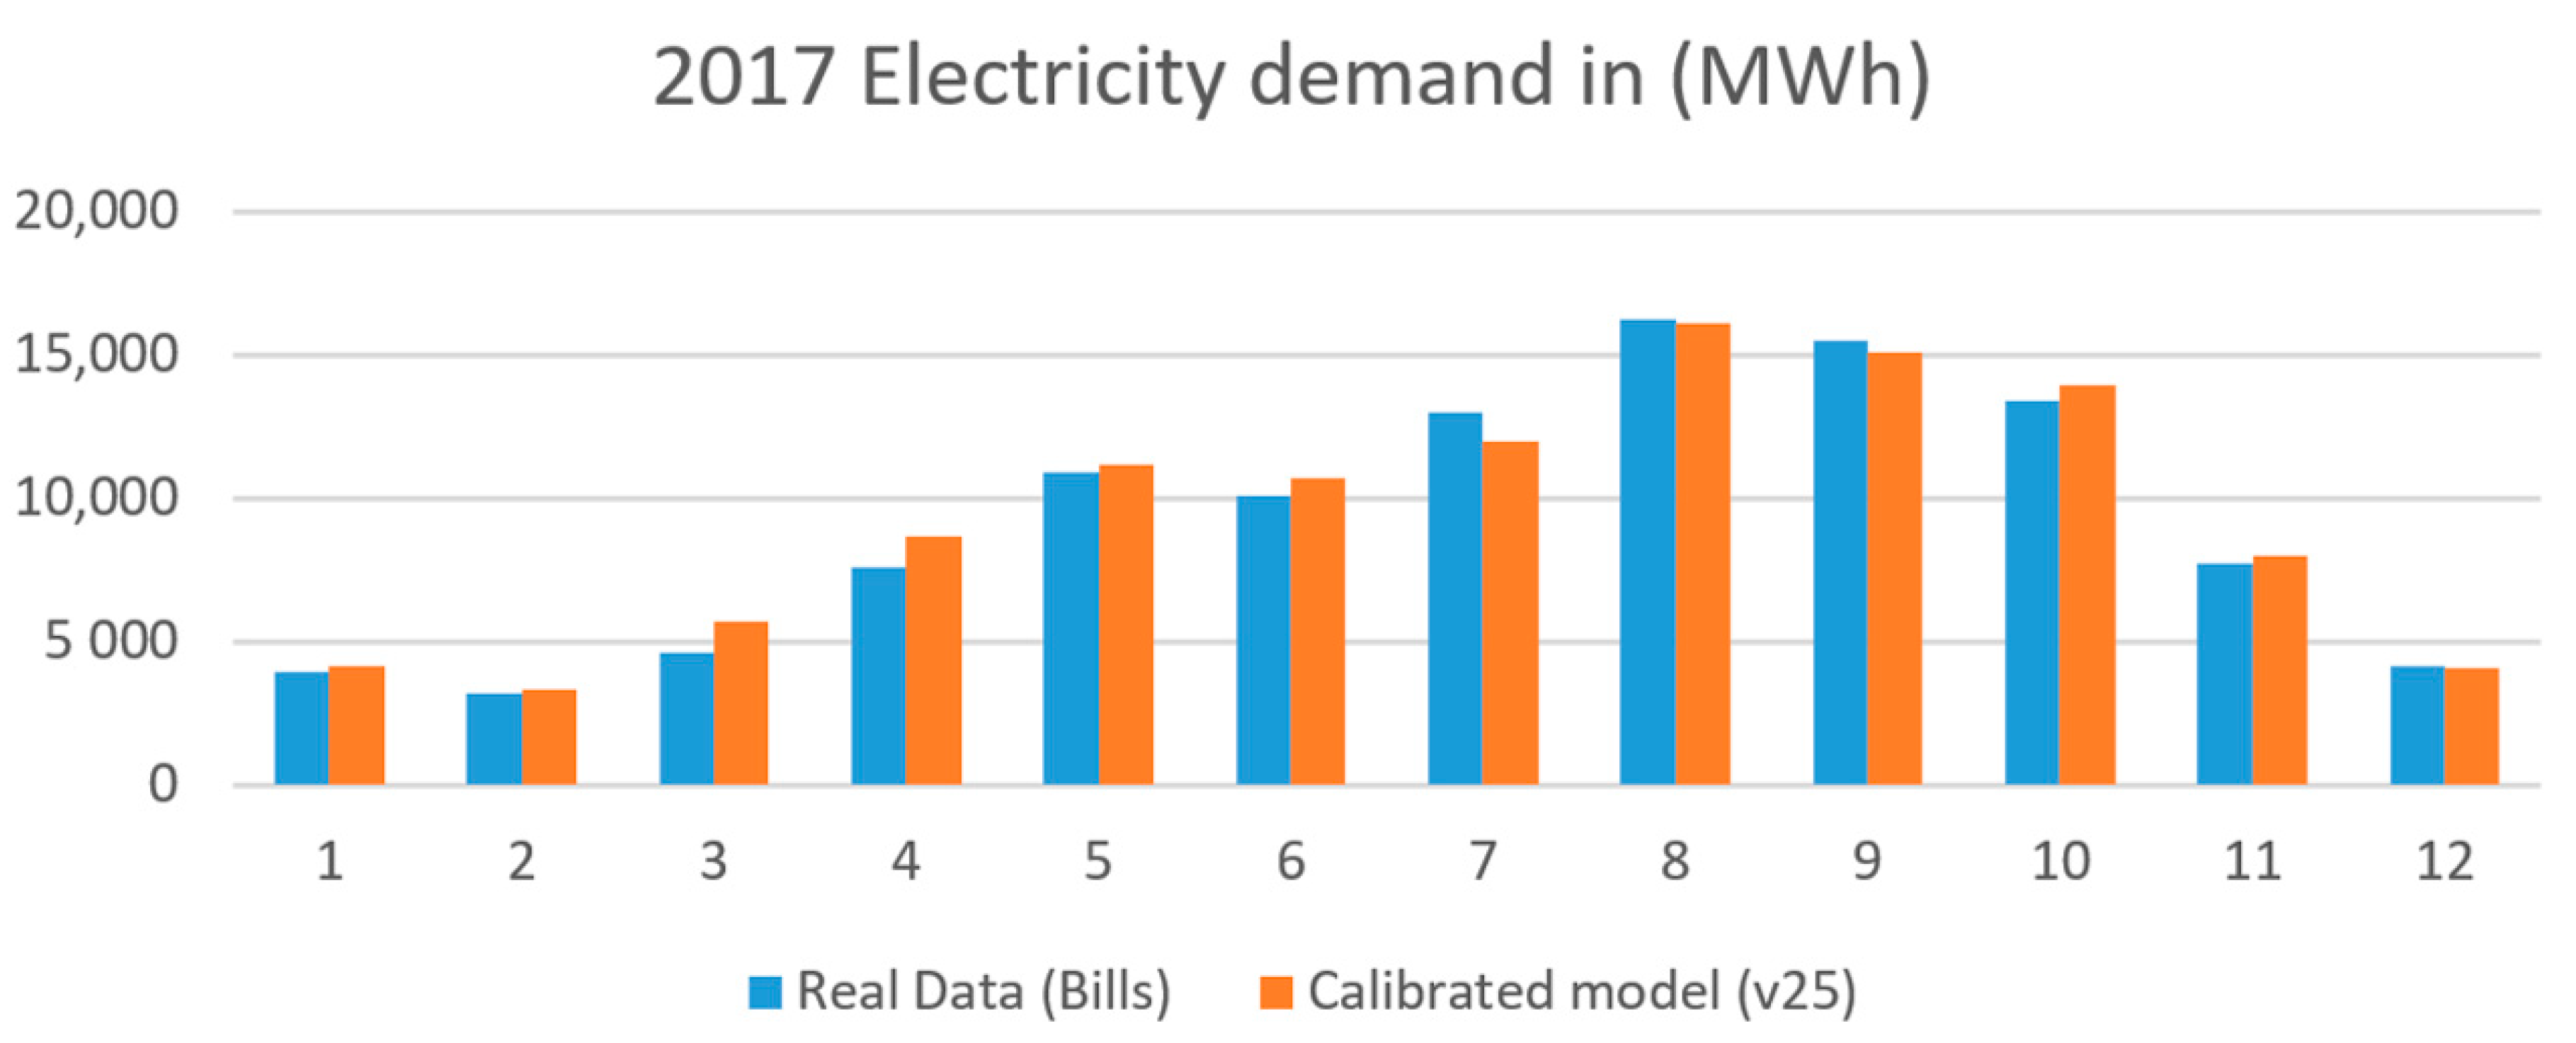
The following graph illustrates the monthly electricity demand during 2017 in both the real case and the calibrated simulation model (
Figure 6).
Calibration metrics used to assess the accuracy of the calibrated model together with their values can be seen in
Table 6. Notice that CVRMSE and NMBE are both under the limits that ASHRAE Guideline 14 considers acceptable for a calibrated model.
An overfitting test was also done using the three first months in 2018 to check for overfitting and to check if the values fall inside the uncertainty range. The following graph shows the real and calibrated data and the interval/range for the three first months in 2018 for a 95% confidence level. The graph below shows that the values for 2016 do fall inside the 95% confidence interval (
Figure 7).
3.8. Retrofit Scenarios
The first part of the analysis consisted of building the base case, the main reference model of the villa. The next step consisted of analysing the different scenarios applied to the main model, cool roof, cool walls, shading devices, window louvres and changing the cooling set-point. The retrofit analysis was done separately and then a second complete model included all the retrofit strategies together. The baseline model was the villa without any retrofit strategies applied to simulate a generic villa and try to understand the general trend of the main building typology present in Abu Dhabi (i.e. without shading devices, cool roof and cool walls). The wall property parameters are based on information received from the villa owner. The energy savings calculations are more complex in this case study due to the previous application of external shading that covers the east, south and west part of the building. The cool roof was applied in the middle of the autumn season (second half of this study). All this information is included in the calculations below.
4. Results
The scenario results from the energy model are:
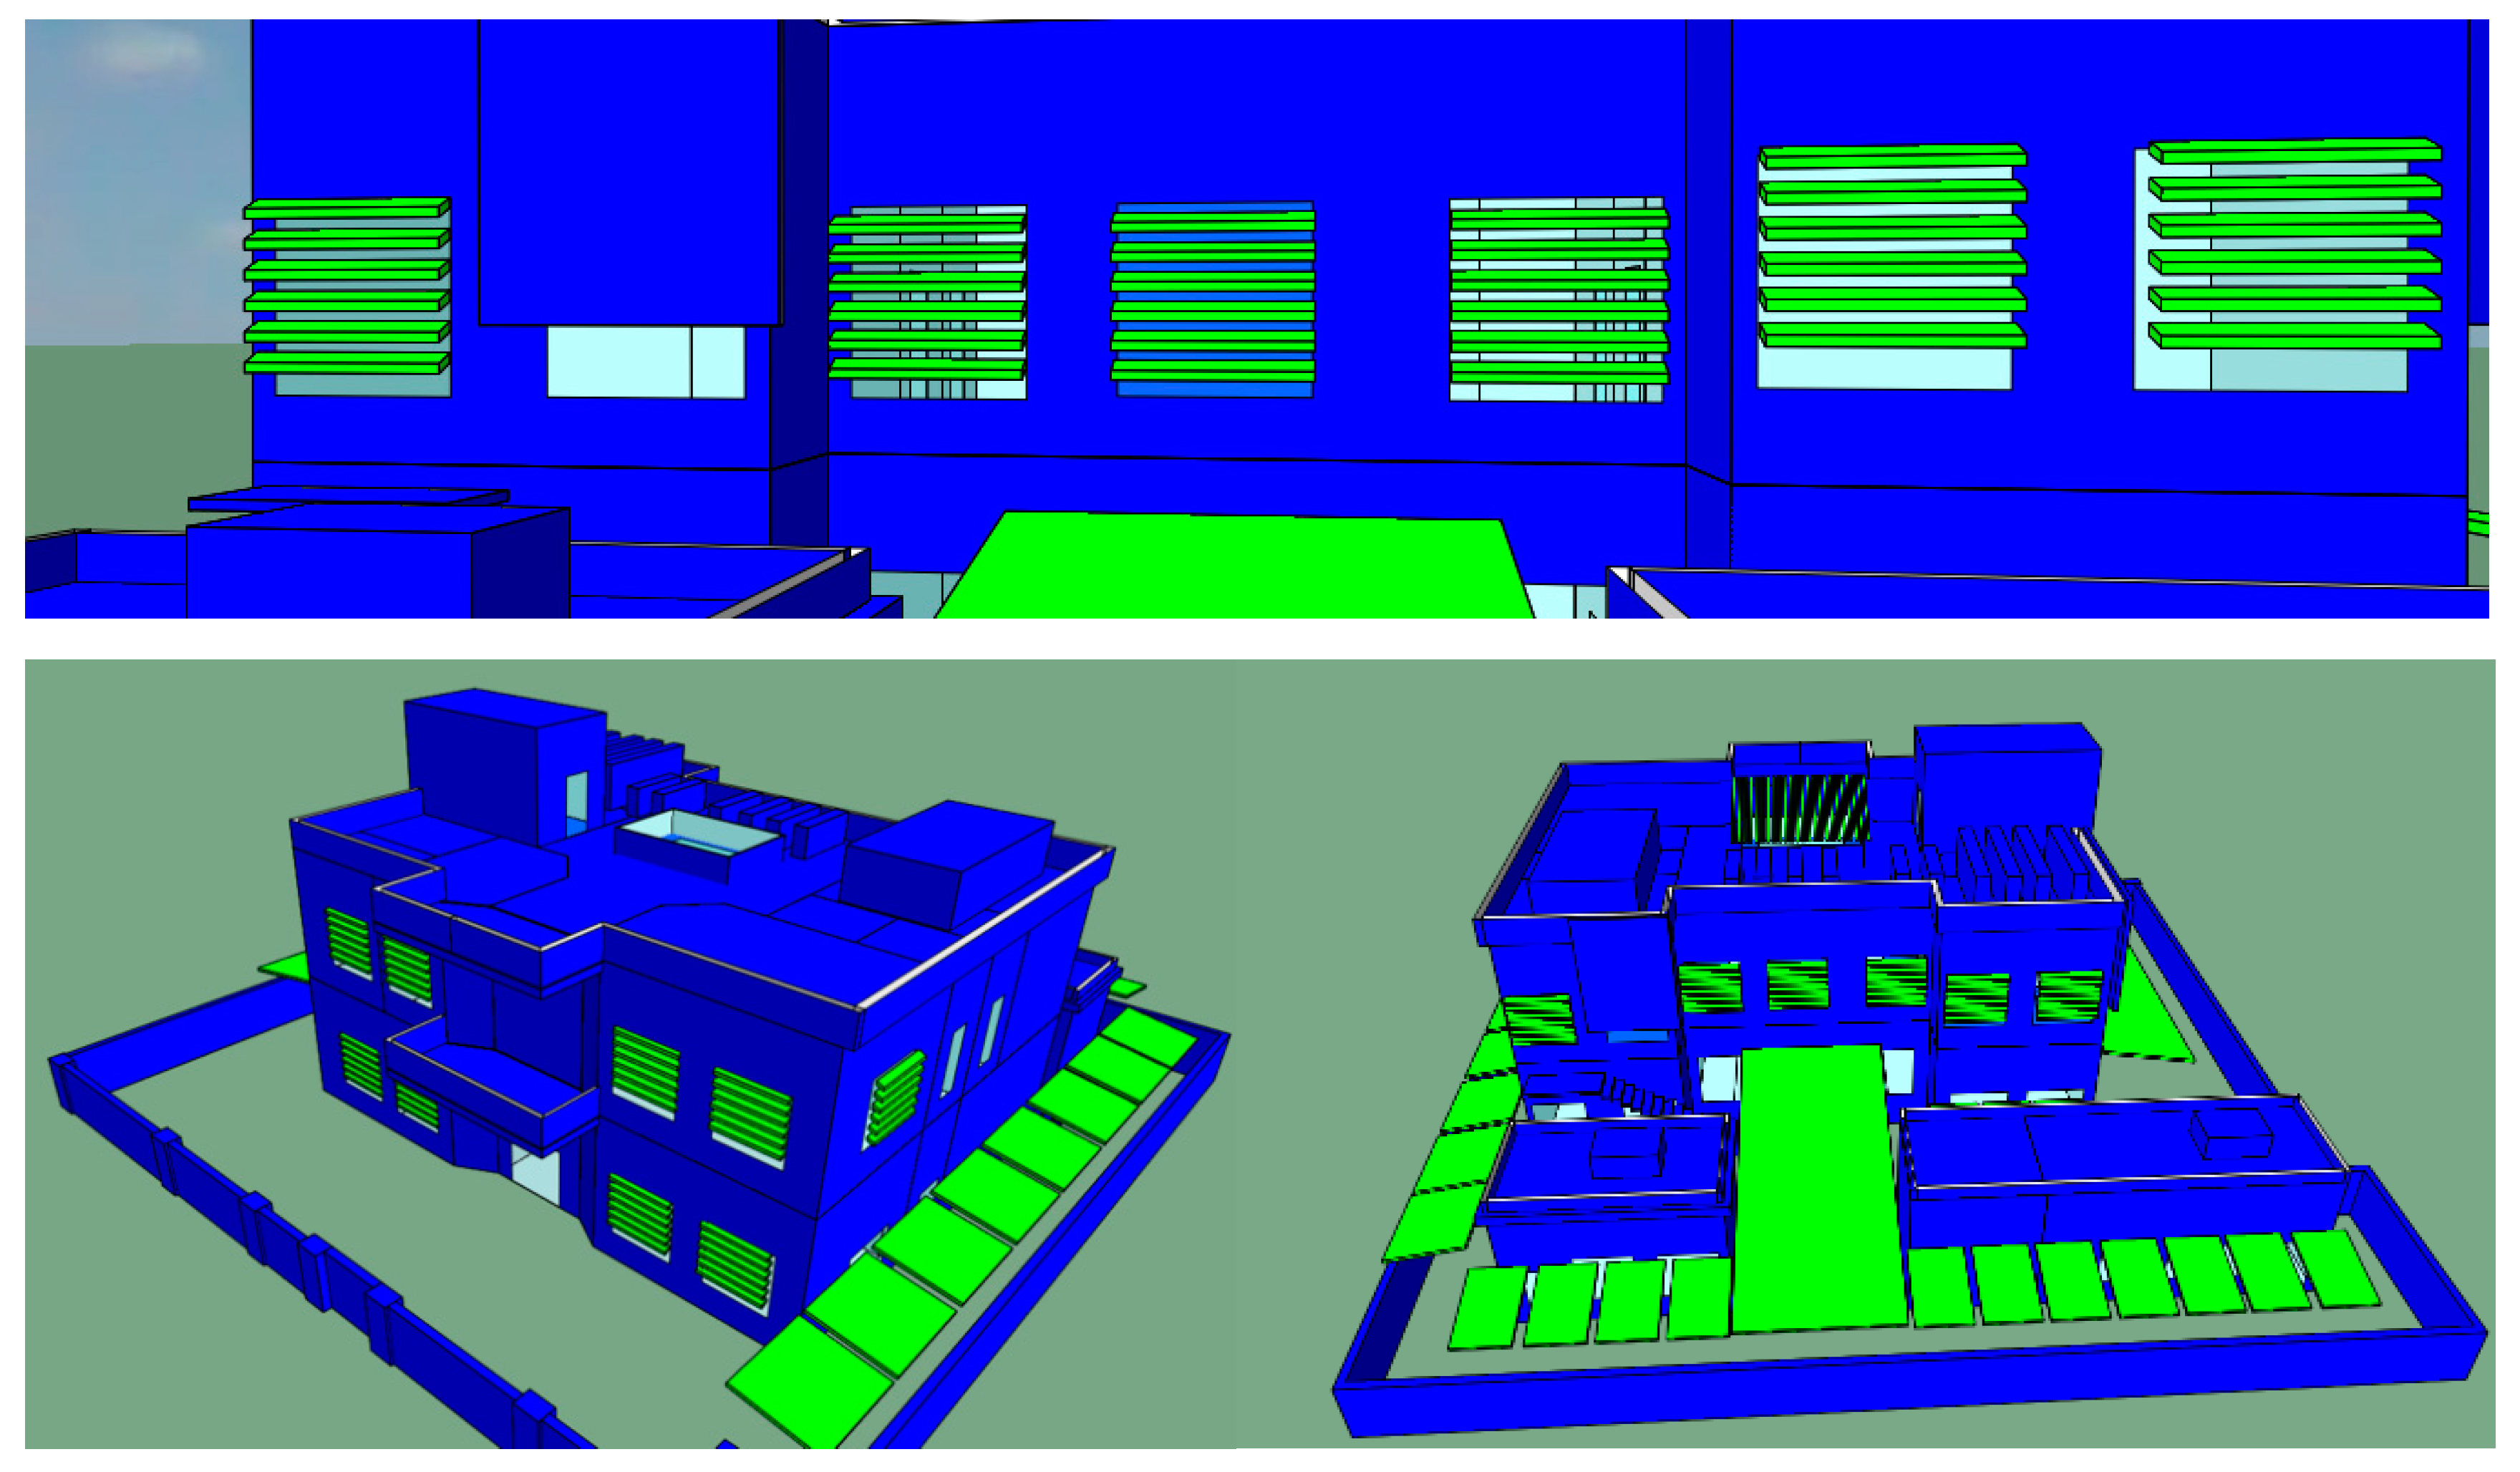
Shading: Introducing shading, as shown in
Figure 8 and
Figure 9, can reduce annual energy use by 2.9%.
Cool Roof: Adding cool paint to the roof (i.e. changing the Roof Solar Absorbance from 0.7 to 0.3 and the U-value from 1.29 to 1.01) can reduce the annual energy use by 3.85%.
Cool Walls: Adding cool paint to the walls (i.e. changing the Roof Solar Absorbance from 0.7 to 0.3 and the U-value from 1.98 to 1.59) can reduce the annual energy use by 8.4%
SSEER: Improving the SSEER from 2.6 to 3.5 can reduce the annual energy by 20.3%.
Shading the Atrium: Including a lux levels analysis to account for artificial lighting when shading is not included. Adding shading to the sky-window of the atrium can reduce the annual energy use by 0.4%.
Lovers on windows: Including a lux levels analysis to account for artificial lighting when shading is not included. Adding external louvres to the windows can reduce the annual energy consumption by 2.8%.
Infiltration Rate: Reducing the infiltration rate from 0.21 to 0.1 can reduce the annual energy by 1.2%.
In
Table 7 is mentioned the total electricity consumption by comparing retrofit strategies and the current situation in the building for the different months of the year taken into the study.
From having no retrofit strategies to having all of the retrofit strategies mentioned above, the reduction in annual energy consumption is 34% of which 29.8% is what can still be achieved, as the cool roof and shading were already in place. Using the weather station located on the rooftop of the villa had a significate impact on the building energy simulation results. Yearly differences between the same model using rural and villa weather data are around 7%, which is higher than some of the retrofit strategies assessed. The economic analysis shown in
Appendix A shows if all the retrofit strategies applied together Internal Rate of Return (IRR) is 4% for a considered time of 20 years. This value does not include other benefits deriving from the retrofitting strategies such as the indoor and outdoor thermal comfort improvement, the increase of the real estate value, the reduction of the carbon footprint of the building, etc.
To select optimal retrofit strategies among the proposed measures, the simple payback and Net Present Value (NPV) are considered. Simple payback calculation is easy and fast to compare economic value for the proposed strategies. However, it does not consider the holding period of a strategies/investments. (we need to provide the reference in here) Therefore, NPV, which takes account in to the holding period of strategies/investments, is considered to select the optimal strategies within 20 years. The simple payback analysis shows when the payback of the strategies are over 20 years, it would not consider as optimal strategies. Same when the NPV values of the strategies remain in negative value on 20 years, these strategies should not include as optimal strategies (
Table 8).
Based on simple payback and NPV studies (in
Table 8), it shows the optimal strategies for given case study villa are cool roof, cool walls, SSEER, and atrium shades. According to the
Table 8 result, it shows that implementing all proposed strategies would not recommend due to the NVP still remains a negative value after 20 years implementing even Simple Payback is within 20 years limit.
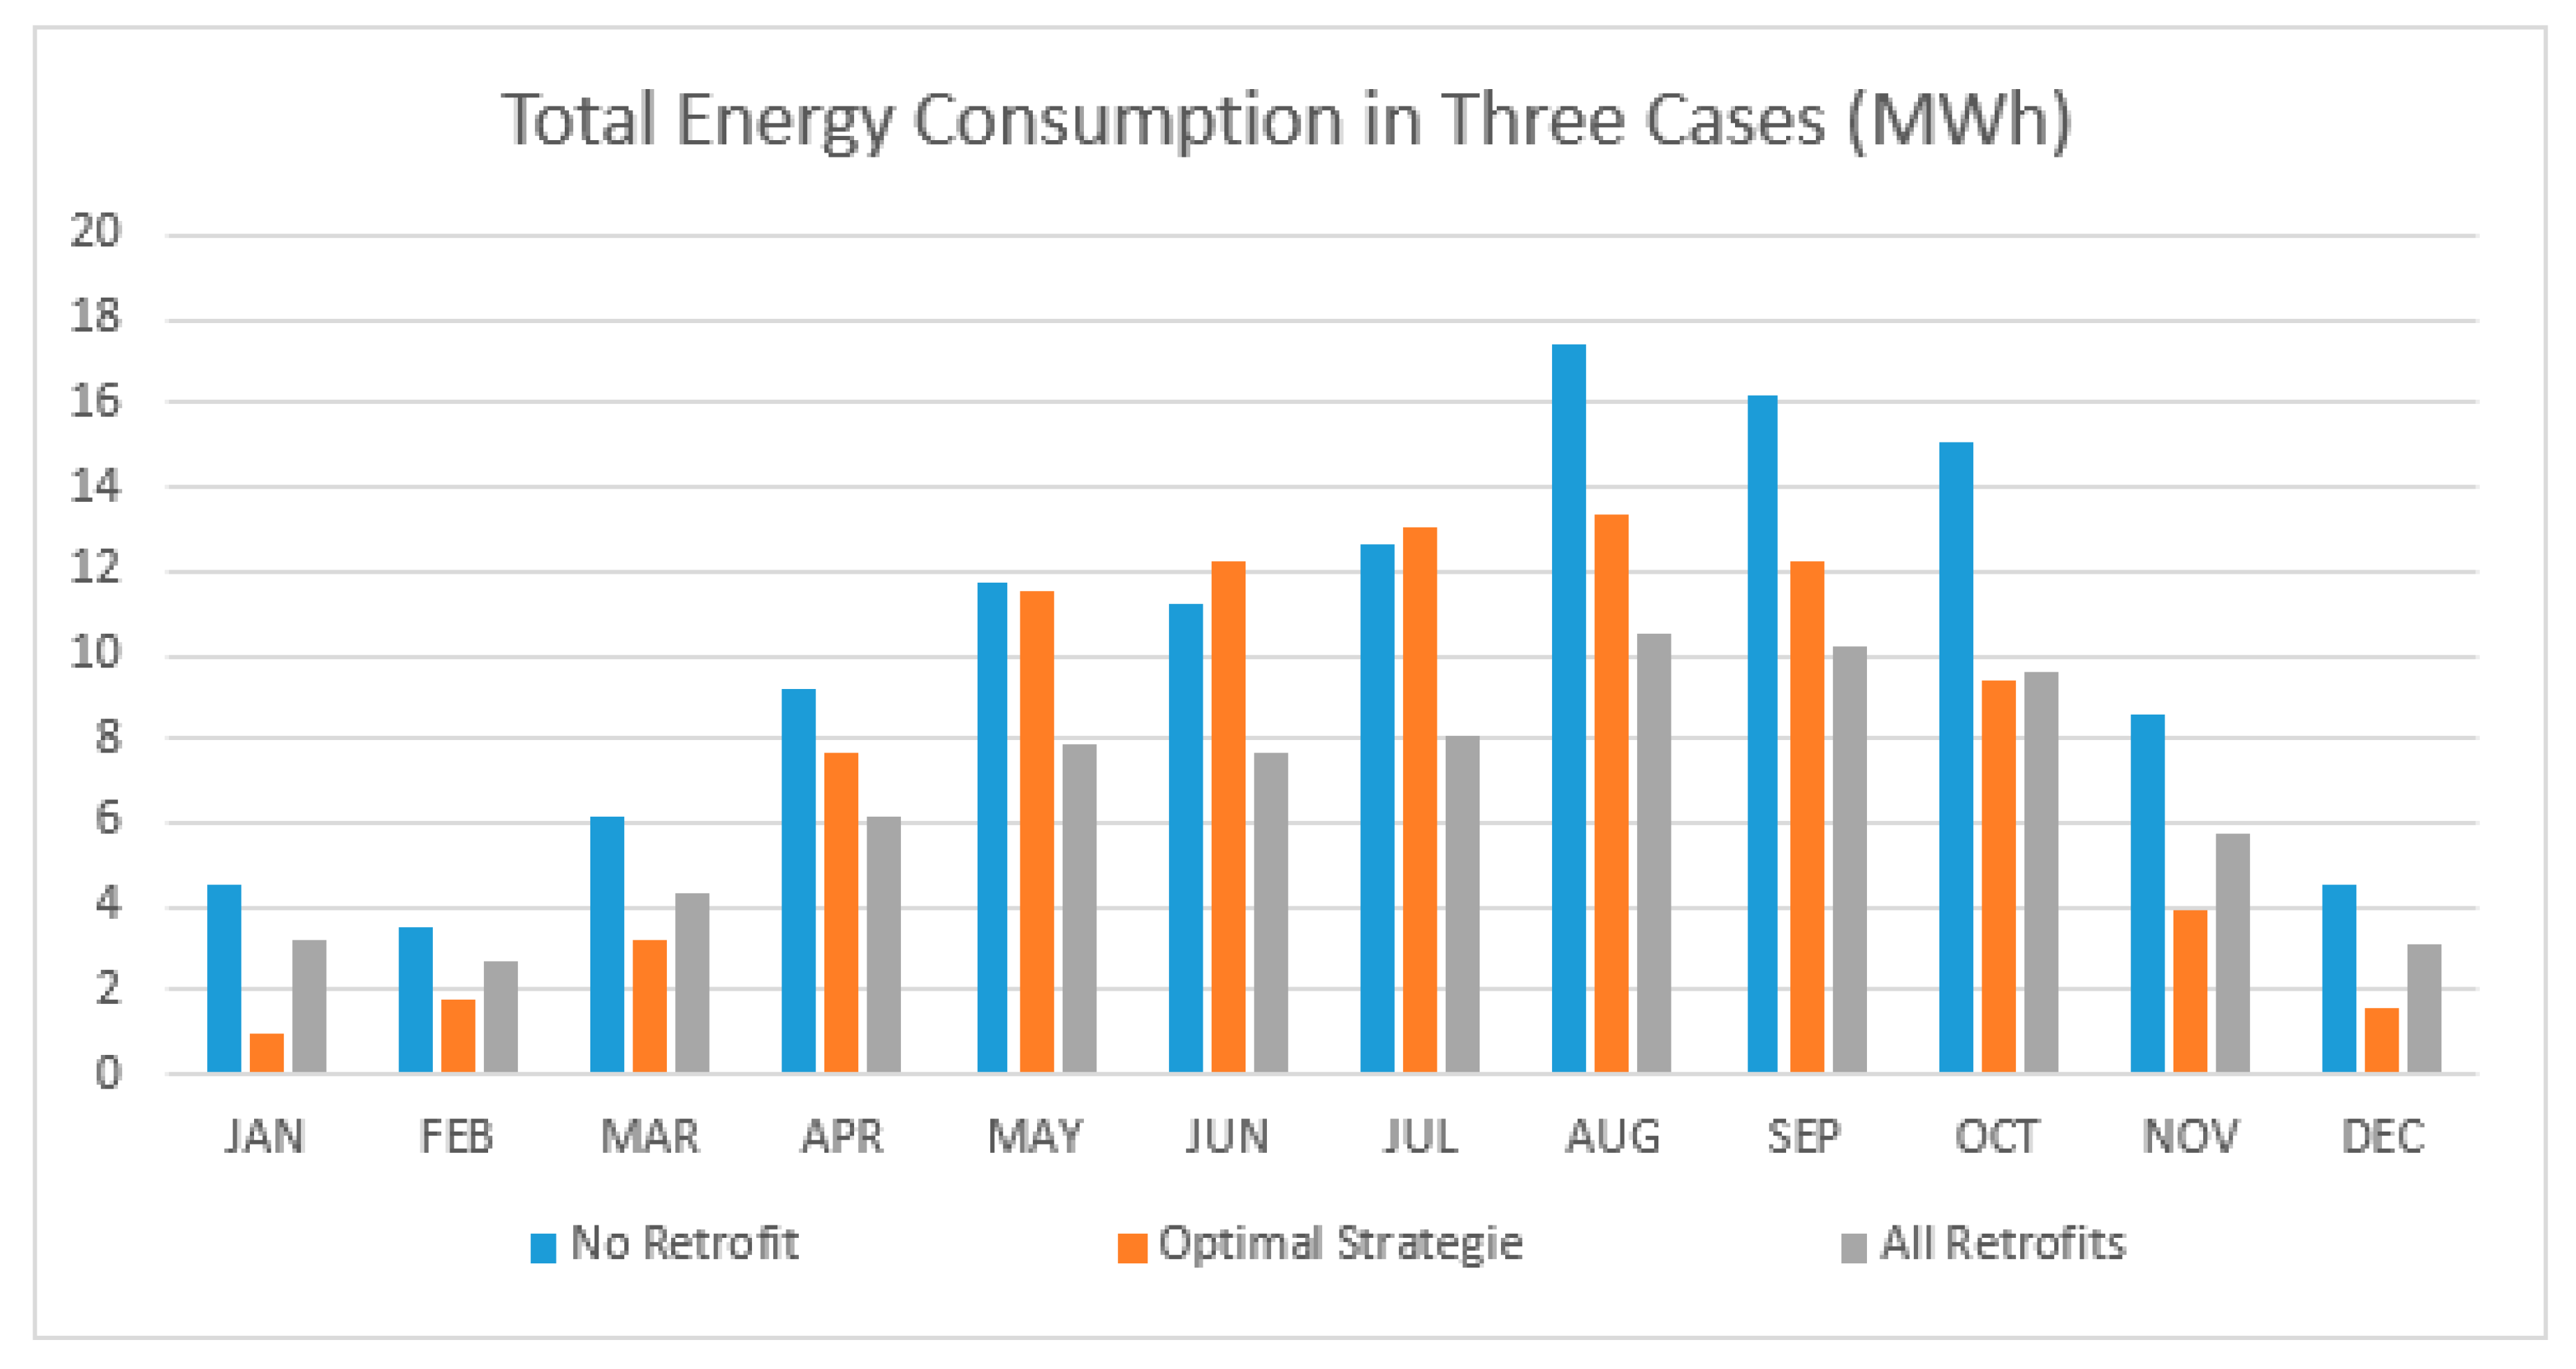
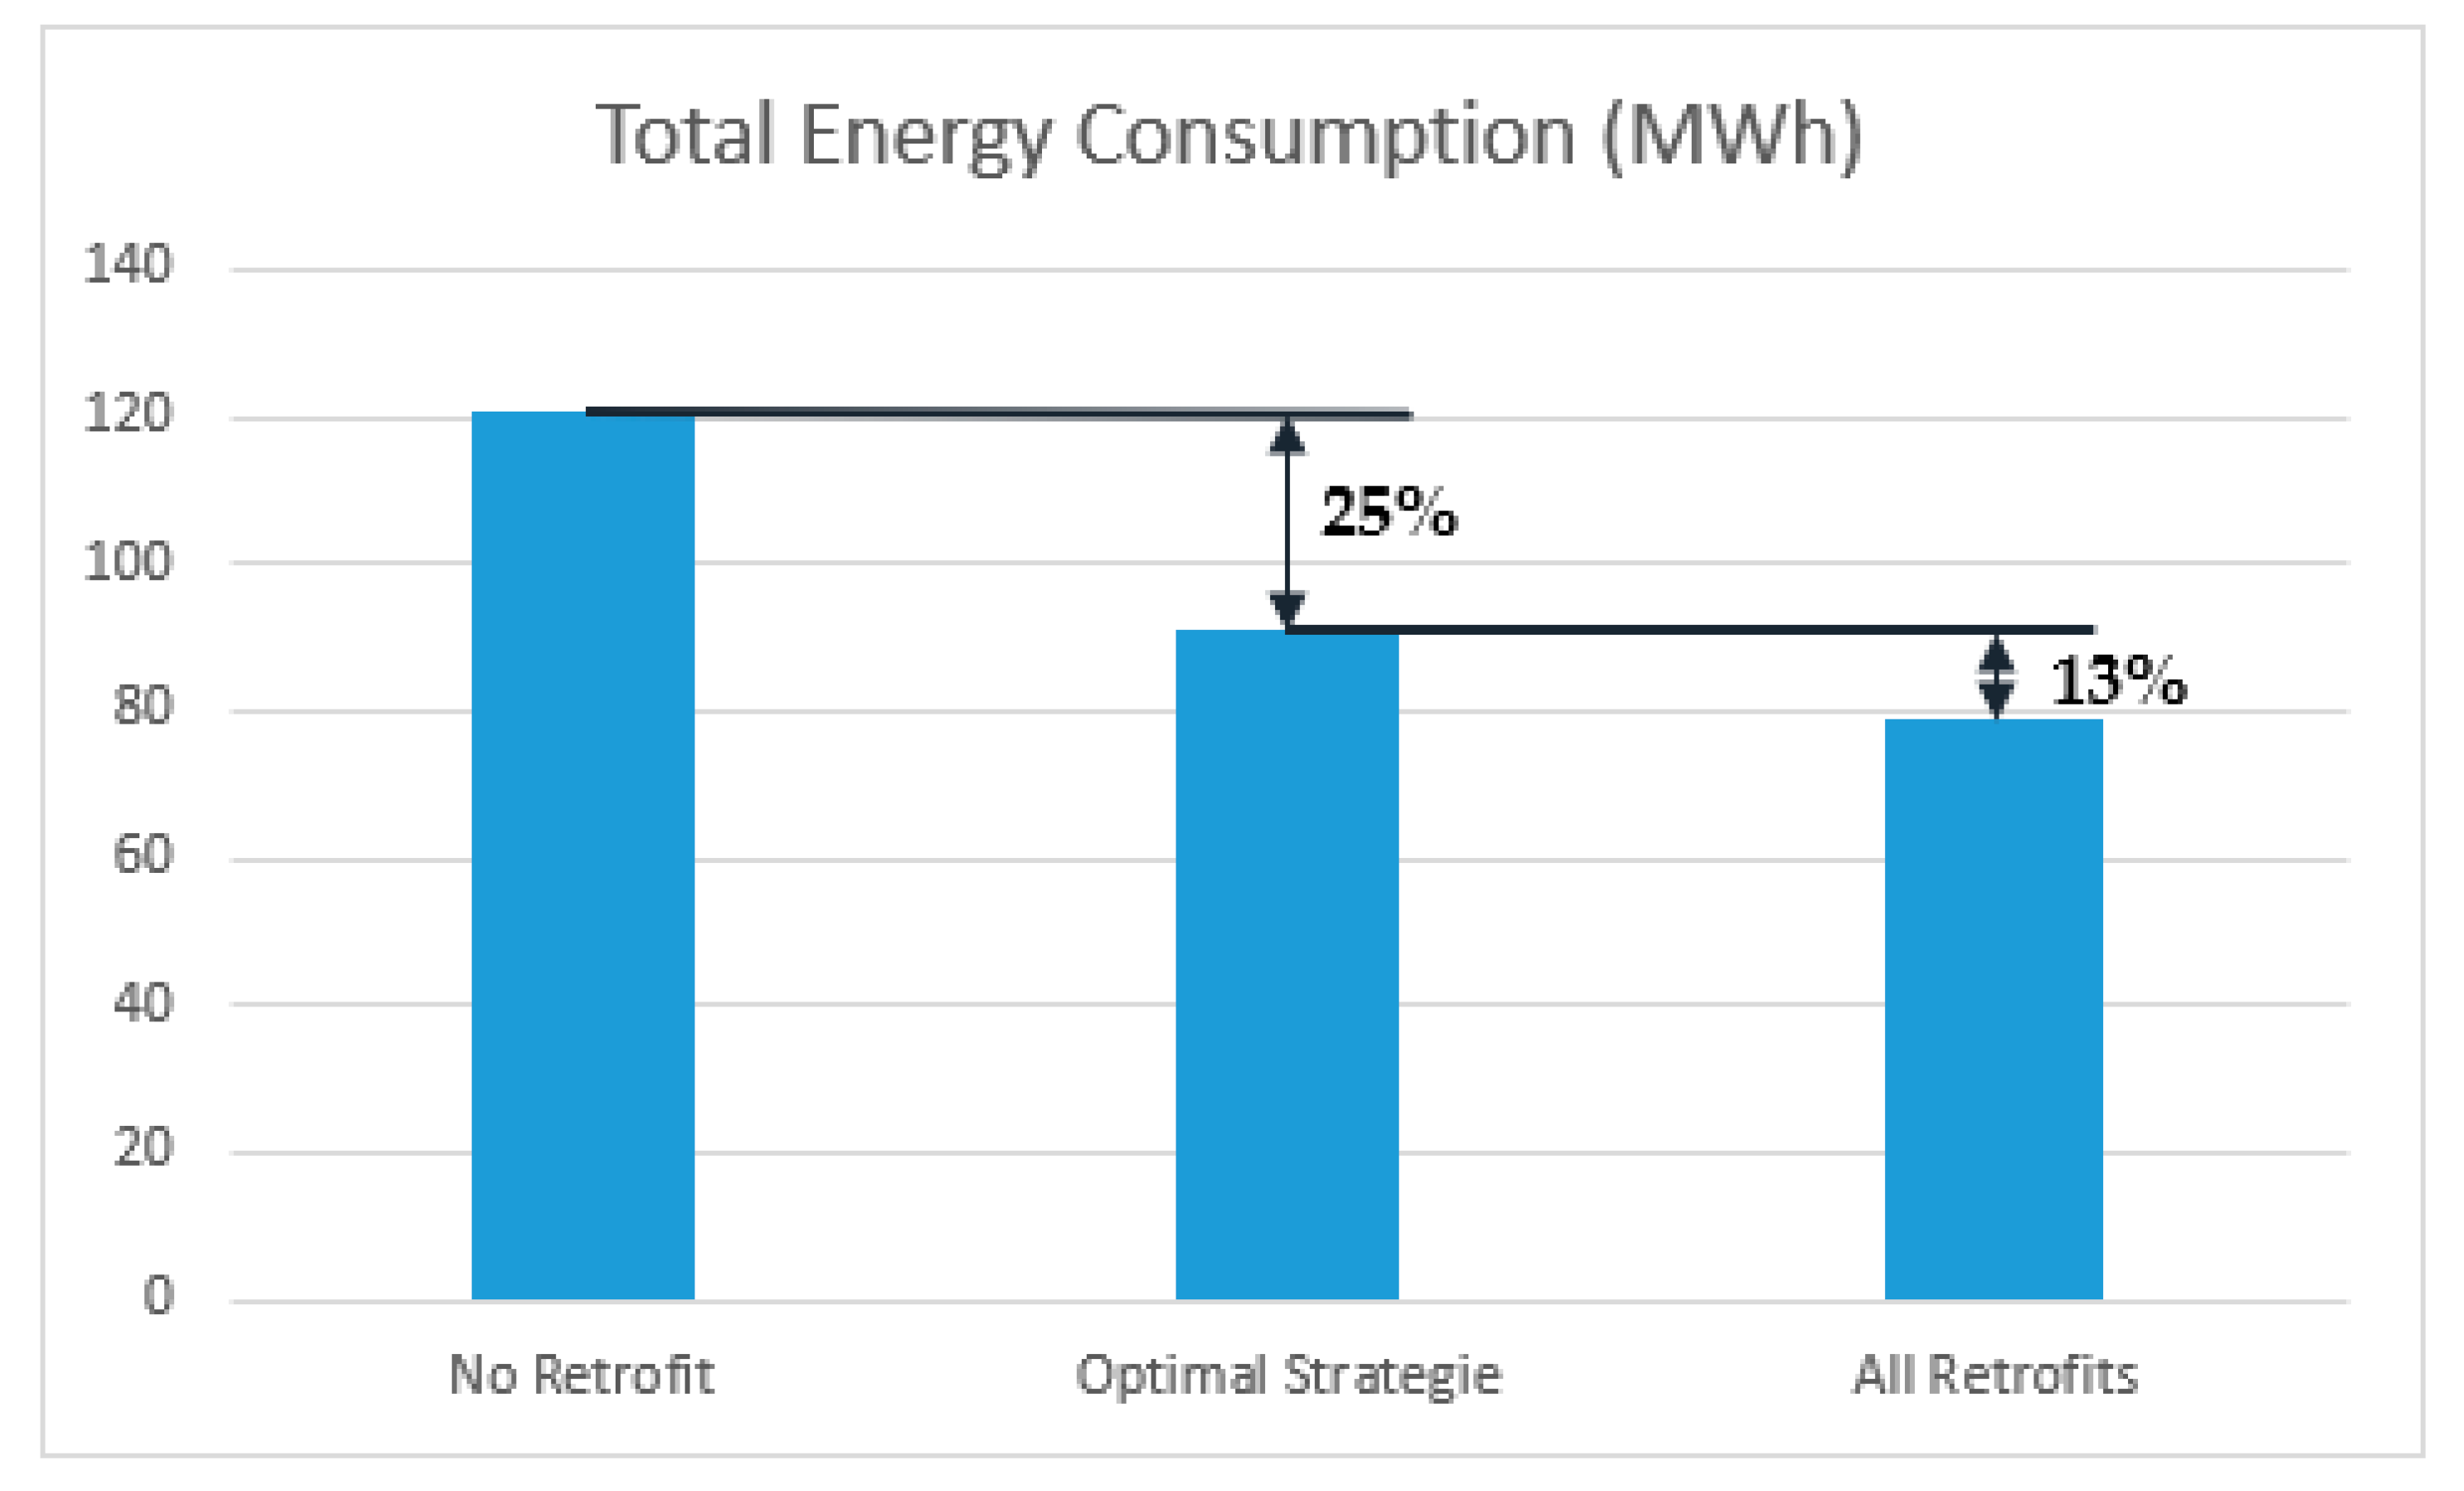
After selecting the optimal strategies based on NPV studies, using IES - VE to run energy consumption simulation again, and the comparison results between No retrofit strategies, Optimal strategies and All strategies are in
Figure 10 and
Figure 11.
From No retrofit case to Optimal strategies case, the reduction in annual energy consumption is 25% and annual energy consumption from Optimal strategies to All retrofits, it increases by 13% (in
Figure 11). When it compares between Optimal case and All strategies case, increasing the energy consumption in Optimal case mainly causes by solar gain through the windows due to the optimal strategies case does not recommend to having external shadings and window louvers in the case study villa (based on
Table 8 and NPV results).
5. Discussion
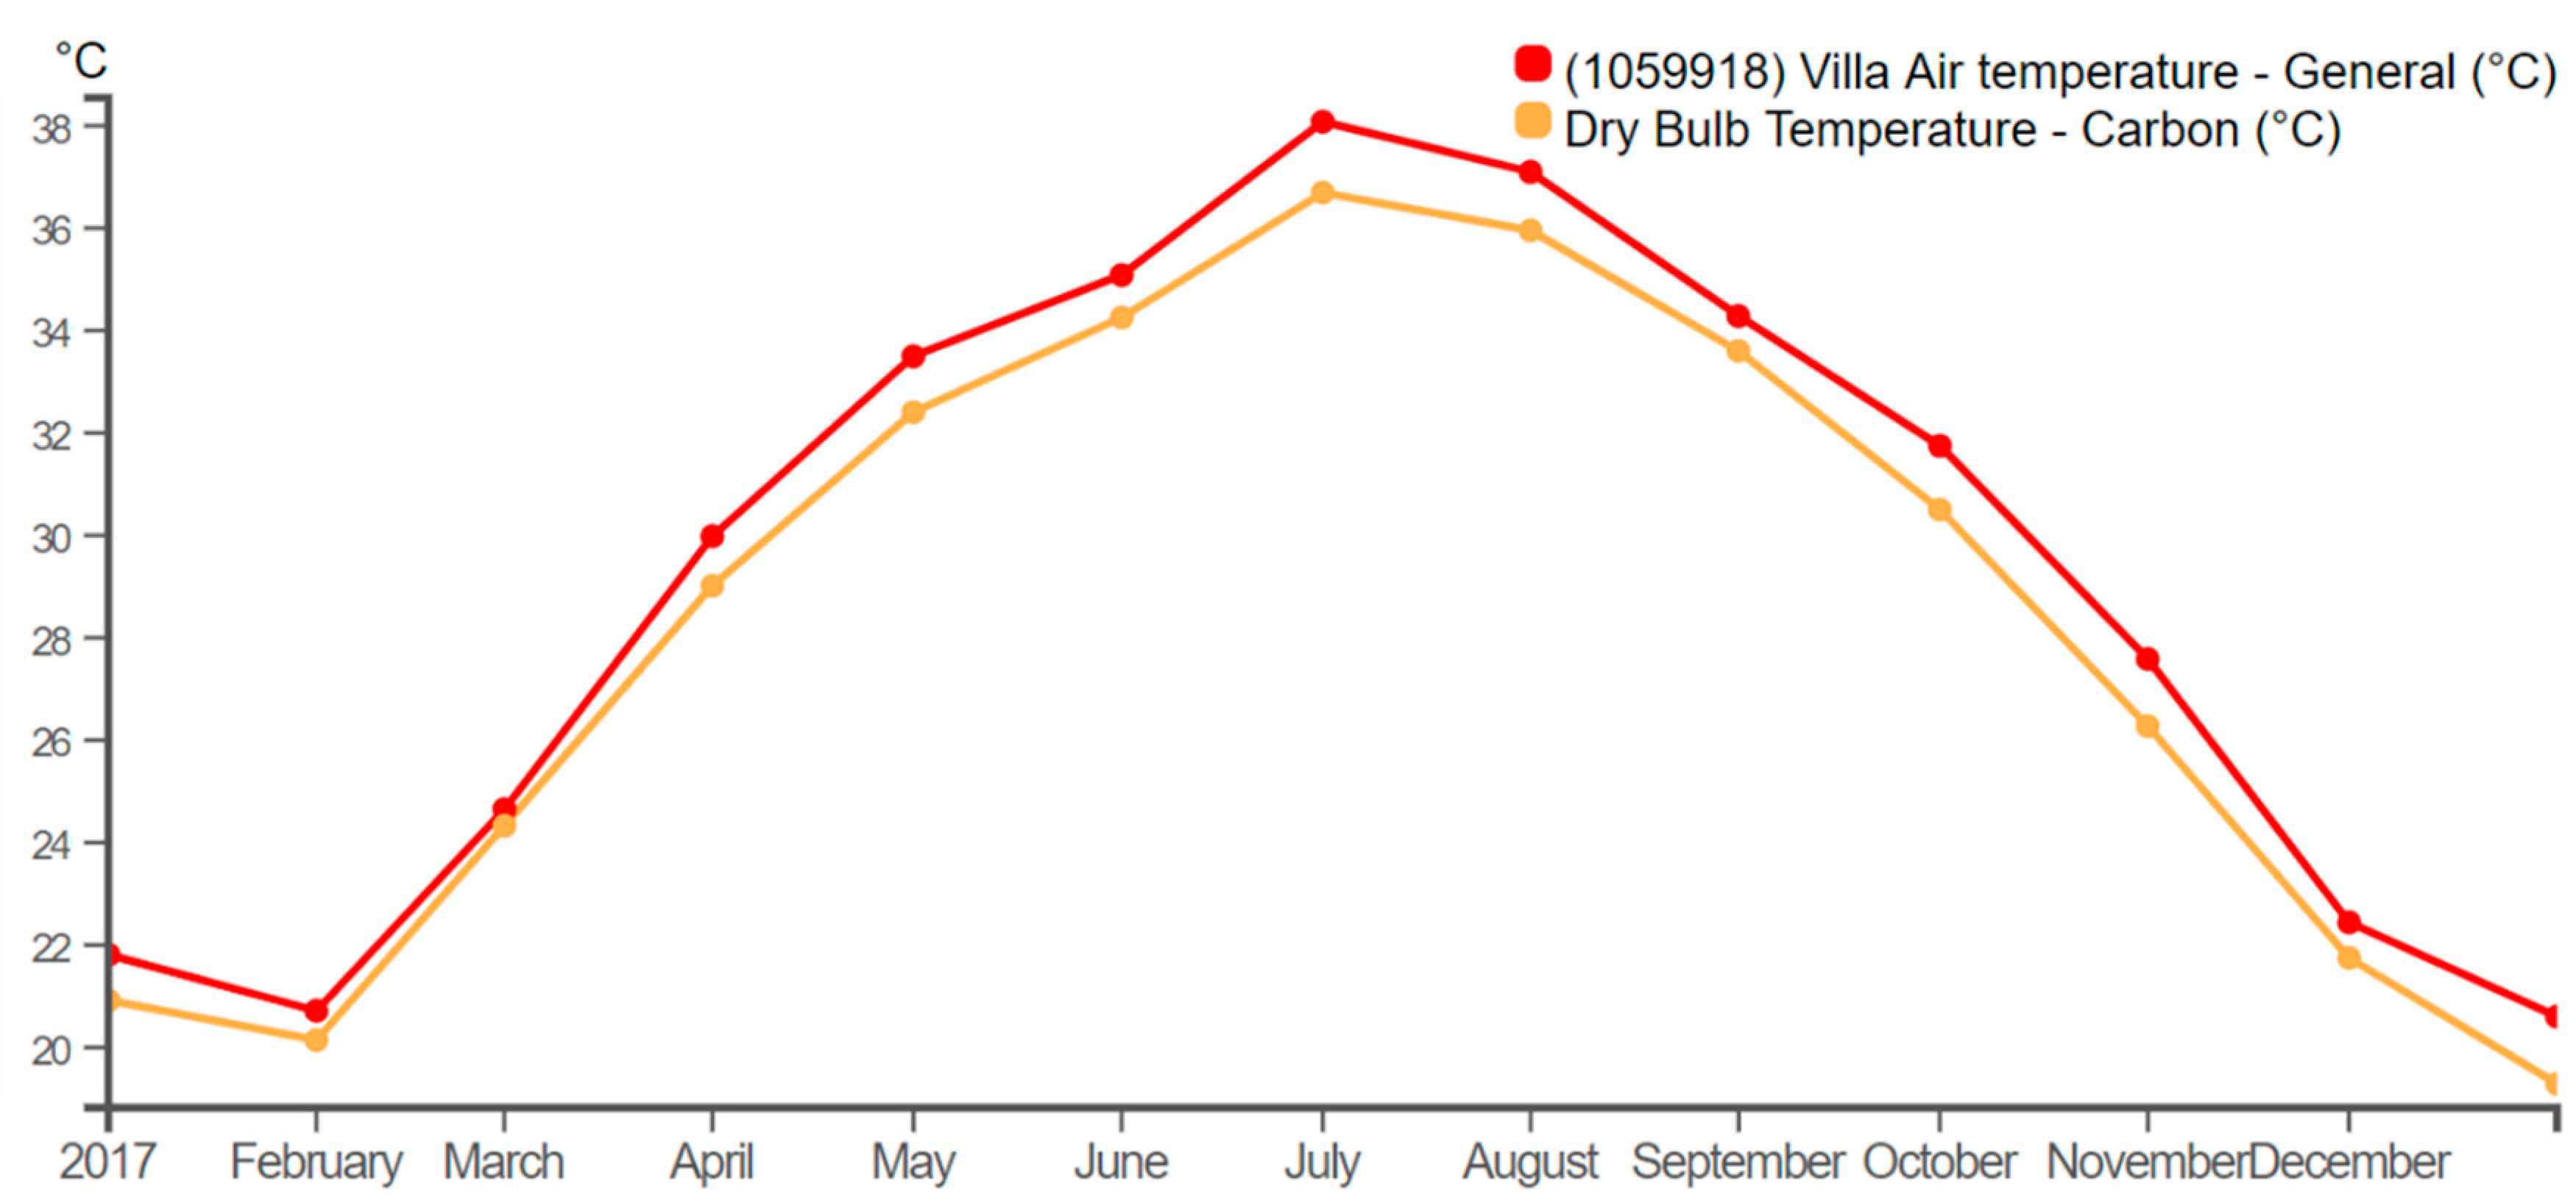
After the calibration process, we obtained a −2% in the NMBE and 7% in CVRMSE. Although further reductions in these metrics could have been achieved, we decided not to continue to avoid model overfitting. Following good calibration practices, an overfitting test was carried out using three additional months that were not used during model calibration. Regarding the retrofit scenarios, side effects of shading devices, such as improved outdoor comfort from external shading, were not assessed, but it might, in turn, reduce the need to lower the cooling setpoints for occupants’ comfort. According to the calibrated model, increased urban temperatures cause a 7.1% increase in total energy consumption, as presented in
Table 9. These differences are explained by differences in air temperatures, the monthly average dry-bulb temperature for rural and urban weather during 2017 is presented. Differences between on-site and rural temperatures range from −3 to +5°C.
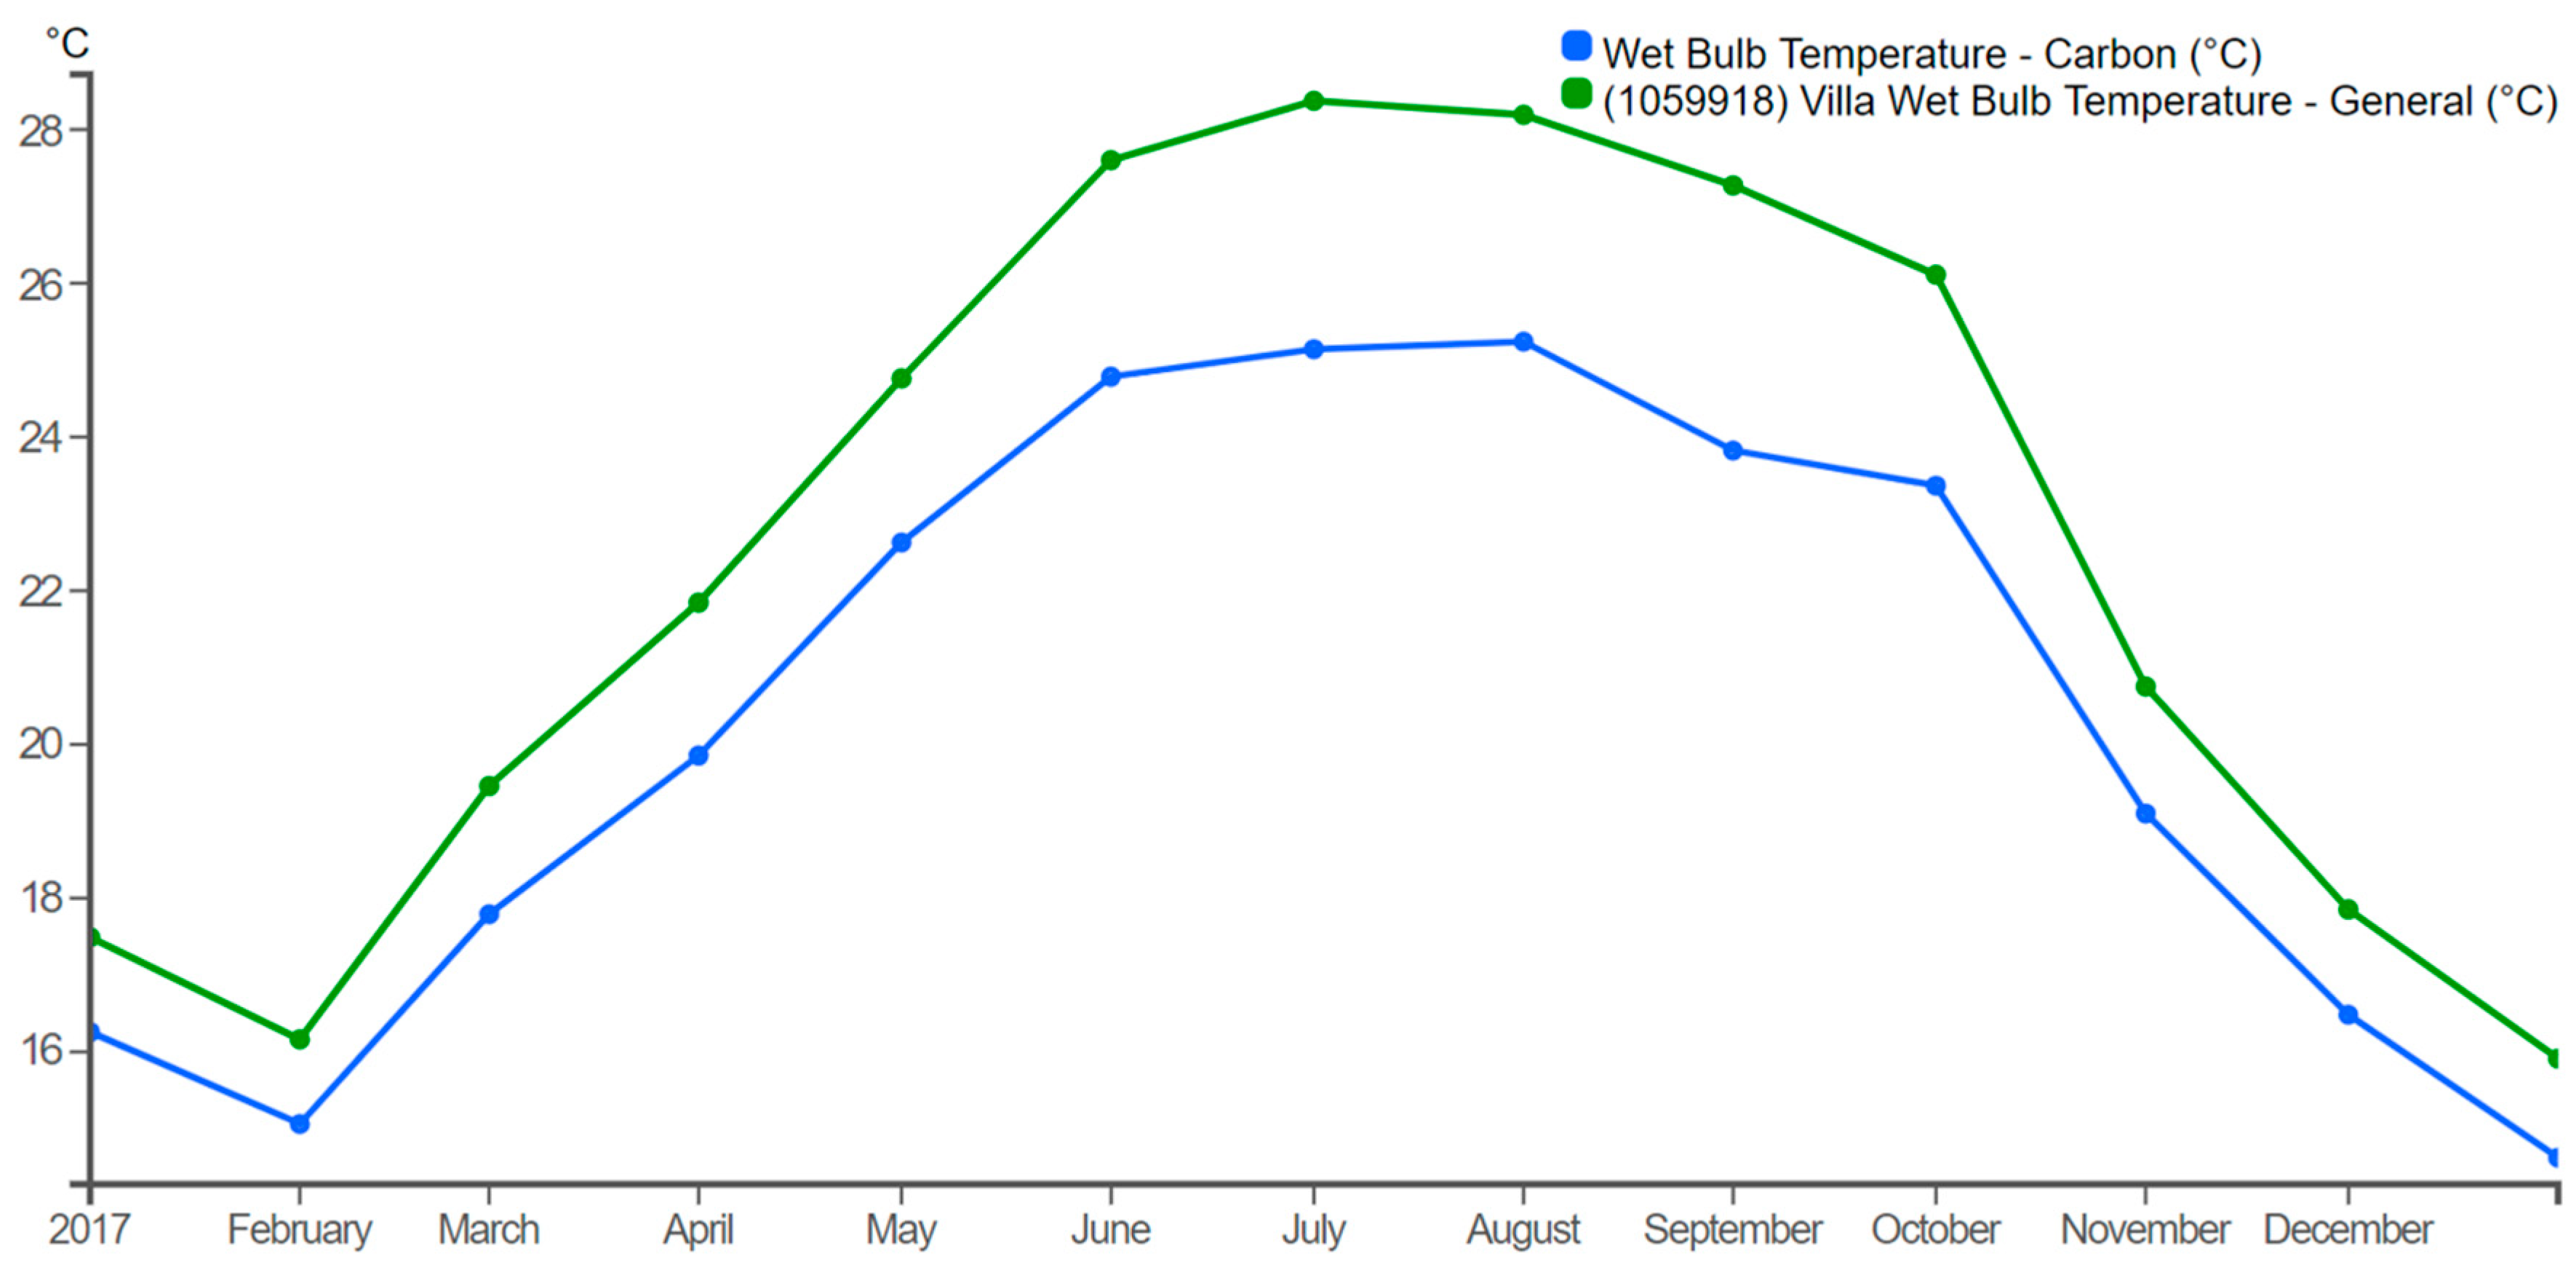
Figure 12 shows the villa air temperature versus dry bulb air temperature and
Figure 13 shows wet bulb temperature versus wet bulb temperature.
6. Conclusions and Future Work
Cities in the Middle East are experiencing rapid growth and in Abu Dhabi, diverse efforts have been put in place to reduce cooling demand in buildings for new construction. In this paper, we discussed energy efficiency measures to reduce cooling demand in typical residential buildings in Abu Dhabi. The most common residential building typology in Abu Dhabi is the villa. We studied the impact of retrofit strategies in a typical villa using energy models. IES-VE, Hone tool and parametric tool software was used. Construction properties, operational schedules, weather, and utility bill information were available and they were indispensable for this study. Starting from these characteristics, we were able to simulate the villa energy consumption in a way that is very close to reality.
The optimal strategies for given case study villa are cool roof, cool walls, SSEER, and atrium shades. This combination of strategies proposed in this study shows that the total energy saving can be reduced to 25%. Further studies need to be done in improving the software for the optimum performance of the strategies.
Retrofit strategies have a positive impact on building performance. Reduction in annual energy consumption was 34%. Furthermore, the UHI effect plays has a role in estimating the savings. When the UHI is not taken into account, the effectiveness of the proposed retrofit strategies is underestimated by approximately 7%.
Author Contributions
The author contribution is as following: conceptualization, L.B. and A.G.C., methodology, L.B.; software, A.G.C.; validation, Y.K.K., M.F.R. and M.G.C.; formal analysis, A.A.; investigation, A.G.C.; resources, L.B.; data curation, A.A.; writing—original draft preparation, L.B. and A.G.C.; writing—review and editing, L.B., A.G.C. and Y.K.K.; visualization, L.B. and A.G.C.; supervision, A.A.; project administration, L.B.; funding acquisition, L.B.
Funding
This research received no external funding.
Acknowledgments
The authors of this study acknowledge the great support of the nursery team and the Managing Director.
Conflicts of Interest
The authors declare no conflict of interest.
Appendix A
Table A1.
Material Cost Analysis.
Table A1.
Material Cost Analysis.
| Material Cost Analaysis |
|---|
| No. | Strategy | Material Cost | Maintanace Cost for 15 Years | Total Cost |
|---|
| 1 | Shading elements | 10,000.00 | 2000 | 12,000.00 |
| 2 | Cool Roof | 1750.00 | 350 | 2100.00 |
| 3 | Cool Walls | 3750.00 | 750 | 4500.00 |
| 4 | SSEER | 3750.00 | 750 | 4500.00 |
| 5 | Infiltration rate | 750.00 | 150 | 900.00 |
| 6 | Atrium Shade | 1000.00 | 200 | 1200.00 |
| 7 | Window louvres | 2000.00 | 400 | 2400.00 |
| 8 | All strategies | 23,000.00 | 4600 | 27,600.00 |
Table A2.
Energy savings.
Table A2.
Energy savings.
| Energy Savings |
|---|
| No. | Strategy | KW/Year | Cost/KW (eur) | Total Savings/Year (eur) |
|---|
| 1 | Shading elements | 3500.05 | 0.05 | 175.00 |
| 2 | Cool Roof | 4646.62 | 0.05 | 232.33 |
| 3 | Cool Walls | 10,138.08 | 0.05 | 506.90 |
| 4 | SSEER | 24,500.35 | 0.05 | 1225.02 |
| 5 | Infiltration rate | 482.77 | 0.05 | 24.14 |
| 6 | Atrium Shade | 3379.36 | 0.05 | 168.97 |
| 7 | Window louvres | 1448.30 | 0.05 | 72.41 |
| 8 | All strategies | 41,035.08 | 0.05 | 2051.75 |
Table A3.
Cash Flow (eur).
Table A3.
Cash Flow (eur).
| Cash Flow (eur) |
|---|
| Years | Shading Elements | Cool Roof | Cool Walls | SSEER | Infiltration Rate | Atrium Shade | Window Louvres | All Strategies |
|---|
| 1 | (12,000.00) | (2100.00) | (4500.00) | (4500.00) | (900.00) | (1200.00) | (2400.00) | (27,600.00) |
| 2 | 175.00 | 232.33 | 506.90 | 1225.02 | 24.14 | 168.97 | 72.41 | 2051.75 |
| 3 | 175.00 | 232.33 | 506.90 | 1225.02 | 24.14 | 168.97 | 72.41 | 2051.75 |
| 4 | 175.00 | 232.33 | 506.90 | 1225.02 | 24.14 | 168.97 | 72.41 | 2051.75 |
| 5 | 175.00 | 232.33 | 506.90 | 1225.02 | 24.14 | 168.97 | 72.41 | 2051.75 |
| 6 | 175.00 | 232.33 | 506.90 | 1225.02 | 24.14 | 168.97 | 72.41 | 2051.75 |
| 7 | 175.00 | 232.33 | 506.90 | 1225.02 | 24.14 | 168.97 | 72.41 | 2051.75 |
| 8 | 175.00 | 232.33 | 506.90 | 1225.02 | 24.14 | 168.97 | 72.41 | 2051.75 |
| 9 | 175.00 | 232.33 | 506.90 | 1225.02 | 24.14 | 168.97 | 72.41 | 2051.75 |
| 10 | 175.00 | 232.33 | 506.90 | 1225.02 | 24.14 | 168.97 | 72.41 | 2051.75 |
| 11 | 175.00 | 232.33 | 506.90 | 1225.02 | 24.14 | 168.97 | 72.41 | 2051.75 |
| 12 | 175.00 | 232.33 | 506.90 | 1225.02 | 24.14 | 168.97 | 72.41 | 2051.75 |
| 13 | 175.00 | 232.33 | 506.90 | 1225.02 | 24.14 | 168.97 | 72.41 | 2051.75 |
| 14 | 175.00 | 232.33 | 506.90 | 1225.02 | 24.14 | 168.97 | 72.41 | 2051.75 |
| 15 | 175.00 | 232.33 | 506.90 | 1225.02 | 24.14 | 168.97 | 72.41 | 2051.75 |
| 16 | 175.00 | 232.33 | 506.90 | 1225.02 | 24.14 | 168.97 | 72.41 | 2051.75 |
| 17 | 175.00 | 232.33 | 506.90 | 1225.02 | 24.14 | 168.97 | 72.41 | 2051.75 |
| 18 | 175.00 | 232.33 | 506.90 | 1225.02 | 24.14 | 168.97 | 72.41 | 2051.75 |
| 19 | 175.00 | 232.33 | 506.90 | 1225.02 | 24.14 | 168.97 | 72.41 | 2051.75 |
| 20 | 175.00 | 232.33 | 506.90 | 1225.02 | 24.14 | 168.97 | 72.41 | 2051.75 |
| NPV (5%) | −9414.32 € | 674.09 € | 1548.66 € | 9814.03 € | −579.32 € | 801.94 € | −1452.23 € | −2670.38 € |
| IRR | −10% | 9% | 9% | 27% | −6% | 13% | −5% | 4% |
References
- UN DESA. United Nations Department of Economic and Social Affairs. World’s Population Increasingly Urban with More Than Half Living in Urban Areas. Available online: http://www.un.org/en/development/desa/news/population/world-urbanization-prospects-2014.html (accessed on 25 January 2017).
- Ng, E. Policies and technical guidelines for urban planning of high density cities—Air ventilation assessment (AVA) of Hong Kong. Build. Environ. 2009, 44, 1478–1488. [Google Scholar] [CrossRef]
- Old and Rare Pictures of Dubai and Abu Dhabi—1966, 1954|Living Life in UAE|Life in UAE, Dubai, Abu Dhabi, Sharjah, Universities, College, Education, Banks, Jobs, Business, Expats Life, Working in Dubai. Available online: http://blog.idubai.info/2012/11/old-and-rare-pictures-of-dubai-and-abu.html (accessed on 13 December 2016).
- UAE State of Energy Report 2016|Dubai Carbon L Green Economy Enabler. Available online: http://dcce.ae/state-of-energy-report-2016/ (accessed on 28 January 2017).
- Ministry of Environment and Water of UAE. UAE State of Green Economy 2014; Ministry of Environment and Water of UAE: Dubai, UAE, 2014.
- Abu Dhabi Urban Planning Council—Abu Dhabi Vision 2030. Available online: http://www.upc.gov.ae/abu-dhabi-2030.aspx?lang=en-US (accessed on 1 February 2017).
- Welcome to the Municipality of Abu Dhabi City. Available online: http://www.adm.gov.ae/en/home/index.aspx (accessed on 1 February 2017).
- Yannas, S. Challenging the Supremacy of Airconditioning. Archit. Art 2007. Available online: https://www.researchgate.net/publication/305167847_Reconceiving_the_Built_Environment_of_the_GGul_Region_Challenging_the_Supremacy_of_Airconditioning (accessed on 20 May 2019).
- Estidama. Available online: http://estidama.upc.gov.ae/ (accessed on 10 June 2017).
- Bande, L. Heat Island Mitigation Strategies, with Focus on the Urban Shading Devices. The Case Study of Abu Dhabi Main Island, United Arab Emirates. Ph.D. Thesis, Politecnico di Milano, Milano, Italy, 2017. [Google Scholar]
- Rosenfeld, A.H.; Akbari, H.; Bretz, S.; Fishman, B.L.; Kurn, D.M.; Sailor, D.; Taha, H. Mitigation of urban heat islands: Materials, utility programs, updates. Energy Build. 1995, 22, 255–265. [Google Scholar] [CrossRef]
- Gros, A.; Bozonnet, E.; Inard, C. Cool materials impact at district scale—Coupling building energy and microclimate models. Sustain. Cities Soc. 2014, 13, 254–266. [Google Scholar] [CrossRef]
- Hoyt, T.; Arens, E.; Zhang, H. Extending air temperature setpoints: Simulated energy savings and design considerations for new and retrofit buildings. Build. Environ. 2015, 88, 89–96. [Google Scholar] [CrossRef]
- Friess, W.A.; Rakhshan, K.; Hendawi, T.A.; Tajerzadeh, S. Wall insulation measures for residential villas in Dubai: A case study in energy efficiency. Energy Build. 2012, 44, 26–32. [Google Scholar] [CrossRef]
- Aboulnaga, M.M.; Elsheshtawy, Y.H. Environmental sustainability assessment of buildings in hot climates: The case of the UAE. Renew. Energy 2001, 24, 553–563. [Google Scholar] [CrossRef]
- Samuels, W. Performance and Permeability: An investigation of the Mashrabiya for Use within the Gibson Desert. Master’s Thesis, School of Architecture and Design of Victoria University, Wellington, New Zealand, 2011. [Google Scholar]
- Saudi Aramco World: The Magic of the Mashrabiyas. Available online: http://archive.aramcoworld.com/issue/197404/the.magic.of.the.mashrabiyas.htm (accessed on 20 December 2016).
- Mohamed, J.; Rosenberg, M. “The Tradiational Arts and Crafts of Turnery or Mashrabiya. Ph.D. Thesis, Rutgers University-Camden Graduate School, Camden, NJ, USA, 2015. [Google Scholar]
- Maleki, B.A. IJTPE journal shading: Passive cooling and energy conservation in buildings. Int. J. Int. Organ. TPE 2011, 3, 72–79. [Google Scholar]
- Gago, E.J.; Muneer, T.; Knez, M.; Köster, H. Natural light controls and guides in buildings. Energy saving for electrical lighting, reduction of cooling load. Renew. Sustain. Energy Rev. 2015, 41, 1–13. [Google Scholar] [CrossRef]
- Yang, X.; Jin, T.; Yao, L.; Zhu, C.; Peng, L.L. Assessing the impact of urban Heat Island effect on building cooling load based on the local climate zone scheme. Procedia Eng. 2017, 205, 2839–2846. [Google Scholar] [CrossRef]
- Kandya, A.; Mohan, M. Mitigating the Urban Heat Island effect through building envelope modifications. Energy Build. 2018, 164, 266–277. [Google Scholar] [CrossRef]
- Ghoreishi, A.H.; Ali, M.M. Contribution of thermal mass to energy performance of buildings: A comparative analysis. Int. J. Sustain. Build. Technol. Urban Dev. 2011, 2, 245–252. [Google Scholar] [CrossRef]
- Giridharan, R.; Ganesan, S.; Lau, S.S. Daytime urban heat island effect in high-rise and high-density residential developments in Hong Kong. Energy Build. 2004, 36, 525–534. [Google Scholar] [CrossRef]
- De Munck, C.; Pigeon, G.; Masson, V.; Meunier, F.; Bousquet, P.; Tréméac, B.; Merchat, M.; Poeuf, P.; Marchadier, C. How much can air conditioning increase air temperatures for a city like Paris, France? Int. J. Climatol. 2013, 33, 210–227. [Google Scholar] [CrossRef]
- Yang, X.; Zhao, L.; Bruse, M.; Meng, Q. An integrated simulation method for building energy performance assessment in urban environments. Energy Build. 2012, 54, 243–251. [Google Scholar] [CrossRef]
- Analysis and Diagnosis of the Energy Performance of Buildings and Districts: Methodology, Validation and Development of Urban Energy Maps. Rosa de Masi—Academia.edu. Available online: http://www.academia.edu/20973595/Analysis_and_diagnosis_of_the_energy_performance_of_buildings_and_districts_Methodology_validation_and_development_of_Urban_Energy_Maps (accessed on 10 June 2019).
- Fonseca, J.A.; Schlueter, A. Integrated model for characterization of spatiotemporal building energy consumption patterns in neighborhoods and city districts. Appl. Energy 2015, 142, 247–265. [Google Scholar] [CrossRef]
- Coakley, D.; Raftery, P.; Keane, M. A review of methods to match building energy simulation models to measured data. Renew. Sustain. Energy Rev. 2014, 37, 123–141. [Google Scholar] [CrossRef]
- IESVE Case Studies. Available online: https://www.iesve.com/software/case-studies (accessed on 17 July 2017).
- Cassano, S.; Francisco, C.; Ganglani, P.M.; Sathish, A.; Pinto, Z. Atlas Environmental of Abu Dhabi Emirate; Environmental Agency: Abu Dhabi, UAE, 2011. [Google Scholar]
- greenTEG. U-Value-Resources. Available online: https://www.greenteg.com/u-value-resources/ (accessed on 26 July 2019).
Figure 1.
Flow chart of the methodology followed in this study.
Figure 1.
Flow chart of the methodology followed in this study.
Figure 2.
Rural weather data and villa weather data.
Figure 2.
Rural weather data and villa weather data.
Figure 3.
Geometry Mode in AutoCAD and Rhino.
Figure 3.
Geometry Mode in AutoCAD and Rhino.
Figure 4.
U-value (W/K·m2) measurement before paint application.
Figure 4.
U-value (W/K·m2) measurement before paint application.
Figure 5.
Infrared pictures before and after paint application.
Figure 5.
Infrared pictures before and after paint application.
Figure 6.
Electricity demand for the calibration period.
Figure 6.
Electricity demand for the calibration period.
Figure 7.
Model evaluation at a 95% confidence level. An overfitting test was done using three months in 2018 and the results were within the 95% confidence interval (y-axes shows the kWh).
Figure 7.
Model evaluation at a 95% confidence level. An overfitting test was done using three months in 2018 and the results were within the 95% confidence interval (y-axes shows the kWh).
Figure 8.
3D views of the villa retrofit scenarios.
Figure 8.
3D views of the villa retrofit scenarios.
Figure 9.
3D models of the villa with scenarios 1, 2, 3, 4, 5.
Figure 9.
3D models of the villa with scenarios 1, 2, 3, 4, 5.
Figure 10.
Total energy consumption in monthly basis.
Figure 10.
Total energy consumption in monthly basis.
Figure 11.
Total energy consumption in three different cases.
Figure 11.
Total energy consumption in three different cases.
Figure 12.
Villa air temperature versus dry bulb air temperature.
Figure 12.
Villa air temperature versus dry bulb air temperature.
Figure 13.
Villa wet bulb temperature versus wet bulb temperature.
Figure 13.
Villa wet bulb temperature versus wet bulb temperature.
Table 1.
Criteria for calibrated models according to ASHRAE Guideline 14 [
29].
Table 1.
Criteria for calibrated models according to ASHRAE Guideline 14 [
29].
| Monthly Criteria (%) | Hourly Criteria (%) |
|---|
| NMBE | CVRMSE | NMBE | CVRMSE |
| 5 | 15 | 10 | 30 |
Table 2.
Hourly Schedule.
Table 2.
Hourly Schedule.
| No. | Description | Children (met 1.2) | Staff (met 1.4) |
|---|
| 1 | regular hours | 8 am–3 pm | 8 am–5 pm |
| 2 | weekend (Saturday) | | 10 am–12 pm |
| 3 | summer vacations (Not applied during 2016) | 15 July–10 September |
| 4 | summer camp (Not applied during 2016) | 1/2 of regular children numbers | 1/2 of regular staff numbers |
| 5 | winter break | 20 December–5 January |
| 5 | winter break | 1/2 of regular children numbers | 1/2 of regular staff numbers |
| 6 | Ramadan | 6 June–5 July 2016 | 26 May–24 June 2017 |
| | Timing | 8 am–12 pm | 8 am–3 pm |
| 7 | EID 1 | 6–8 July 2016 | 25–28 June 2017 |
| | Timing | 8 am–12 pm | 8 am–3 pm |
| | | Children (met 1.2) | Staff (met 1.4) |
| 1 | regular hours | 8 am–3 pm | 8 am–5 pm |
| 2 | weekend (Saturday) | | 10 am–12 pm |
| 3 | summer vacations (Not applied during 2016) | 15 July–10 September |
| 4 | summer camp (Not applied during 2016) | 1/2 of regular children numbers | 1/2 of regular staff numbers |
| 5 | winter break | 20 December–5 January |
| 5 | winter break | 1/2 of regular children numbers | 1/2 of regular staff numbers |
| 6 | Ramadan | 6 June–5 July 2016 | 26 May–24 June 2017 |
| | Timing | 8 am–12 pm | 8 am–3 pm |
| 7 | EID 1 | 6–8 July 2016 | 25–28 June 2017 |
| | Timing | 8 am–12 pm | 8 am–3 pm |
Table 3.
Occupancy Schedule.
Table 3.
Occupancy Schedule.
| No. | Area | Previously | Currently | Children (met 1.2) | Adults (met 1.4) |
|---|
| | Ground Floor |
| 1 | Village jungle | x | x | 12 | 2 |
| 2 | Toddling tigers | x | x | 12 | 2 |
| 3 | Little leopards | x | x | 12 | 2 |
| 4 | Manager’s office | x | x | | 1 |
| 5 | Kitchen | x | classroom | 12 | 2 |
| | First Floor |
| 1 | Arabic majles | x | classroom | 12 | 2 |
| 2 | Cheeky cheetahs | x | x | 12 | 2 |
| 3 | Lovely lions | x | x | 12 | 2 |
| 4 | Laughing lynx | x | x | 12 | 2 |
| 5 | Punching panthers | x | x | 12 | 2 |
| 6 | Foyer | x | x | 12 | 1 |
| | External |
| 1 | Dancing room | x | x | 12 | 1 |
| 2 | Music room | x | x | 12 | 1 |
| 3 | Kitchen | x | x | | 2 |
| 4 | Nurse room | x | x | | 1 |
Table 4.
Table of U-values and infrared inspections.
Table 4.
Table of U-values and infrared inspections.
| Roof U-value | 1.29 | ADM study of E3 |
| Wall U-value | 2.25 | ADM study of E3 |
| SHGC | 3.88 | ADM study of E3 (includes CTHC on both sides) |
| Roof albedo | 0.75 | 6 mm single pane (tinted 0.63) |
| Wall albedo | 0.26 | Akbari (2003) |
| Emissivity (all opaque surfaces) | 0.3 | |
| Emissivity (glazing) | 0.9 | clear glass |
| Road albedo | 0.84 | |
| Roof thermal mass (J/K.m3) | 1.20E + 06 | to position thermal mass, divide R: 10% indoor 90% outdoor |
| Wall thermal mass (J/K.m3) | 1.20E + 06 | to position thermal mass, divide R: 10% indoor 90% outdoor |
| Road thermal mass (J/K.m3) | 1.60E + 06 | |
| Roof/ floor thickness (m) | 0.35 | |
| Wall thickness (m) | 0.25 | Concrete brick with mortar (http://www.rfcafe.com.ne) |
| Roof/wall/floor density (kg/m3) | 750 | |
| Road thickness (m) | 0.50 | |
| Indoor CHTC (W/K.m2) | 5.00 | EnergyPlus defaults |
| Roof-air CHTC (W/K.m2) | 20.00 | EnergyPlus defaults |
| Wall-air CHTC (W/K.m2) | 25.00 | EnergyPlus defaults |
| Infiltration | 0.75 | Adjust for wind and stack effect using blast formula |
Table 5.
HVAC Configuration, last column shows the parameter values that were calibrated.
Table 5.
HVAC Configuration, last column shows the parameter values that were calibrated.
| System | Final Parameter (v.25) | Calibration Range | Tool Used to Calibrate |
|---|
| SEER kW/kW = CoP | 2.6 | 2.3–2.7 | Hone |
| Heta Rejection (Pump and Fan Power) | 24.4 | 5.0–30.0 | Hone |
| Cooling Setpoint | 24°C throughout | 20–24 | Hone |
| Plant Operation | Set to Cooling Profile | | |
| Internal Gains | | | |
| Miscellaneous sens. (Light + equip.) | 10 W/m2 | 10.0–50.0 | Hone |
| People sensible | 80 W/person | | |
| People latent | 60 W/person | | |
| Air exchanges | | | |
| Infiltration | 0.21 ach | 0.1–0.4 | Hone |
| Constructions | | | |
| Roof U-Value | 1.01 | FIXED | |
| Windows U-Value | 2.93 | 2.0–4.0 | Manually |
| Ground/Exposed Floor U-Value | 0.22 | FIXED | |
| External Wall U-Value | 1.98 | 1.5–2.5 | Manually |
| Roof Solar Absorptance (Cool Roof) | 0.30 | FIXED | |
| Walls Solar Absorptance | 0.7 | FIXED | |
Table 6.
Metrics used in the calibration.
Table 6.
Metrics used in the calibration.
| Metrics | Value |
|---|
| RMSE (root mean square error) | 640.3124 |
| CVRMSE (coefficient of variation of the root mean square error) | 7% |
| R2 (coefficient of determination) | 98% |
| NMBE (normalised mean bias error) | −2% |
| RN_RMSE (range normalised root mean bias error) | 5% |
Table 7.
Total electricity consumption comparing retrofit strategies and the current situation.
Table 7.
Total electricity consumption comparing retrofit strategies and the current situation.
| | Total Electricity Consumption (MWh) |
|---|
| Month | No Retrofit Strategy | Current Situation | All Retrofit Strategies |
|---|
| Jan 01–31 | 4.5755 | 4.1401 | 3.1598 |
| Feb 01–28 | 3.5371 | 3.3258 | 2.7312 |
| Mar 01–31 | 6.1036 | 5.7128 | 4.2911 |
| Apr 01–30 | 9.1502 | 8.6368 | 6.1888 |
| May 01–31 | 11.7619 | 11.1873 | 7.9219 |
| Jun 01–30 | 11.1892 | 10.6661 | 7.63 |
| Jul 01–31 | 12.6504 | 11.9621 | 8.112 |
| Aug 01–31 | 17.4306 | 16.0919 | 10.5299 |
| Sep 01–30 | 16.2221 | 15.0824 | 10.1826 |
| Oct 01–31 | 15.0437 | 13.9648 | 9.5749 |
| Nov 01–30 | 8.5402 | 7.9949 | 5.7466 |
| Dec 01–31 | 4.4869 | 4.0872 | 3.1066 |
| TOTAL | 120.6914 | 112.852 | 79.1754 |
Table 8.
Optimal strategies selection considering with simple payback and NPV for 20 years (refers to the
Appendix A NPV study).
Table 8.
Optimal strategies selection considering with simple payback and NPV for 20 years (refers to the
Appendix A NPV study).
| Retrofit Strategies | Simple Payback (Year) | NPV for 20 Years (eur) * | Selection for Optimal Strategies |
|---|
| Shading Elements | 68.6 | −9414.32 | Not recommended |
| Cool Roof | 9.0 | 674.09 | Recommended |
| Cool Walls | 8.9 | 1548.66 | Recommended |
| SSEER | 3.7 | 9814.03 | Recommended |
| Infiltration Rate | 37.3 | −579.32 | Not recommended |
| Atrium Shades | 7.1 | 801.94 | Recommended |
| Window Louvers | 33.1 | −1452.23 | Not recommended |
| Optimal Strategies | 5.8 | 14,285 | Recommended |
| All Strategies | 13.5 | −2670.38 | Not recommended |
Table 9.
Monthly average dry bulb temperature in °C for the rural and urban measurements and total electricity consumption for the building energy model using rural and urban weather data for 2017.
Table 9.
Monthly average dry bulb temperature in °C for the rural and urban measurements and total electricity consumption for the building energy model using rural and urban weather data for 2017.
| Month | Monthly Average Dry Bulb Temperature in °C | Monthly Total Electricity (MWh) |
|---|
| Airport (Rural) | Urban (Villa) | Airport (Rural) | Urban (Villa) |
|---|
| Jan | 20.92 | 21.81 | 3.6239 | 4.1633 |
| Feb | 20.15 | 20.72 | 3.0108 | 3.2725 |
| Mar | 24.33 | 24.66 | 5.4208 | 5.5086 |
| Apr | 29.02 | 29.99 | 8.078 | 9.0869 |
| May | 32.41 | 33.5 | 10.5704 | 11.2517 |
| Jun | 34.25 | 35.08 | 10.3235 | 10.4085 |
| Jul | 36.7 | 38.08 | 11.2555 | 12.6342 |
| Aug | 35.96 | 37.09 | 15.5288 | 16.5673 |
| Sep | 33.6 | 34.29 | 14.7824 | 15.5442 |
| Oct | 30.5 | 31.75 | 13.2172 | 14.2598 |
| Nov | 26.28 | 27.59 | 7.0847 | 7.877 |
| Dec | 21.75 | 22.45 | 3.6394 | 4.1588 |
| TOTAL | | | 106.5355 | 114.7328 |
© 2019 by the authors. Licensee MDPI, Basel, Switzerland. This article is an open access article distributed under the terms and conditions of the Creative Commons Attribution (CC BY) license (http://creativecommons.org/licenses/by/4.0/).

 ,
, 


