Article

Analysis of the Drought Mitigated Mechanism in Terraced Paddy Fields Using CWSI and TVDI Indices and Hydrological Monitoring

1
United Graduate School of Agricultural Science, Tokyo University of Agriculture and Technology, 3-5-8 Saiwaicho, Fuchu, Tokyo 183-8509, Japan
2
Department of Mechanical and Biosystem Engineering, Faculty of Agricultural Engineering and Technology, IPB University, Bogor 16680, Indonesia
3
Department of Agricultural and Biosystem Engineering, Faculty of Agricultural Technology, Universitas Gadjah Mada, Yogyakarta 55281, Indonesia
4
Institute of Agriculture, Tokyo University of Agriculture and Technology, 3-5-8 Saiwaicho, Fuchu, Tokyo 183-8538, Japan
*
Author to whom correspondence should be addressed.
Sustainability 2019, 11(24), 6897; https://doi.org/10.3390/su11246897
Submission received: 7 October 2019 / Revised: 28 November 2019 / Accepted: 30 November 2019 / Published: 4 December 2019
(This article belongs to the Special Issue Sustainable Global Water Management)

Abstract

:
Food security is often threatened by droughts during rice production. Although most of the rice is produced in lowland or irrigated “wet” rice fields, terraced paddy fields are important in the rice production system in island or mountainous countries. With the intensifying frequency of El Niño periods in recent decades, there has been a risk of droughts in terraced paddy areas. To mitigate drought, remote sensing data analysis could be an efficient and reliable tool for obtaining scarce ground monitoring data. In this study, crop water stress index (CWSI) and temperature vegetation dryness index (TVDI) were applied to evaluate the drought intensity, and hydrological monitoring data was provided as a support for the evaluation. The results indicated that droughts normally occurred during the dry season, and intensified during El Niño periods. CWSI and TVDI were visible to predict drought occurrences in the watershed area. TVDI overestimated the drought inside Keduang watershed compared to CWSI because of the complex condition of the terraced paddy area, including the hydrology in this area. The complex topography, high groundwater table, and continuous plot-to-plot irrigation helped to maintain the water availability and mitigated the drought impact for rice production in the studied terraced paddy field.

1. Introduction

Food security is often threatened by drought, which has been reported to be one of the dominant disasters affecting rice production [1,2]. In Indonesia, drought had been reported to be strongly related to the El Niño-Southern Oscillation (ENSO) phenomena, especially during dry seasons [3,4,5,6,7]. The increasing frequency of El Niño events in recent decades has also increased the production loss risks in agricultural activities, especially in rice production. Climate change caused the increased scarcity and competition for water resources changing the planting pattern in Indonesia [8]. Change in rainfall patterns and extreme climate events such as El Niño and La Nina are some indicators of climate change that can be felt directly in the current time. It caused by the increasing average air temperature induced by the increasing concentrations of greenhouse gases in the atmosphere [9]. With the warmer air temperature due to El Niño, unstable weather conditions for agriculture were the result.
As the staple food of nearly half the world population, rice is very important for ensuring global food security especially in Asia where 90% of the rice production occurs [10]. Indonesia is the third largest producer of rice in the world; however, this country imports rice owing to increasing population [11]. Although most of the rice is produced in lowland or irrigated “wet” rice fields, terraced paddy fields are also important for rice production at Java Island, Indonesia as terraced paddy has 15–20% share of the total paddy fields area in Indonesia [12]. They also have importance for the ecosystem, such as reducing erosion, reducing runoff, and preserving the wetland ecosystem.
Although important, there is a lack of ground monitoring data in these areas owing to the complex terrain; thus, remote sensing data analysis is expected to play a valuable role in drought preparedness [13,14]. Drought definition itself can be different depending on the disciplinary outlook and its impact on the economy and society [15]. Conceptually, drought was defined as the condition under limited rainfall below what was normal for the related area [15,16]. To measure the qualitative state of drought in a specified landscape and during certain timescale, indices are commonly used as a quantitative assessment [17]. Each index contains a complex relationship of several indicators and able to represent the condition from normal to the most severe drought condition. Among those indices, several were derived from remote sensing data [18,19,20,21]. The crop water stress index (CWSI) and the temperature vegetation dryness index (TVDI) are two of the most widely used indices to monitor droughts [14,22].
CWSI was originally developed by Idso et al. and Jackson et al. [23,24] then widely applied in a close observation of plant water status using a hand-held infrared cameras [25,26,27] or in analysis using remote sensing data [22,28,29,30]. CWSI was defined to be equal to the ratio of actual to potential evapotranspiration [24]. CWSI calculations using remote sensing data involve using an evapotranspiration algorithm derived from various indicators including several other MODIS (Moderate Resolution Imaging Spectroradiometer) data from NASA Earth Observing System Data and Information System (EOSDIS) The Land Processes Distributed Active Archive Center (LP DAAC) in South Dakota, USA. Meanwhile, TVDI was proposed based on the direct relationship between the surface temperature and vegetation indices in a large area [31]. Although both indices have different approach, the main goal is the same, which is to quantify water status. Considering the complexity of mountainous terrain and the unique water management of terraced paddies, the behavior of these indices might be different to that in other areas.
Regarding the evaluation of drought damage in terraced paddy fields, the characteristics of these two indices have been evaluated, and the effect of the complex terrain and intensive cultivation on the hydrology condition has been studied. This study aimed to analyze the drought or water shortage tendency for terraced paddy fields and its relationship with rice production and water management using remote sensing and monitoring data. Thus, this research contributes to the water management of terraced paddy fields to achieve sustainability in this area.

2. Materials and Methods
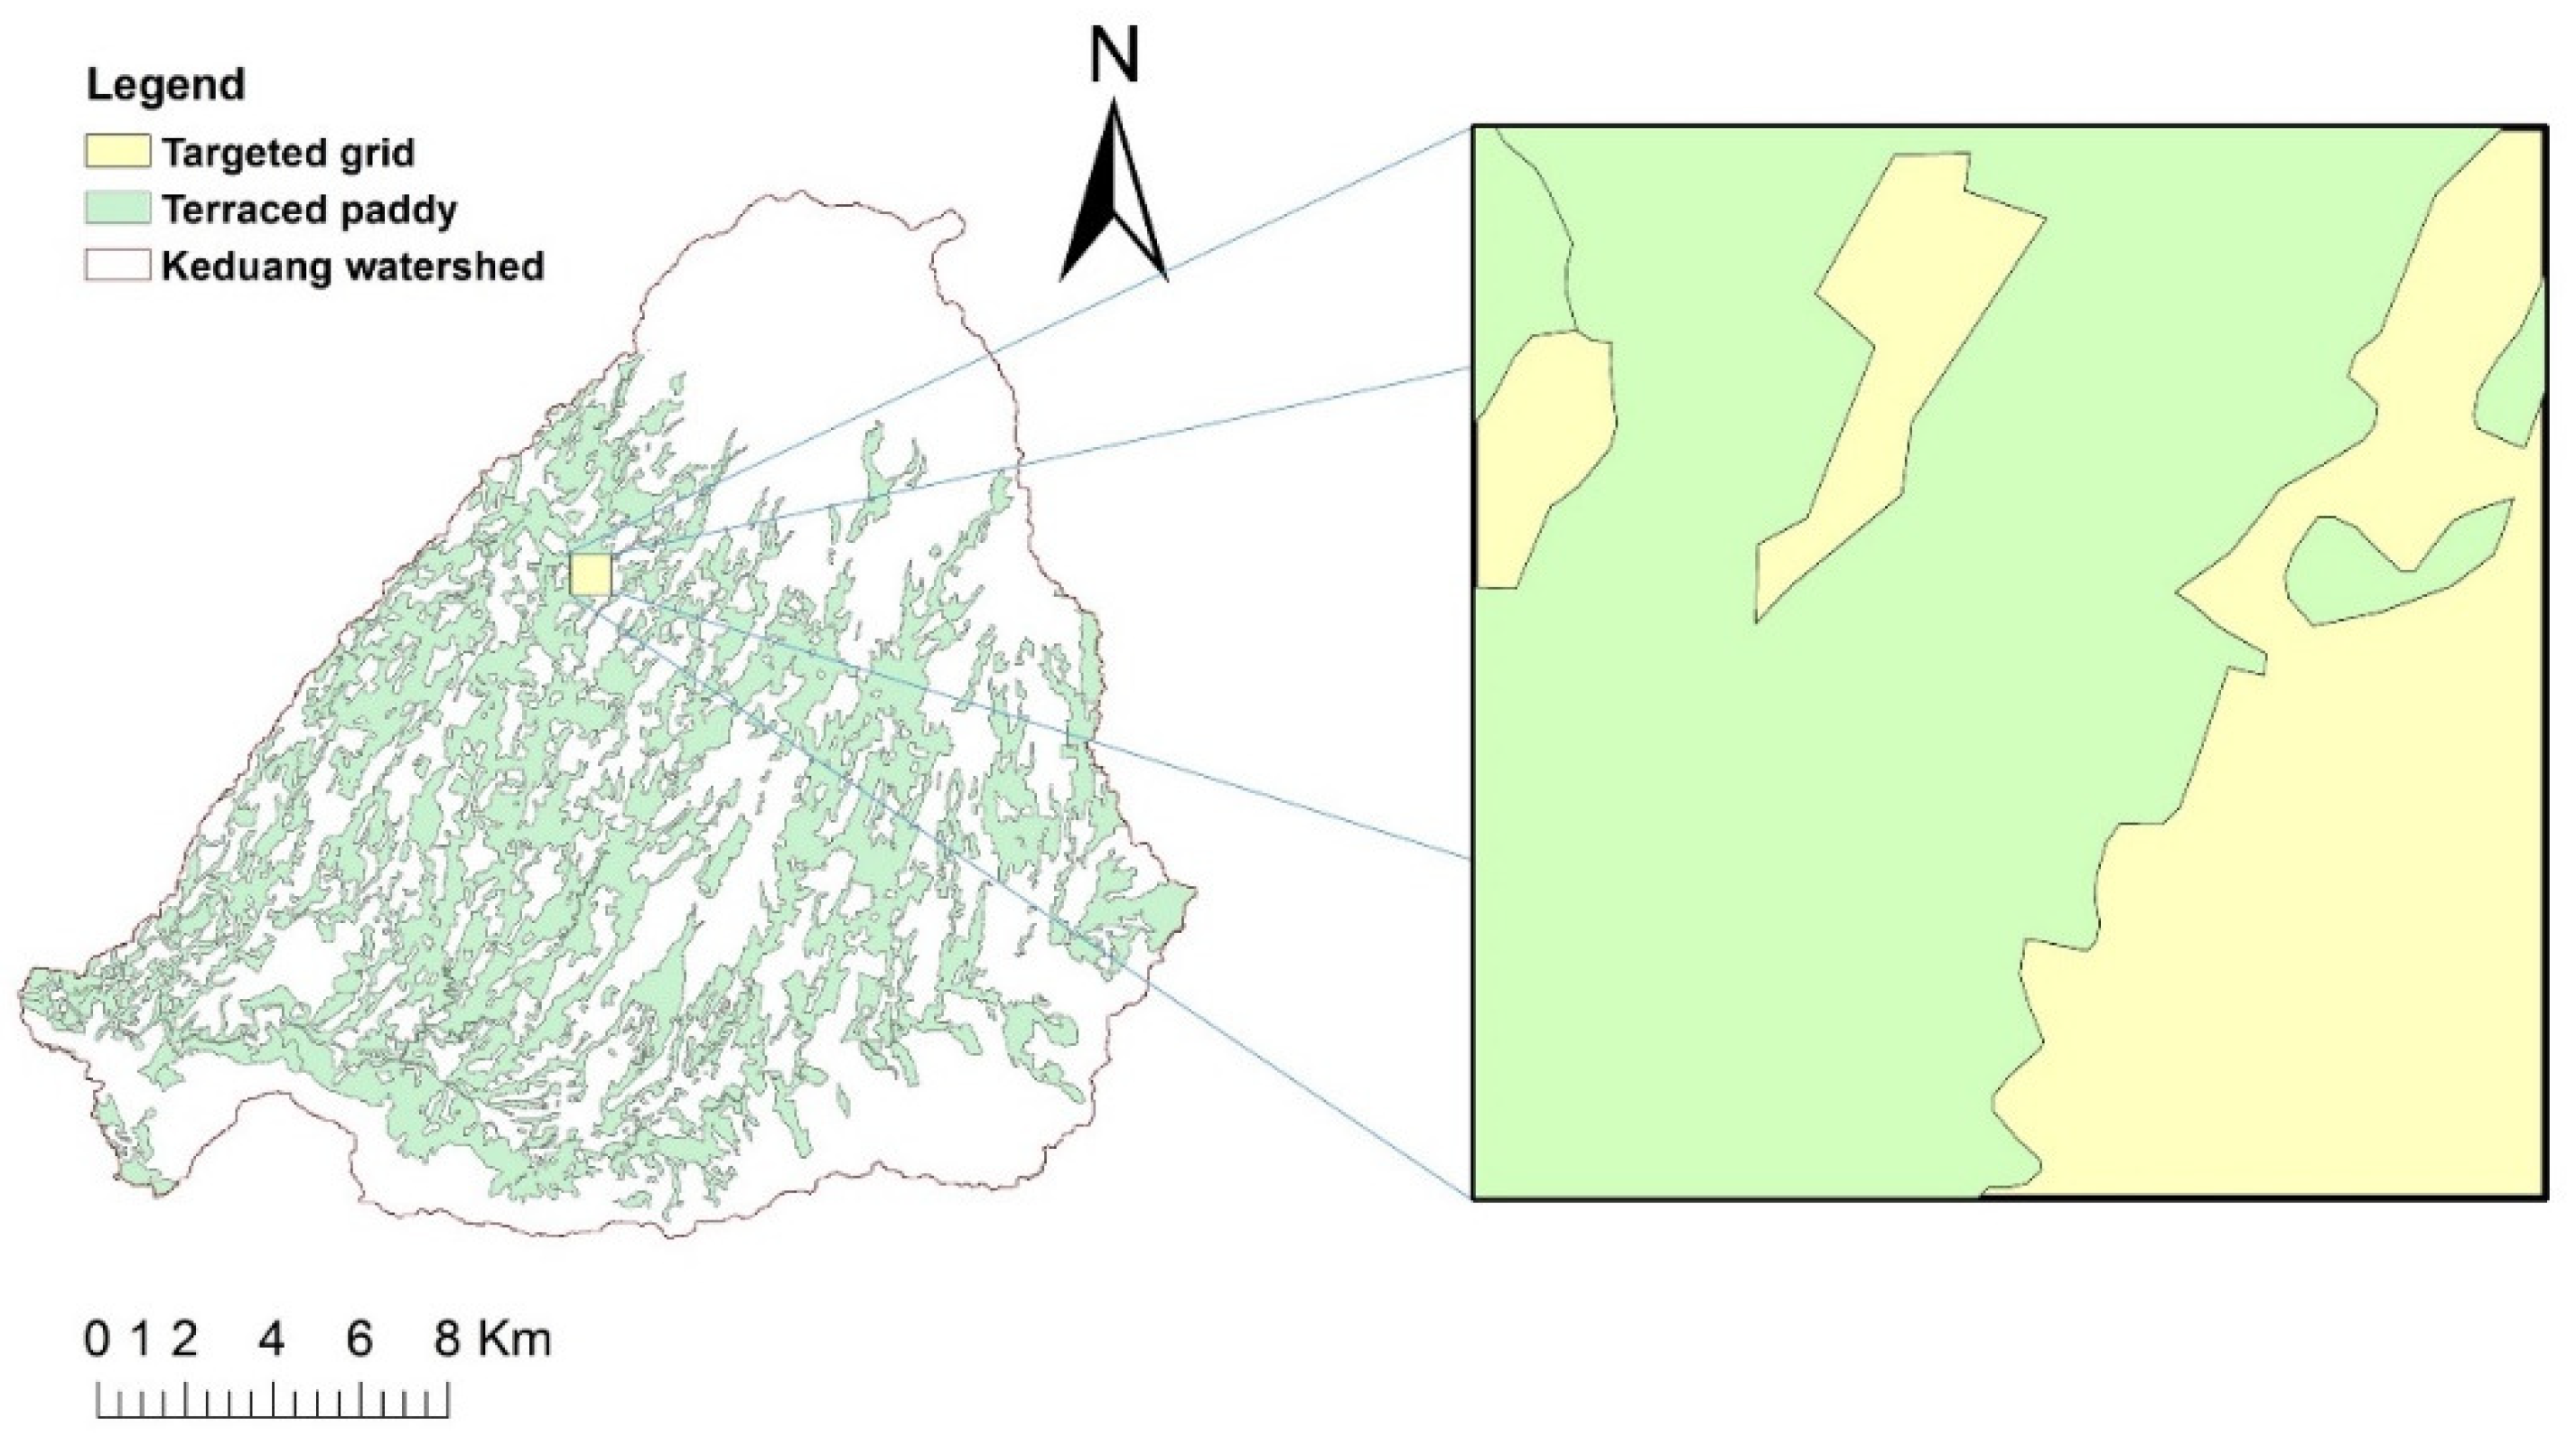
2.1. Study Area

2.1.1. Location

The study site was located in Gemawang, Girimarto District, Wonogiri Regency, Central Java, Indonesia. The watershed, Keduang watershed, is located between coordinates 7°42′ to 7°55′ S and 110°58′ to 111°13′ E while the observed terraced paddy area is located between coordinates 7°47′10.8″ to 7°47′23.9″S and 111°5′47.4″ to 111°5′59.5″ E. Keduang watershed is an upstream part of the longest river on Java Island, which is Bengawan Solo River. This watershed supplies water to the Gadjah Mungkur Dam for irrigation, power generation, and the drinking supply purposes. The unique characteristics of this area are the steep terrain, and almost 30% of its land use is terraced paddy fields (see Figure 1). As paddy cultivation occupies quite a large area of the watershed, the hydrological characteristics of this area are most probably influenced by the terraced paddy fields. Many farmers can cultivate rice three times a year in the area where an irrigation channel has been established.
Generally, Indonesia is strongly affected by ENSO, the Indian Ocean Dipole (IOD), and tropical monsoons. The ENSO influence is further magnified when it coincides with other factors, such as the IOD [2,32]. ENSO in this study area was observed to have occurred in 2015 and 2018. When El Niño occurred, the Gajah Mungkur Dam storage decreased significantly so that it could not generate electricity, and there was not enough water to supply the designated irrigation area [33]. As Keduang watershed supplying the majority of water for the Gajah Mungkur Dam, it meant that the water supply from Keduang watershed also significantly decreased.

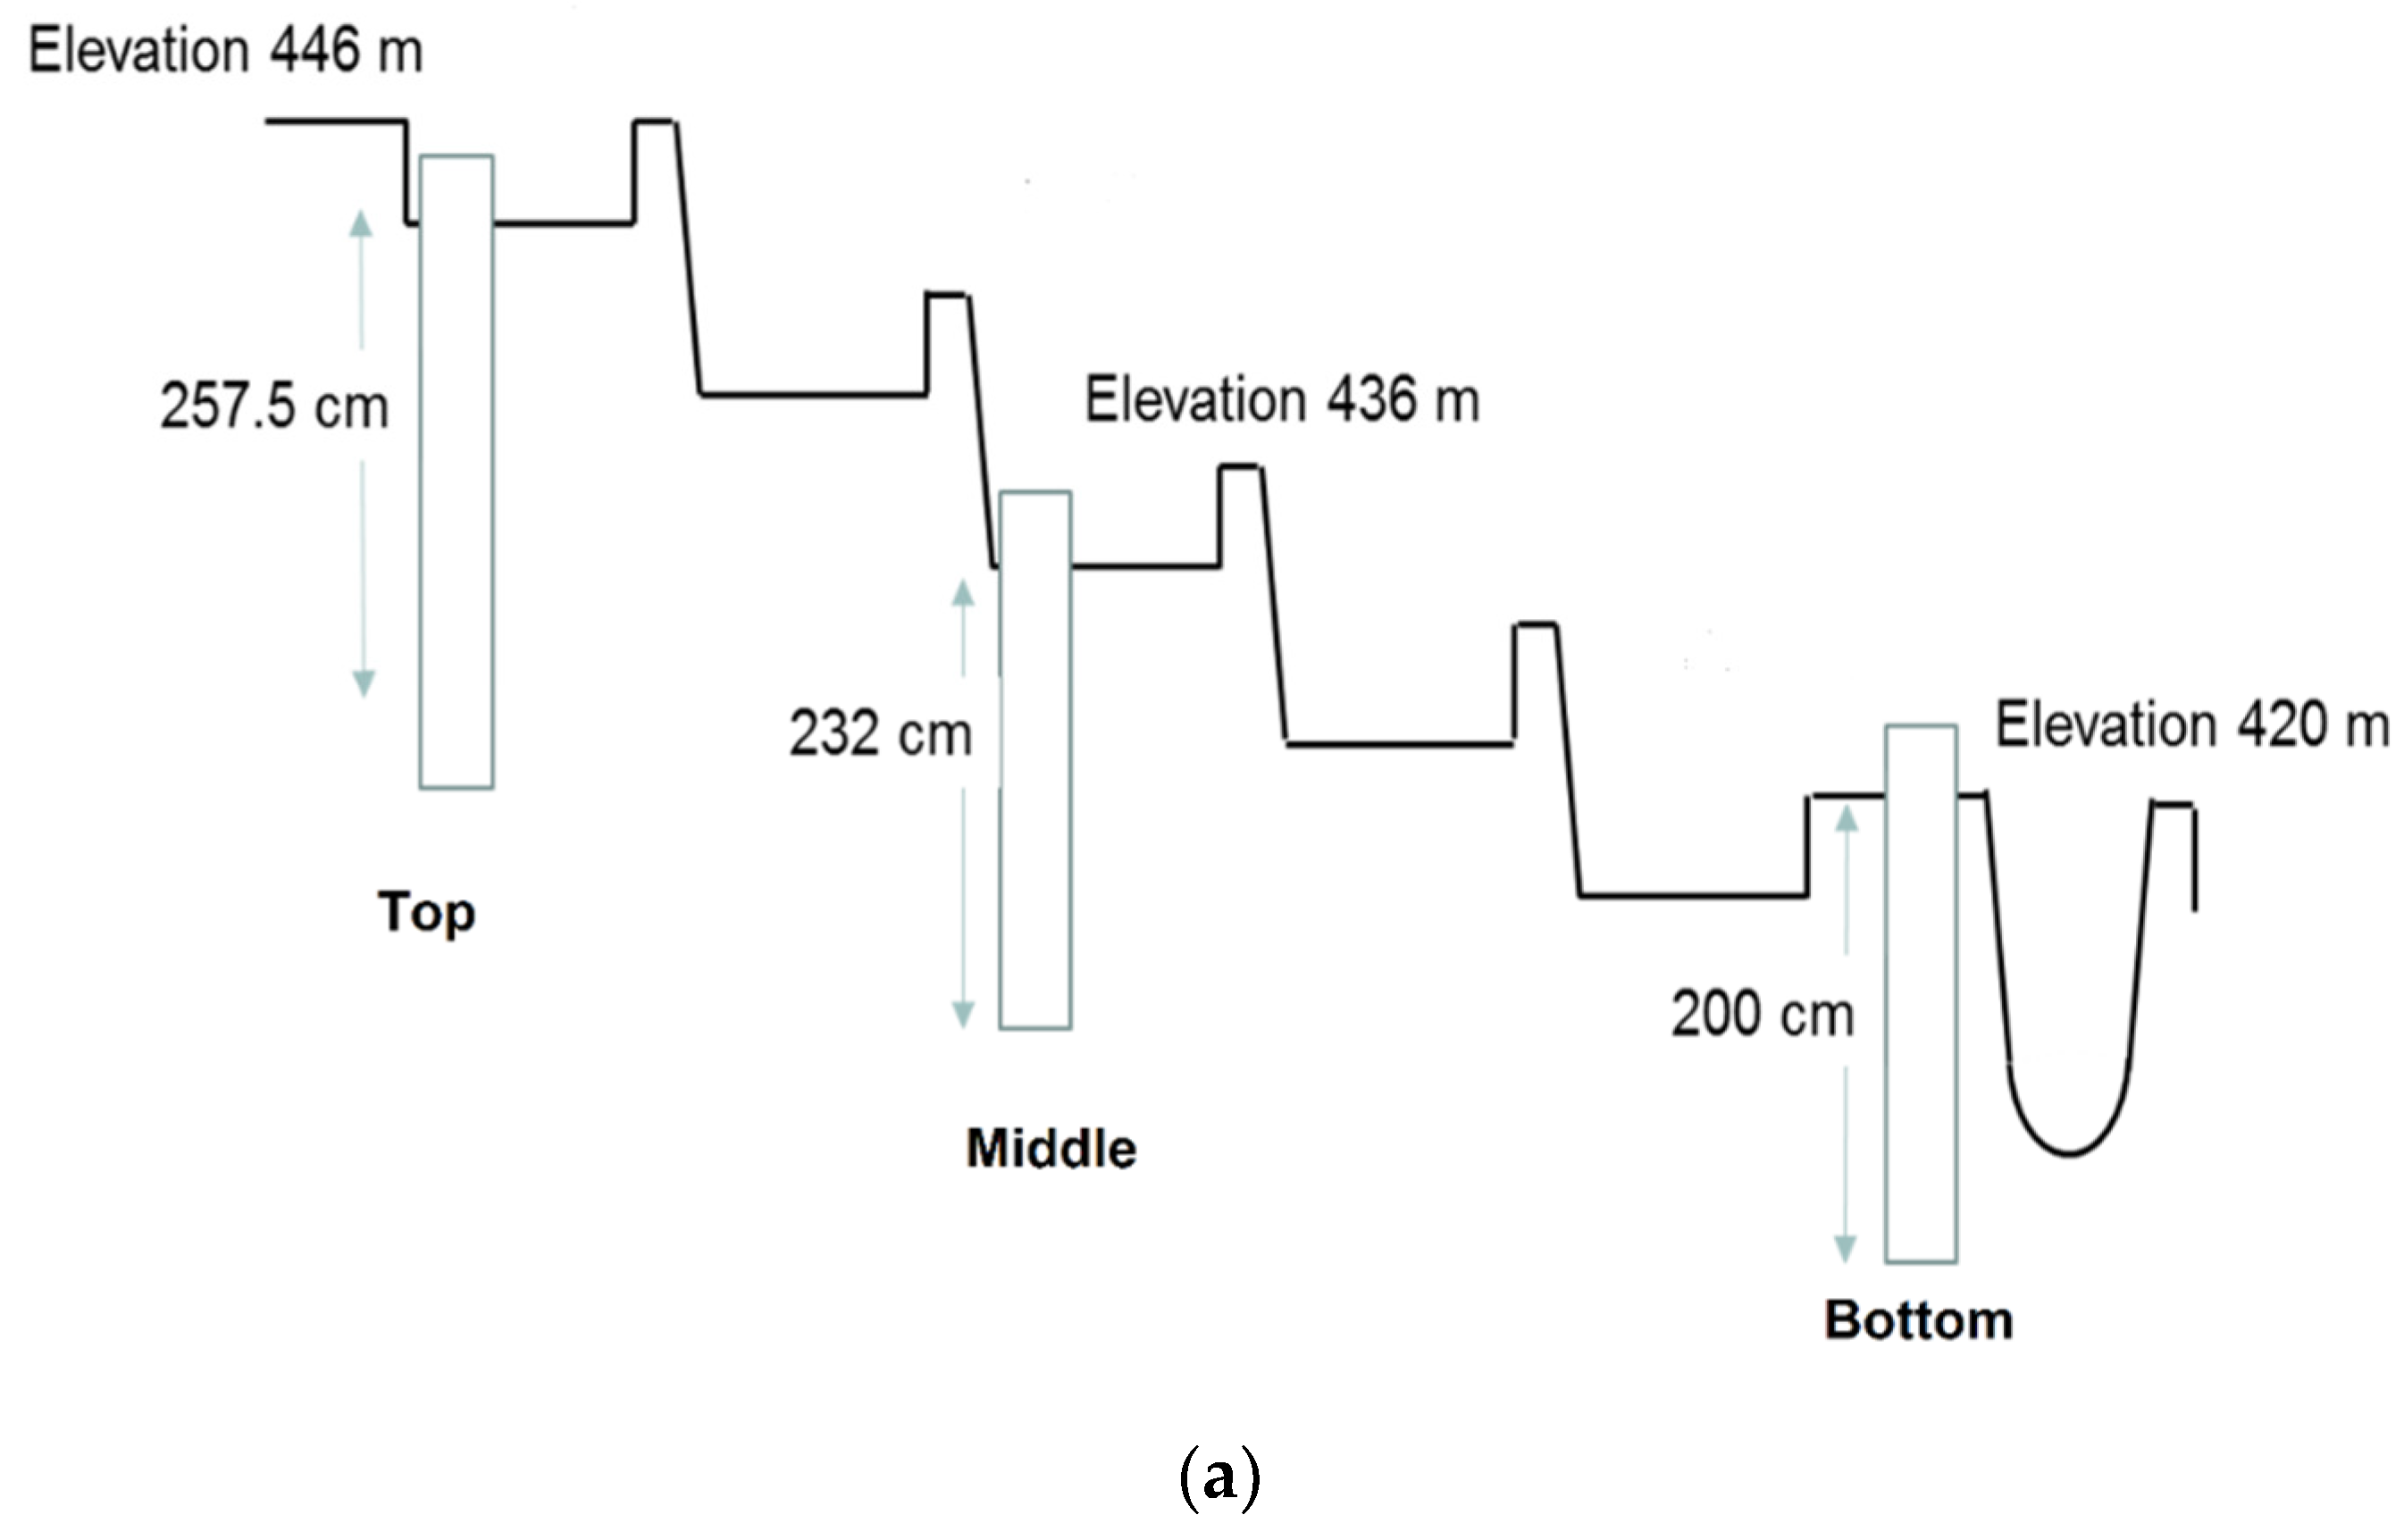
2.1.2. Terraced Paddy Fields

Terraces leave the impression of a beautiful “staircase farm” as an Earth embankment constructed across steep slopes. The main components of terraced paddy fields are a leveled surface, bund, and spillway. These components are needed to keep the water inundated and distributed evenly in the field. Not only keeping the inundation at a certain depth but terraced paddy fields can also release excess water through the spillway to lower terraces and then to the drainage channel or river to discharge. Compared with dry field terracing, terraced paddy fields are far more complex in terms of their irrigation systems. Most terraced paddy fields are located along the river and are expanded by irrigation from an upstream river. The irrigation is diverted from the river via a long irrigation canal that then conveys down to the fields through plot-to-plot irrigation. In some places, such as in the Ailao mountains in Yunan, China, terraced fields are irrigated and maintained to be flooded throughout the year [34]. Furthermore, careful cooperation of farmers and clear regulation of the flow pattern often produce exquisite and efficient water management in many terraced paddy ecosystems in the world.

2.2. Analysis and Measurements

2.2.1. Watershed Drought Analysis

a
Data
The data used in this study included remote sensing data from the 2015–2018 period, weather data for the same period, monitoring data of the irrigation block area water balance for 2015–2016, and groundwater monitoring data on a specific terraced paddy plot for 2017–2018. The remote sensing data was derived from MODIS Land Surface Temperature (LST) data obtained using the “MODIStsp” method in the R model package [35]. NDVI (Normalized difference vegetation index) data used was a 16-day composite with a 1-km resolution (MOD13A2) data, LST data was an 8-day composite with a 1-km resolution raster (MOD11A1) data, and ET as well as PET data were 8-day composites with a 500-m resolution (MOD16A2) data.
b
Drought Indices
Two drought indices were used for our watershed scale analysis, CWSI and TVDI. CWSI was proposed by Idso et al. and Jackson et al. [23,28] as an index to measure plant water stress status by using the canopy temperature and its ambient atmosphere; later, the equation was modified by Jackson et al. [36], as shown in Equation (1),
CWSI = ( T c T a )   ( T c T a ) ll ( T c T a ) ul     ( T c T a ) ll
where Tc is the crop canopy temperature in °C, Ta is the air temperature in °C, ( T c T a ) ll is the canopy temperature of a well-watered plant of the same variety in °C, and ( T c T a ) ul is the upper baseline for the crop canopy–air difference for an acute shortage of water.
CWSI was defined by Jackson et al. to be equal to Equation (2) [24]; here, this approach was used to analyze MODIS data.
CWSI = 1 ET PET
where ET (Evapotranspiration) and PET (Potential Evapotranspiration) were acquired using a global ET dataset. This MODIS ET algorithm was developed based on the Penman-Monteith equation and coupled with biophysical variables, such as land cover, Fraction of Photosynthetically Active Radiation (FPAR), and Leaf Area Index (LAI), to more accurately accommodate many conditions [37]. Land cover, FPAR, and LAI were acquired from MOD15A2H data. The ET and PET algorithm in MOD16 considered the energy partitioning logic and atmospheric drivers, and it was later improved by considering combined surface meteorological data [37,38,39].
TVDI is a drought index suggested by Sandholt et al. to interpret seasonal and spatial patterns of soil moisture on the surface from Earth observation data. The index is calculated using the approach of the NDVI-LST triangle [14] using Equation (3) as follows:
TVDI = LST LST min a + bNDVI LST min
where LST is the observed surface temperature at a given pixel, NDVI is the observed normalized difference vegetation index, and a and b are the intercept and slope of the dry edge (the upper straight line in the triangle), respectively, calculated from the NDVI-LST space regression with small intervals of NDVI (LSTmax = a + bNDVI), where LSTmax is the maximum surface temperature observation for a given NDVI value and a and b are parameter constants from the correlation. The lower horizontal line on the triangle represents the wet edge (LSTmin), which was calculated by averaging a group of points on the lower limits of the scatterplots.

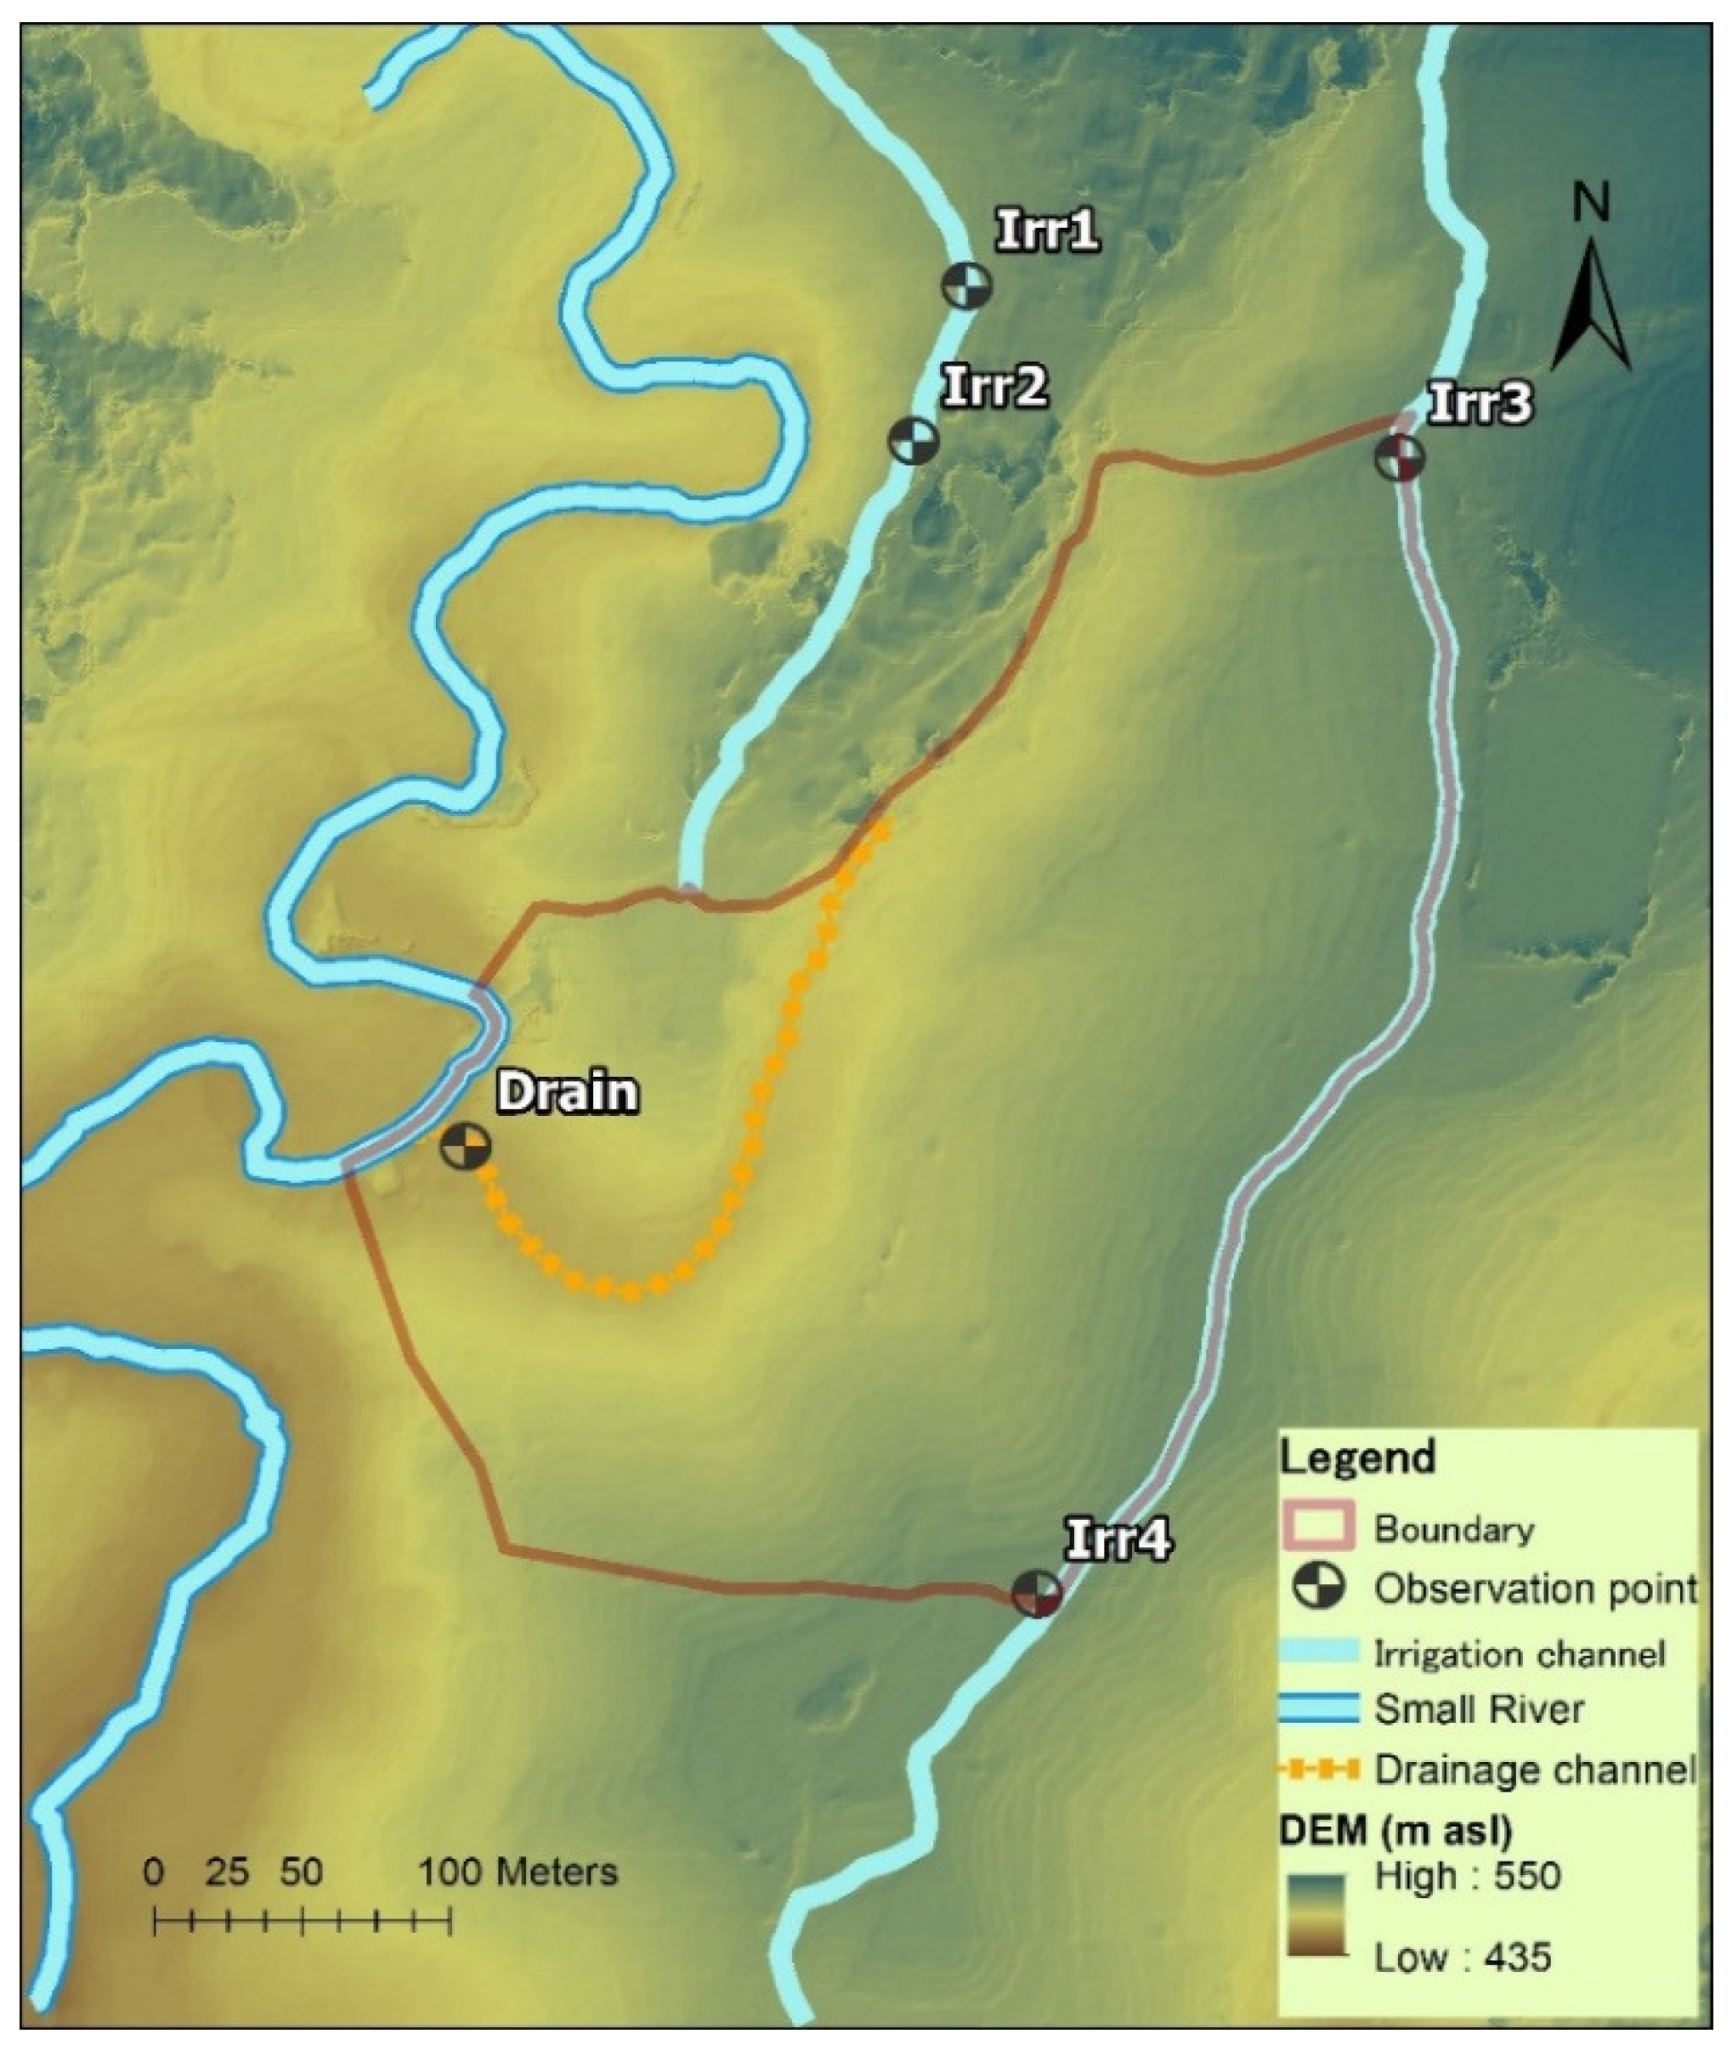
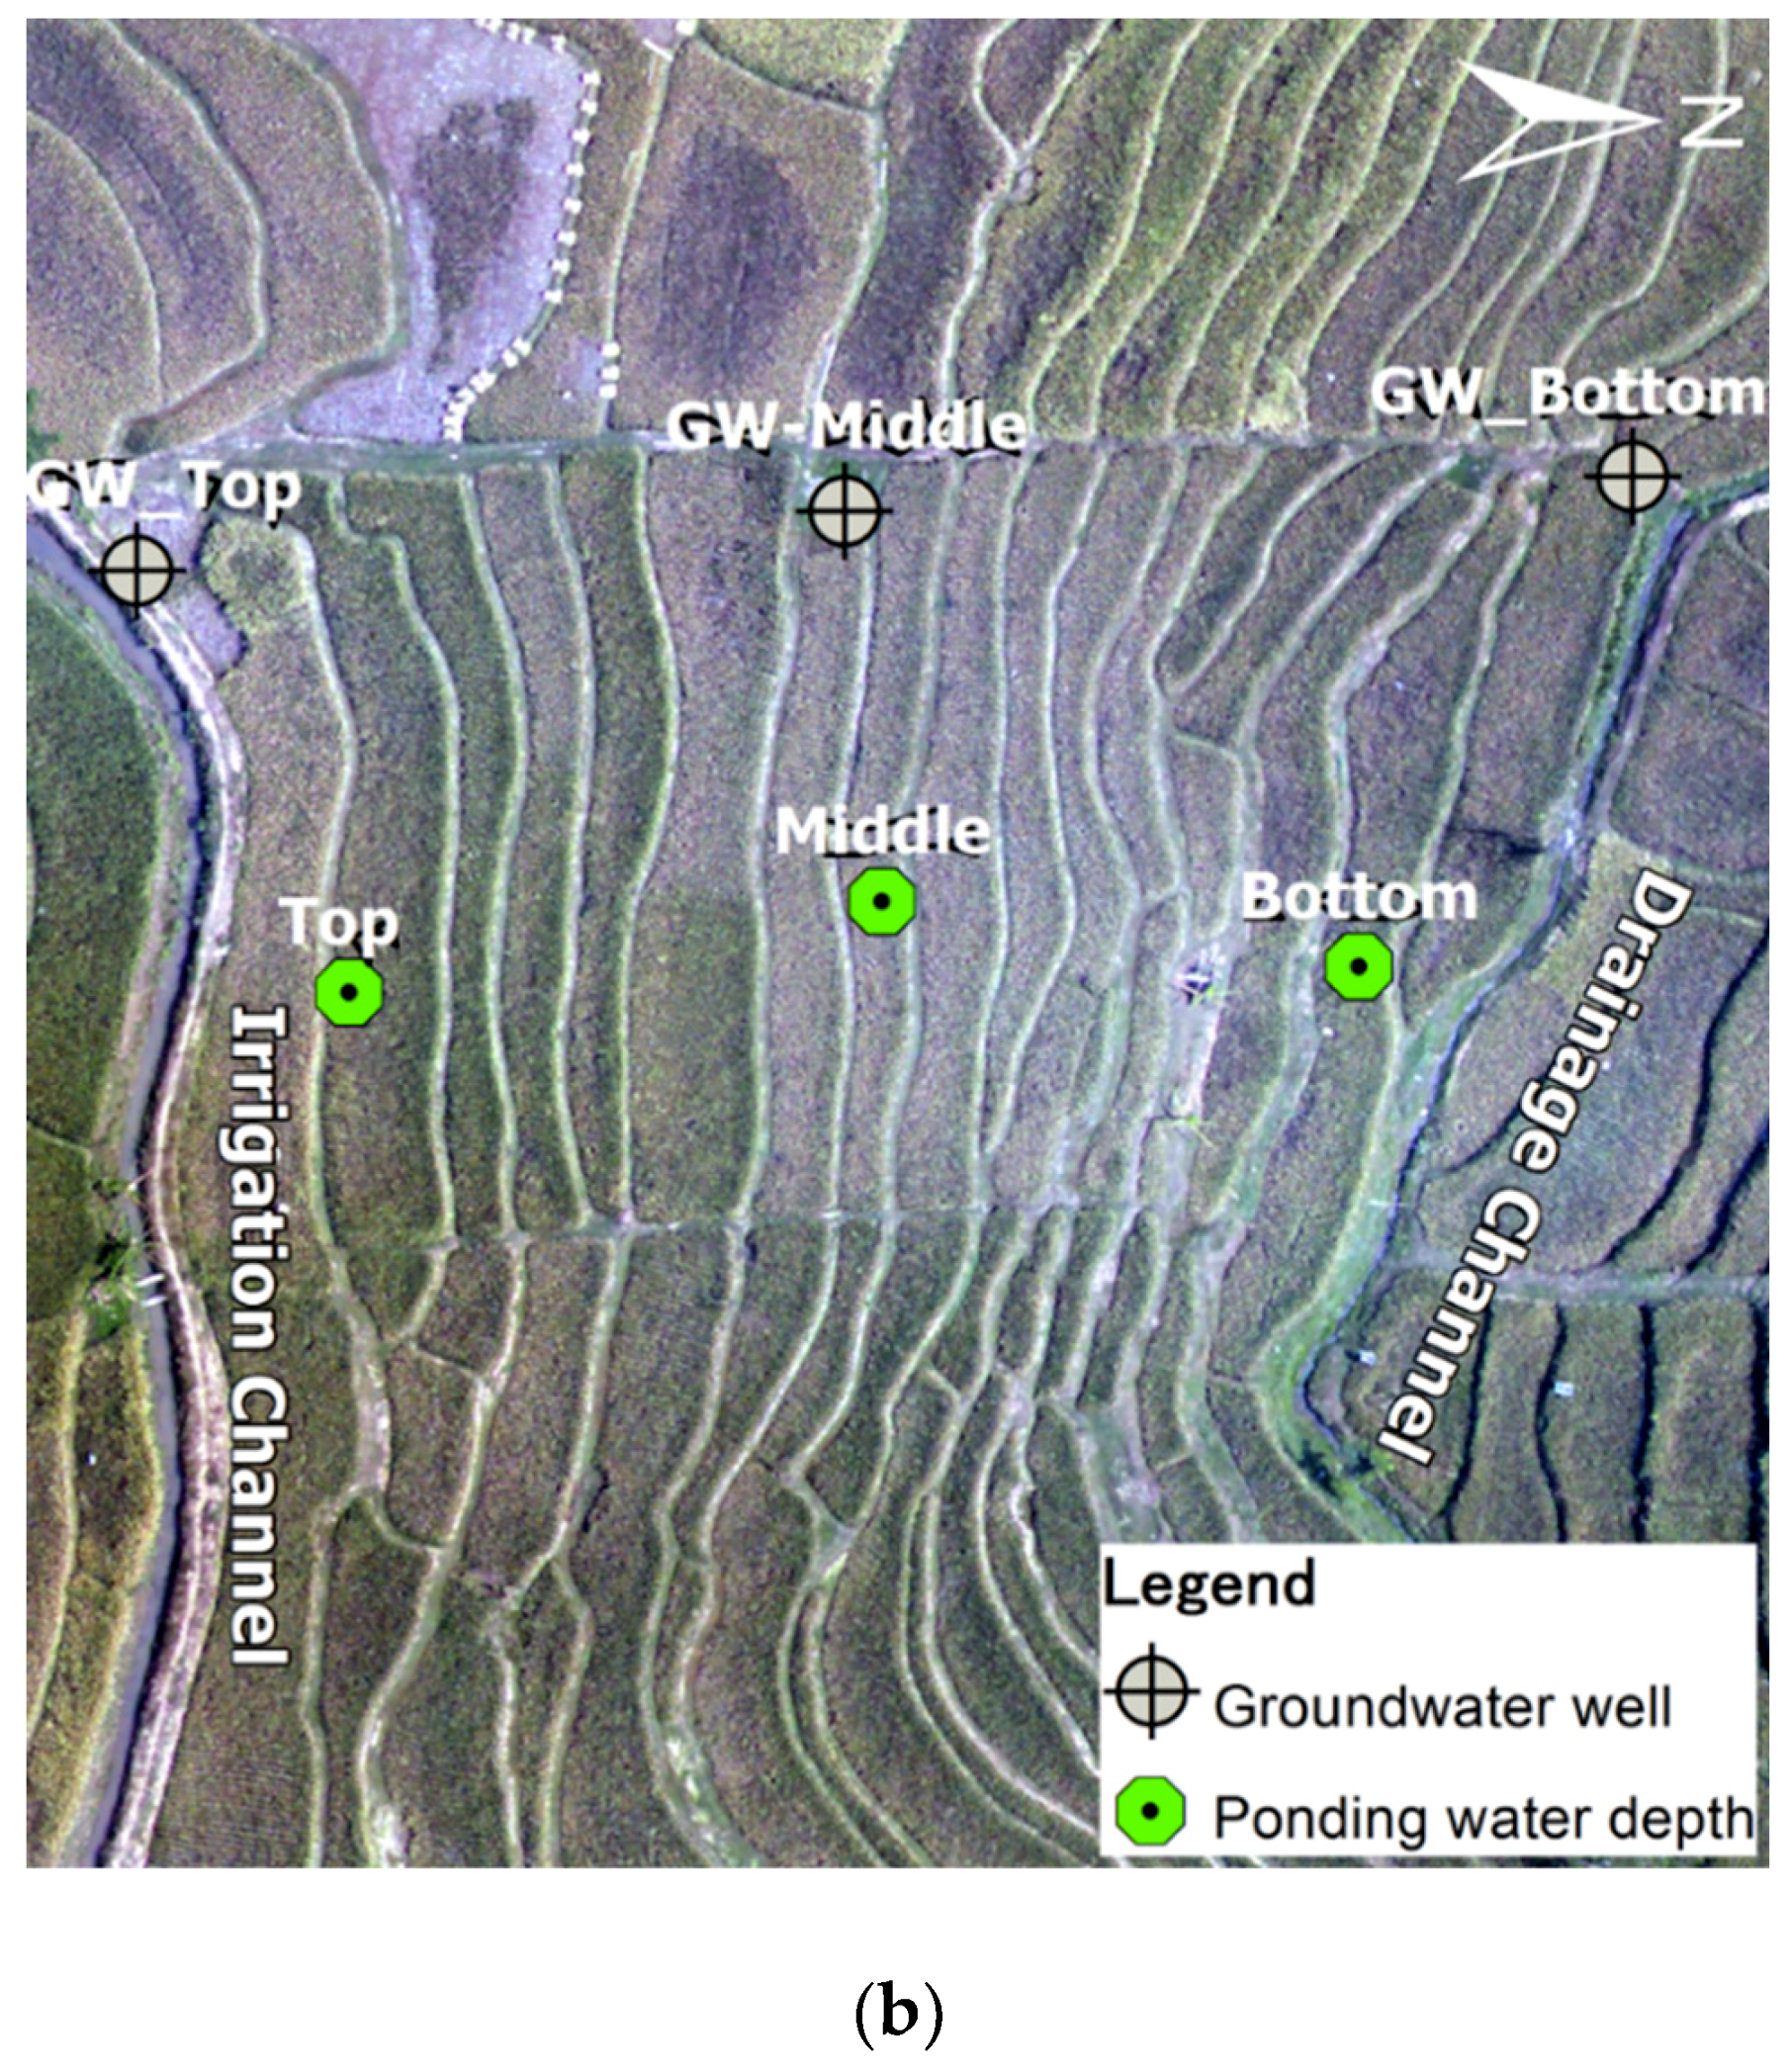
2.2.2. Observation of Hydrology of Terraced Paddies

Two hydrological observation schemes were conducted during different periods. First was the water balance analysis observation on the irrigation block scale from 2015 to 2016 (Figure 2). The irrigation block was decided by considering the natural flow of water in the terraced paddy area, where the water comes from irrigation channel, then flows down through the fields, and is finally channeled back to the river via small drainage. To calculate the evapotranspiration, the irrigation amount, discharge amount quantitated from the drainage flow, precipitation, and weather data were monitored daily to quantify the water balance in the observed irrigation block of the terraced paddy.
The second observation was the ground water level in the top, middle, and bottom terrace fields (Figure 3). These observation plots were used to study the influence of the height difference of paddy field on the hydrological condition. The difference in plot location was different according to water accessibility. Other aspects, such as agricultural management, rice variety, fertilizer, and cropping schedule, were similarly applied to all plots.
The hydrological observation including irrigation, drainage, ponding depth, and groundwater level was conducted using a Water Level Logger (Onset Computer Corporation HOBO U20L, Barnstable, Massachusetts, USA) to continuously monitor the water level in the field. The groundwater observation wells were drilled to record groundwater level continuously on each plot to determine the groundwater influence on the terraced area. Other components, such as precipitation and climate data, were obtained from the nearest meteorological station from the local institution (Irrigation Division of the Public Works Ministry and the Bengawan Solo Watershed Management Institute) located in each administrative districts or kecamatan (the major ones are 8 kecamatan in total) inside Keduang watershed; there are Girimarto, Ngadirojo, Sidoharjo, Nguntoronadi, Jatipurno, Jatisrono, Jatiroto, and Slogohimo. The other climate data were obtained from the meteorological station located in coordinate 7°59′ S and 110°58′ E.

3. Results

3.1. LST Trend with ENSO Phenomena

MODIS LST data were acquired from 2015–2018 and compared with monitored data. MODIS LST is a powerful index that monitors the heat on the surface, and it was determined by energy emission from the land area and was considerably affected by the land cover [40,41]. LST is typically higher in barren lands and in densely built up urban lands but decreases with an increase in vegetation cover [42]. Accordingly, in the northernmost region of the watershed, owing to the forestry land cover, LST was the lowest in this area. In the middle to lower area of the watershed, LST was higher owing to the major residential area and terraced paddy lands.
From the LST data, apparent changes in the surface temperature could be detected, especially its variability due to seasonal changes and ENSO phenomena. ENSO typically affects the near surface temperature, precipitation, and the onset and/or withdrawal of the rainy season. ENSO has a strong impact on the Indonesian climate. From 2015 to 2018, there were two El Niño occurrences and one La Niña (2016). In the El Niño period in Java, the near surface temperature tended to be warmer, the precipitation was lower than normal, the onset of rainfall was later than usual, and the dry season was longer and contrary during La Niña [6,7,43]. The same phenomena occurred in the observed watershed. As shown in Figure 4, during the El Niño years (2015 and 2018), LST was warmer especially in the dry season but cooler during La Niña in 2016, whereas the dry period was longer and precipitation was lower during El Niño but was shorter and higher in amount and intensity during La Niña (Figure 5).

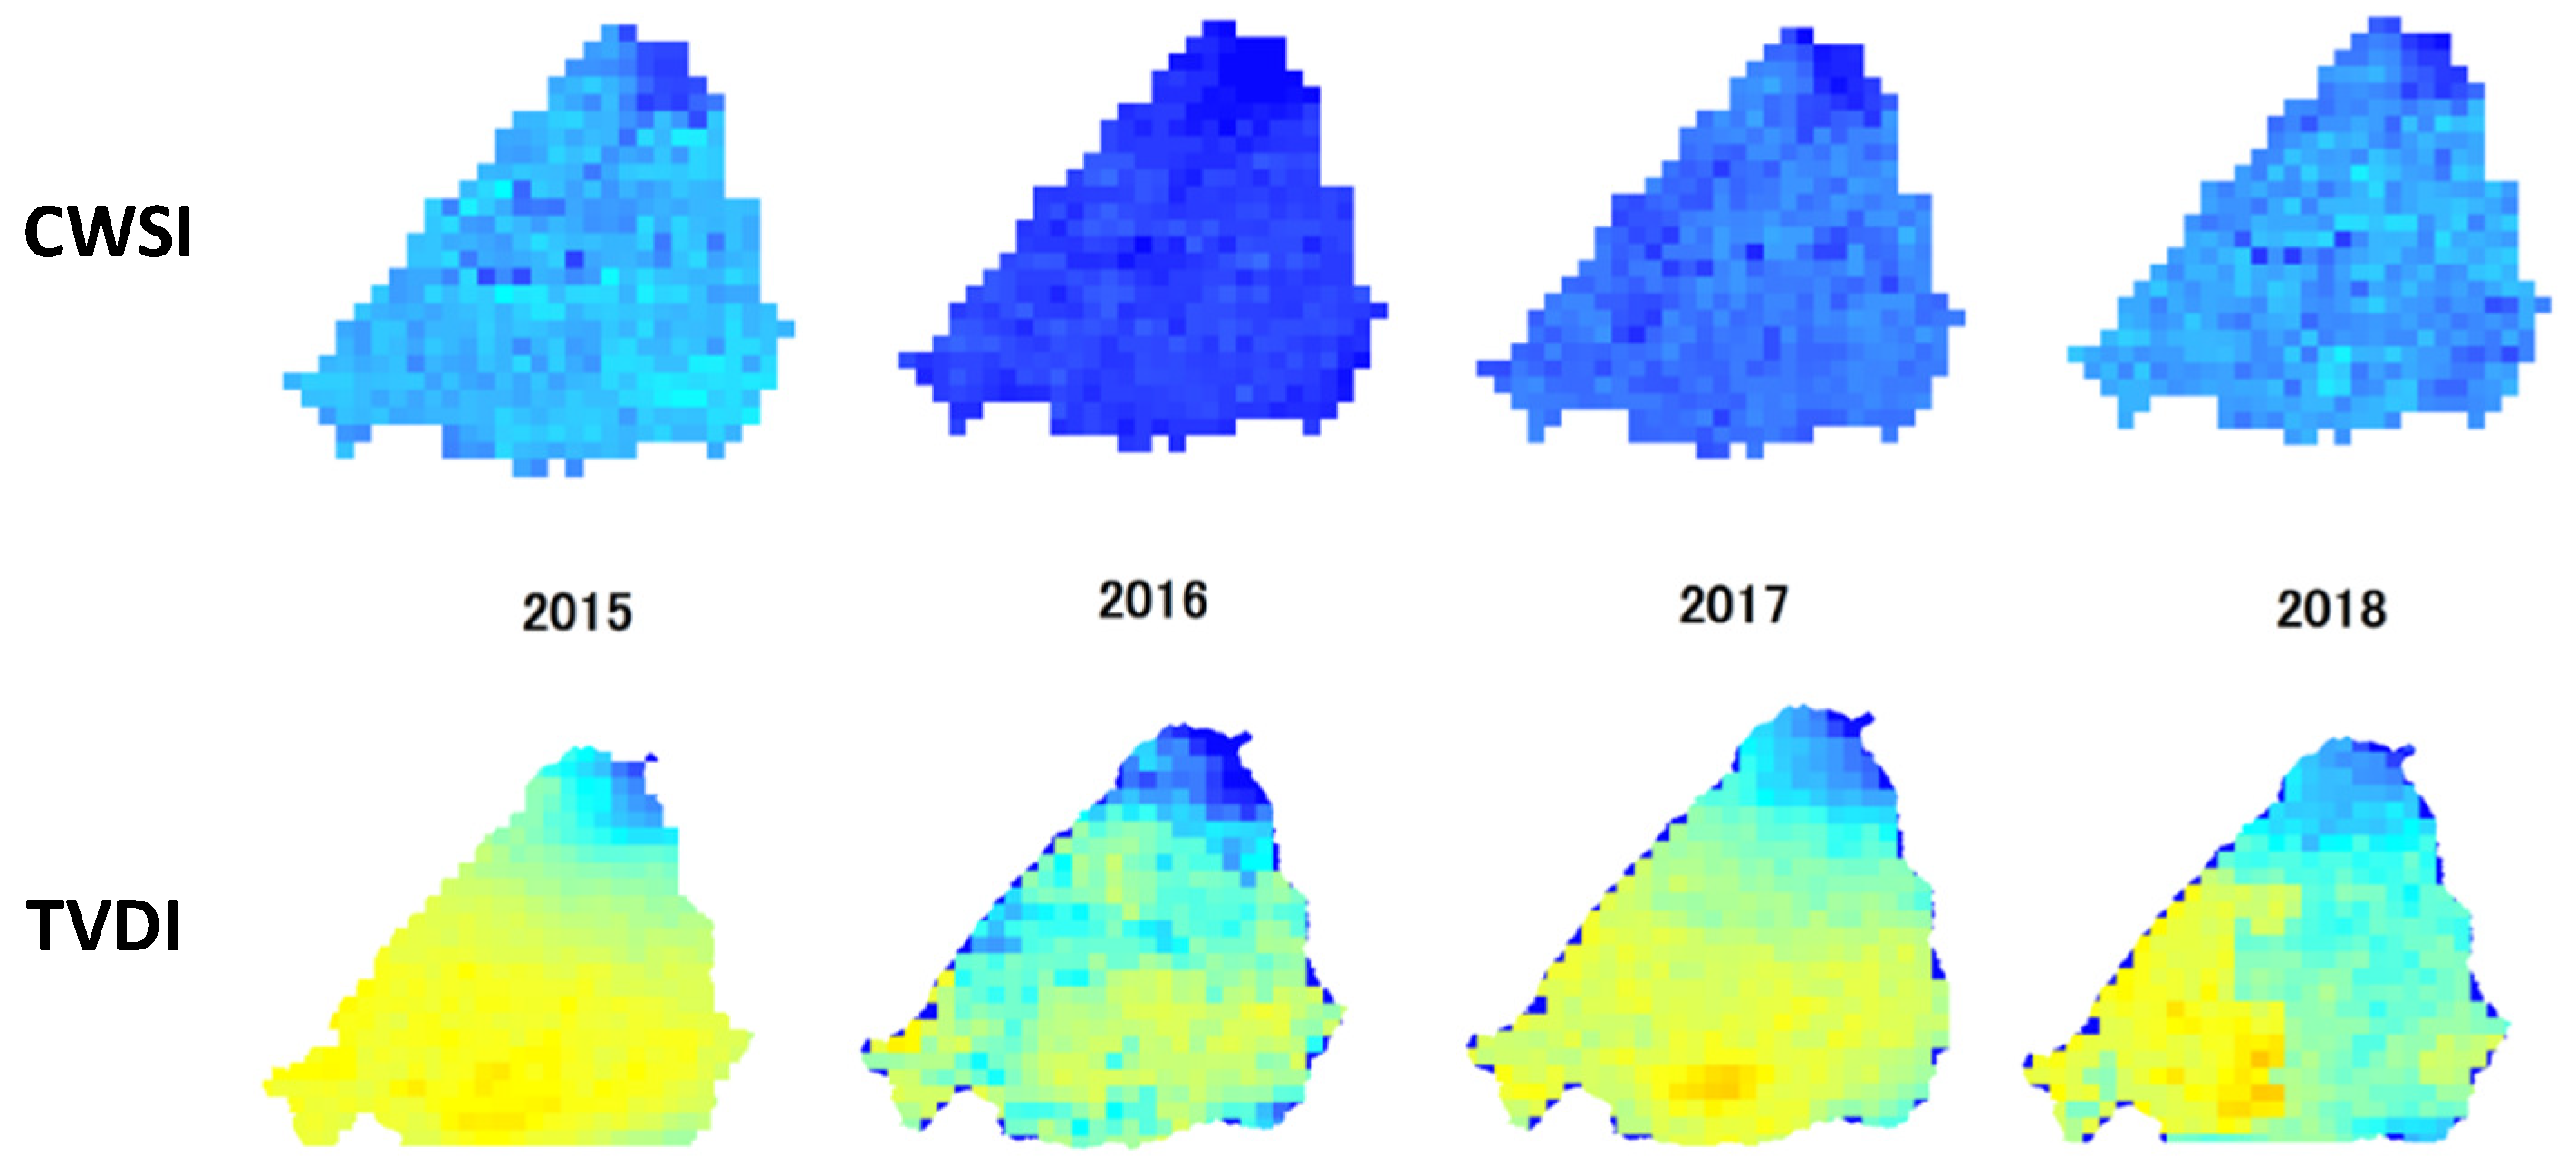
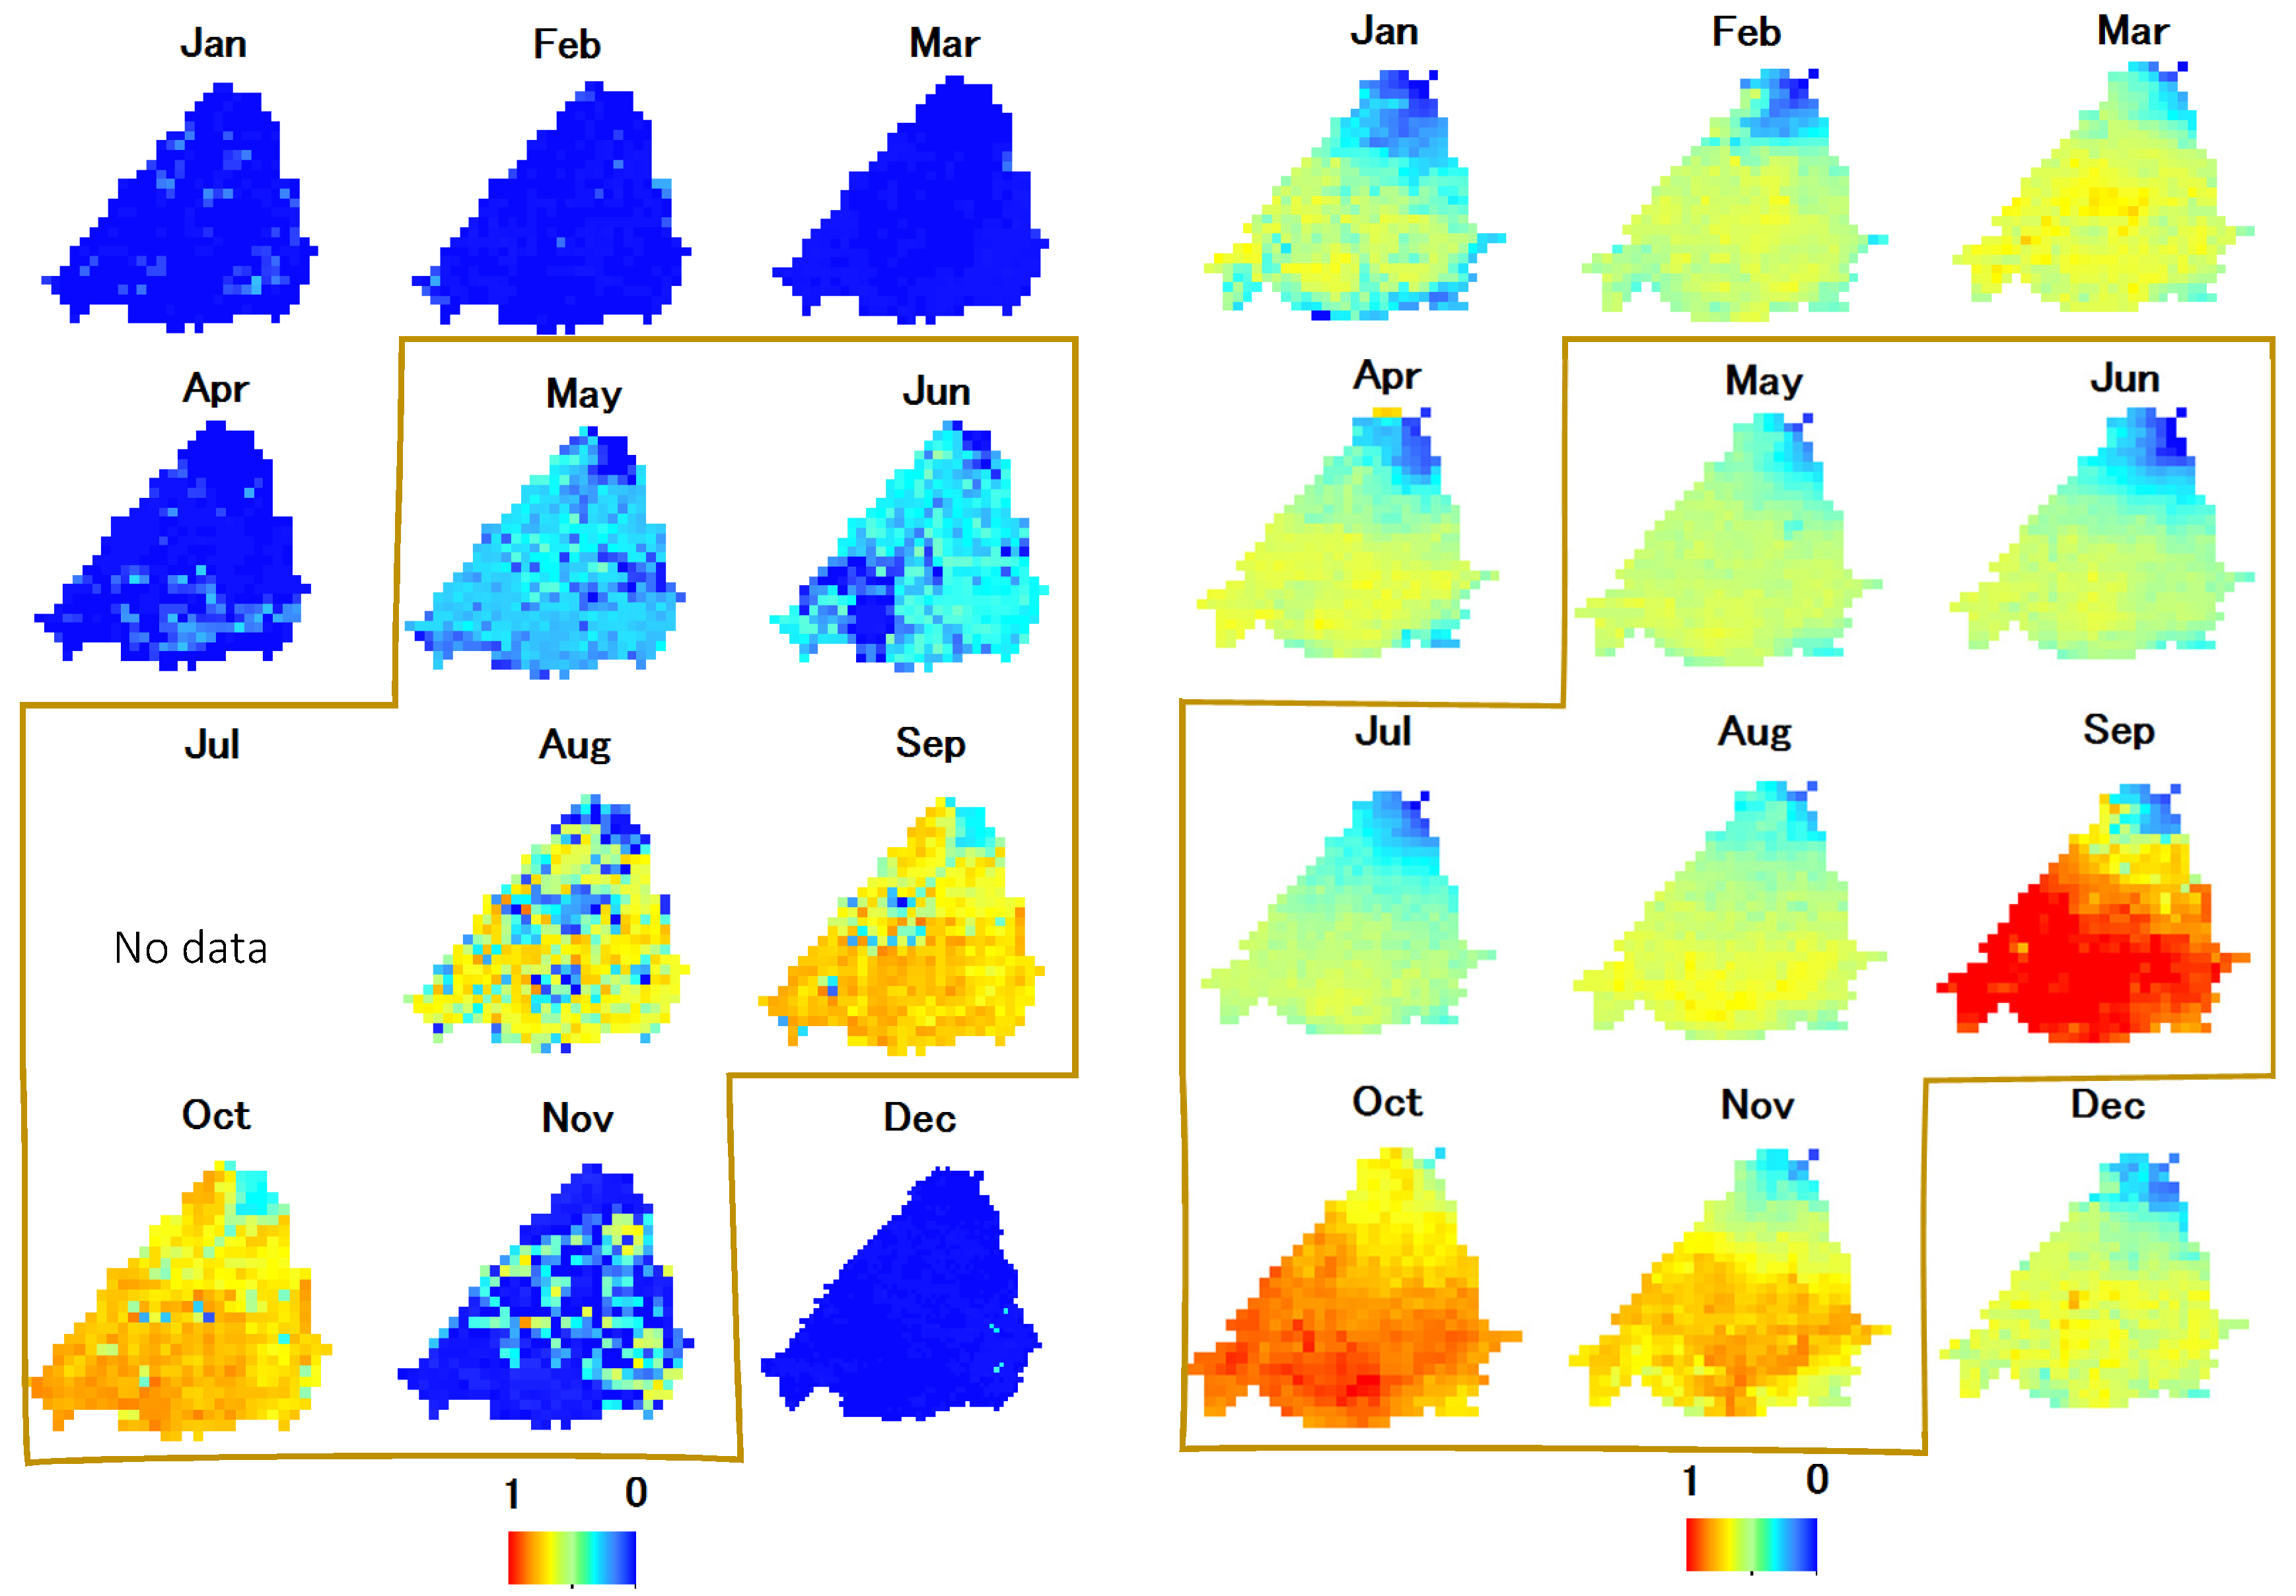
3.2. Spatio-Temporal Pattern of CWSI and TVDI

CWSI and TVDI were calculated for each month, and the annual indices were calculated using the average monthly indices (Figure 6). TVDI spatial distribution showed a more distinct spatial distributional pattern than CWSI. This resulted in a lower TVDI in the upper area of the watershed, which was covered by forest. In the middle and lower areas of the terraced paddy fields, TVDI was higher than in the forestry area. The same distribution pattern was observed in CWSI but was more apparent in TVDI. Although TVDI exhibited a higher value than CWSI, the tendency of distribution changes from 2015 to 2018 was the same between CWSI and TVDI. Drought was clearly present in 2015 (El Niño) but significantly decreased in 2016 (La Niña) and then increased in the following years (normal and El Niño).
The distribution of the impacted area is clearly depicted in Table 1 and Table 2. Although there was no clear trend in drought intensity based on CWSI or TVDI, we categorized the index value of 0 to 0.25 to represent a no drought or normal condition, 0.25 to 0.5 was slight water shortage, 0.5 to 0.75 was moderate water shortage, and 0.75 to 1 represented severe drought. According to the CWSI result, majority of the area was in normal condition during rainy season; however, later, some areas suffered a slight water shortage when entering the dry season. Compared to the normal year in 2017, where more than half of the area condition increased to slight water shortage, during the La Niña year (2016), most of the area remained normal. Only 1.6% area condition was worsened to have slight water shortage while in 2015 and 2018, around 80% of the area worsened because of El Niño. This was in accordance with the study conducted by D’Arrigo et al., which reported that drought in Java was strongly correlated with ENSO, and that the impact was intensified during El Niño [3,5]. Unlike CWSI, TVDI showed larger and worse water shortage condition. While CWSI depicted normal condition in the rainy season, TVDI showed a more disperse condition both in rainy season and dry season. The similarity was that there was also shift of water shortage during dry season though not as large as in CWSI. In addition, TVDI showed peculiarity in 2016 data where there was no difference between strong El-Niño and La-Niña effect in the dry season.
The development of drought throughout the year can be further monitored via monthly analysis. For clarity, the El Niño year period data is displayed in Figure 7. In the 2015 data, it was normal during the rainy season according to CWSI, the condition then worsened in the dry season from May to November. Intensifying process of water shortage was apparent when the dry season began and reached its peak on September–November [6]. The impacted area was primarily in the middle-to-downstream area of the terraced paddy field in the watershed. In the downstream area, the location was higher than the main river, which made it difficult to access the irrigation water for the fields. Due to this condition the fields in the main river surrounding were mostly cultivated with secondary crops. Owing to intensive agriculture (especially rice cultivation), lessening water conveyed through the stream could be witnessed in this area.

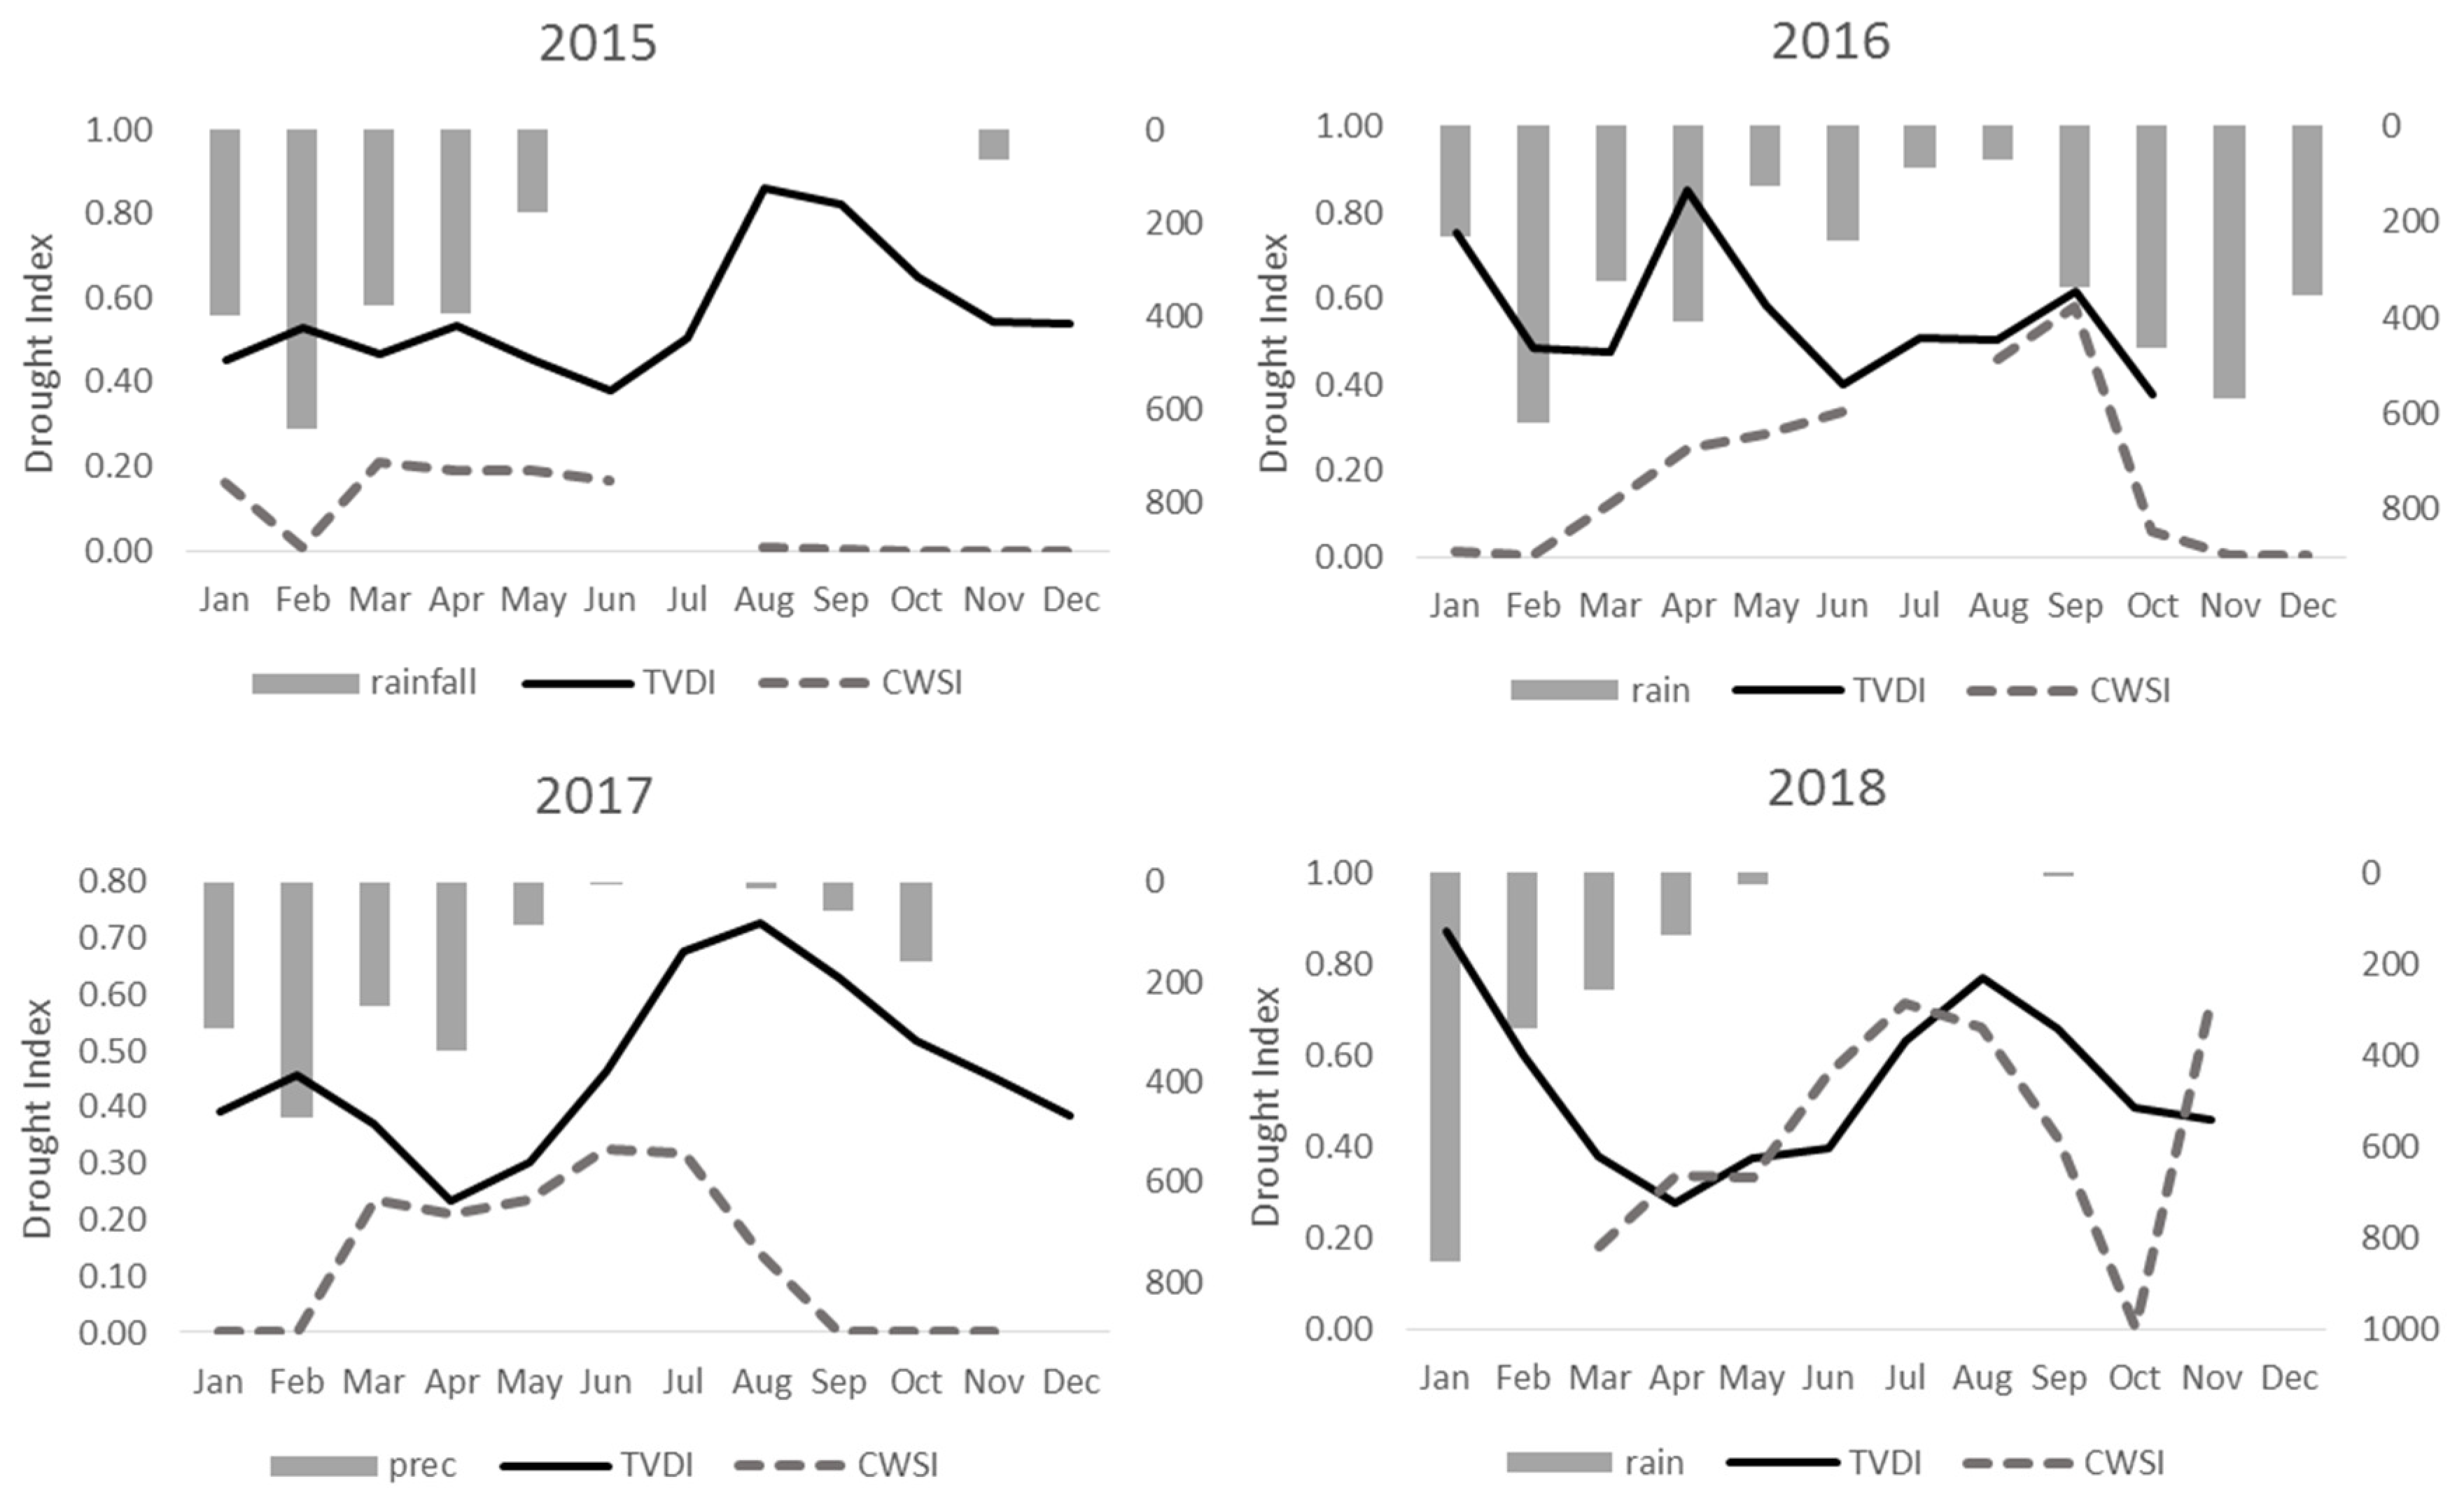
3.3. Drought Analysis in the Representative Grid Cell

To analyze the drought indices in the terraced paddy fields, a representative grid cell containing the observation area of terraced paddies was chosen as an example (see Figure 1). CWSI and TVDI were extracted from the watershed data and analyzed from 2015 to 2018 (Figure 8).
In the monthly data, drought tendency according to TVDI showed a higher intensity in the dry season but was unclear in the rainy season when the rainfall intensity was high, as in January to May (Table 3). Ideally, during the rainy season, due to the abundant water, there should be no risk of drought or water shortage occurring, whereas, in the dry season, water shortage increased when the rainfall began to decrease. This case was identified clearly using TVDI.
Based on the water availability from rainfall, the drought intensity during the dry season should be higher than during the rainy season. However, in the observed cell, CWSI showed that the water shortage was higher in the rainy season (December–March). This anomaly most probably was affected by the high precipitation so that remote sensing data showed peculiar results. Meanwhile, in the dry season, CWSI showed normal condition. This was assumed to be influenced by the paddy water management. Water balance and groundwater in the observed area was monitored for 2015–2016 (Table 4) and 2017–2018 to study the water management during the rice cultivation period. Terraced paddies in this area were irrigated with a plot-to-plot system and were continuously irrigated especially during the rainy season when the water was abundant; however, in the dry season, the terraced paddy was irrigated for half a day to optimize water allocation. According to the water balance data, most of the irrigated water infiltrated into the soil to become seepage as irrigation supply for the lower field or percolated to shallow groundwater and then partly resurfaced to the streamflow. This hydrological process in terraced paddy was as reported by Liu et al. and Huang et al. [45,46].
For 2015–2017, the CWSI increased during the rainy season and then decreased during the dry season; however, in 2018 it increased and remained high throughout the year but suddenly decreased in October. CWSI showed different results in 2018 when the drought intensified during the dry season because of the prolonged dry season that occurred due to El Niño. Although El Niño also occurred in 2015, precipitation in the rainy season was distributed and was not so high as in 2018; thus, water could be stored in the soil better during that year. Meanwhile, the intensity of rainfall was very high from January to March 2018 and significantly decreased in the months after (Table 3). This intense rainfall increased the runoff-rainfall ratio, decreased the infiltration rate, and eventually deprived the water storage for the following period.
TVDI showed a different tendency compared to the CWSI. In the TVDI, drought reached its peak from September–November TVDI has a strong correlation with biomass growth because it only considers LST and NDVI in the calculation. The paddies were cultivated three times in the observed area, as shown in Figure 9. Harvest time was regularly around December, March, and July during these months resulting in the biomass reached its lowest and reached its peak two months after May, September, and February. Thus, TVDI sometimes shows a small peak around April–May and reach its highest in September–November due to the biomass amount combined with the limited water availability during this period.

3.4. Hydrological Monitoring Results

In a 20-m-high terraced paddy, groundwater was monitored in the top, middle, and bottom field with a 10 m difference between them. Although there was groundwater table depression in the top field of the terraced paddy hills during the dry season, groundwater in the lower fields tended to be stable all year either in the rainy or dry season (Figure 10). The infiltrated water from the fields contributed around 30% to the groundwater system as displayed in Table 4. The top paddy plot tended to have enough water because of the close access to the irrigation channel; then, the middle and lower plots had a lower chance of obtaining enough water due to the plot-to-plot irrigation system. However, the ponding water depth did not show any significant difference in 2017 (Figure 11). In 2018 when a moderate El-Niño occurred, the dry period was prolonged; thus, brought about the decrease causing a decrease in ponding water in the top and bottom paddy fields from April to November.

4. Discussion

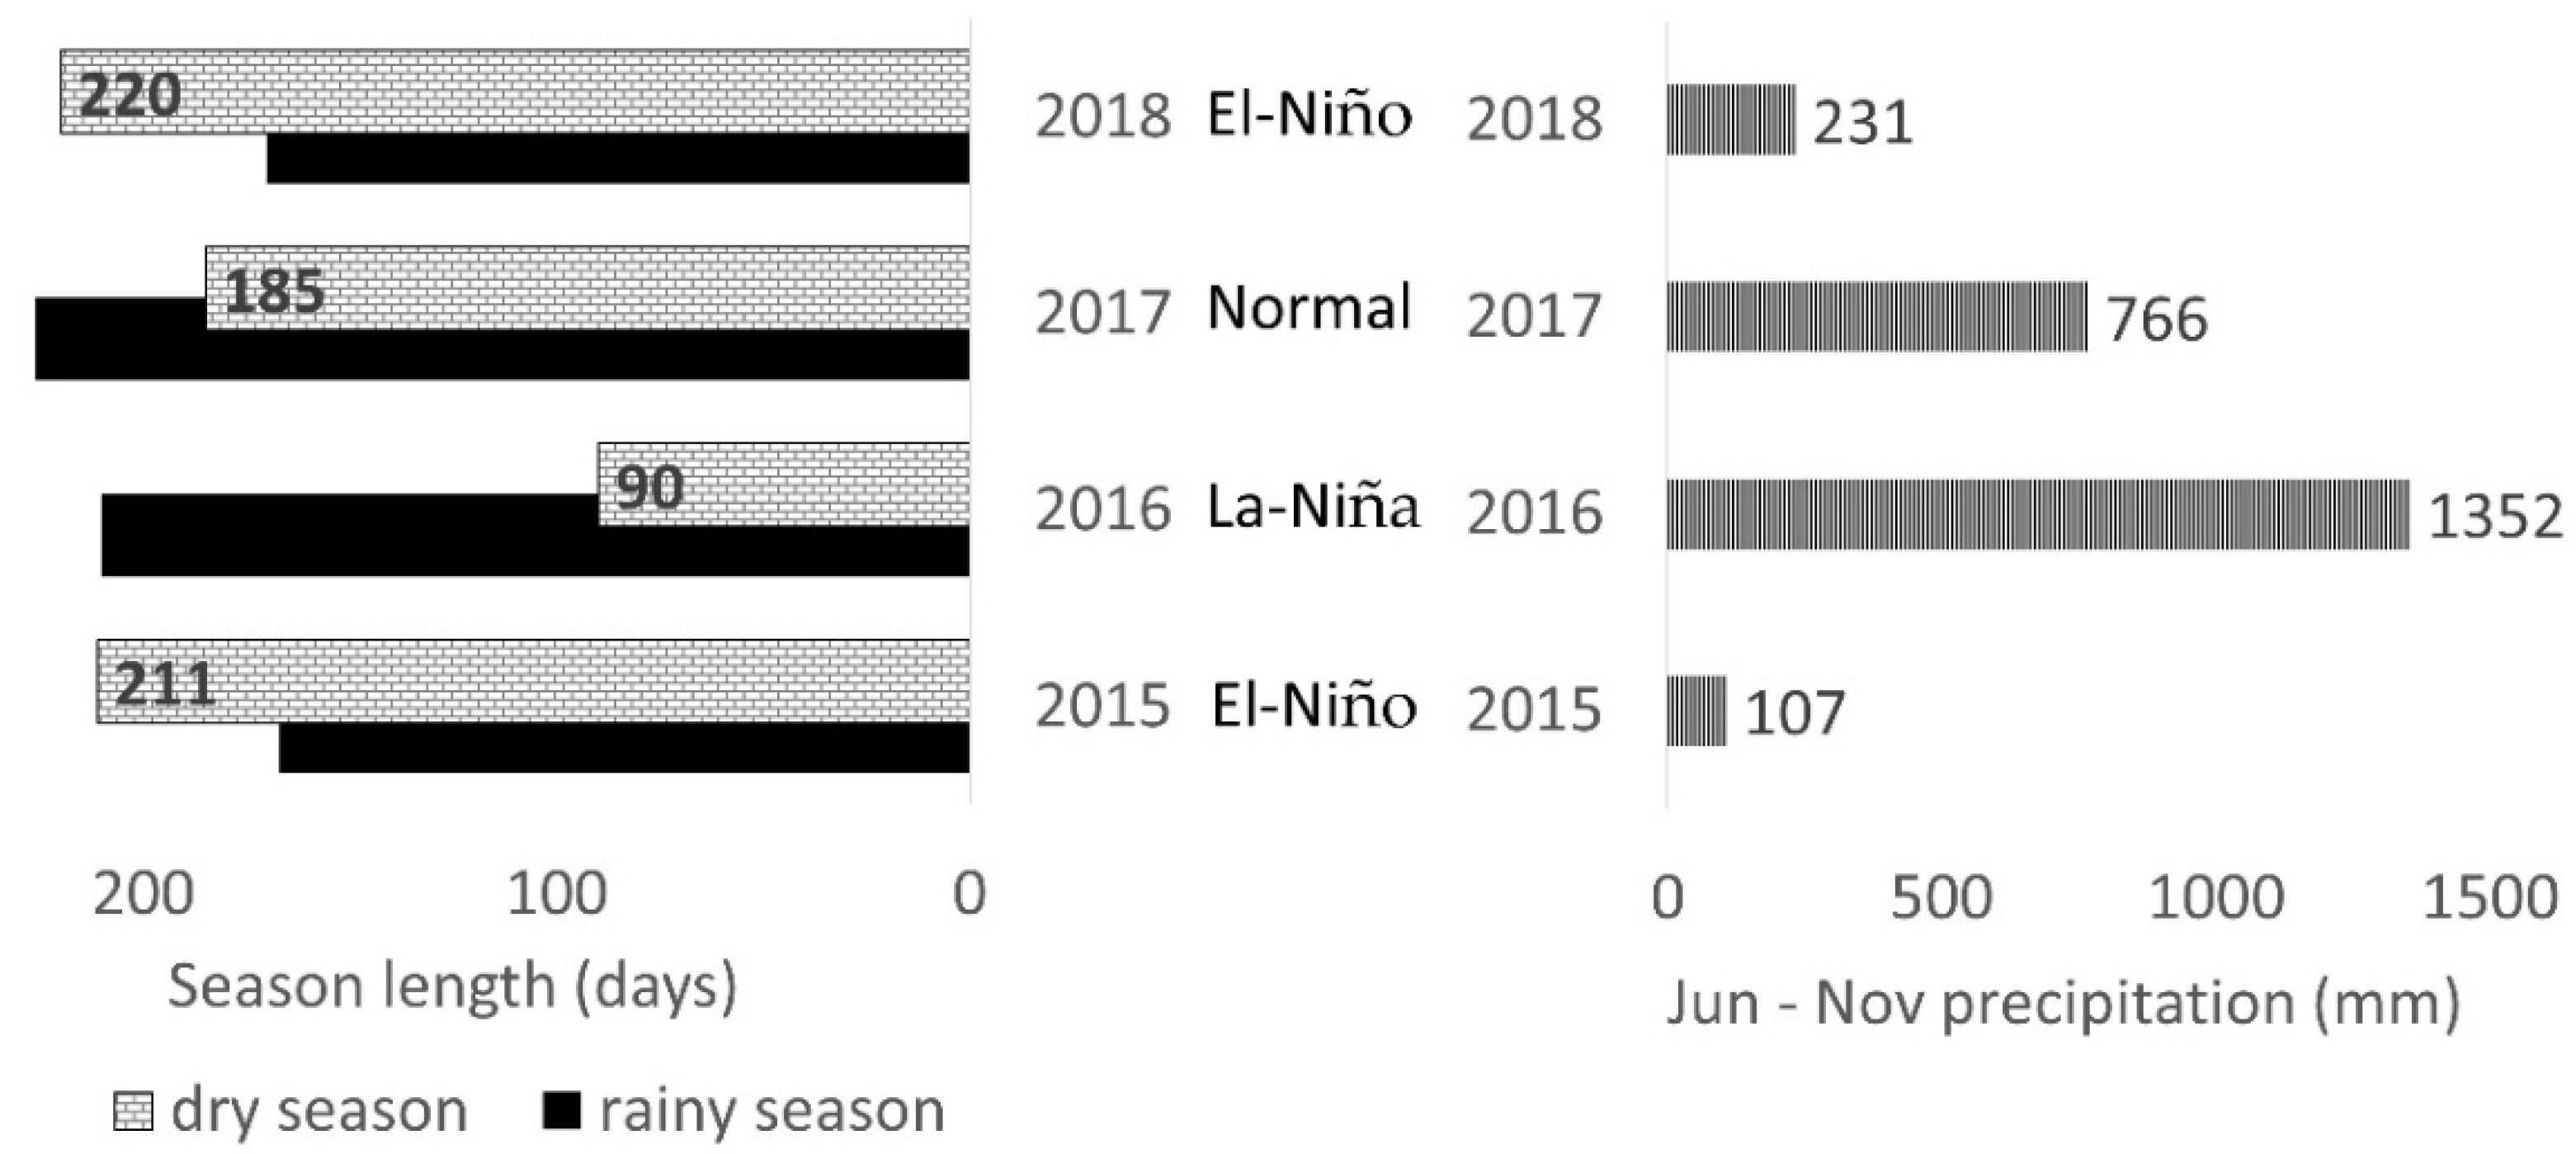
4.1. Drought and Its Relation to ENSO

As LST is closely related to the energy balance in the earth surface, it was evident that the LST reflected the tendency toward drought in the observed area. The LST data displayed how the surface was strongly influenced by the fluctuations of air temperature as it was becoming warmer during the El Niño period and cooler during the La Niña period. The tendency to warm up in the dry season when the rainfall ceased was also clearly shown by the LST data. Although the tendency of LST was in accordance with the climate conditions, it was not enough to show the drought intensity as the crops also plays a big role in the hydrology cycle; therefore, other components, such as biophysical parameters and vegetation indices, need to be considered to produce a more accurate index to monitor drought.
In the observed area, drought conditions were strongly influenced by the climate condition during the investigation. Based on the climate, in a normal year, water supply decreased in the rainy season, which coincided with the third rice cultivation period. During the dry season, some of the farmers could not cultivate rice due to the lack of water but could still cultivate by optimizing the available water supply via careful water allocation. This condition could be worsened when El Niño occurred. Climate variability, such as decreasing rainfall amounts and a prolonged dry season, lead to the intensifying droughts during El Niño. In contrast, during La Niña year, high intensity rainfall and a short dry period make drought impossible to occur.

4.2. CWSI and TVDI in Terraced Paddies

The result of drought monitoring showed that CWSI was very different from TVDI. CWSI showed a lower degree of drought than TVDI. A similar result was also present in the research conducted by Bai et al. in China which showed that CWSI had lower degree of drought compared to TVDI [30]. Similar pattern in the spatial distributions between CWSI and TVDI could be identified both in the previous (Bai, et al.) and current research, though the correlation of the two indices was lower in our research (0.048). The hydrology of the observed area, where the topography and main crops were different from those in our study, may be the reasons for the differences from the results in Bai et al. Their studied plain areas with winter wheat and summer corn have different hydrology characteristics from a terraced paddy area.
According to the TVDI, drought was expected to be high. However, the annual average rice yield and total production data (Table 5) for the observed period did not show any changes that corresponded to the indicated drought. There was indeed decline in rice production throughout the year, as in from first to third cultivation in a year (R2 = 0.64 for CWSI, R2 = 0.31 for TVDI) as a natural response to the decrease of precipitation from rainy to dry season. However, if we look further into the same period, as in July to August across the year, the correlation was quite weak (R2 = 0.001 in CWSI, R2 = 0.02 in TVDI). In this area, irrigation was continuously supplied from the river weir. In the El Niño year, water resources could have been decreased; however, the damage was mitigated by water management. Perhaps seepage loss was regulated by the high ground water level. Generally, terraced paddy fields were supplied by surface irrigation as well as ground water discharge from the upper terraces or from forestry. A similar case where 21% to 23% of irrigation water contributed to groundwater recharge and later became subsurface return flow as irrigation for the lower terrace was reported by Liu et al. [45]. Most of the seepage water penetrates to the ground water surface (see Table 4), and a part of it is supplied to the adjacent paddy. Thus, paddy fields might be resilient to droughts.
Furthermore, during the dry season, irrigation water was managed more strictly by the farmers to save resources. Shimpei (2007) reported that irrigation in terraced paddy was designed not only to irrigate the rice but also for other purposes such as storing water, maintaining favorable soil condition, and protecting the terrace structure [35]. That is why, irrigation in terraced paddy was often kept continuously irrigated during cultivation period. This irrigation method contributed to mitigating the drought damage. Table 5 shows that even during the 2015 El Niño, yield and harvested area was maintained at a high level, although it was also inevitable that other external factors, such as a government mitigation plan, also played a role in maintaining the rice production [47]. During the 2016 La Niña, the harvested area decreased owing to failed harvest because of high rainfall. ENSO prediction is helpful in mitigating the impact of droughts in terraced paddy areas and can help in mapping the treatment of each specific area, especially during the times of an El Niño.

4.3. Influence of Hydrology on Drought in Terraced Paddies

CWSI is a widely used index for monitoring plant water status in crops. Among other indices for drought monitoring CWSI had a high precision [31]. However, CWSI shows weak correlation of rice production with drought in inundated condition of rice production as stated in Section 4.2. Looking from the water condition, though terraced paddy fields being inundated most of the time, there was decrease in the amount of irrigation supply in result of diminishing precipitation during the dry season. Water loss in the paddy field, according to Huang et al., majorly not through the middle of the field but went through paddy bund and raiser, or slope surface, of the terrace where it is easily dried up during dry condition [46,48]. As the farmers started to limit the irrigation time into half a day in dry season, surface of paddy fields might seem to be in inundated condition but ponding water depth would be shallower especially in the prolonged dry season of 2018 (see Figure 8). Based on the result between the indices and monthly precipitation in each region, CWSI had negative correlation with the precipitation but relatively weak as many of the indices value fell on the no precipitation or large precipitation zone (R2 = 0.55, see Figure 12). In the no precipitation events, CWSI value varied greatly from 0.2 to 0.8. It reflected that CWSI was affected not only by water availability, as in precipitation, but also other factors such as irrigation and crop growth condition. CWSI value would naturally increase after precipitation decreases and continue to increase in the prolonged dry situation, but looking at the same condition of the prolonged drought in 2015 and 2018 the index behavior was a little different. Though the rainy season both started in November, in 2015 the index in many of the area inside watershed remained high until October but in 2018 it started to decrease from September.
On the other hand, TVDI showed very weak correlation with the precipitation (r2 = 0.0001). TVDI showed an overestimation of drought condition. It could be explained from Figure 7 where TVDI value reach almost 1 (severe drought) considering there was no severe drought damage reported in the observed area even during El-Niño and the rice production. Based on the TVDI approach, which combined the relation between NDVI and LST, it depicted how TVDI mainly reflected what happened in the surface conditions while, in this watershed, the hydrology (later linked to crop cultivation) was interlinked with both surface and groundwater [45,49].
Both CWSI and TVDI not precisely represented drought in terraced paddy fields. However, both indices are generally showing adequate fluctuation of wet and dry season condition. In regards to evaluate TVDI, as these indices need to capture condition from the driest to the wettest, a longer period of observation is needed to gain a more accurate result. Since the current observation period was only four years, it was possible that the data did not show an accurate dry edge of the observed area.
Regardless, in the representative grid cell, CWSI value was high during the rainy season but lower during the dry season. Due to the high precipitation amount and high humidity in the rainy season, the evapotranspiration amount decreased and eventually caused the CWSI to be higher compared to during the dry season, as shown by the 2015–2017 data in Figure 6. In addition, flooded conditions in the terraced paddy during the dry season created an evaporative cooling effect for the surrounding atmosphere of the canopy, and it lowered the land surface temperature (LST). This was also reported by Lang et al. and Baldocchi et al. in their study of the influence of a flooded rice area on the evapotranspiration [50,51]. They reported that these flooded areas can promote an “oasis effect” and affect evapotranspiration in the area. Irrigation methods in the terraced paddy fields, where farmers kept the water flow continuous from plot to plot, kept the temperature of the water inside the paddy field low, which further amplified the evaporative cooling effect in this area (Figure 13). The detail mechanism of this phenomena in terraced paddy fields needs to be studied further to fully understand the unique system of terraced paddies and its influence on rice production activity.
Based on the research, we determined that the current water management conducted by farmers is sufficient to mitigate drought conditions. However, consideration of the groundwater contribution on the water resources in terraced paddy areas needs to be integrated to provide robust water management.

5. Conclusions

Due to its importance for the livelihood of people and for environment sustainability, terraced paddy fields need to be maintained well. In this study, TVDI and CWSI were compared to analyze the drought conditions temporally and spatially in an area containing terraced paddy fields. The influence of ENSO on this area was also apparent when the drought eased in La Niña years but intensified in El Niño years. Generally, TVDI and CWSI could be used to monitor drought in terraced paddies, but they are still not accurate enough because the complexity of terraced paddies is different from normal land conditions. Although TVDI showed a better tendency in terms of land cover distribution, it overestimated the drought intensity while CWSI showed a lower value for drought but was unclear during the rainy season. Nevertheless, through this research we found that rice cultivation in terraced paddies was relatively stable under the different climate conditions. Additionally, groundwater contributes considerably to stabilizing the hydrology conditions in terraced paddy areas. Further study of the modification of the drought indices need to be conducted to obtain more reliable drought analysis of terraced paddy areas toward damage mitigation of drought in the event of intensifying ENSO.

Author Contributions

Conceptualization, A.F. (Atiqotun Fitriyah) and T.K.; data curation, A.F. (Atiqotun Fitriyah); formal analysis, A.F. (Atiqotun Fitriyah); funding acquisition, T.K.; investigation, A.F. (Atiqotun Fitriyah); methodology, A.F. (Atiqotun Fitriyah) and A.F. (Alvin Fatikhunnada); project administration, F.O. and T.K.; resources, T.K.; software, A.F. (Alvin Fatikhunnada); supervision, B.D.A.N. and T.K.; Writing—original draft, A.F. (Atiqotun Fitriyah); Writing—review & editing, F.O., B.D.A.N. and T.K.

Funding

This work was partially supported by Japan Society for the Promotion of Science KAKENHI Grant Number 18H02295.

Acknowledgments

The authors would like to appreciate Suparno the head farmer, his daughter, Gemawang Kidul farmer association, Bayu Dwi Apri Nugroho’s team and Chusnul Arief’s team for their continuous support and cooperation during investigation process. We also would like to thank Enago for improving our English writing as well as the the reviewers and editors of this paper.

Conflicts of Interest

The authors declare no conflict of interest.

References

  1. Badan Nasional Penanggulangan Bencana. Indonesia: National Action Plan for Disaster Risk Reduction 2010–2012; Badan Nasional Penanggulangan Bencana: Jakarta, Indonesia, 2012.
  2. Mursidi, A.; Sari, D.A.P. Management of disaster drought in Indonesia. J. Appl. Manag. Bus. 2017, 3, 165–171. [Google Scholar]
  3. D’Arrigo, R.; Wilson, R.; Palmer, J.; Krusic, P.; Curtis, A.; Sakulich, J.; Bijaksana, S.; Zulaikah, S.; Ngkoimani, L.O. Monsoon drought over Java, Indonesia, during the past two centuries. Geophys. Res. Lett. 2006, 33, L04709. [Google Scholar] [CrossRef] [Green Version]
  4. D’Arrigo, R.; Wilson, R. El Niño and Indian Ocean influences on Indonesian drought: Implications for forecasting rainfall and crop productivity. Int. J. Climatol. 2008, 28, 611–616. [Google Scholar] [CrossRef]
  5. D’Arrigo, R.; Smerdon, J.E. Tropical climate influences on drought variability over Java, Indonesia. Geophys. Res. Lett. 2008, 35, L05707. [Google Scholar] [CrossRef] [Green Version]
  6. Tangang, F.; Salimun, E.; Aldrian, E.; Sopaheluwakan, A.; Juneng, L. ENSO modulation of seasonal rainfall and extremes in Indonesia. Clim. Dyn. 2018, 51, 2559–2580. [Google Scholar] [CrossRef]
  7. Hamada, J.-I.; Yamanaka, M.D.; Matsumoto, J.; Fukao, S.; Winarso, P.A.; Sribimawati, T. Spatial and temporal variations of the rainy season over Indonesia and their link to ENSO. J. Meteorol. Soc. Jpn. 2004, 80, 285–310. [Google Scholar] [CrossRef] [Green Version]
  8. Nugroho, B.D.A.; Nuraini, L. Cropping pattern scenario based on global climate indices and rainfall in banyumas district, central java, Indonesia. Agric. Agric. Sci. Procedia 2016, 9, 54–63. [Google Scholar] [CrossRef] [Green Version]
  9. Nugroho, B.D.A.; Toriyama, K.; Kobayashi, K.; Arif, C.; Yokoyama, S.; Mizoguchi, M. Effect of intermittent irrigation following the system of rice intensification (SRI) on rice yield in a farmer’s paddy fields in Indonesia. Paddy Water Environ. 2018, 16, 715–723. [Google Scholar] [CrossRef]
  10. Muthayya, S.; Sugimoto, J.D.; Montgomery, S.; Maberly, G.F. An overview of global rice production, supply, trade, and consumption. Ann. N. Y. Acad. Sci. 2014, 1324, 7–14. [Google Scholar] [CrossRef]
  11. FAO. FAO Rice Market Monitor; FAO: Rome, Italy, 2015; Vol. XVIII. [Google Scholar]
  12. Razali, I.A.; Hanum, H. Identification of nutritional status and paddy production in paddy field terracing and non terracing system in Onan Rungu Subdistrict, District of Samosir. J. Agroekoteknol. 2017, 5, 338–347. (In Indonesian) [Google Scholar]
  13. Thenkabail, P.S.; Gamage, M.S.D.N.; Smakhtin, V.U. The Use of Remote Sensing Data for Drought Assessment and Monitoring in Southwest Asia; IWMI: Colombo, Sri Lanka, 2004. [Google Scholar]
  14. Son, N.T.; Chen, C.F.; Chen, C.R.; Chang, L.Y.; Minh, V.Q. Monitoring agricultural drought in the lower mekong basin using MODIS NDVI and land surface temperature data. Int. J. Appl. Earth Obs. Geoinf. 2012, 18, 417–427. [Google Scholar] [CrossRef]
  15. Rachid, S.; Bennett, J.; Hardy, B.; International Rice Research Institute. Drought Frontiers in Rice: Crop Improvement for Increased Rainfed Production; IRRI: Los Baños, Philippines, 2008; ISBN 978-971-22-0237-7. [Google Scholar]
  16. USGS Droughts: Things to Know. Available online: https://www.usgs.gov/special-topic/water-science-school/science/droughts-things-know?qt-science_center_objects=0#qt-science_center_objects (accessed on 2 November 2019).
  17. Svoboda, M.; Fuchs, B.A. Handbook of Drought Indicators and Indices; World Meteorological Organization (WMO) and Global Water Partnership (GWP): Geneva, Switzerland, 2016. [Google Scholar]
  18. Kogan, F. World droughts in the new millennium from AVHRR-based vegetation health indices. Eos Trans. Am. Geophys. Union 2002, 83, 557–563. [Google Scholar] [CrossRef]
  19. Mishra, A.K.; Singh, V.P. A review of drought concepts. J. Hydrol. 2010, 391, 202–216. [Google Scholar] [CrossRef]
  20. Carrão, H.; Russo, S.; Sepulcre-Canto, G.; Barbosa, P. An empirical standardized soil moisture index for agricultural drought assessment from remotely sensed data. Int. J. Appl. Earth Obs. Geoinf. 2016, 48, 74–84. [Google Scholar] [CrossRef]
  21. Sruthi, S.; Mohammed Aslam, M. Agricultural drought analysis using the NDVI and land surface temperature data; a case study of Raichur district. Aquat. Procedia 2015, 4, 1258–1264. [Google Scholar] [CrossRef]
  22. Khomarudin, M.R.; Sofan, P. Crop Water Stress Index (CWSI) estimation using MODIS data. Int. J. Remote Sens. Earth Sci. IJReSES 2018, 3, 80–84. [Google Scholar] [CrossRef] [Green Version]
  23. Idso, S.B.; Jackson, R.D.; Pinter, P.J.; Reginato, R.J.; Hatfield, J.L. Normalizing the stress-degree-day parameter for environmental variability. Agric. Meteorol. 1981, 24, 45–55. [Google Scholar] [CrossRef]
  24. Jackson, R.D.; Idso, S.B.; Reginato, R.J.; Pinter, P.J. Canopy temperature as a crop water stress indicator. Water Resour. Res. 1981, 17, 1133–1138. [Google Scholar] [CrossRef]
  25. Andrews, P.K.; Chalmers, D.J.; Moremong, M. Canopy-Air Temperature Differences and Soil Water as Predictors of Water Stress of Apple Trees Grown in a Humid, Temperate Climate. J. Am. Soc. Hortic. Sci. 1992, 117, 453–458. [Google Scholar] [CrossRef] [Green Version]
  26. Pou, A.; Diago, M.P.; Medrano, H.; Baluja, J.; Tardaguila, J. Validation of thermal indices for water status identification in grapevine. Agric. Water Manag. 2014, 134, 60–72. [Google Scholar] [CrossRef]
  27. Xu, J.; Lv, Y.; Liu, X.; Dalson, T.; Yang, S.; Wu, J. Diagnosing crop water stress of rice using infra-red thermal imager under water deficit condition. Int. J. Agric. Biol. 2016, 18, 565–572. [Google Scholar] [CrossRef]
  28. Taghvaeian, S.; Chávez, J.L.; Altenhofen, J.; Trouth, T.; DeJonge, K. Remote sensing for evaluating crop waterstress at field scale using infrared thermography: Potential and limitations. Hydrol. Days. 2013, 4, 74–83. [Google Scholar]
  29. Bai, J.; Yu, Y.; Di, L. Comparison between TVDI and CWSI for drought monitoring in the Guanzhong Plain, China. J. Integr. Agric. 2017, 16, 389–397. [Google Scholar] [CrossRef] [Green Version]
  30. Wu, H.; Xiong, D.; Liu, B.; Zhang, S.; Yuan, Y.; Fang, Y.; Chidi, C.L.; Dahal, N.M. Spatio-temporal analysis of drought variability using CWSI in the Koshi River Basin (KRB). Int. J. Environ. Res. Public Health 2019, 16, 3100. [Google Scholar] [CrossRef] [Green Version]
  31. Sandholt, I.; Rasmussen, K.; Andersen, J. Derivation of a dryness index from NOAA-AVHRR data for use in large-scale hydrological modelling. In Remote Sensing and Hydrology 2000; International Assn of Hydrological Sciences: Wallingford, UK, 2001; pp. 212–216. [Google Scholar]
  32. Nur’utami, M.N.; Hidayat, R. Influences of IOD and ENSO to Indonesian rainfall variability: Role of atmosphere-ocean interaction in the indo-pacific sector. Procedia Environ. Sci. 2016, 33, 196–203. [Google Scholar] [CrossRef] [Green Version]
  33. The Jakarta Post. Prolonged Drought Drains Dams, Halts Electricity Supplies. Available online: https://www.thejakartapost.com/news/2015/11/03/prolonged-drought-drains-dams-halts-electricity-supplies.html (accessed on 2 August 2019).
  34. Shimpei, A. Agricultural Technologies of Terraced Rice Cultivation in the Ailao Mountains, Yunnan, China. Asian Afr. Area Stud. 2007, 6, 173–196. [Google Scholar]
  35. Busetto, L.; Ranghetti, L. MODIStsp: An R package for automatic preprocessing of MODIS land products time series. Comput. Geosci. 2016, 97, 40–48. [Google Scholar] [CrossRef] [Green Version]
  36. Jackson, R.D.; Kustas, W.P.; Choudhury, B.J. A reexamination of the crop water stress index. Irrig. Sci. 1988, 9, 309–317. [Google Scholar] [CrossRef]
  37. Mu, Q. Algorithm Theoretical Basis Document: MODIS Global Terrestrial Evapotranspiration (ET) Product (NASA MOD16A2/A3) Collection 5; Nasa Headquarters: Washington, DC, USA, 2013.
  38. Running, S.W.; Mu, Q.; Zhao, M.; Moreno, A. MOD16A2 MODIS/Terra Net Evapotranspiration 8-Day L4 Global 500m SIN Grid V006. NASA EOSDIS Land Processes DAAC, 2017. Available online: https://lpdaac.usgs.gov/products/mod16a2v006/ (accessed on 25 April 2019). [CrossRef]
  39. Velpuri, N.M.; Senay, G.B.; Singh, R.K.; Bohms, S.; Verdin, J.P. A comprehensive evaluation of two MODIS evapotranspiration products over the conterminous United States: Using point and gridded FLUXNET and water balance ET. Remote Sens. Environ. 2013, 139, 35–49. [Google Scholar] [CrossRef]
  40. Buyadi, S.N.A.; Mohd, W.M.N.W.; Misni, A. Impact of land use changes on the surface temperature distribution of area surrounding the National Botanic Garden, Shah Alam. Procedia Soc. Behav. Sci. 2013, 101, 516–525. [Google Scholar] [CrossRef] [Green Version]
  41. Kumar, P.; Husain, A.; Singh, R.B.; Kumar, M. Impact of land cover change on land surface temperature: A case study of Spiti Valley. J. Mt. Sci. 2018, 15, 1658–1670. [Google Scholar] [CrossRef]
  42. Sun, Q.; Wu, Z.; Tan, J. The relationship between land surface temperature and land use/land cover in Guangzhou, China. Environ. Earth Sci. 2012, 65, 1687–1694. [Google Scholar] [CrossRef]
  43. Davey, M.K.; Brookshaw, A.; Ineson, S. The probability of the impact of ENSO on precipitation and near-surface temperature. Clim. Risk Manag. 2014, 1, 5–24. [Google Scholar] [CrossRef] [Green Version]
  44. Matsumoto, J. Seasonal transition of summer rainy season over indochina and adjacent monsoon region. Adv. Atmospheric Sci. 1997, 14, 231–245. [Google Scholar] [CrossRef]
  45. Liu, C.-W.; Huang, H.-C.; Chen, S.-K.; Kuo, Y.-M. Subsurface return flow and groundwater recharge of terrace fields in Northern Taiwan. J. Am. Water Resour. Assoc. 2004, 40, 603–614. [Google Scholar] [CrossRef]
  46. Huang, H.-C.; Liu, C.-W.; Chen, S.-K.; Chen, J.-S. Analysis of percolation and seepage through paddy bunds. J. Hydrol. 2003, 284, 13–25. [Google Scholar] [CrossRef]
  47. FAO. 2015–2016 El Niño—Early Action and Response for Agriculture, Food Security and Nutrition; FAO: Rome, Italy, 2016. [Google Scholar]
  48. Onishi, T.; Nakamura, K.; Horino, H.; Adachi, T.; Mitsuno, T. Evaluation of the denitrification rate of terraced paddy fields. J. Hydrol. 2012, 436, 111–119. (In Japanese) [Google Scholar] [CrossRef]
  49. Srikantha, H.; Archana, J. Rice Terrace Farming Systems Rice Terrace Farming Systems Working Paper Series Study of Institutional and Governance Arrangements for Achieving Water Security in the Hani Rice Terraces; United Nations University (UNU): Tokyo, Japan, 2015. [Google Scholar]
  50. Lang, A.R.G.; Evans, G.N.; Ho, P.Y. The influence of local advection on evapotranspiration from irrigated rice in a semi-arid region. Agric. Meteorol. 1974, 13, 5–13. [Google Scholar] [CrossRef]
  51. Baldocchi, D.; Knox, S.; Dronova, I.; Verfaillie, J.; Oikawa, P.; Sturtevant, C.; Matthes, J.H.; Detto, M. The impact of expanding flooded land area on the annual evaporation of rice. Agric. For. Meteorol. 2016, 223, 181–193. [Google Scholar] [CrossRef] [Green Version]
Figure 1. Terraced paddy distribution in the Keduang watershed.
Sustainability 11 06897 g001
Figure 2. Irrigation block monitoring area.
Sustainability 11 06897 g002
Figure 3. Observation plot scheme (a) and actual allocation (b) in the study area.
Sustainability 11 06897 g003aSustainability 11 06897 g003b
Figure 4. Seasonal LST changes year by year.
Sustainability 11 06897 g004
Figure 5. Dry period length calculated using the pentad rainfall method [44] (left) and precipitation amount from June to November (right).
Sustainability 11 06897 g005
Figure 6. Annual CWSI and TVDI values.
Sustainability 11 06897 g006
Figure 7. CWSI (left) and TVDI (right) in 2015; the dry season is highlighted in the box.
Sustainability 11 06897 g007
Figure 8. CWSI and TVDI in the observed area.
Sustainability 11 06897 g008
Figure 9. NDVI in relation to the crop schedule in 2015.
Sustainability 11 06897 g009
Figure 10. Groundwater table of the terraced paddy top, middle, and bottom plots for the dry (left) and rainy seasons (right).
Sustainability 11 06897 g010
Figure 11. Ponding water depths in the observed paddy plots from dry season in 2017 to 2018.
Sustainability 11 06897 g011
Figure 12. Correlation between precipitation and CWSI.
Sustainability 11 06897 g012
Figure 13. “Oasis effect” mechanism in a terraced paddy surface area.
Sustainability 11 06897 g013
Table 1. Percentage of the area (pixel based) under drought severity based on CWSI for Keduang watershed.
CWSIENSO Condition
0–0.250.25–0.50.5–0.750.75–1
Rainy season201595.9000Strong El Niño
201699.0000La Niña
201795.2000Normal
201899.1000Moderate El Niño
Dry Season20154.984.011.10Strong El Niño
201694.81.600La Niña
201732.167.700Normal
201812.187.40.50Moderate El Niño
Table 2. Percentage of the area (pixel based) under drought severity based on TVDI for Keduang watershed.
TVDIENSO Condition
0–0.250.25–0.50.5–0.750.75–1
Rainy season20156.132.260.80Strong El Niño
20164.727.763.23.3La Niña
201713.940.842.30Normal
201825.841.332.10Moderate El Niño
Dry Season20152.514.081.01.8Strong El Niño
20165.512.480.11.1La Niña
20175.423.563.86.5Normal
20181.825.871.90Moderate El Niño
Table 3. Daily rainfall intensity (mm/day) in the observed area during each month.
JanuaryFebruaryMarchAprilMayJuneJulyAugustSeptemberOctoberNovemberDecember
201517.349.326.924.529.30000013.017.4
201616.528.216.320.417.619.81114.226.027.221.922.2
201719.623.618.922.521.5601311.22000
2018116928737150006017.827.1
Table 4. Water balance in the terraced paddy field irrigation area in dry season 2015.
Component.Water Amount (mm)
Precipitation0
Irrigation2057.8
Evapotranspiration649.4
Percolation and ΔS *676.4
Drainage732.0
* ∆S is soil water storage change.
Table 5. Rice yields and harvested area for the observed watershed area for 2015–2017 *.
Rice Yield (ton/ha)Harvested Area (×103 ha)
20156.0519.18
20165.8817.42
20176.08 **12.12 **
* source: Wonogiri Regency Agricultural Department statistical data; ** January–April data.

