1. Introduction
The leather industry has an important impact on socioeconomics by providing employment and the development of the Chinese economy. With adjustments to global industrial structures, China is becoming the leather center of the world. In 2018, more than 50% of global leather was manufactured in Asia. China contributed more than 20% of leather production all over the world, while Hebei province produced 36% light leather which is the largest leather production base in China [
1]. The leather industry, however, has been categorized as one of the highly polluting industries, which has led to concerns that leather production activities can have adverse impacts on the environment [
2,
3]. Traditional industrialization produces negative industrial by-products, such as pollution and environmental degradation. The traditional leather industry, characterized by high input and consumption, increases economic efficiency and gains but also leads to significant environmental pollution, biological chain destruction, and a significant loss of resources [
4,
5].
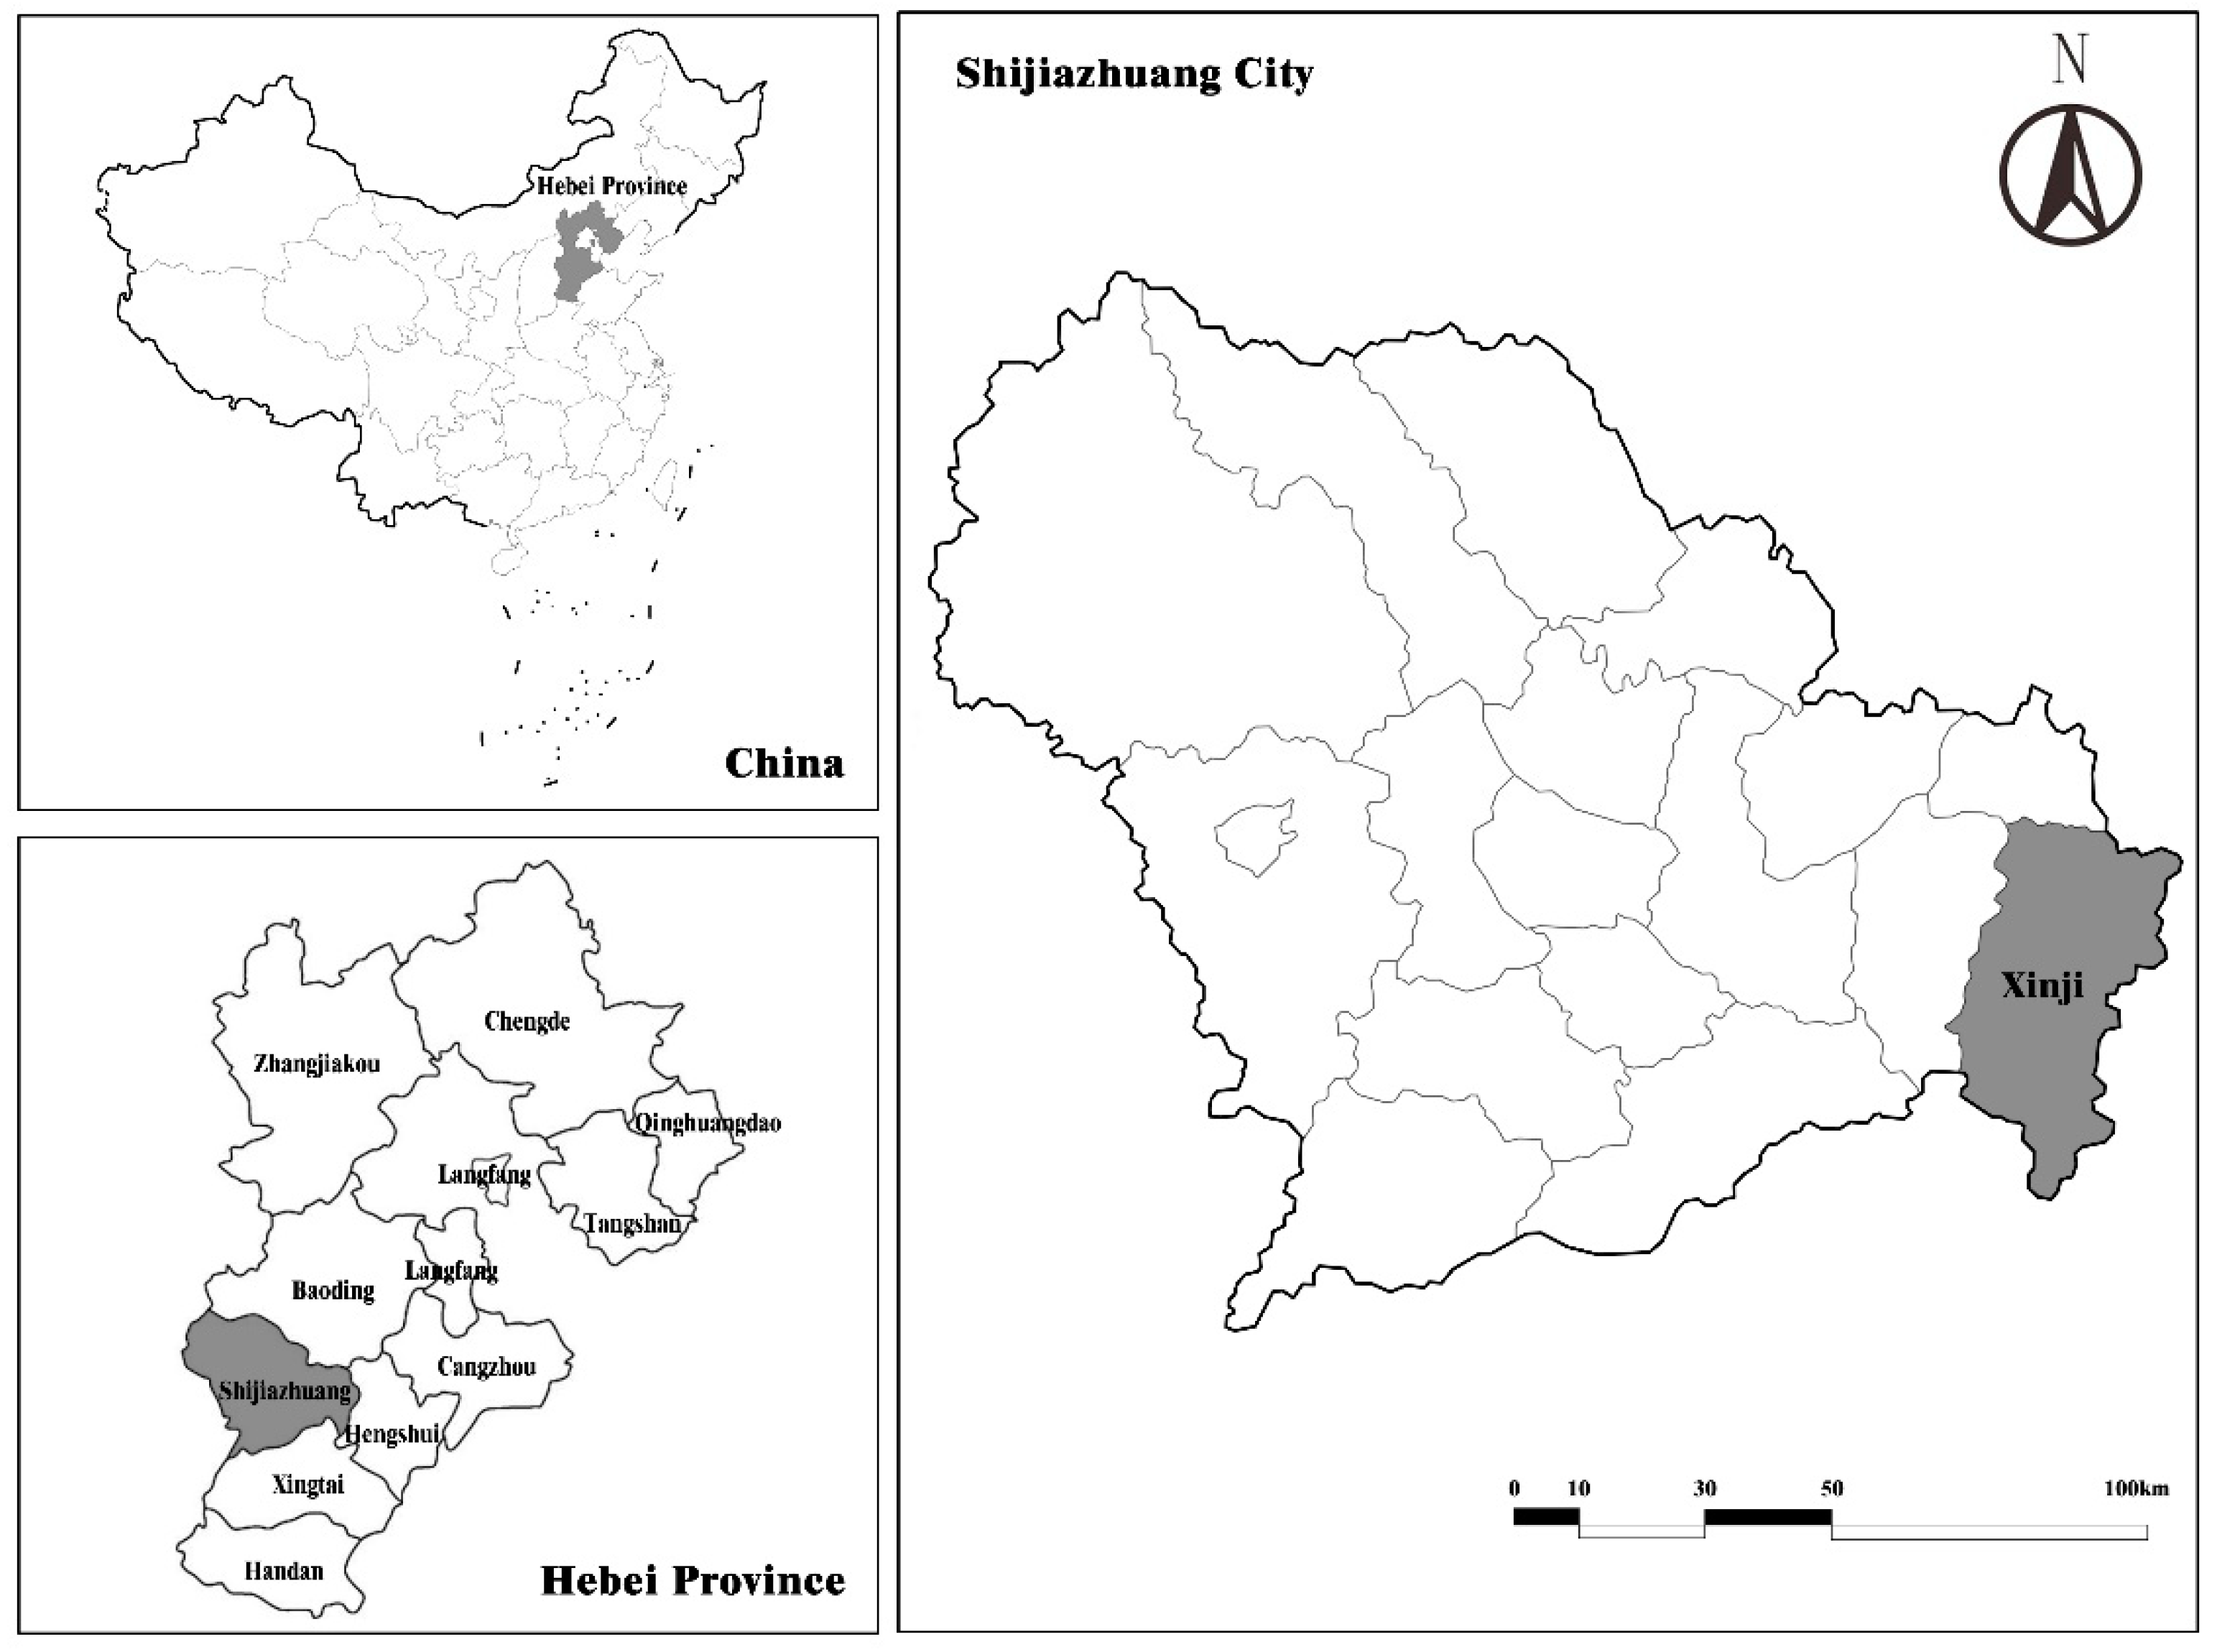
Xinji, located in Shijiazhuang city of Hebei province, is one of the largest leather garment production bases in China, known as the “Leather Capital” of China, see
Figure 1. From 2010 to 2015, the economy continued to expand at an annual growth rate of more than 10%. In 2015, Xinji’s gross domestic product (GDP) reached 38.61 billion CNY, to which the leather industry contributed 48% of the GDP.
Although this economic development is remarkable, Xinji is confronted with more stringent environmental constraints. Surface water in Xinji is scarce and suffers from serious pollution. The drainage canal in Xinji mainly drains industrial wastewater and domestic sewage from the urban area and throughout Xinji. During the agricultural irrigation season, portions of sewage intercepted in the canal are used for agricultural irrigation. However, drainage water in Xinji is categorized as an inferior V-type water body [
6]. According to Chinese Surface Water Environment Quality Level, China has categorized five types of water bodies according to water quality, in which V-type water body is the worst, the demonstrative indices like COD are larger than 40 mg/L, and NH
3-N is less than 2.0 mg/L. Inferior V-type water is the water body which cannot reach the standard of V-type water body. Water pollution will not only cause significant economic losses but also harm the health of inhabitants throughout the region.
With quick economic development, social awareness of issues associated with health care and ecology rapidly increases. Several entities argue whether or not the leather industry should continue its development in the Xinji industrial park. Leather and related industries, however, are the current pillar industries in this region, whose dissolution will significantly affect local social welfare and economic development. Therefore, under the Chinese ecological development background, the leather and related industries must adopt and practice various cleaner production strategies to mitigate environmental damage, especially in the Xinji leather industrial park. This study aims to explore the cleaner production capacity, as well as corresponding measures to achieve a green economy in the leather industry-led industrial park.
Previous studies commonly view leather production as an environmentally unfriendly industry due to its use of toxic substances, such as chromium (Cr) and sulfide, the consumption of large amounts of water, and effluent generation with high contamination levels [
7,
8,
9]. Wang et al. (2015) found that heavy water pollutant emissions primarily derive from the leather industry, petrochemistry, and metallurgy in the Haihe River Basin [
10]. Zeng et al. (2015) studied problems associated with heavy metal pollution in the Haihe, Pearl, Bohai, and Xiangjiang Rivers, finding that these rivers have been polluted to various degrees by different pollutants [
11]. Thus, cleaner production and waste management practices to produce leather are a major issue for the sustainable development of the leather industry [
12].
New developing strategies with respect to leather manufacturing could, as well, drive leather production towards a more ecological paradigm. Numerous studies have focused on sustainable development strategies [
13] and pathways for industrial parks. Some research used statistical methods to analyze current industrial park’s sustainable development capacity, such as analytic hierarchy process (AHP) [
14,
15], data envelopment analysis (DEA) [
16], sustainability system and evaluation [
17], and resource-based view (RBV) analysis [
18]. Moktadir et al. [
19] deeply analyzed drivers and barriers confronted in the leather industry’s sustainable development, and proposed developing a strategy using fuzzy AHP, trial, and evaluation laboratory, and graph theory with matrix approach (GTMA). Currently, increasing studies have proposed mathematical methods to assess ecosystem dynamic evolution in industrial parks, such as system dynamics models, ecological cybernetics and sensitivity models, mathematical models, and multi-objective programming methods. In addition, the life cycle assessment [
20], feasibility analysis [
21], sustainable assessment [
22], ecological vulnerability assessment [
23,
24,
25], and other methods have also been used in numerous studies for industry sustainable development assessments.
At present, a new method has attracted attention for the development of sustainable strategies for industrial parks. A few more dynamic simulation investigations have been conducted on industry sustainable productions [
26,
27,
28,
29]. Xu et al. (2017) used decision-making models that combine an environmental-economic-energy (3Es) system and dynamic input–output model to perform optimization simulations. The combination of an environmentally extended input–output model with a system dynamics model can be effective in solving industrial park ecological development [
30]. The development of leading leather industrial parks should also consider material and value flows together in one integrated system. Exchanges of materials, water, and/or energy, through a shared network between companies in one industrial park, are the principal strategies to design an optimal eco-industrial park (EIP) [
25]. Mathematical models can demonstrate the methods that predict kinetic and diffusive mechanisms to aid in upscaling the processes of commercial exploitation [
2]. Therefore, previous studies suggested it is suitable to use the identification-simulation-regulation ecological planning and pan-objective programming methods in leather industrial park cleaner production capacity analysis.
Since there are relatively few previous studies on the leather industry that propose cleaner production strategies in China, which consider both long-term economic and environmental costs and benefits, there are, therefore, relatively few measures available to adopt as a framework. For the measure structure, previous studies have suggested that comprehensive assessments and cleaner production strategies require a set of multiple objectives and methods integration. However, there is a lack of studies that focus on and are organized around the objectives from a leather and related industries development and environmental protection perspective. Previous studies have suggested that there is a need to develop decision-making methods to improve the trade-off between economics and the environment in leading leather industrial parks. Moreover, the resource-based theory suggests that each industry is different from another in terms of its resources and capabilities. Therefore, a new set of decision-making models is necessary that addresses these industry characteristics, capabilities, assets, and technologies to comprehensively predicts and simulates the economic and environmental performance in the leather industry.
This study aims to provide a new method to estimate the leather industry’s cleaner production potential and establishment approaches, and to investigate whether the leather industry can achieve economic development while improving the environment to pursue a “win-win strategy”. This study selected the Xinji leather industrial park as a typical case, for which we established a dynamic model of the system and performed simulation experiments. This case study improved a dynamic optimization simulation approach to predict industrial development and environmental impacts, combines multiple objective modeling, system dynamic modeling, and environmentally extended input–output modeling together to solve previous methodological flaws, which were used to propose optimal cleaner production strategies. This study has important practical significance since it has the potential to provide policy-makers with an understanding of how to set suitable development paths in the leather industry and identify critical areas to enhance performance. The dynamic optimization method proposes new cleaner production strategies that are implementable by industrial parks.
This paper is structured as follows: Research methodology is explained in
Section 2.
Section 3 details a discussion of the results and managerial implications. Finally, conclusions and recommendations for future research are discussed in
Section 4 and
Section 5.
2. Methodology
Previous studies have shown that a dynamic optimization decision-making model, based on the environmentally extended input–output model, can be effective when attempting to solve contradictory problems between environmental pollution and economic development [
26,
29]. The goals of dynamic optimization in terms of leather industrial parks were to maximize economic development, minimize environmental pollution, and minimize investment. The multi-objective optimization programming method was able to solve problems associated with the optimization of numerous contradictory and incommensurable objective functions [
23,
25,
31,
32]. Therefore, by establishing a multi-objective programming model and solving it, we can obtain a set of optimal solutions that will provide policy-making decision support based on our simulation results.
2.1. Model Framework
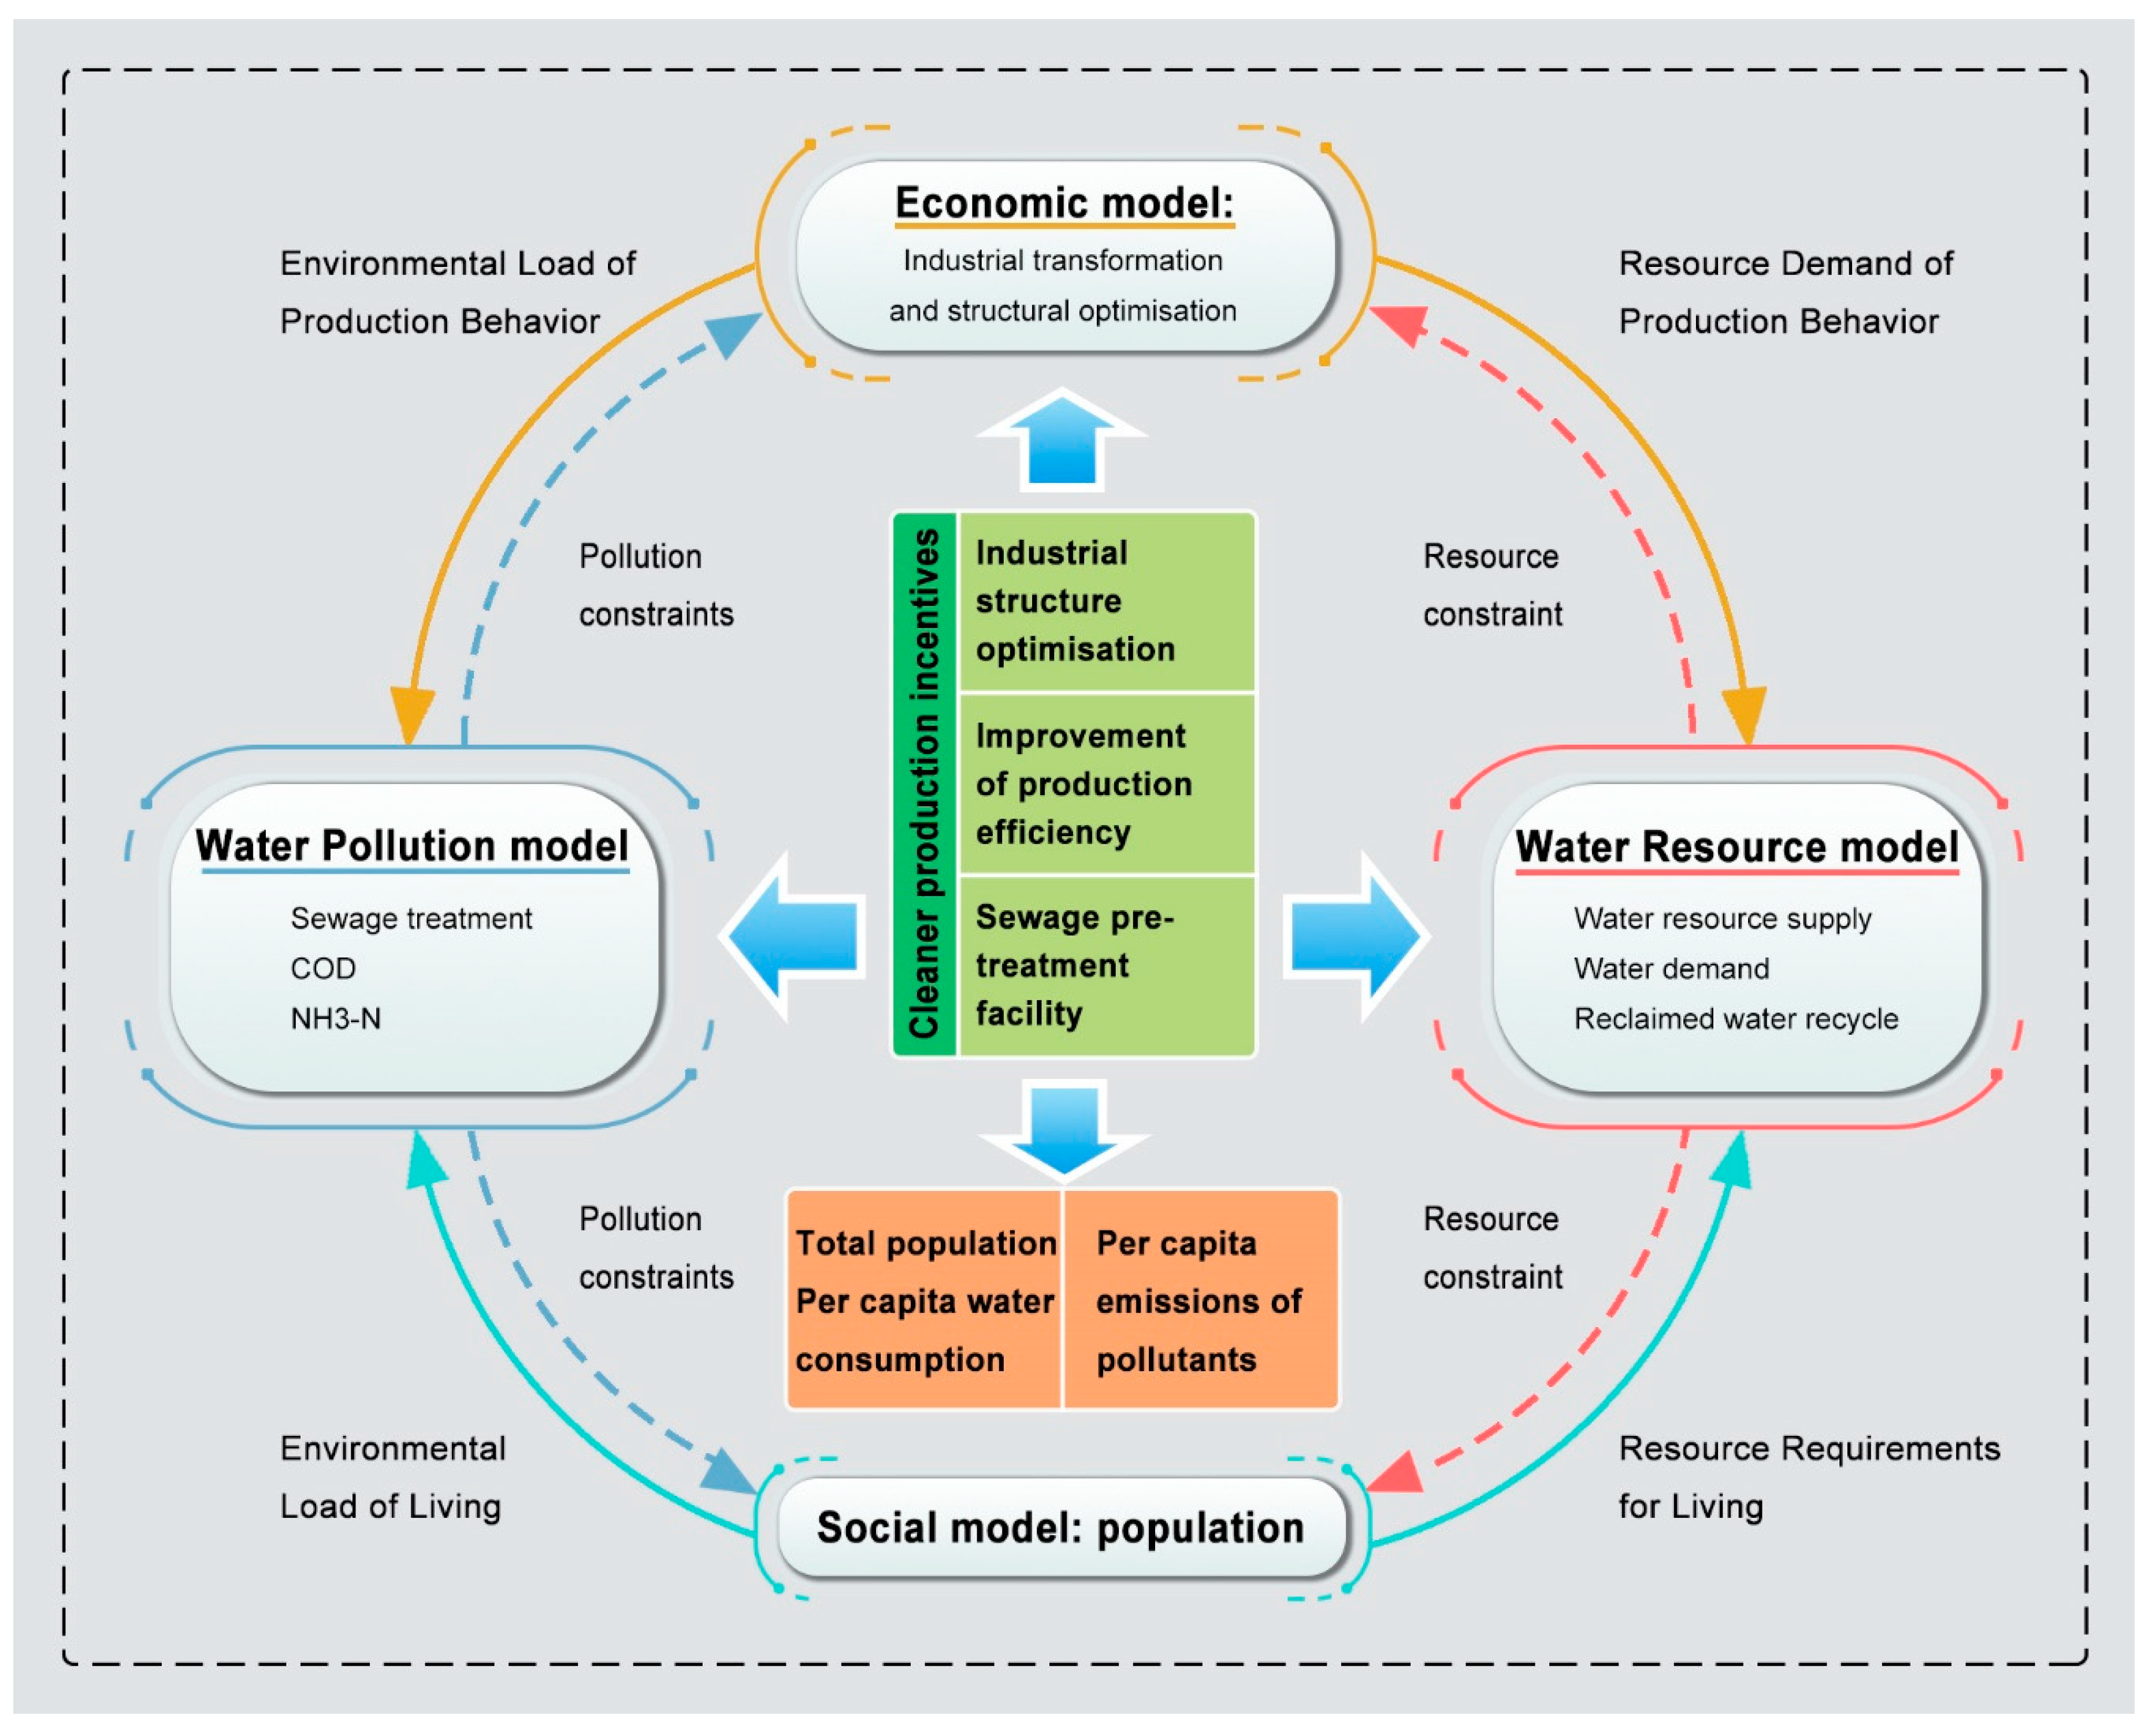
Adopting the methods of system dynamics,
Figure 2 depicts the material and value flows in the leather industrial park. Based on this model framework, we constructed a systemic cleaner production decision-making model of the Xinji leather industrial park. This model had multiple objectives, i.e., improving economic development, minimizing fresh water demand, and lowering water pollutant emission. This model included a socio-economic and environmental model.
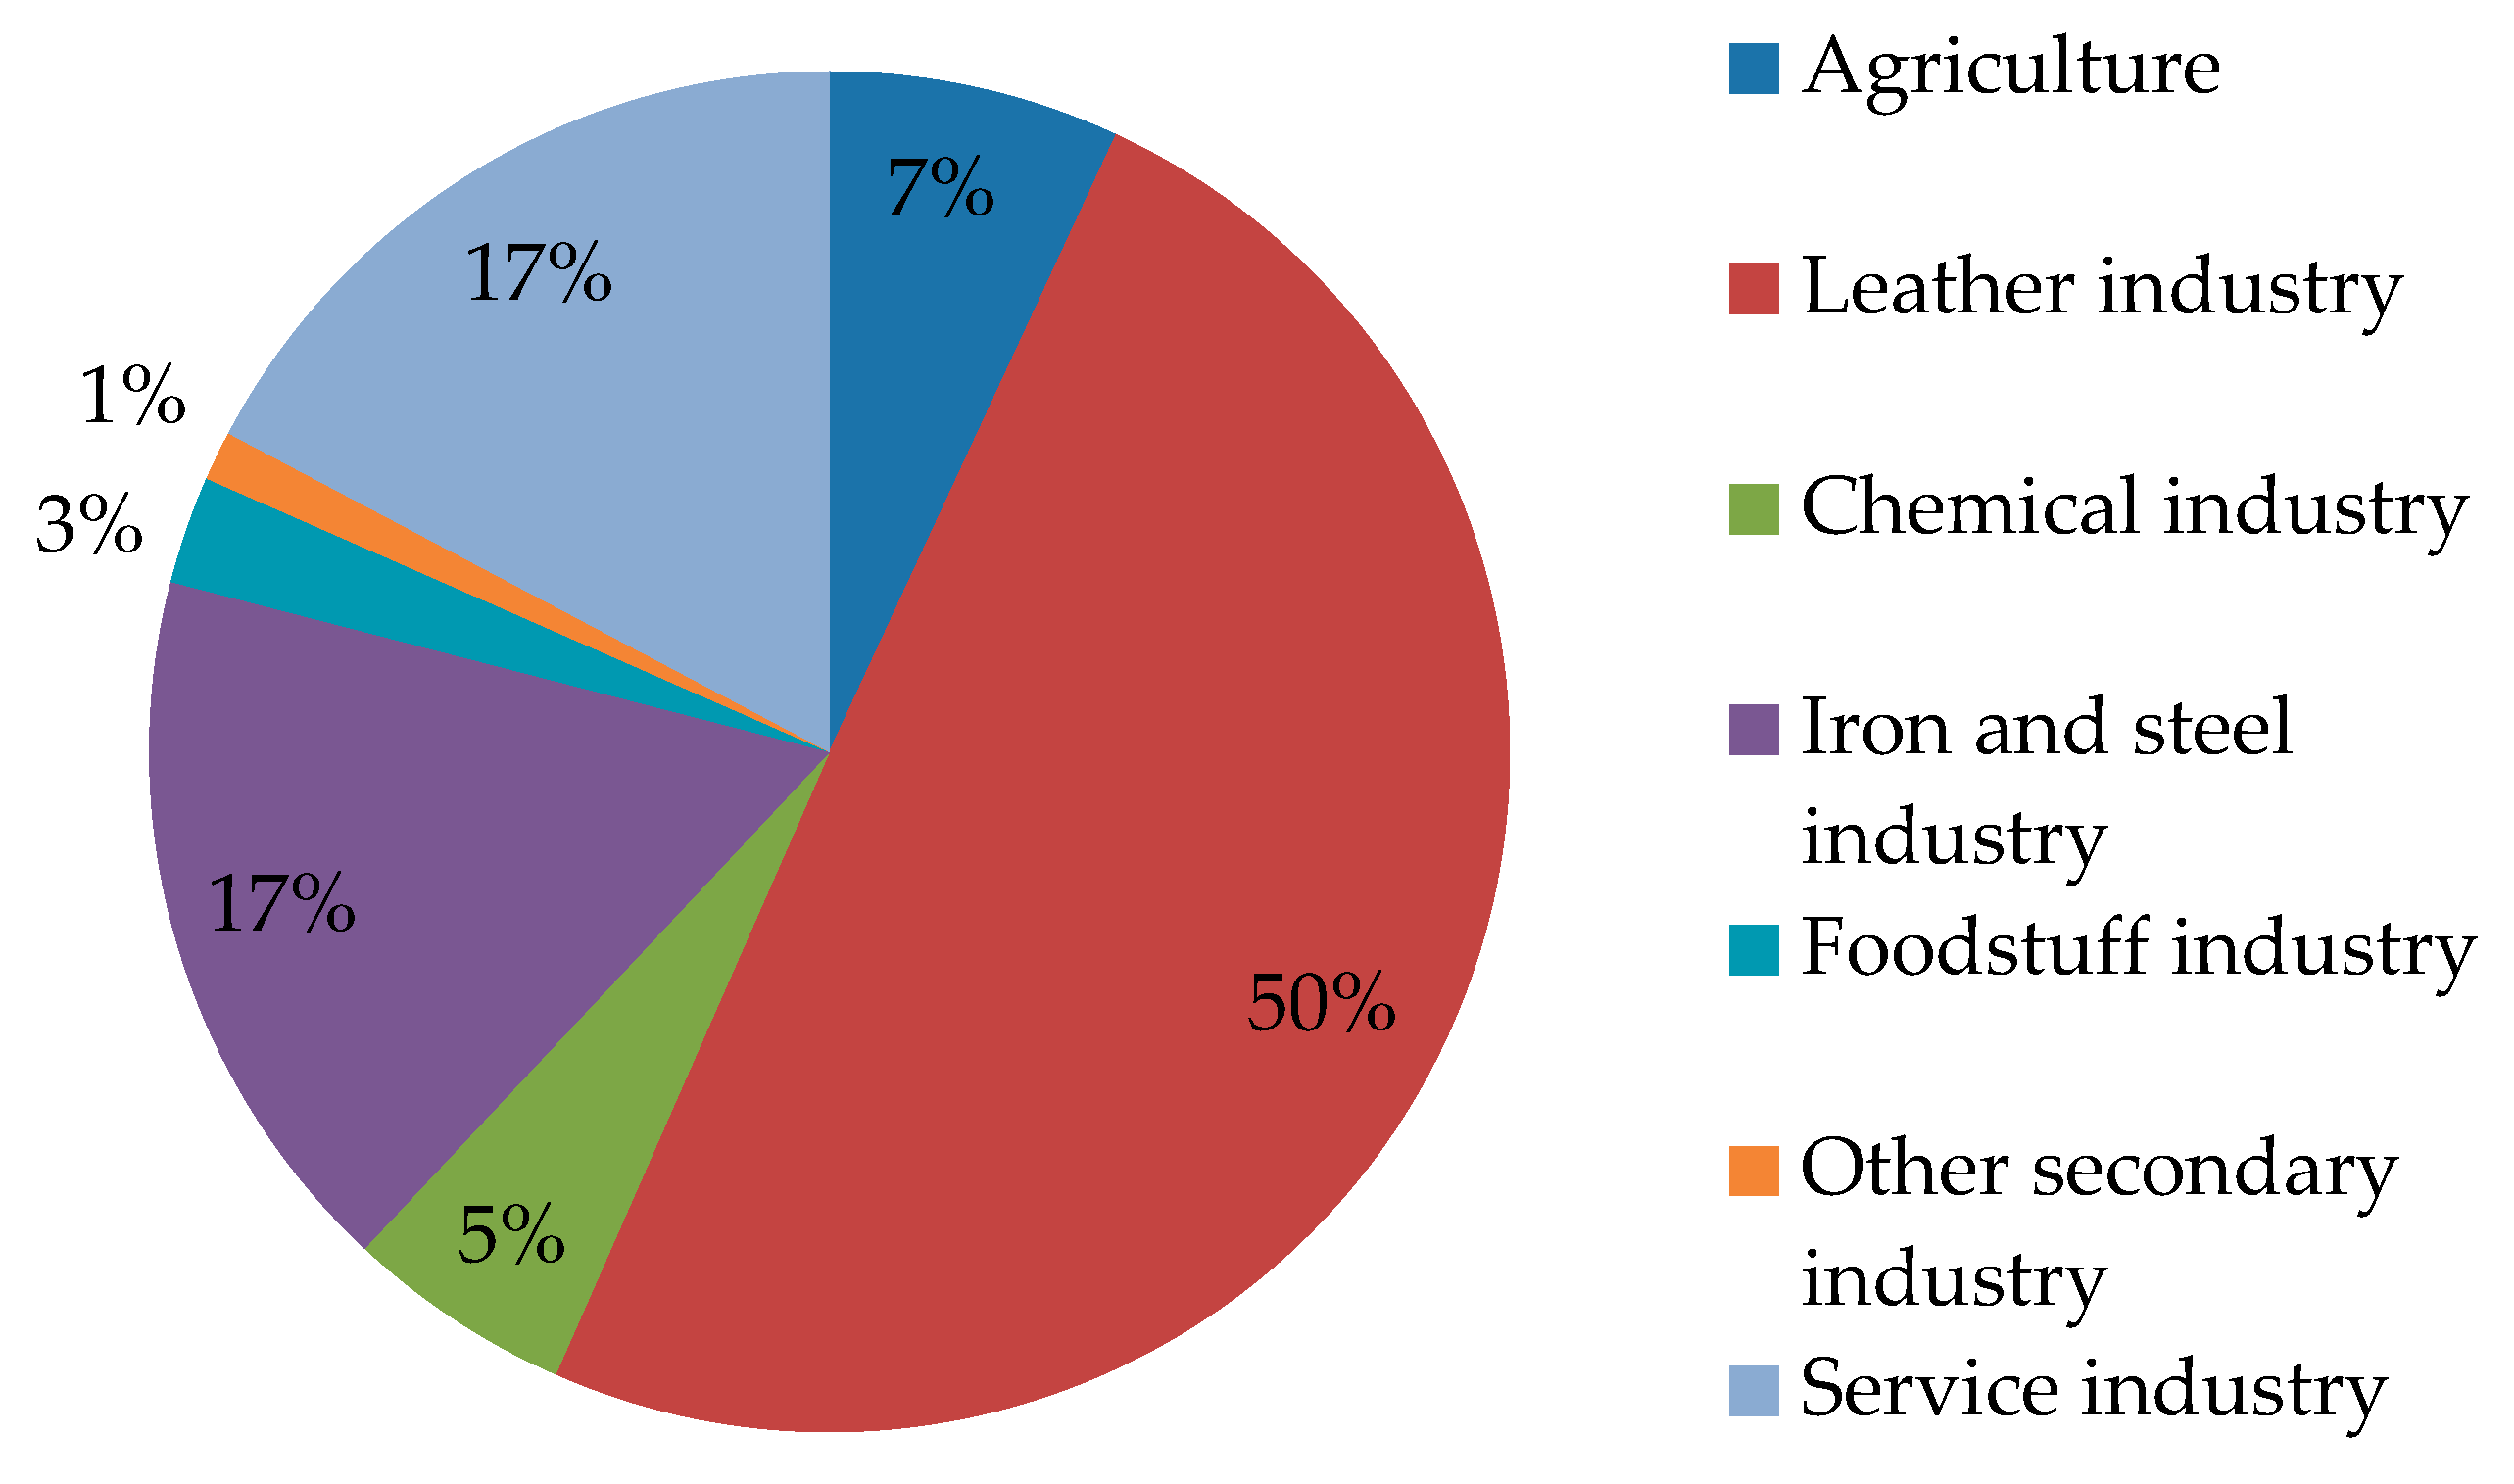
The design of the socio-economic model was based on input–output theory, which uses industrial development and the relationship between various industries as the basis of economic development. The input–output table of Xinji industrial park was constructed based on enterprises’ data to calculate industrial data, which were provided by Xinji statistical bureau in 2015, and referenced Hebei province’s input–output table in 2012. The constructed input–output table of Xinji industrial park is shown in
Table A1. For industry sectors, other secondary industries in Xinji industrial park only contribute 1% of gross regional product (GRP), including machinery, electricity, gas, and water supply together in Xinji industry park. This model fully considered the relationship between industrial development, industrial restructuring, and the environment. The socio-economic model can reflect the current situation and future trend of a region’s economic development, including population dynamics, input, and output between industries, consumption, investments, government budgets, and industrial transformation and structural optimization.
The environmental model consisted of two sub-models, i.e., water pollution and water resource models. The water pollution model represented the flow of pollutants generated by social and economic activities, including the generation and elimination of environmental pollutants. The water resource model reflected water supply and demand, sewage treatment and water reclamation flows.
The dynamic optimization model is based on the coupling of system dynamics and industrial input–output models, where simulations are performed with the multi-objective programming method. We were able to effectively integrate the three sub-models by taking the development of social production activities as the center that linked the three sub-models and closely and systematically combined the sub-models in the comprehensive model. This ensured that the model not only independently reflected development trends in the sub-models but also reflected the mutual influences and interactions among the sub-models, i.e., a comprehensive evaluation.
2.2. Objective Function
This Xinji leather industrial park cleaner production decision optimization model attempted to simulate industrial development with respect to economic and environmental constraints, such as industrial impacts on GRP growth, environmental pollution reduction, and resource efficiency improvements by 2025. In this model, three incentive approaches were adopted to improve the trade-off between the environment and economics, i.e., industry structure optimization, sewage pre-treatment plant construction for leather companies, and upgrades to reclaimed water treatment facilities. We simulated and analyzed the impacts that these three approaches have on the sustainable development of the industrial park to propose a suitable development strategy and suggestions for local governments.
When solving a multi-objective optimization model, it is an effective method to set one of the main goals and make them as good as possible, while setting other indicators to meet certain requirements [
30,
32]. The objective function maximized the total industrial value added (GRP(t), en) in the target-year (
t = 1,...,11, from 2015 to 2025), with constraints on water pollutants. Based on an analysis of the data for the current situation in the Xinji industrial park in 2010–2014, we set up the specific parameters required for the simulation experiment and analyzed the changes in the economics, environment, and resources throughout the Xinji leather industrial park from 2015 to 2025 via dynamic simulations.
where
GRP(
t) is the gross regional production in year
t (en),
is the social discount rate (0.05, average value of interest rates of loans (above five years) from 2006 to 2015 in China; ex),
t indicates the year (i.e., the base-year is 2015 and the target-year is 2025). Here, “en” is the abbreviation for endogenous and “ex” is the abbreviation for exogenous.
where
is the water pollutant,
p, emission reduction targets for 2020 and 2025 (ex). There are mainly three types of pollutants in the leather industry counted in statistical data of Xinji industrial park, including water pollutants COD, NH
3-N, and Cr. Cr is an important heavy mental water pollutant generated in the leather industry. However, according to the current regulation of Cr in the Xinji park, Cr must be treated inside leather enterprises, therefore, the wastewater discharged from leather enterprises to municipal sewage treatment plants cannot contain chromium. Hence, Cr is not calculated in this model.
2.3. Socio-Economic Model
GRP(
t) was determined by the value-added rate for the industry,
i (
Vi), and its production (
Xi(t)):
where
is the production of industry,
i, at time
t (en) (
i = 1: Agriculture,
i = 2: Leather industry,
i = 3: Chemical industry,
i = 4: Iron and steel manufacturing industry,
i = 5: Foodstuff industry,
i = 6: Other secondary industries,
i = 7: Service industry) and
is the value-added ration of industry
i (ex).
Industry development should obey the input–output principles, which is expressed with the following equation:
where
is the input coefficient (ex) calculated based on input–output table constructed in Xinji industrial park,
is the column matrix of industrial output value (en.),
is the column matrix of total consumption (en),
is the column matrix of total industrial investment (en),
is the column matrix of total net exports (en), and
is the column matrix of total interprovincial mobility (en).
The capital stock was determined based on the previous year’s capital stock, as well as the current year’s investment and depreciation. There was a specific ratio between the output value and capital stock over a certain time period, i.e., the capital-output rate. Total capital investment was equal to the sum of the production and environmental pollution control investments:
where
is the ith industrial capital stock (en),
is the ith total industrial investment (en),
is the ith industrial depreciation rate (ex), and
is the ith industrial capital-output coefficient (ex),
Z(
t) is population(en.),
ngr is the natural growth rate of population in Xinji (ex.).
Investments in environmental pollution remediation were used in water environmental pollution remediation projects. Specific projects included upgrades and transformations of sewage treatment facilities and sewage treatment plant construction in leather companies. The introduction of environmental pollution control projects is the key to promote sustainable development in the Xinji leather industrial park, which has the potential to stimulate the realization of economic development and environmental protection objectives.
2.4. Water Resource Supply and Demand Model
Each pollutant is generated by activities associated with industrial production and resident consumption. The environment sub-model is split into water pollution and water resource sub-models.
There is no surface water supply in Xinji and groundwater is the only water resource. However, with the successful implementation of the South-to-North Water Transfer Project and the expansion of reclaimed water use during the production process, these two types of water resources will become the main water resources in the Xinji leather industrial park in the future. Thus, we can divide the Xinji leather industrial park’s water resources into three types: Groundwater, South-to-North Water Transfer Project, and reclaimed water.
These water resources are supplied to industrial production and residents through different supply structures to meet the demands of urban water use. Water demand in the Xinji leather industrial park mainly derives from industrial production and daily residential activities. Out of these activities, industrial water consumption corresponds to the amount of water resources consumed by various industries during production processes, while residential water consumption is the amount of water consumed by the residents. The balance between the supply and demand of the water resources can be depicted with a scenario where the water resource supply can usually meet the demand, which is expressed by the following equations:
where
is the total water demand in Xinji in a given year,
t (en),
is the total water supply in a given year,
t (en),
is the total groundwater supply in a given year,
t (en),
is the total supply of transfer water in a given year,
t (en), and
is the total supply of reclaimed water in a given year,
t (en).
Water supply is influenced by water demand and reclaimed water production capability. Water demand is decided by industrial production and residential use, which can be expressed by the following equation:
where
is the ith industrial water use intensity (ex),
wdp is the regional population water consumption intensity in a region,
p (ex), and
is the total regional population in a given year,
t (en).
The total amount of industrial water is equal to the sum of the water consumed by each industry. Each industry’s water consumption was determined by the industrial water consumption intensity (industrial water consumption per unit output value) and production value. The sources of industrial water use include groundwater, South-to-North Water Transfer Project, and reclaimed water.
2.5. Water Pollution Treatment Model
Both industrial production and residential activities produce sewage. The total amount of discharged sewage is equal to the sum of discharged industrial and residential sewage. The amount of industrial sewage discharge was determined using the industrial sewage discharge intensity and production value. The amount of discharged domestic sewage was determined using the discharged sewage intensity and population. The total sewage discharge was calculated using the following equation:
where
is the total sewage production in a given year,
t (en),
is the ith industrial sewage production intensity (ex), and esr is the residential sewage production intensity (ex). Breaking down Equation (12), we can calculate the
with the following equation:
where
is the sewage treatment amount in a year,
t, of industry
i (en) and
is the amount of untreated sewage in a year,
t, of industry
i (en).
The sewage treatment amount depends on the investments and equipment installation, which is expressed by the following equations:
where
is the sewage treatment capacity coefficient (ex),
is the sewage treatment investment of industry
i in year
t (en),
is the sewage treatment capital accumulation ratio of industry
i (ex.),
is the sewage treatment depreciation ratio of industry
i (ex.), and
is the sewage treatment operation cost of industry
i (including the cost of labor, pharmaceutical, electricity, and maintenance) (en).
Water pollution includes point and non-point source pollution, where non-point source refers to a source of water pollution caused by agriculture discharge. Industrial and municipal domestic wastewater produced by general industrial and domestic pollution sources is transported to municipal sewage treatment plants for centralized treatment, followed by discharge to water bodies, which are point sources of pollution. Industrial water pollutant discharge was determined by the amount of industrial sewage discharge and water pollutant density in the wastewater. The amount of domestic discharged sewage was determined by the intensity and quantity of water pollutants discharged by the population, which are expressed by the following equations:
where
is the water pollutant density,
p, of industrial sewage
i in a given year,
t (ex) and
is the water pollutant reduction ratio of the industry
i (ex).
There is a certain correlation between the production of reclaimed water and sewage treatment, which is known as the productivity of reclaimed water:
where
is the recycled water productivity ratio of the industry
i (ex).
In this study, we used an interactive linear and general optimization solver, i.e., the linear interactive and general optimizer (LINGO), as an experimental method to establish the comprehensive model of sustainable development in the Xinji leather industrial park. The LINGO software can program a dynamic simulation model based on the environmentally extended input–output model developed in this study, obtain simulations and predictions of future trends, and, finally, yield an optimal development path and implementation measures via the simulations.
3. Dynamic Simulation Results Analysis and Discussion
3.1. Scenarios Setting and Uncertainty Analysis
Based on the Xinji cleaner production decision optimization model, we were able to predict economic and environmental trends in the Xinji leather industrial park from 2015 to 2025.
To verify model validity, we tested model reliability by comparing our estimated data with actual data from 2013 to 2015. By comparison, the predicted values for 2013–2015 were basically consistent with the actual data, which proves that the predicted values are accurate. Therefore, we can guarantee the accuracy of the values after 2015. Furthermore, scenario simulation is another way to solve the uncertainty of this model.
Dynamic scenario analysis was used to determine the optimal development potential of the Xinji leather industrial park with respect to cleaner production, as well as the environmental and socio-economic impacts of cleaner production. Based on this, we were able to develop specific policy recommendations and implementation strategies.
Scenario design (shown in
Table 1) was set as: case-0 as business as usual case, case-1 and case-2 introduced a variety of environmental pollution control projects to improve the trade-off between the economy and the environment, including improvements in industrial production efficiency, sewage pre-treatment plant construction in leather companies, and upgrades to reclaimed water treatment facilities. The reduction target of various environmental pollutants (i.e., COD and NH
3-N) was set according to the local government plans listed in
Appendix A Table A2. Local government plans encourage leather companies in Xinji to build sewage pre-treatment plants that first treat a minimum of 30% of the sewage (case-2-30%). Therefore, we implemented case-2, 30%, 80%, and 100% pre-treatment targets in 2025, respectively, to reflect the impact that sewage pre-treatment measures had on water environment protection. Reclaimed water can further improve wastewater quality and water supply–demand, as well as its use as an effective method to save fresh water resources and reduce water pollution in the Xinji industrial park (case-2-80% and case-2-100%).
Optimization helps this study find the answer that yields the best result, and scenario simulation can get different best results under various circumstances. The cleaner production decision optimization simulation can estimate economic development trends, environmental changes, and water resources demands under five scenarios from 2015 to 2025. Then we analyze the estimation results from the following four aspects:
3.2. Xinji’s Economic Development Estimation
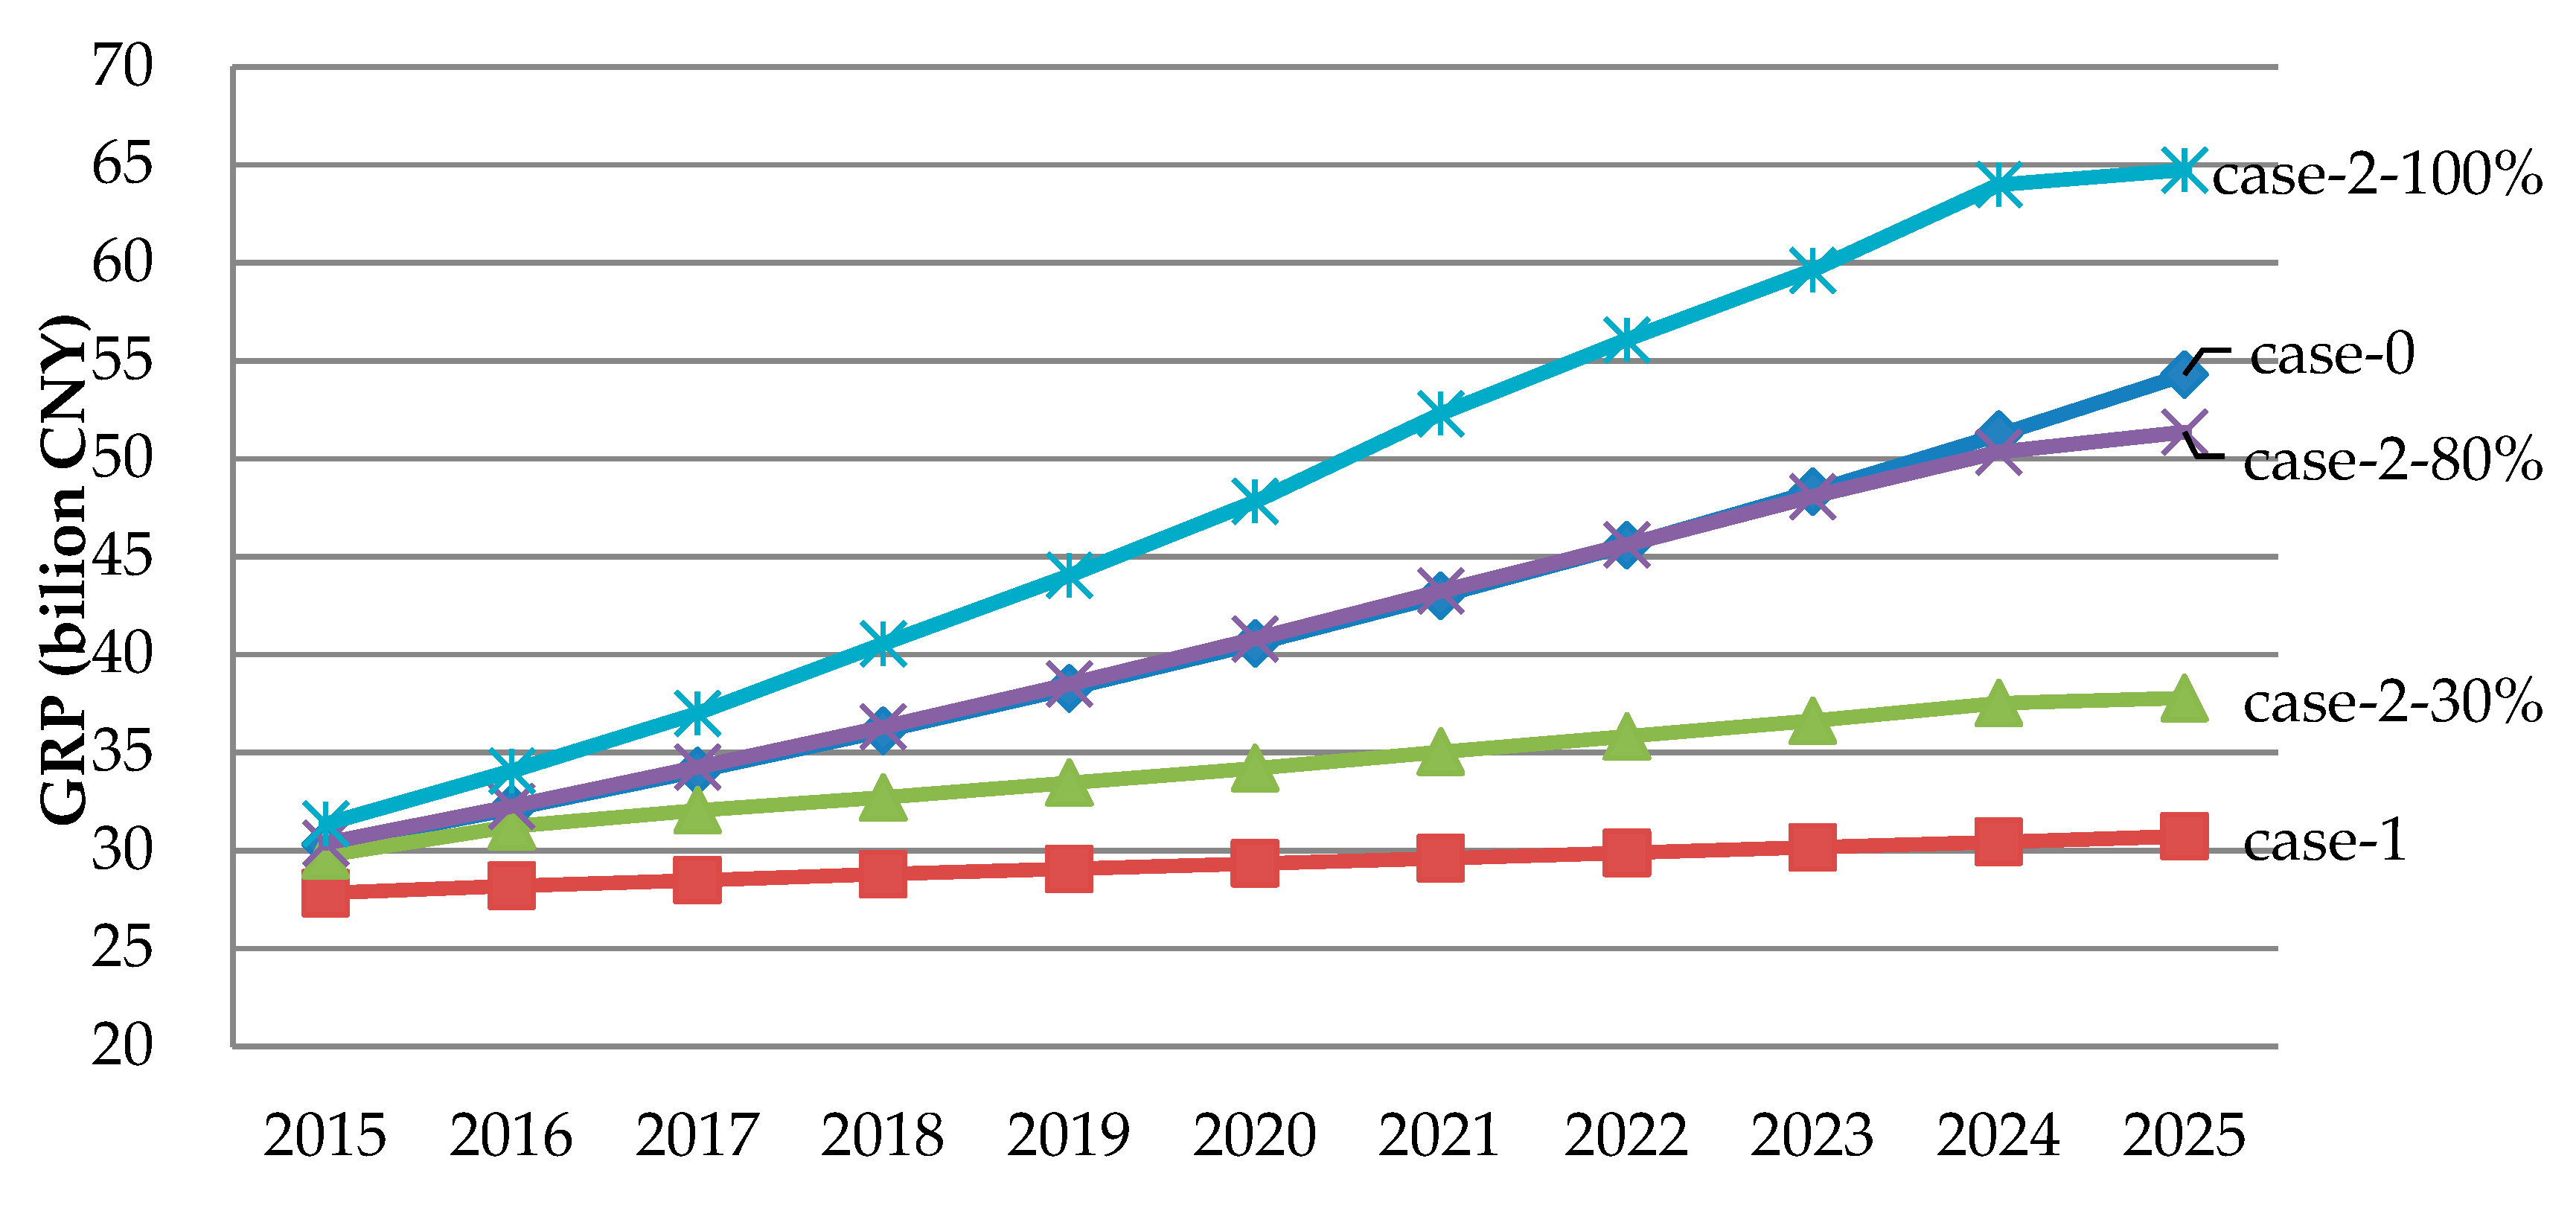
Figure 3 shows the changing trends in Xinji’s economic development from 2015 to 2025. Based on an analysis of the results, we observe that Xinji’s GRP maintained a growth rate of more than 7% in case-0 without environmental consideration. Due to the water environment restrictions in case-1, economic development was limited to a certain extent, as well as a correspondingly decreased growth rate. However, with stimulation from cleaner production in case-2, economic growth was higher with an increased sewage treatment ratio. Therefore, case-2-100% yielded the largest economic growth compared with the other four cases. In general, Xinji’s GRP will achieve sustained growth and maintain a high growth level.
By simulating the economic development and environmental conditions of the Xinji leather industrial park from 2015 to 2025, we observe that the total amount of pollutant emissions continuously decreases with exposure to stable economic growth, which achieves the objective of sustainable development. Xinji is capable of achieving its environmental protection objectives of reducing pollutants in the target period compared with the current period. At the same time, this also yields an average annual growth rate of 4–7.7% GDP, as well as attaining the goal of sustainable development in Xinji.
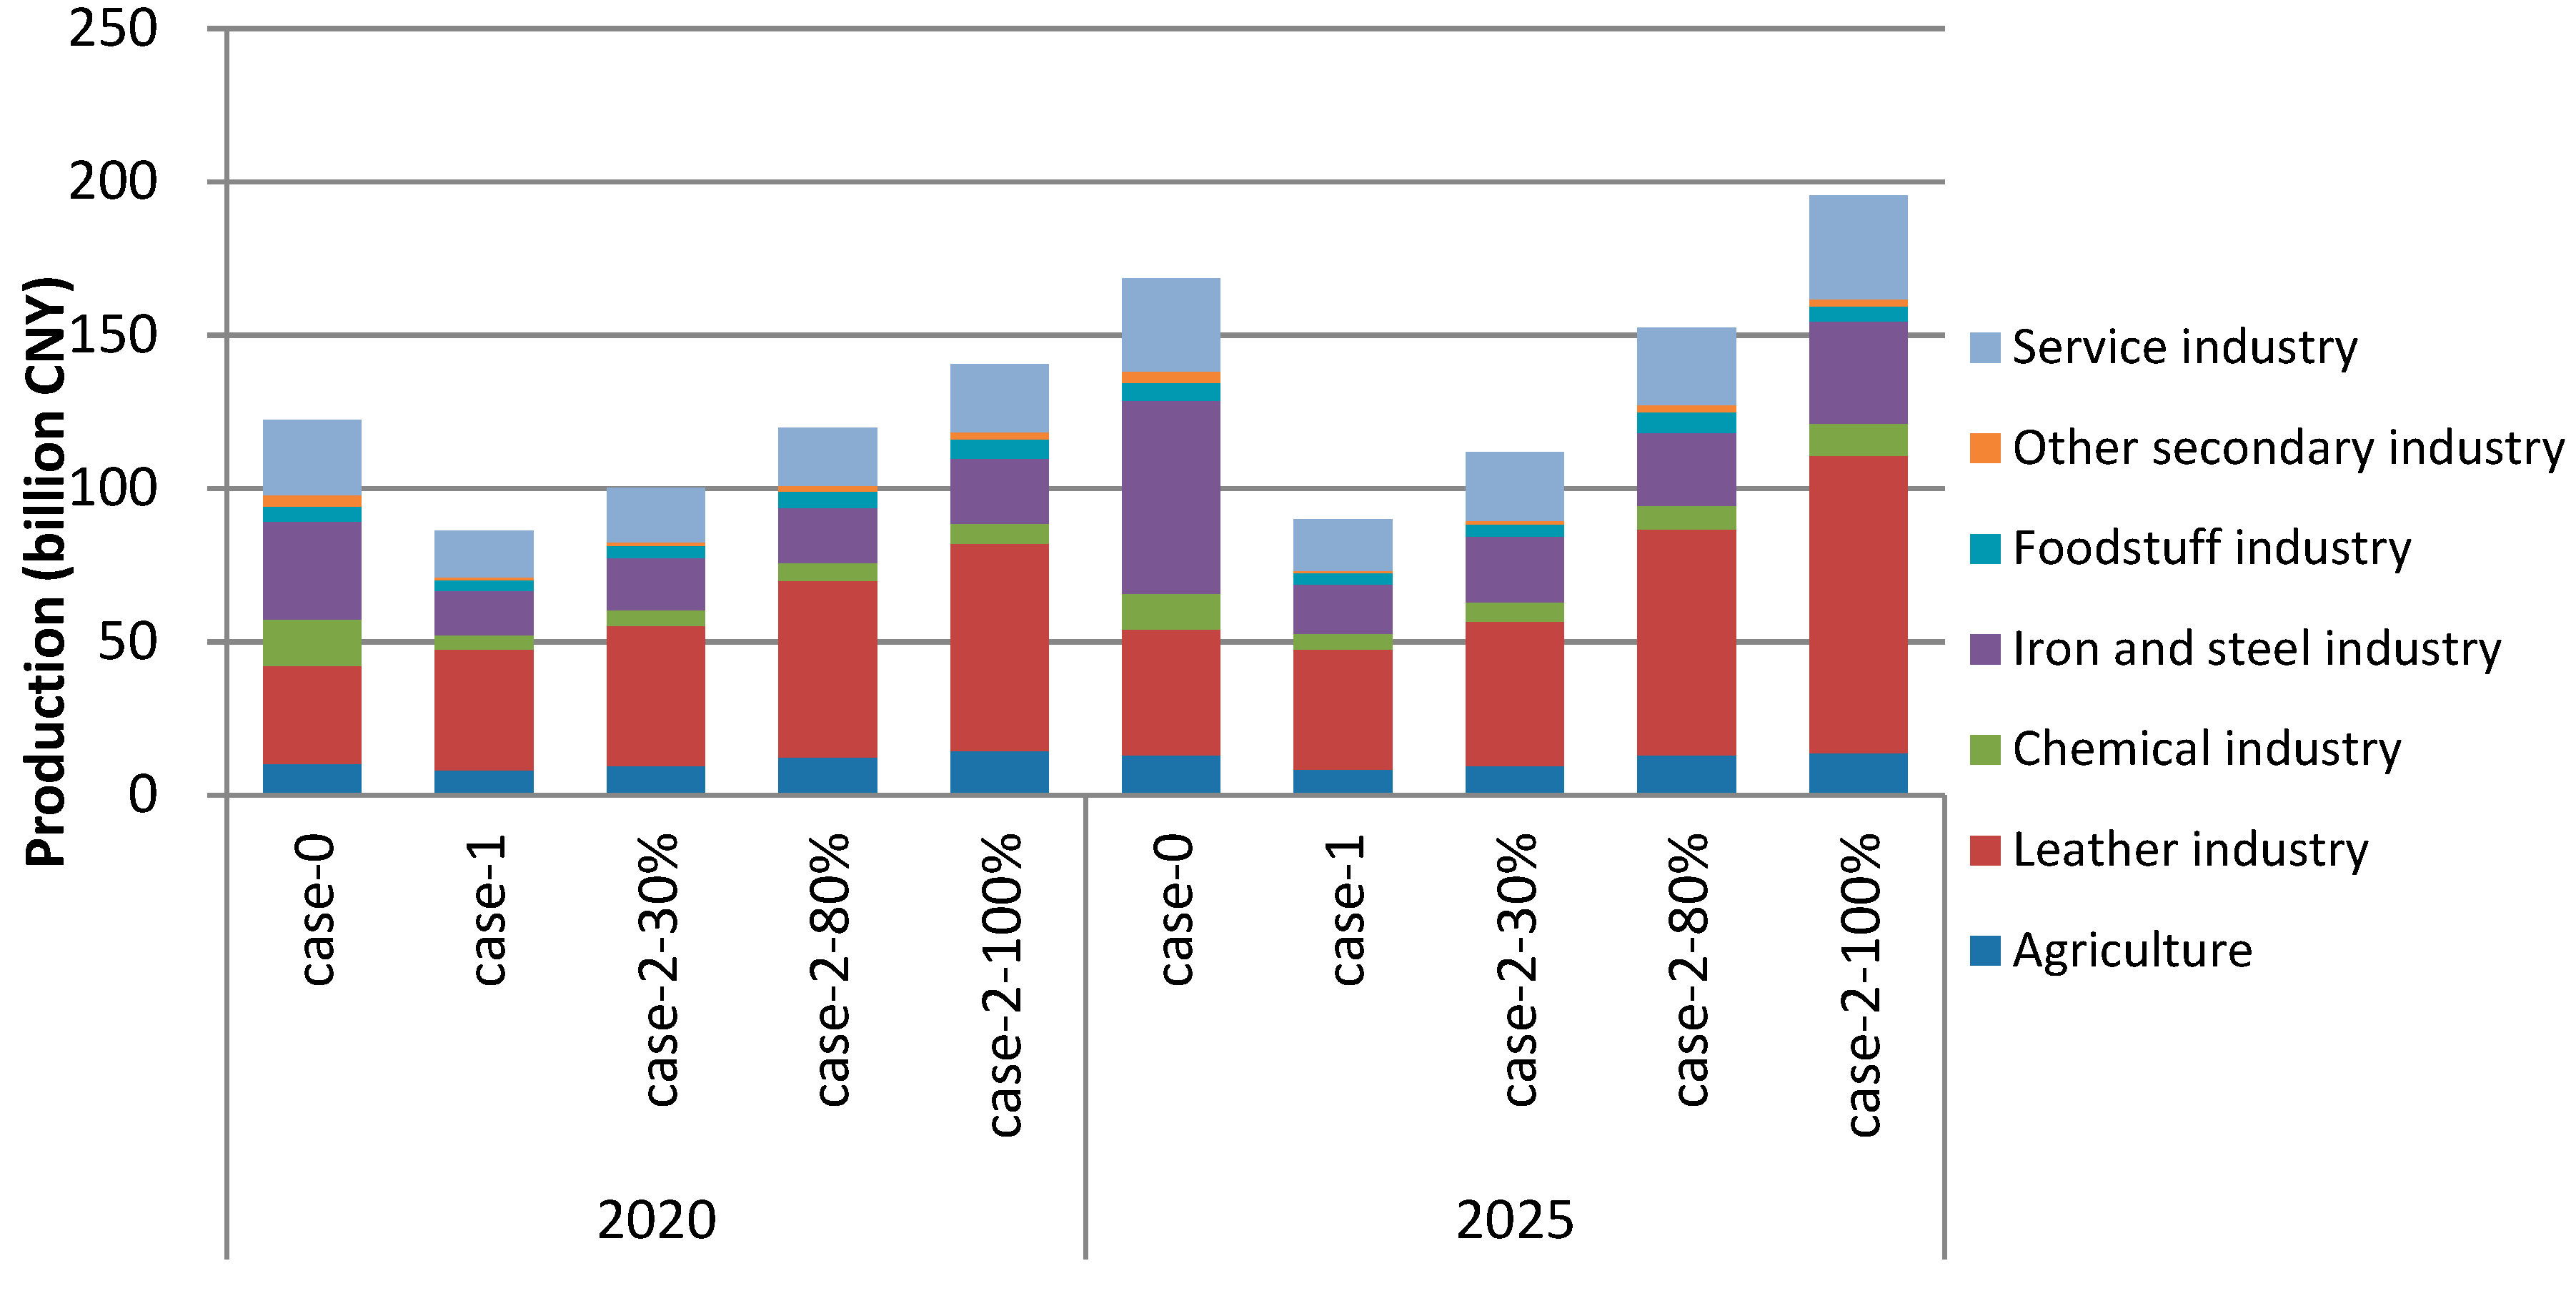
Compared with the steady growth rate of the total GRP in the Xinji leather industrial park, there have been significant changes in the total output value and industrial structure.
Figure 4 shows the trend of industrial output from 2015 to 2025. In 2015, the seven industrial structure was 10:48:5:15:4:16.
Figure 5 shows the output value proportion of various industries in 2025 for case-2-100%.
Our results indicate that industrial structures will significantly change. Industries with high water consumption and pollution will be replaced by industries with relatively low pollution discharge intensity. In agriculture, the overall proportion of water pollutants is declining because the intensity of water pollutant emissions is significantly higher than pollutants associated with industries and tertiary industries. In future developmental processes, the discharge of water pollutants from agricultural production will require increasingly stringent regulations.
This estimation demonstrates that it is feasible to simultaneously continue to develop the leather industry alongside improvements in the water environment while continuingly achieving economic growth. Furthermore, cleaner production in the leather industry will be the most significant contributor to economic growth based on
Figure 4. Our results indicate a decline in the proportion of agriculture, chemical, iron and steel, and agricultural by-product processing industries for the total output value in 2025. There was an increase in the proportion of the output value for the leather, other, and tertiary industries. Adjustments to the industrial structure were based on the input–output model. The relationship between industries and pollutant emission reduction provided constraints for industrial development. The growth of the leather and tertiary industries was larger, as well as the fact that the service industry in Xinji has a close connection with the leather industry. Both the output value and proportion have significantly increased.
3.3. Environmental Indicator Prediction
With the dynamic simulation experiment, we can obtain the development trend between the amount of emissions and intensity of various environmental pollutants in the Xinji leather industrial park from 2015 to 2025 (shown in
Figure 6). The reduction of environmental pollutant emission intensity cannot fully reflect environmental improvements. Therefore, this study also considered the controls on total environmental pollutant emissions to reflect improvements to the environment.
Based on
Figure 6, we observe that the degree of change and development trend of emission for the two types of environmental pollutants are significantly different in five cases. From 2015 to 2025, water pollutant emissions are characterized by decreasing trends in case-1 and case-2, except for case-0 without pollutant emissions control. By 2025, COD and NH
3-N emissions can be reduced by 48% and 75%, respectively, compared with emissions in 2015 in the optimal case-2-100%. This indicates that the water pollutant control targets can be achieved by implementing the environmental pollution remediation measures proposed in this study.
3.4. Water Resource Supply Reduction and Reclaimed Water Recycling Potential
We can visualize the environmental benefits of wastewater reuse based on the water resources saving potential. As shown in
Figure 7, reclaimed water can be a substitute for fresh water resources, i.e., an increase to 140 million tons by 2025, which accounts for 44% of the total water supply in case-2-100%. The use of reclaimed water is capable of reducing a significant proportion of the water demand for groundwater and transferred water, thereby efficiently addressing the water shortage problem. Furthermore, by 2025, there is an improvement in the water consumption efficiency compared with that in 2015. The demand for fresh water was significantly reduced, primarily because reclaimed water can supply a large amount of the water resources required for the local area. In addition, in 2025 for the optimal case, water consumption intensity will have sharply increased by 65%.
The use of reclaimed water significantly contributes to improving the overall water use and environmental protection in industrial production. In addition, adjustments to industrial structures, with a shift from high to low water consumption and decreased industrial water pollutant generation, are another reason for the improvement.
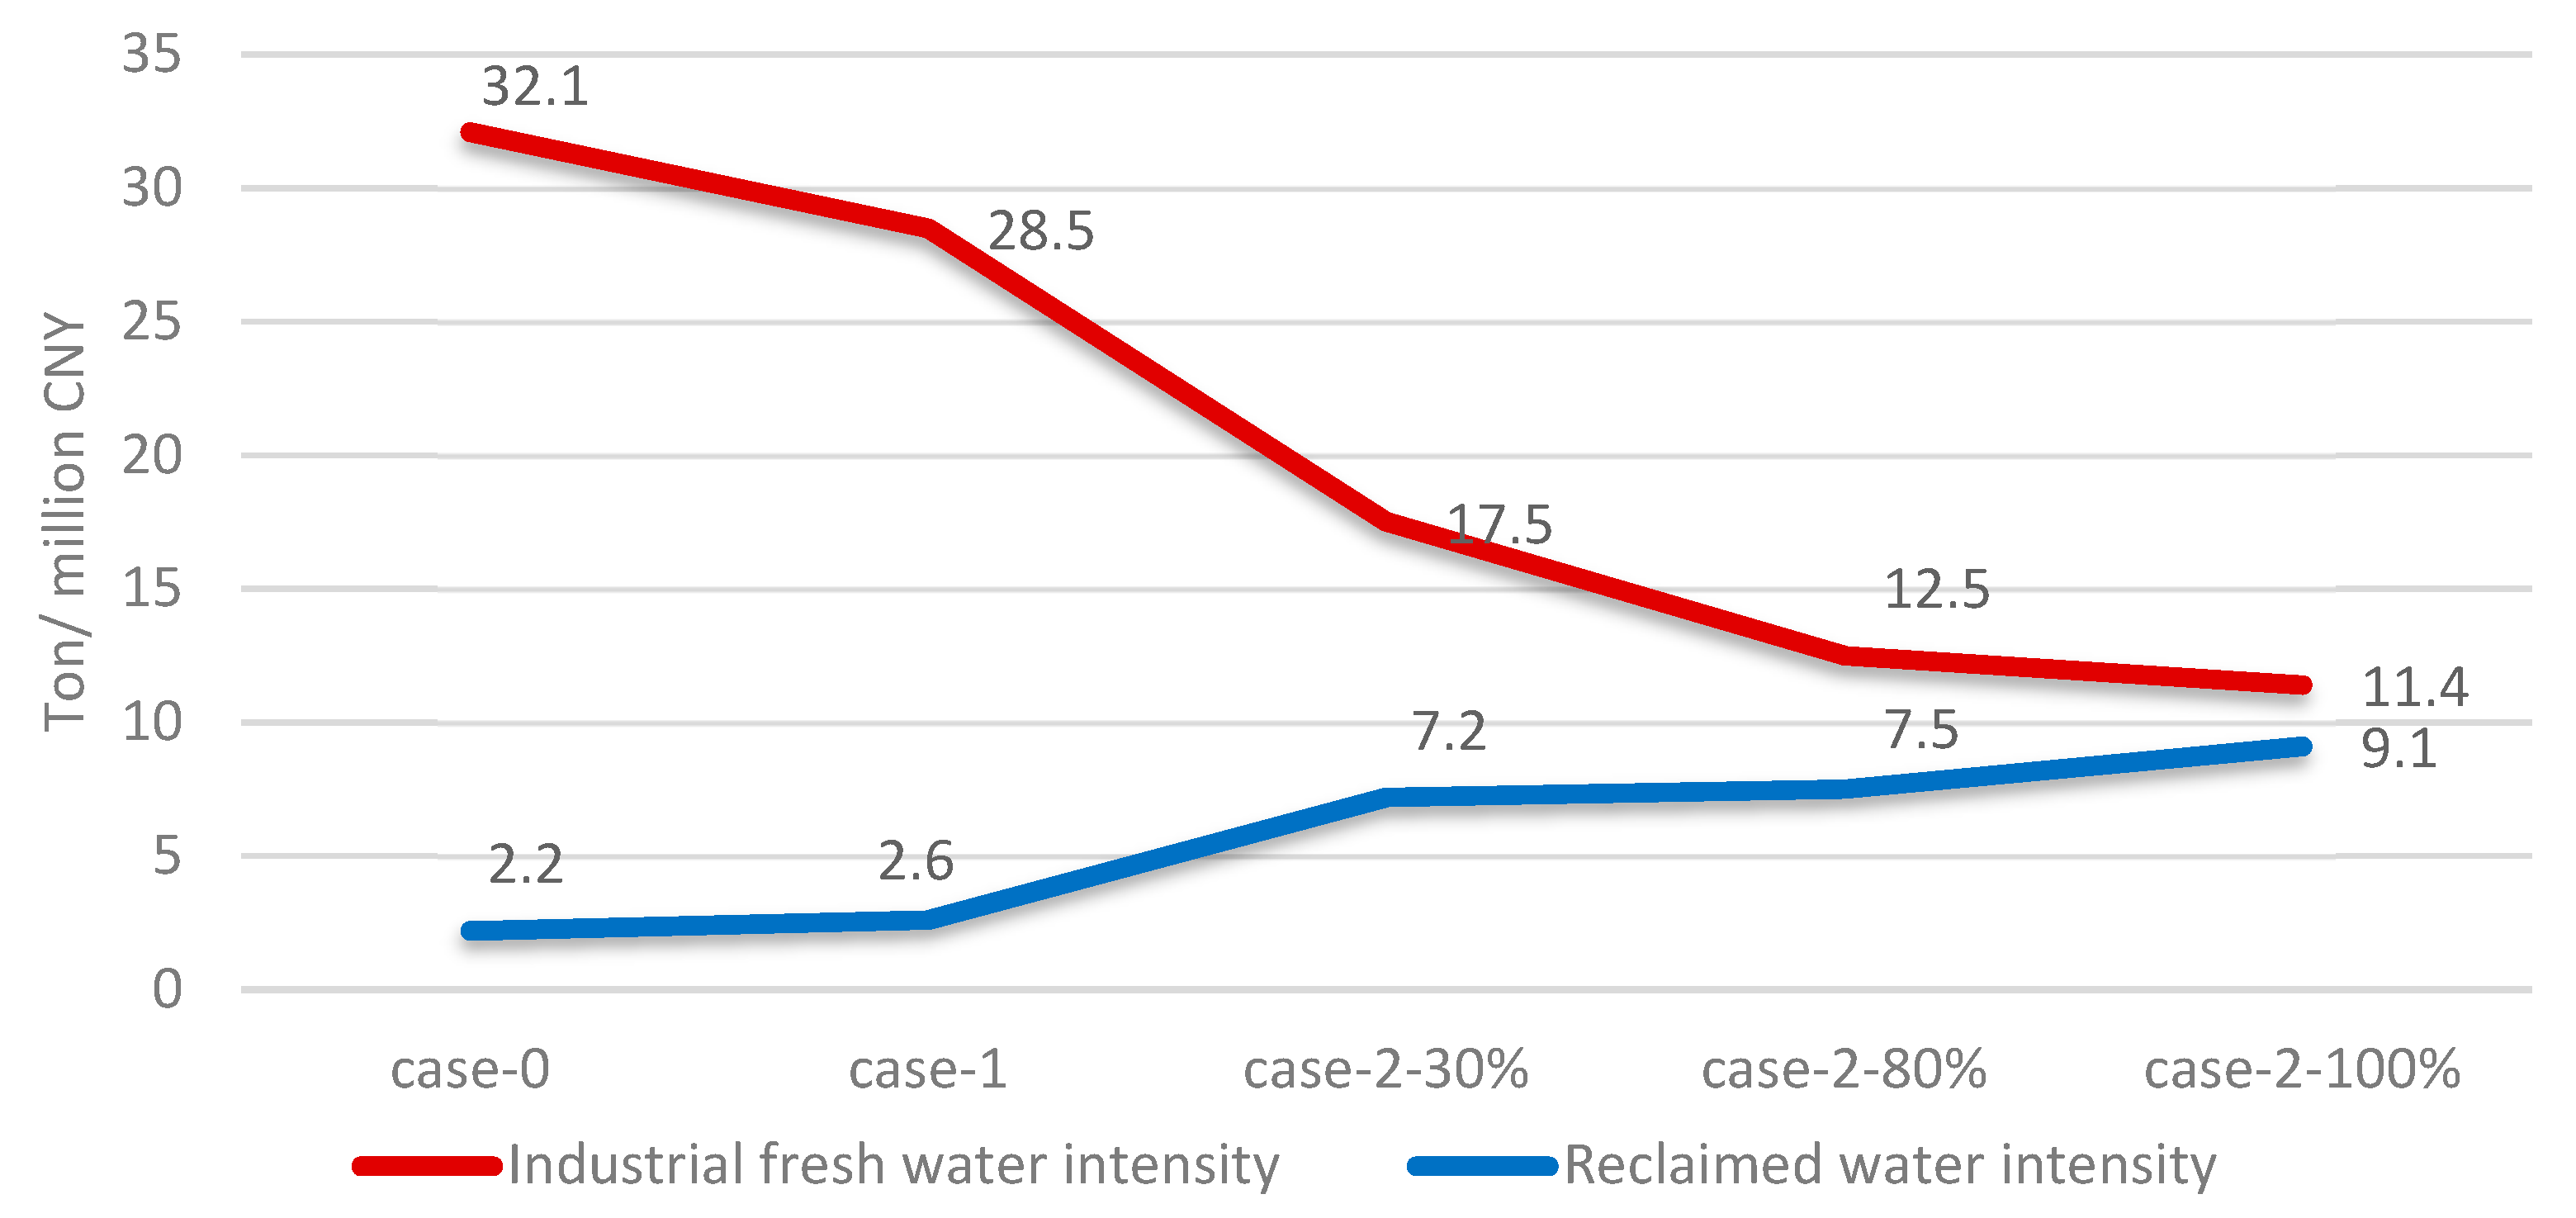
3.5. Cleaner Production Capacity Improvements in the Leather Industry
Leather is the leading industry in the Xinji industrial park, therefore, this study focused on improvements to this industry’s cleaner production capacity based on simulations.
Table 2 compares the cleaner production capacity indicator values in 2025 and changes with respect to the 2015 initial values for the different scenarios.
As listed in
Table 2, production in the leather industry has the potential to significantly increase with investment input. The leather industry is the largest contributor to Xinji’s economic growth, and its production growth rate is higher than in other industries in case-2. Water treatment processes can also effectively control water pollutants. Therefore, the water pollutant emission intensity was efficiently reduced from 600 to 120 for the COD and from 35.68 to 3.49 ton/billion CNY for NH
3-N in case-2-100%, with an 80% and 90% improvement in intensity, respectively. Comparing with a developed country such as USA’s industry water consumption intensity of is 72 ton/million dollars in 2008 [
33], even in the optimal case, leather industry’s fresh water consumption intensity (110.74 ton/million dollars with the currency exchange rate 7.0) is higher than the USA in 2008. The leather industry’s cleaner production capacity achieved fundamental improvements by introducing industry structure optimization, sewage pre-treatment plant construction, and upgrading reclaimed water treatment facilities. However, it still needs to be improved comparing with developed countries.
In general, with strict water pollutant emission constraints, Xinji’s economy can still achieve steady growth based on our simulation results with respect to the introduction of cleaner production measures in the leather industry. By 2025, the total discharge of major pollutants will continue to decline, fresh water resources will be conserved, the level of production efficiency in the leather industry will have significantly improved, environmental quality will have improved, environmental safety can be guaranteed, and environmental infrastructure will have improved, which will establish a good foundation to promote the construction of ecological civilizations. The reason for this phenomenon is the improvement in the trade-off between economic development and environmental protection, the significant increase in water use efficiency, and reductions in the water pollutant emission intensity. A win-win situation can be proved in this study [
13].
In this study, improvements in the water consumption efficiency and water pollutant emission intensity represented a cleaner production capacity. The application of the cleaner production decision optimization model allows us to identify the essential attributes that have uncertainty that managers can focus on to improve environmental performance.
4. Discussions
The leather industry faces challenges from local and international stakeholders to improve environmental performance [
17]. Despite some experts who suggest the dissolution of the leather industry in the capital region of China, this study provided a new method to estimate the leather industry’s cleaner production potential in the study area, which is the largest leather production and wholesale center in China. The global leather industry will continue to exist and develop at a stable rate, which can be attributed to an increase in global livestock production, as well as its contribution to social and economic development.
The key issue in terms of sustainable development in the leather industry is the ability to solve conflicts between manufacturing and pollution. However, the lack of comprehensive and dynamic assessment methods poses difficulties when attempting to monitor and implement cleaner production measures in the leather industry [
34]. Prior to such an assessment, we must develop a set of measures to properly assess and implement green production strategies in the leather industry.
This study has contributed to the existing literature by presenting three viewpoints that comply with the demands reported in recent studies [
29,
30,
31]. We presented a comprehensive measurement tool to evaluate the cleaner production capacity within the Xinji leather industrial park. First, this study has developed a novel measure to comprehensively and systematically analyze the mechanisms between economic objectives and environmental development in the leading leather industrial park. The cleaner production decision optimization model can be easily implemented by the leather industry to alleviate tannery waste, conserve water resources, and accelerate economic growth. In summary, this study fulfills the gaps in the literature by proposing a measurement structure to evaluate the cleaner production capacity and potential in the leather industry. Furthermore, we analyzed the development path and measures for the industrial parks using a multi-objective programming and system dynamics model methods, which can effectively guide cleaner production in the industrial parks. This is the first study to develop measures based on these viewpoints. Additionally, this study contributes to the literature by proposing the dynamic optimization method that integrates the environmentally extended input–output model together.
With respect to the seriousness of the environmental issues that occur in the leather industry, cleaner production and the implementation of environmental protection policies in leather industrial parks are of great importance. This study adopted three measures, including the introduction of the industry structure optimization, sewage pre-treatment plant construction in leather companies, and upgrades to reclaimed water treatment facilities to improve the cleaner production capacity. The case of the Xinji leather industrial park in China, with the cleaner production decision optimization model, shows that there is significant potential for reductions in economic cost and environmental pollution, as indicated by the decreasing consumption of fresh water and reductions in the amount of waste and pollutants. With these new cleaner production measures, we can conserve 18% of the water resources, with an 80% and 90% reduction for the COD and NH3-N water pollutant emission intensity, respectively. This study also shows that these measures are suitable to further develop the leather industry in Xinji by taking into account environmental protection and economic development. These are superior measures compared with simply relocating the leather industry away from the local area for long term development. Moreover, there are plenty of leather production bases in provinces like Zhejiang and Henan of China. This research can benefit their sustainable development as well.
5. Conclusions
This study investigated optimal cleaner production strategies for the leather industrial park by adopting an improved dynamic simulation approach integrating the environmentally extended input–output and system dynamics models. Simulations were able to estimate the socio-economic and water environment development of the Xinji industrial park from 2015 to 2025. Simulation results indicated that optimal results can achieve steady economic growth (7.7% annual growth rate), conserve 18% of the water resources, with an 80% and 90% reduction for the COD, NH3-N water pollutant emission intensity, respectively. The approaches including improving production efficiency, sewage pre-treatment facility construction in leather companies, and reclaimed water recycling, are approved efficient in improving water environment and economic development.
This study has presented the methodological and political implications. Firstly, the dynamic simulation approach used in this study can coordinate economic development with the resource and environmental carrying capacity, improve environmental quality while improving inhabitant quality of life, integrate social development with progress in ecological civilizations, and change Xinji into an ecologic and liveable city. The implementation of a cleaner production approach can improve environmental performance and, thereby, render the leather industry more sustainable. This cleaner production decision optimization model will become a necessary measure to promote the sustained development of the leather industry and industrial park, which provides a scientific policy-making basis for local government. Asian countries and emerging economies, like Bangladesh, India, and Brazil, etc., are the main producers of leather, and they all confronted with the same difficulties of environment protection and economic development. This study can benefit the leather industry’s cleaner production for these regions in practice. Challenges still exist for the entire leather industry due to economic restrictions and strategy limitations. Further technology selective decision models may be necessary to provide practical cleaner production plans for specific manufacturing industries. This study has presented insights that will be useful for both industry managers and future studies.

