1. Introduction
An initial public offering (IPO) refers to the process of offering new shares in a private corporation to the public in a new stock issuance. A company that meets certain criteria can issue an IPO, and the public share issuance allows the company to expand its capital due to public investors. The transition from a private to a public company is an important opportunity for existing investors who already hold private stocks to realize gains from their investment because the IPO shares typically include share premiums for current private investors. However, the opportunity to realize gains from the IPO is not limited to existing investors. In an IPO process, both new investors and existing investors with unlisted shares can participate in the offering. In general, it is difficult to buy unlisted stocks for investment. Therefore, savvy investors try to participate in an IPO process to fully realize gains. Recently, many investors have been interested in IPO funds and direct investment in IPO stocks, or they have been investing in a company that has not yet had an IPO. To create an efficient portfolio, it is critical for IPO investors to choose which IPO companies to invest in.
In the IPO process, individual investors cannot take advantage of technical analyses of stock prices and trading volume or fundamental analyses that utilize financial indicators for investments in listed stocks. Due to these constraints, most individual investors are forced to use a relatively simple method of comparing share prices and IPO prices on the over-the-counter market, while institutional investors invest in IPO stocks in sophisticated ways using financial data from the IPO process. The underwriter of a company’s IPO evaluates the company’s value, but it does not comment on matters of investment strategy, such as buy, hold or sell. Therefore, individual investors cannot expect to receive any help with regard to investing in an IPO from the IPO underwriter. Therefore, many investors will relinquish their investments in IPO stocks or resort to gossip when they decide to invest in such stocks. They will even trust and follow charlatans who have no qualifications. Despite this situation, investors should pay attention to IPO investment rather than listed stocks for a simple reason: it is difficult to find undervalued listed stocks in an efficient market. As a market matures, individual investors will gradually flock to the IPO market in search of undervalued IPO stocks. After all, the need to develop an IPO investment strategy is bound to continue to expand. However, previous research on IPOs has focused primarily on the efficiency of raising capital and price adequacy in IPOs, which depend on whether IPO prices adequately reflect the value of the firm. Additionally, IPO books rarely provide information about investment in IPO stocks. Most of them take the form of either guidebooks that introduce the procedures for participating in the IPO or theoretical books that cover the overall IPO system.
This study presents a machine learning investment strategy to maximize the returns on investment in IPO stocks, and it identifies the degree of improvement in the returns by comparing the performance of the machine learning strategy with benchmarks. Our strategy utilizes nonfinancial data disclosed in the IPO process, such as subscription competition rates and the total amount of the public offering. Unlike financial information on IPO stocks that is not publicly available, these types of data are publicly available and are hence universally utilized by individual investors. In the experiment, the return on investment that is optimized is calculated by dividing the closing price by the offering price. It is pointless to find an absolute yield from an IPO investment because IPO stocks have the characteristics of both short-term high performance and long-term low performance. Therefore, investments in all randomly selected samples are used as benchmarks to compare the degree of improvement in relative yields based on investment using our strategy. We employ rough set theory based on a genetic algorithm (GA-rough set theory) as the methodology of a machine learning investment strategy. Through the GA, we create optimal rough set rules, implement an IPO stock investment strategy and evaluate the strategy’s performance. Finally, we verify whether excess returns can be achieved from our investment strategy by comparing the returns from our strategy with those from a simple IPO investment using only public information.
As financial markets are constantly evolving with sophisticated techniques, classical financial theories are no longer effective to understand the financial market mechanism. Particularly, more advanced techniques are required for analyzing IPO stock trade due to lack of information. The classical models used in a portfolio allocation require historical market data of assets included in a portfolio to estimate the inputs of the model. Due to lack of historical market data of IPO stocks, this classical model cannot be used for IPO stock portfolio allocation. We use nonfinancial data disclosed in the IPO process and employ machine learning portfolio allocation method that does not require estimating input parameters from market data. Our machine learning technique for IPO stock helps to achieve sustained economic benefits to IPO stock investors.
There are various financial instruments traded in financial markets, and IPO stocks are of high interest to investors in financial markets. An enormous number of models or techniques for creating an efficient portfolio consisting of various types of instruments have been developed by academics and practitioners. Therefore, financial instruments, investment techniques and investors are critical components in the efficiency of financial markets, which have been well known to play an important role in sustaining economic growth. We reduce the issues of information asymmetry between institutional and individual investors using nonfinancial data that are publicly available to both individual and institutional investors in the IPO process. Investors in IPO stock markets are able to create more efficient portfolios using our machine learning portfolio allocation system based on GA-rough set theory. In this sense, the system developed in this paper appears to contribute to the efficiency of financial markets, and hence, it plays a role in sustaining economic growth.
We organize this paper as follows.
Section 2 includes a literature review that covers broad research on IPOs and reviews rough set theory and a GA with details.
Section 3 describes the method and materials. It addresses the characteristics of the data used in this study and the detailed test configuration. The experimental results and the analysis of the results are discussed in
Section 4, and
Section 5 offers concluding remarks.
2. Literature Reviews
In this section, we review the rough set theory and GA algorithm with details and describe a number of previous studies related to our study.
2.1. Rough Set Theory and Genetic Algorithms
The traditional methods used in a portfolio allocation employ mean-variance analysis based on the portfolio theory [
1]. This classical model requires historical market price and volatility data of each stock included in a portfolio to estimate the inputs of the model. Due to lack of historical market data of IPO stocks, this traditional model cannot be used for IPO stock portfolio allocation. Thus, using nonfinancial data disclosed in the IPO process, we employ machine learning portfolio allocation that does not require estimating input parameters from market data. In this study, we employ the rough set theory based on a GA. We use the rough set theory which is particularly useful for ambiguous and incomplete data because it is appropriate for ambiguous big data generated during the IPO process. To create an optimal rule set based on the rough set theory, we employ a GA which is widely used for optimization methodology to optimize the variable selection and to find optimal values of the selected variables. To the best of our knowledge, this is the first study that uses rough set theory and a GA for IPO stock portfolio allocation.
Rough set theory, which is a machine learning methodology, is a numerical and analytical approach to finding consistent rules for identifying decision attributes given the condition attributes in an uncertain and ambiguous dataset [
2]. The indiscernibility relation is a central concept in rough set theory. Any subset of a dataset is called indiscernible with regard to certain condition attributes if the objects included in the subset have equivalent relations with each other with regard to those attributes. The indiscernibility relation is intended to express the fact that some objects cannot be discerned with the available information due to a lack of knowledge. Rough set theory assumes that all objects can form a set consisting of condition and decision attributes, and it aims to identify their indiscernibility relationships based on certain information (or condition attributes) to find the decision attributes of the objects having indiscernibility relationships.
A rough set is defined by the concept of approximation. Two types of approximations are used in rough set theory. Lower approximation is a description of the domain objects that are known with certainty to belong to the subset of interest, and upper approximation is a description of the domain objects that possibly belong to the subset of interest. The boundary region is defined as the difference between upper approximation and lower approximation. A set is called a rough set if its boundary region is not empty; otherwise, the set is called a crisp set. In other words, the decision attributes of some objects cannot be determined by the given condition attributes in a rough set, whereas the decision attributes of all objects can be determined by the given condition attributes in a crisp set.
Table 1 shows an example of a rough set. A set including objects 1, 2, 3, and 4 is defined as a crisp set because the decision attributes of all objects in this set can be determined by the given condition attributes. In contrast, a set including all objects from 1 to 6 is defined as a rough set because objects 5 and 6 have the same condition attributes but different decision attributes. This implies that the decision attributes of an object with the conditions no headache and high temperature cannot be determined by the given condition attributes. Rough set theory finds the most similar condition attributes in the dataset and uses the decision attributes with the highest levels of support for objects having indiscernibility relationships.
The process of rough set rule generation consists of three steps as shown in
Figure 1. They are discretization, reduction, and rule generation. First, data discretization is the process of transferring continuous data into discrete counterparts by determining boundary values. Nguyen and Skowron [
3] proposed a Boolean reasoning approach to find boundary values for discretization. In the reduction step, a minimal set of condition attributes used to make decisions is established by eliminating condition attributes that are not directly related to the decision making. As a final step, rules are generated by combining a minimal set of condition attributes and discretized boundary values.
A GA also known as Darwinism is an optimization methodology derived from the principles of biological evolution [
4]. An individual in a dataset is characterized by a set of parameters (variables) known as genes which are joined into a string to form a chromosome. A data set of a solution to a given problem is called a chromosome (or individual) and a set of chromosomes constitutes a population. With a population, the algorithm is mainly used to find solutions to nonlinear optimization problems using evolutionary rules such as selection, crossover, and mutation, and each population is numbered as the n
th generation. Chromosomes that contain dominant genes are selected and a crossover point is chosen at random from within the genes to exchange them of two chromosomes. In addition, some of genes in a chromosome are modified to maintain diversity within the population and prevent premature convergence. The algorithm terminates if it does not produce a new population which are significantly different from the previous population and converges to a solution.
Table 2 summarizes the basic terms of a GA.
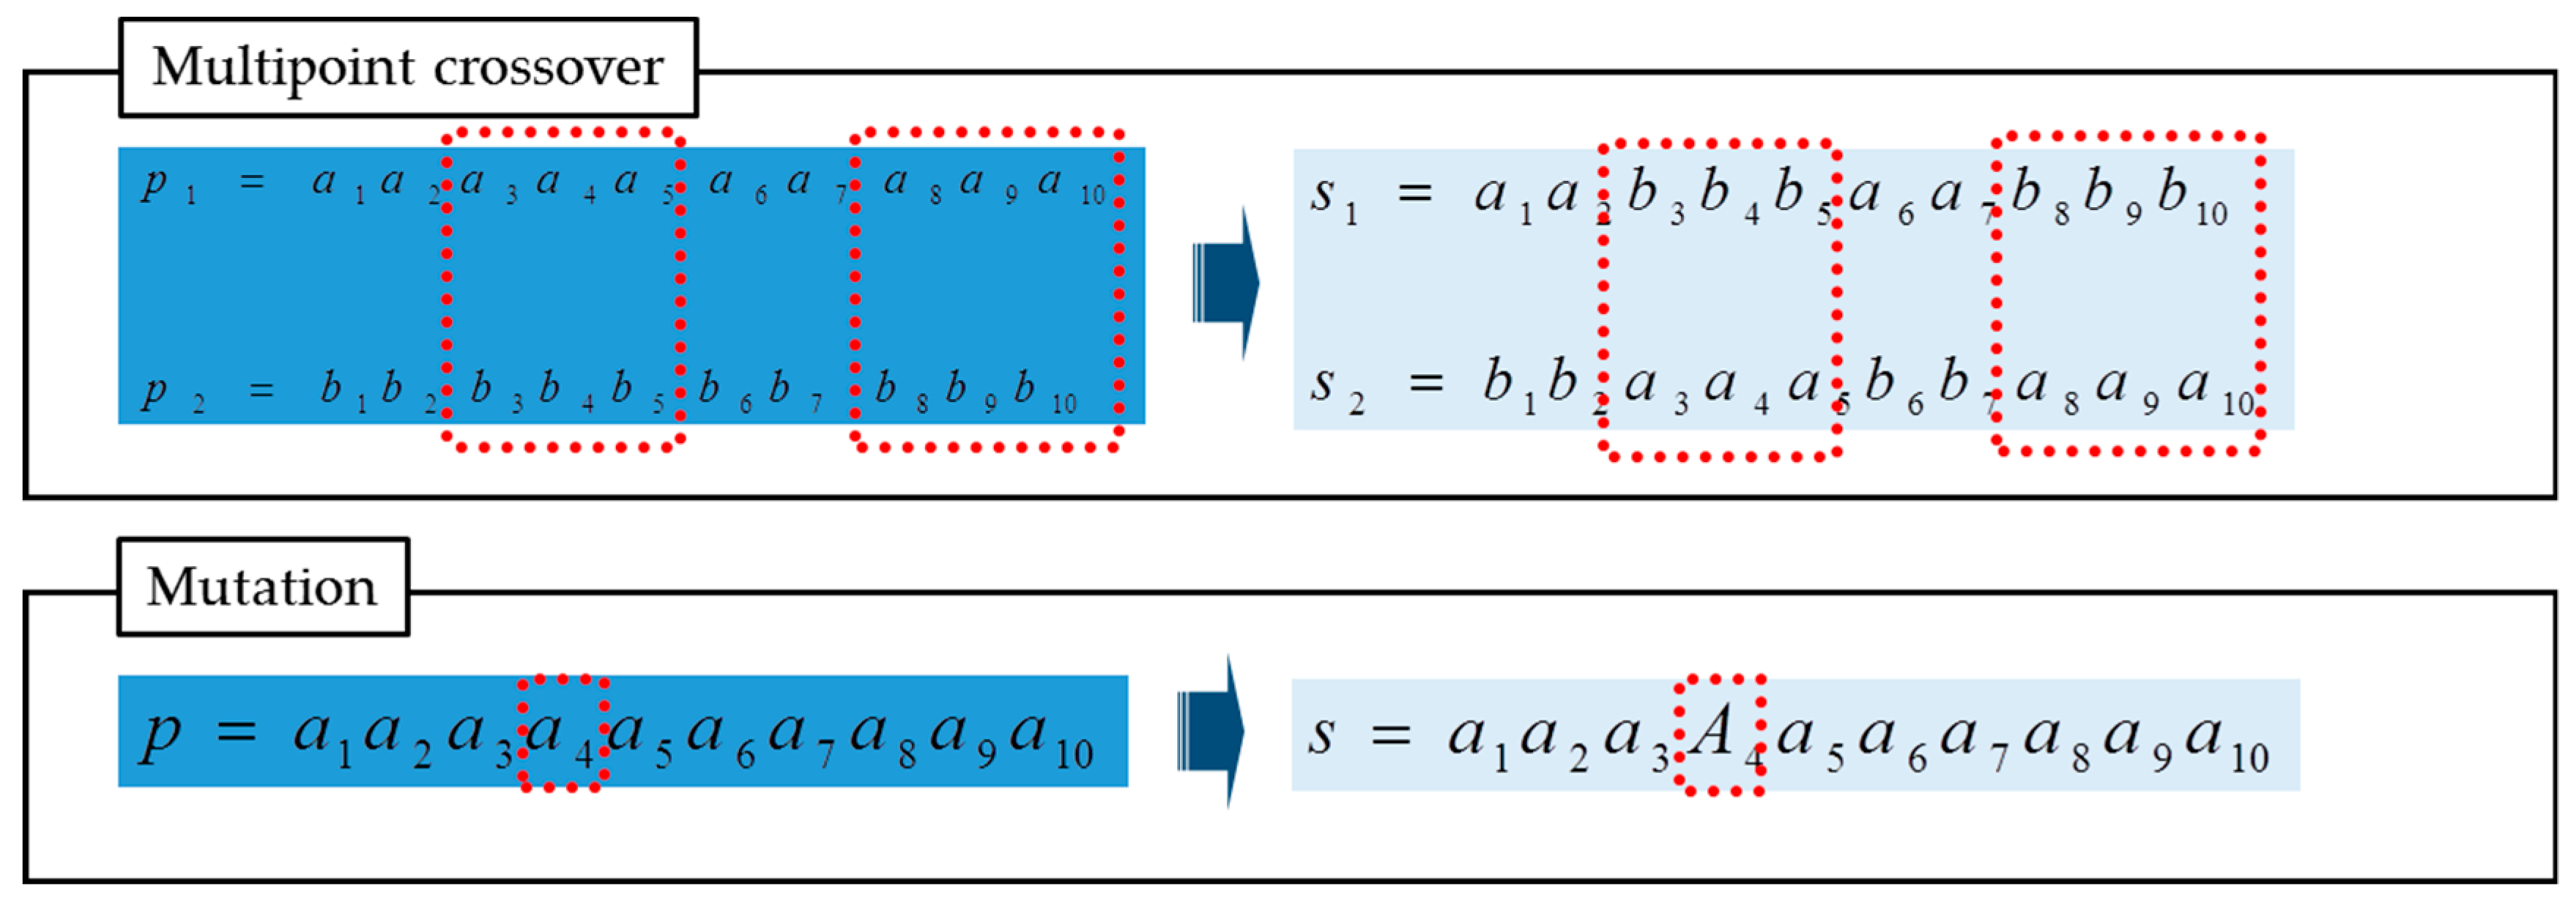
A GA generally consists of four steps. The first step involves creating chromosomes, which are basic sets of data, before applying the algorithm optimization (i.e., evolution). All chromosomes for solutions are usually converted into a binary structure, and the objective (i.e., fitness) function, which represents the goal of the problem and is used to calculate the fitness score, should be constructed. The objective function is the basis for evaluating the fitness of each generation. The data values are usually standardized between fixed intervals in this step as the range of data values varies. The fitness value based on the raw data values is called raw fitness, and the objective function based on the standardized values is called the fitness function. The second step consists of checking the suitability of each chromosome through the fitness function. The distribution of fitness in the population determines the survival probability of a population in the next generation. Chromosomes are selected based on their survival probability, and the best solution is preserved for the next generation. In the third step, chromosomes less suitable are changed or removed from the population. Crossover is the process of generating a new chromosome through the exchange of the some genes of two chromosomes. The successful combination of the superior genes can lead the significant advances in the next generation. Mutation is a type of local random search that generates a different chromosome by replacing a gene of a chromosome with another gene.
Figure 2 shows the simple example of crossover and mutation in a GA. In the last step, the GA provides a set of solutions to a given problem. Moving on to the next generation, the evolutionary rules are implemented based on the fitness scores of chromosomes; these scores measure how well chromosomes fit the problem. Typically, chromosomes that have higher fitness scores have a higher probability of being chromosomes for crossover according to a selection rule. A crossover rule is a way to create better chromosomes by mixing two different chromosomes, and a mutation rule randomly selects and changes the genes of chromosomes. By repeating this process, chromosomes gradually fit the objective function through selection, crossover, and mutation and are closer to the optimal solution.
2.2. Related Studies
A number of studies focus on the adequacy of IPO prices. Because an IPO process is similar to an auction process, the “winner’s curse” is expected to exist in IPO markets. This is a phenomenon in which an investor who does not have adequate information but who succeeds in purchasing a stock loses money because he or she buys it at a high price. Such high prices slow down investment in an IPO due to concerns over the winner’s curse. Therefore, the underwriter undervalues the initial value of stocks to create attractive prices to promote a smoother IPO process [
5]. Derrien [
6] showed that the more individual investors participate, the higher their performance at the beginning of the listing. Regarding long-term low performance, Jain and Kini [
7] found that early stock prices tend to form around optimistic investors in determining public offering prices or in the early days of listings, leading to a drop in stock prices in the long run. Miller [
8] showed that an IPO investment cannot be shorted, as a result of which pessimistic information is not reflected.
The followings are studies on the variables of and returns from the Korean IPO market. Han [
9] confirmed that the lower the determined offering price, the higher the return on shares at the date of the listing. Kim [
10] showed that the higher the competition rates for a subscription for general investors, the higher the returns on the public offering shares. Chun et al. [
11] found that high competition rates and high listing densities over a given period increase the initial performance of IPO stocks. Baek and Jeong [
12] stated that the lock-up ratio affects the initial undervaluation of IPO shares. The lock-up ratio is the ratio of the number of shares that are guaranteed to hold for a given period of time to the total number of applications for book building. Shin et al. [
13] noted that the supply of public shares is a major variable because there are a limited number of participants in a public offering market and the size of the investment does not change rapidly. As variables related to supply, the size of the public offering, the sellable stock ratio on the listing date, and the density of the public offering one month before and after the listing date were proposed [
13].
The followings are IPO researches using machine learning techniques of rough set theory or a GA. Luque et al. [
14] was inspired by the voronoi regions to build the model for IPO underpricing and to produce acceptable results. However, various market environments could not be verified due to the limitation of using data for a relatively short period from 1996 to 1999. Quintana et al. [
15] presented strategies for IPO underpricing prediction and Esfahanipour et al. [
16] examined probability of withdrawal and underpricing of IPO stock using neural network and fuzzy regression. They found that the probability of IPO withdrawal plays an important role in precise evaluation of underpricing. Quintana et al. [
17] measured prediction accuracy of IPO stock prices using nine machine learning techniques. The experiment was repeated 15 times with the aim of maximizing the closing price return. Among them, the random forest method showed 69% accuracy and was superior to the other eight methods. Quintana et al. [
18] employed fuzzy rules and GA to construct an IPO stock portfolio and achieved excess returns. Attempting to select IPO stocks, Huang et al. [
19] proposed a genetic algorithm-based fuzzy model. Chen and Cheng [
20] proposed a rough set-based classifier and classified the return on 5 days after a Taiwanese IPO. Attempts have been made to incorporate fuzzy theory, and the variables used are the public trading year, underwriter and company age. However, this study did not calculate the actual return on portfolio investment. Trauten et al. [
21] validated the performance of investment strategies at specific market timings and described hot IPO markets and cold IPO markets.
Rough set theory and a GA have been used to create efficient portfolios consisting of various financial instruments. Chung and Oh [
22] improved investment performance in KOSPI 200 by using GA-rough set rules for technical indicators. Song et al. [
23] confirmed that genetic algorithms effectively reduce the risk exposure of option portfolios. In addition, the GA-rough set theory is employed by Kim et al. [
24] which studied the stock index trading technique. In this paper, stock index trading rules in the futures markets are developed using the GA-rough set theory to construct an intelligent hybrid trading system. They analyzed trading performance according to the number of sets of decision rules and the size of the training period for discovering trading rules for the testing period. The results show that the proposed model significantly outperforms the benchmark model in terms of the average return and as a risk-adjusted measure.
3. Materials and Methods
3.1. IPO Process and Parameter Setting
3.1.1. Brief Summary of the IPO Process
The entire IPO process is shown in
Figure 3. If a company that meets certain requirements, such as the period and size of operation, wishes to be listed, it selects leading management securities at least two months before it applies for a preliminary review of listing eligibility. The selected leading manager shall conduct due diligence on the client and perform a preliminary review of the listing eligibility of the company. Then, the company will submit the securities registration statement for evaluation of the adequacy of the public offering, and the investor relations of the company will provide investors with an accurate account of the company’s affairs. Afterwards, the IPO will set the public offering price through a process called book building, which is carried out by institutional investors. In this step, some companies withdraw their listing if the determined public offering price is not satisfactory. When the IPO price is determined, individual investors are allowed to invest in IPO stocks through a general subscription. Once book building is complete, numerous variables, such as the book building competition rate or the percentage of the lock-up ratio that is guaranteed protection against selling shares for a certain period, are determined. Some days later, the listing proceeds.
3.1.2. Parameters of GA-Rough Set Process
The rule sets are treated as a chromosome, and the maximization of the return of a portfolio constructed by the rule sets is used as the target of the optimization. Each combination of selected variables is a gene in a chromosome, and only the chromosomes that are in the top 40% of fitness survive. For the chromosomes in the other 60%, random selection and single-point crossover techniques are used. After the crossover process, some genes of chromosomes are mutated into random genes based on the mutation rate. Finally, the next generation is composed of chromosomes that are in the top 40% of the previous generation and the chromosomes from selection, crossover, and mutation. The GA stops when a number of generations have all evolved. The larger the population and generation, the greater the likelihood that a globally optimized solution will be obtained, but the complexity of finding optimal variables will increase exponentially. Therefore, the empirical analysis is usually carried out using a reasonable stopping condition in the process of finding an optimal solution. In this paper, the optimization process ends when the average population fitness does not improve, or the surviving chromosomes do not change after 30 iterations. The main parameters of the genetic algorithm, such as population, crossover, and mutation, are set to 70, 0.3, and 0.05, respectively, which are commonly used default settings.
3.2. Nonfinancial IPO Data
The study data are based on 718 Korean Exchange IPOs (excluding split-listings and special purpose acquisition companies) from January 2007 to December 2018. The number of IPO stocks per year is shown in
Table 3.
For the experiment, we use 9 variables: the sellable shares ratio, the issued stock public offering ratio, the amount, the density of the offering, the bid excess offering price ratio, subscriptions for institutions, subscriptions for individuals, the obligatory holding commitment ratio, and the market. The sellable shares ratio is the number of sellable shares on the date of listing divided by the total number of shares listed. In general, in the case of a high sellable shares ratio, investors do not take part in book building. The issued stock public offering ratio is the ratio of the number of issued stocks in a public offering to the total number of IPO stocks. The amount means the total market capitalization of IPO stocks. The density of the offering is the min-max standardized number of IPOs listed one month before and one month after the listing date. The bid excess offering price ratio is the ratio of the number of bids for shares with a bid price in excess of the offering price to the total number of bids for shares in the process of book building. Subscriptions for institutions indicate the competition rate for book building and is calculated by dividing the volume of stocks subscribed by institutions by the total volume assigned to institutions. Subscriptions for individuals indicate the competition rate of general subscription after book building and is calculated by dividing the volume of stocks subscribed by individuals by the total volume assigned to individuals. The obligatory holding commitment ratio is the ratio of the number of book building shares guaranteed to hold for a period of time to the total number of book building shares. The market is an indicator of the markets where stocks are listed, such as KOSPI and KOSDAQ.
Table 4 summarizes the description of the variables and provides examples of each. As shown in
Table 4, the scales of the value of each variable are very different; thus, min-max normalization between 0 and 1 was performed.
3.3. Experimental Process
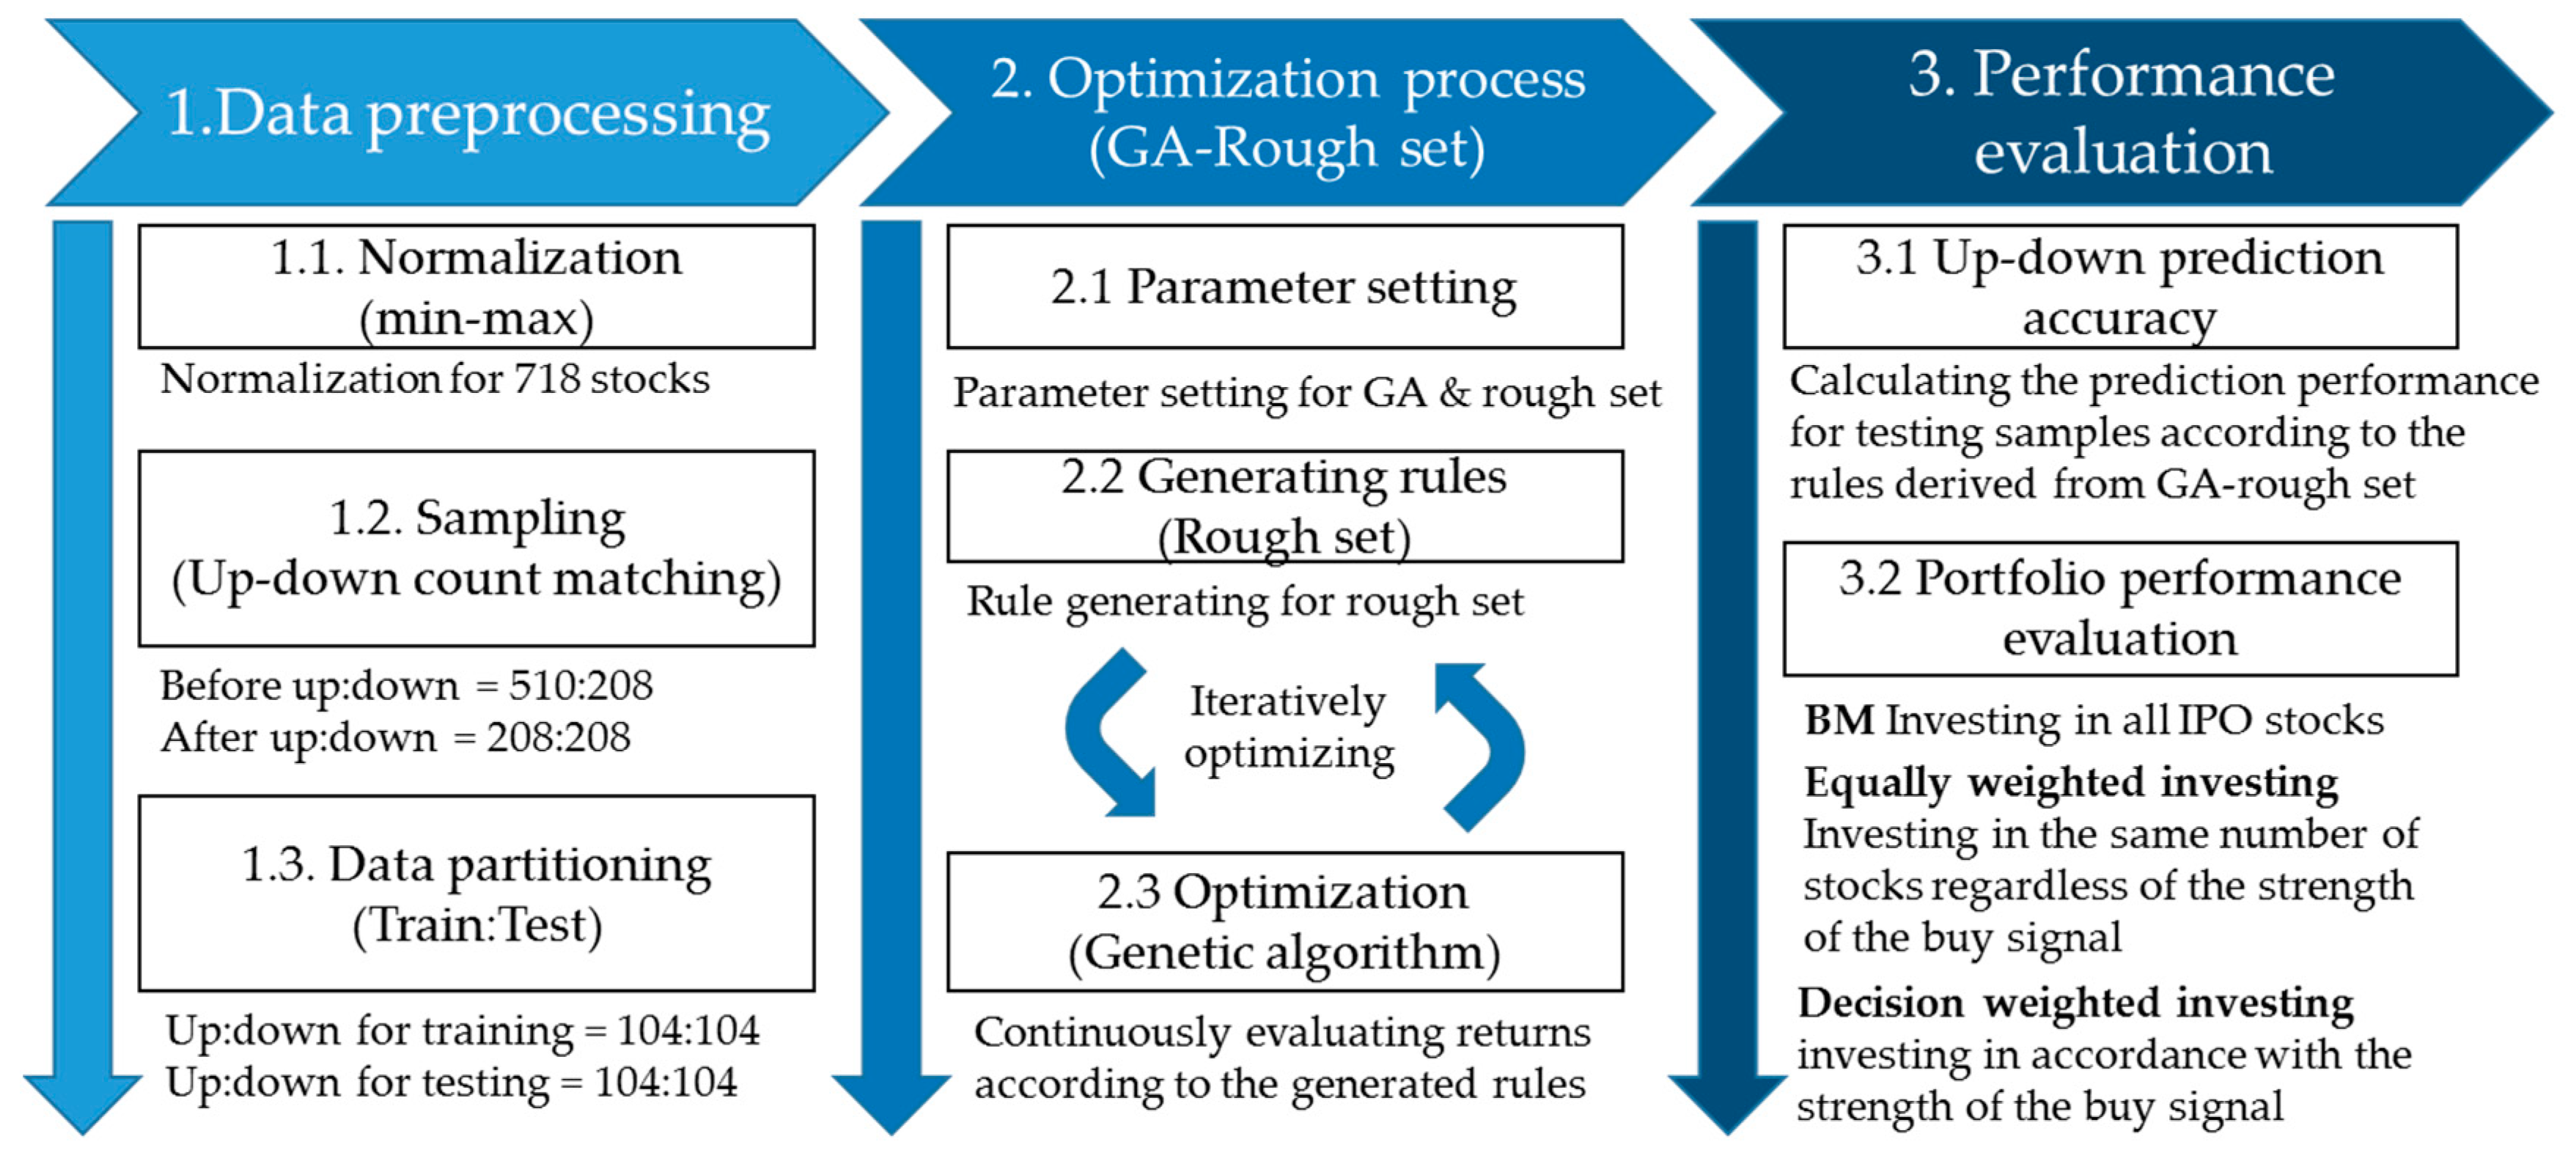
The experiment confirms the up and down prediction of stock prices on several target days: the listing date, the listing date +1 business day, the listing date +5 business day, the listing date +30 days, the listing date +60 days, and the listing date +365 days. As shown in
Figure 4, the overall experimental process consists of three steps: data preprocessing, the optimization process, and the performance evaluation. The experiment in
Figure 4 is repeated ten times for each target day, and the average performance of the constructed portfolio is examined.
3.3.1. Data Preprocessing
The nine variables used in this experiment have various scales ranging from 100 billion units to decimal units. In the machine learning process, min-max normalization was performed for these variables to generate values between 0 and 1 so that each variable has equal influence. The total number of stocks in our sample is 718, and the stock prices of 510 (208) are up (down) after the IPO process. We sample the 208 up-stocks to match their number to that of the down-stocks to avoid bias in the decisions of the machine bets. This experiment appears to have time series characteristics depending on the time of listing, but in fact, each IPO event is an independent event. The data are randomly scrambled to remove the time series effect. Prior to the repeated experiments, the data are partitioned into the most commonly used ratios of 5:5 and 7:3, which correspond to the training set: the testing set.
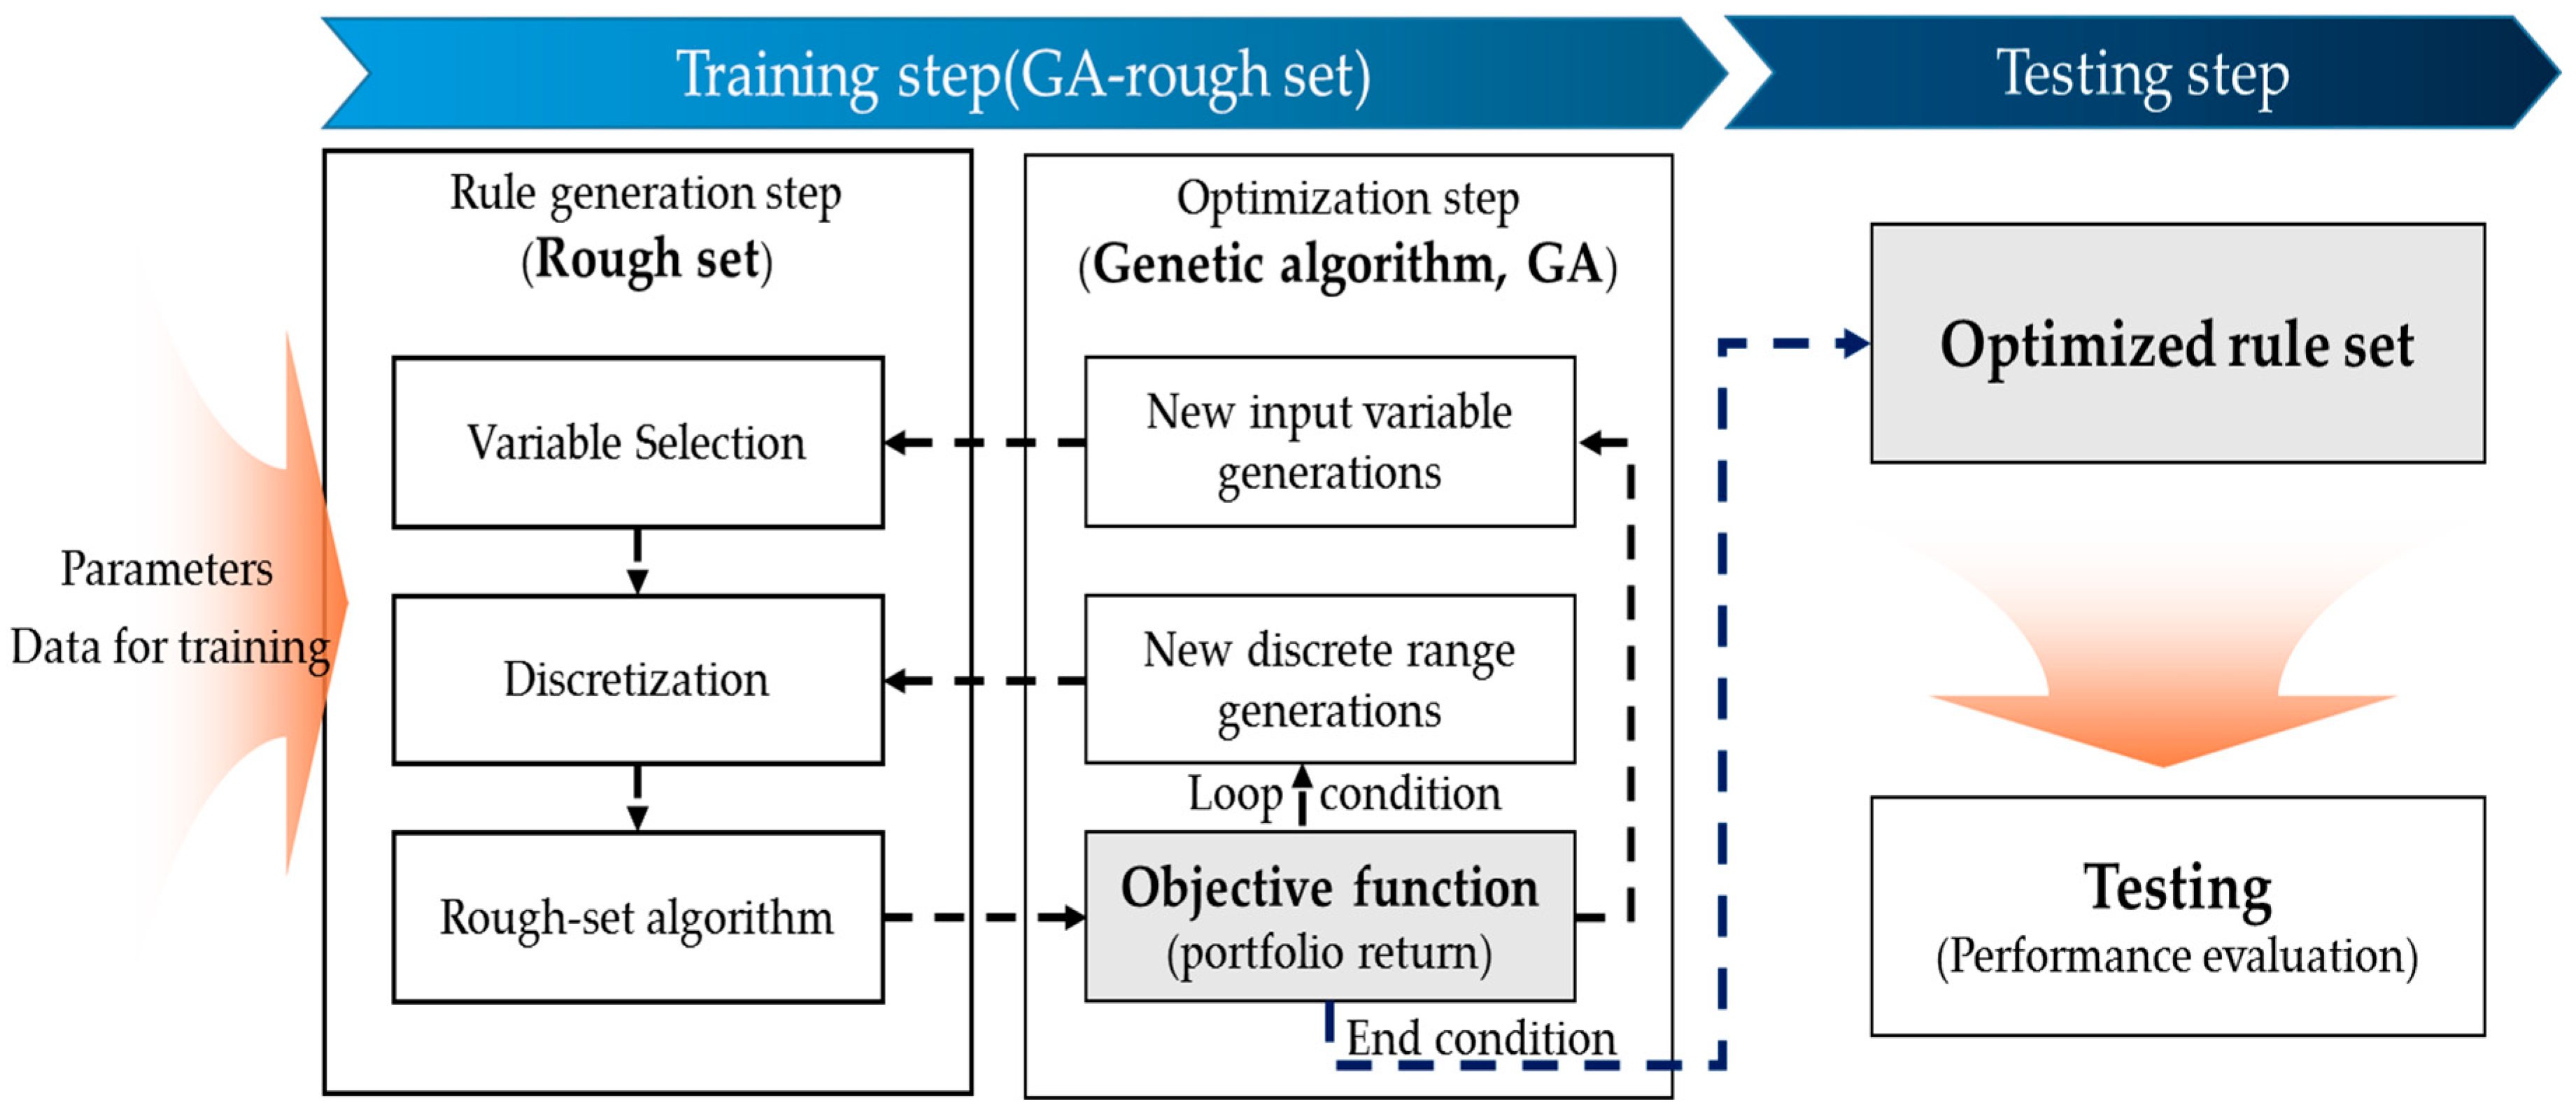
3.3.2. Optimization Process
The GA-rough set model proposed in this study aims to optimize the rough set rules for IPO portfolio allocation. The optimization of rough set rules is performed on the training set. The optimization process consists of two steps: rule generation using the rough set theory and rule optimization using the GA. In the rule generation step, variables are firstly selected from non-financial input data and the discretization is performed by determining the ranges of values of selected variables. Then, rules for constructing a portfolio are determined by the rough set algorithm. Once a portfolio is constructed by the rules, the portfolio return is used as an objective function for the GA optimization to generate new variables and new discrete range of the variables. Using these new variables generated in the optimization step, rough set algorithm constructs a new portfolio. In the optimization step, input variables that improve the portfolio return survive, while variables that do not increase the return are evolved or excluded. To obtain optimal rules, a machine iteratively generates combinations of rough set rules to achieve the target return of the constructed portfolio using the GA until the parameter condition of the GA is satisfied. Finally, the rough set rule that produces the best performance for the training set is created. This process is shown in
Figure 5.
3.3.3. Performance Evaluation
The rules learned through the training set are applied to the testing set, and the accuracy of the IPO stock price prediction is measured. Sometimes, the rule generates several decisions with regard to the up or down movement of one stock price. In this case, +1 is assigned to the decision of an up movement and -1 is assigned to the decision of a down movement of the stock price, and the sum of all decisions for the stock is used to make the final investment decision. A final decision of an up movement (or +) of a stock price is a buy signal, and that of a down movement (or −) of a stock price is a sell signal of the stock. The returns of portfolios based on the final decision signal are compared to those of benchmark portfolios. Using the optimized rules, we construct an equally weighted portfolio and a decision weighted portfolio for each experiment. An equally weighted portfolio includes the same number of stocks that have buy signals, while a decision weighted portfolio includes stocks in accordance with the strength of the buy signals. In this paper, we use a slightly different definition of an equally weighted portfolio that includes the same number of stocks, not equally invested stocks. We also construct a benchmark portfolio containing all IPO stocks included in the testing set. Examples of an equally weighted portfolio and a decision weighted portfolio are shown in
Table 5.
As shown in these examples, all stocks generating buy signals are included with an equal weight in an equally weighted portfolio, while all stocks generating buy signals are included with a decision weight in a decision weighted portfolio. Because taking a short position on IPO stocks is practically impossible, stocks that generate sell signals are ignored.
4. Results
4.1. Up-Down Prediction Accuracy
As described above, this experiment uses nonfinancial IPO data as input variables, and we use the same number of up- and down-stocks for our experiment to prevent any possible bias in the optimization. We exclude random up-stocks or down-stocks to have the same number of up- and down-stocks. Each experiment generates approximately 1000 to 1500 rules with an entire range of optimized values of the nine variables. Three examples of the rule set generated in our experiment are shown in
Table 6, and the interpretation of an example of the rule set is described in
Table 7.
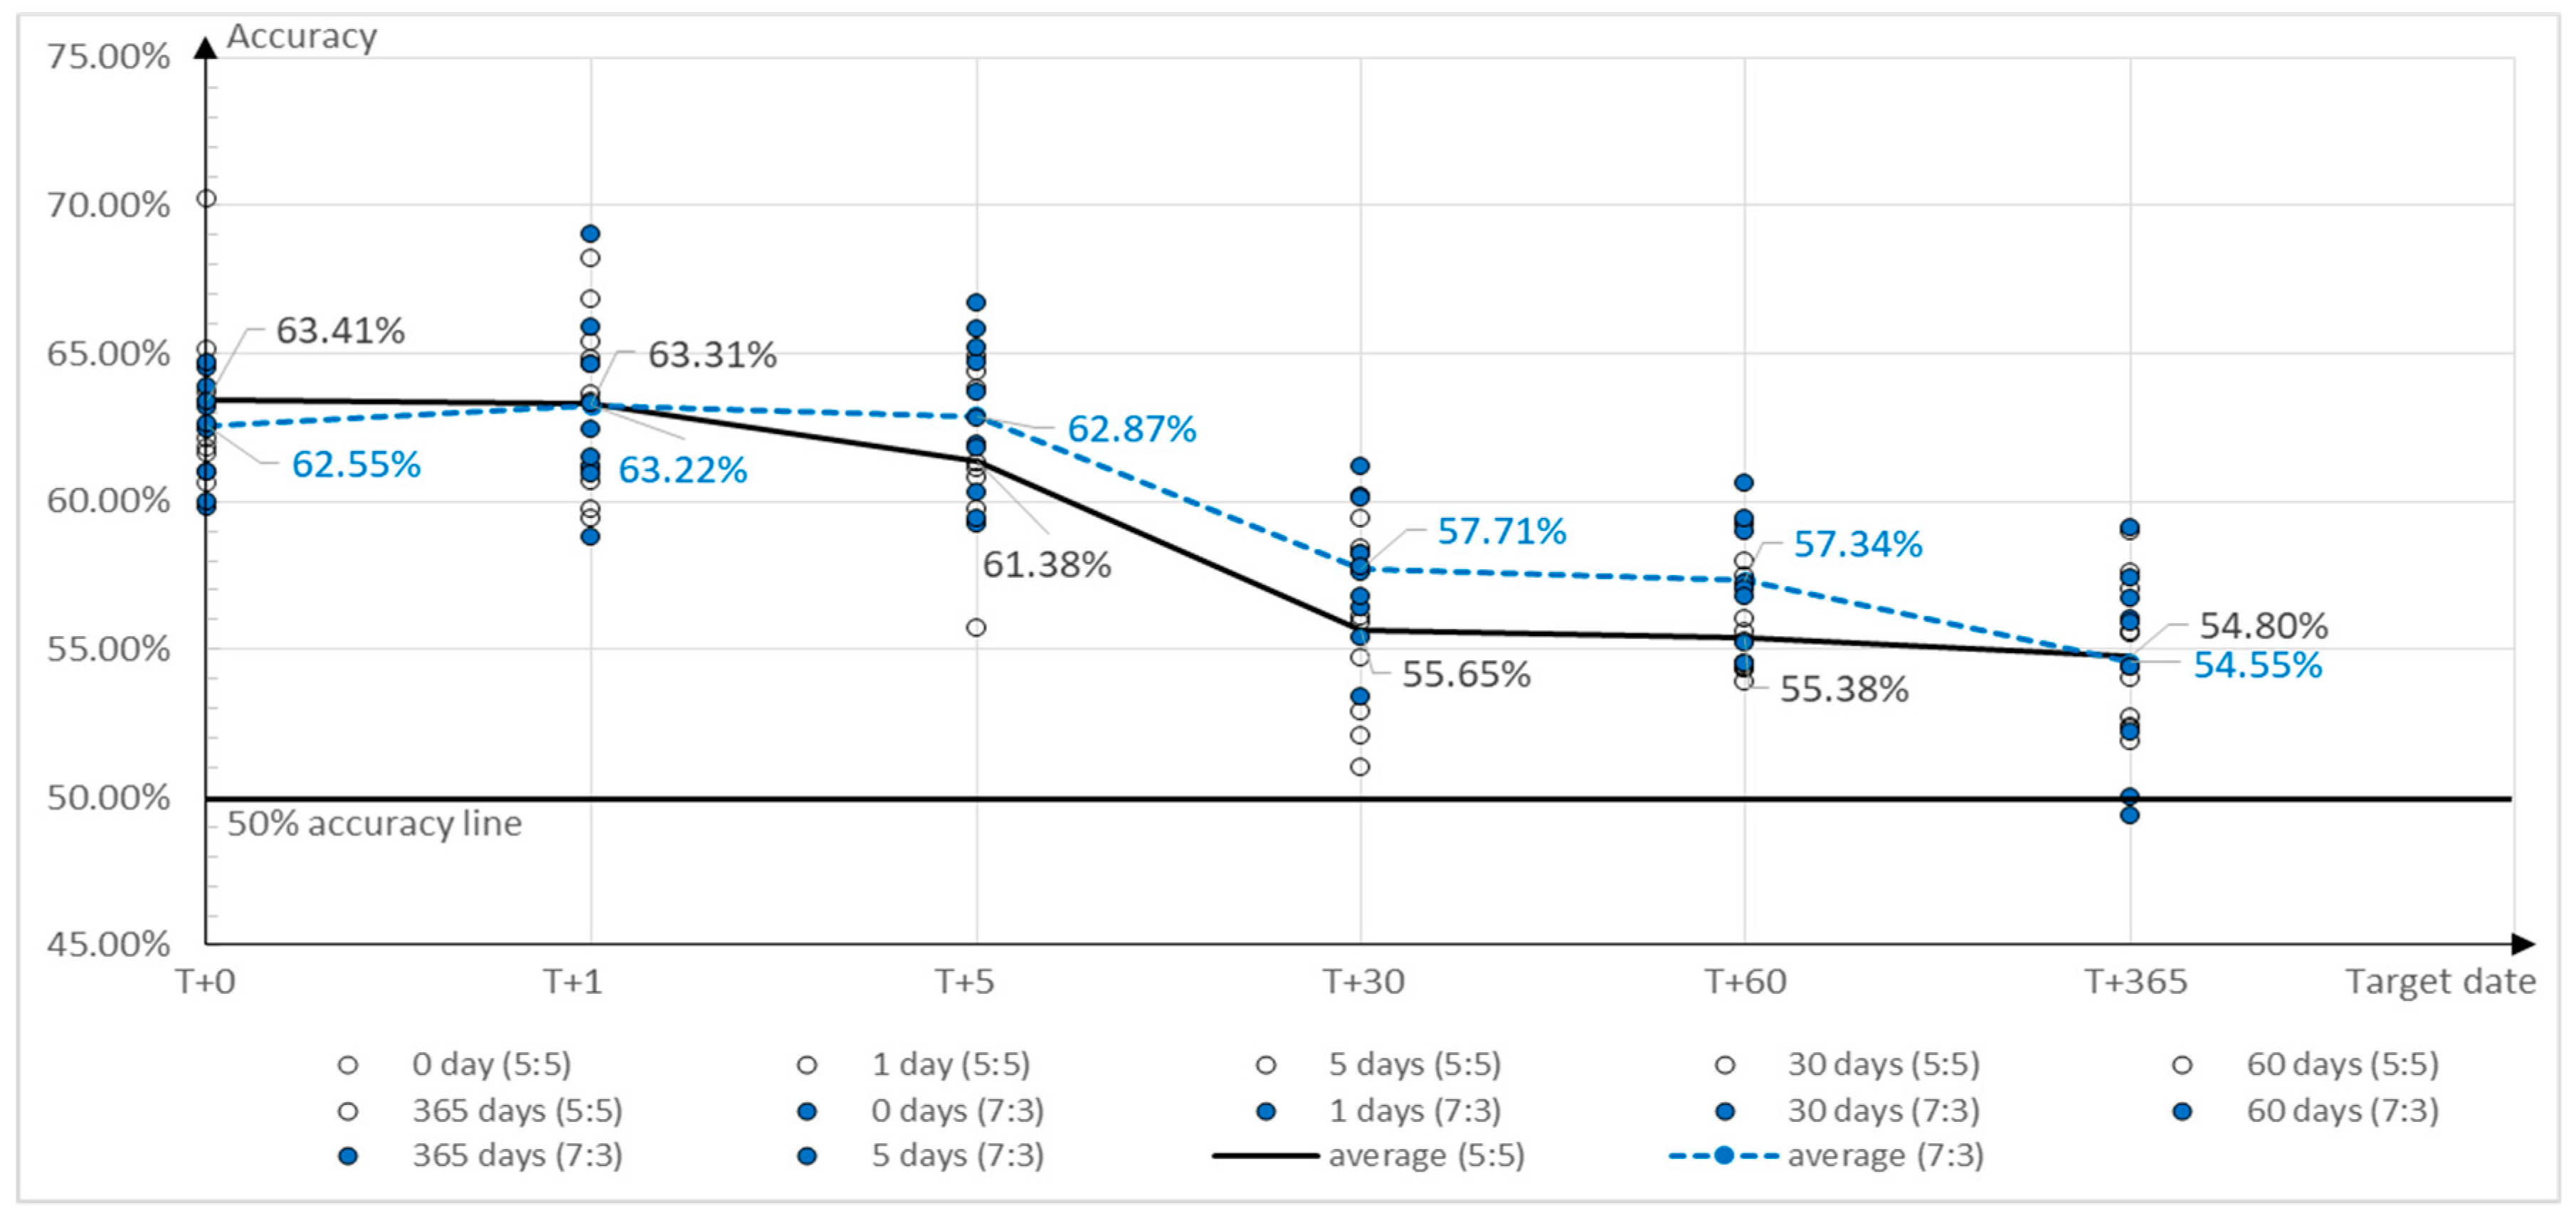
In the next step, we predict the prices of the stocks included in the testing set using the rules generated from the training set and calculate the prediction accuracy rate of stock prices on the target day. The target day for prediction includes the listing date, the listing date +1 business day, the listing date +5 business day, the listing date +30 days, the listing date +60 days, and the listing date +365 days.
Table 8 shows the prediction accuracy resulting from the repeated tests. We conduct the tests 10 times for each target day using the ratios of the training set to the testing set of 5:5 and 7:3, leading to a total of 120 tests.
The prediction accuracy shown in
Table 8 was found to decrease as the number of days between the forecast date and the listing date grew. The average prediction accuracy on the listing date was approximately 63% and decreased to 55% after one year. The results in
Table 8 are plotted in
Figure 6.
4.2. Portfolio Performance
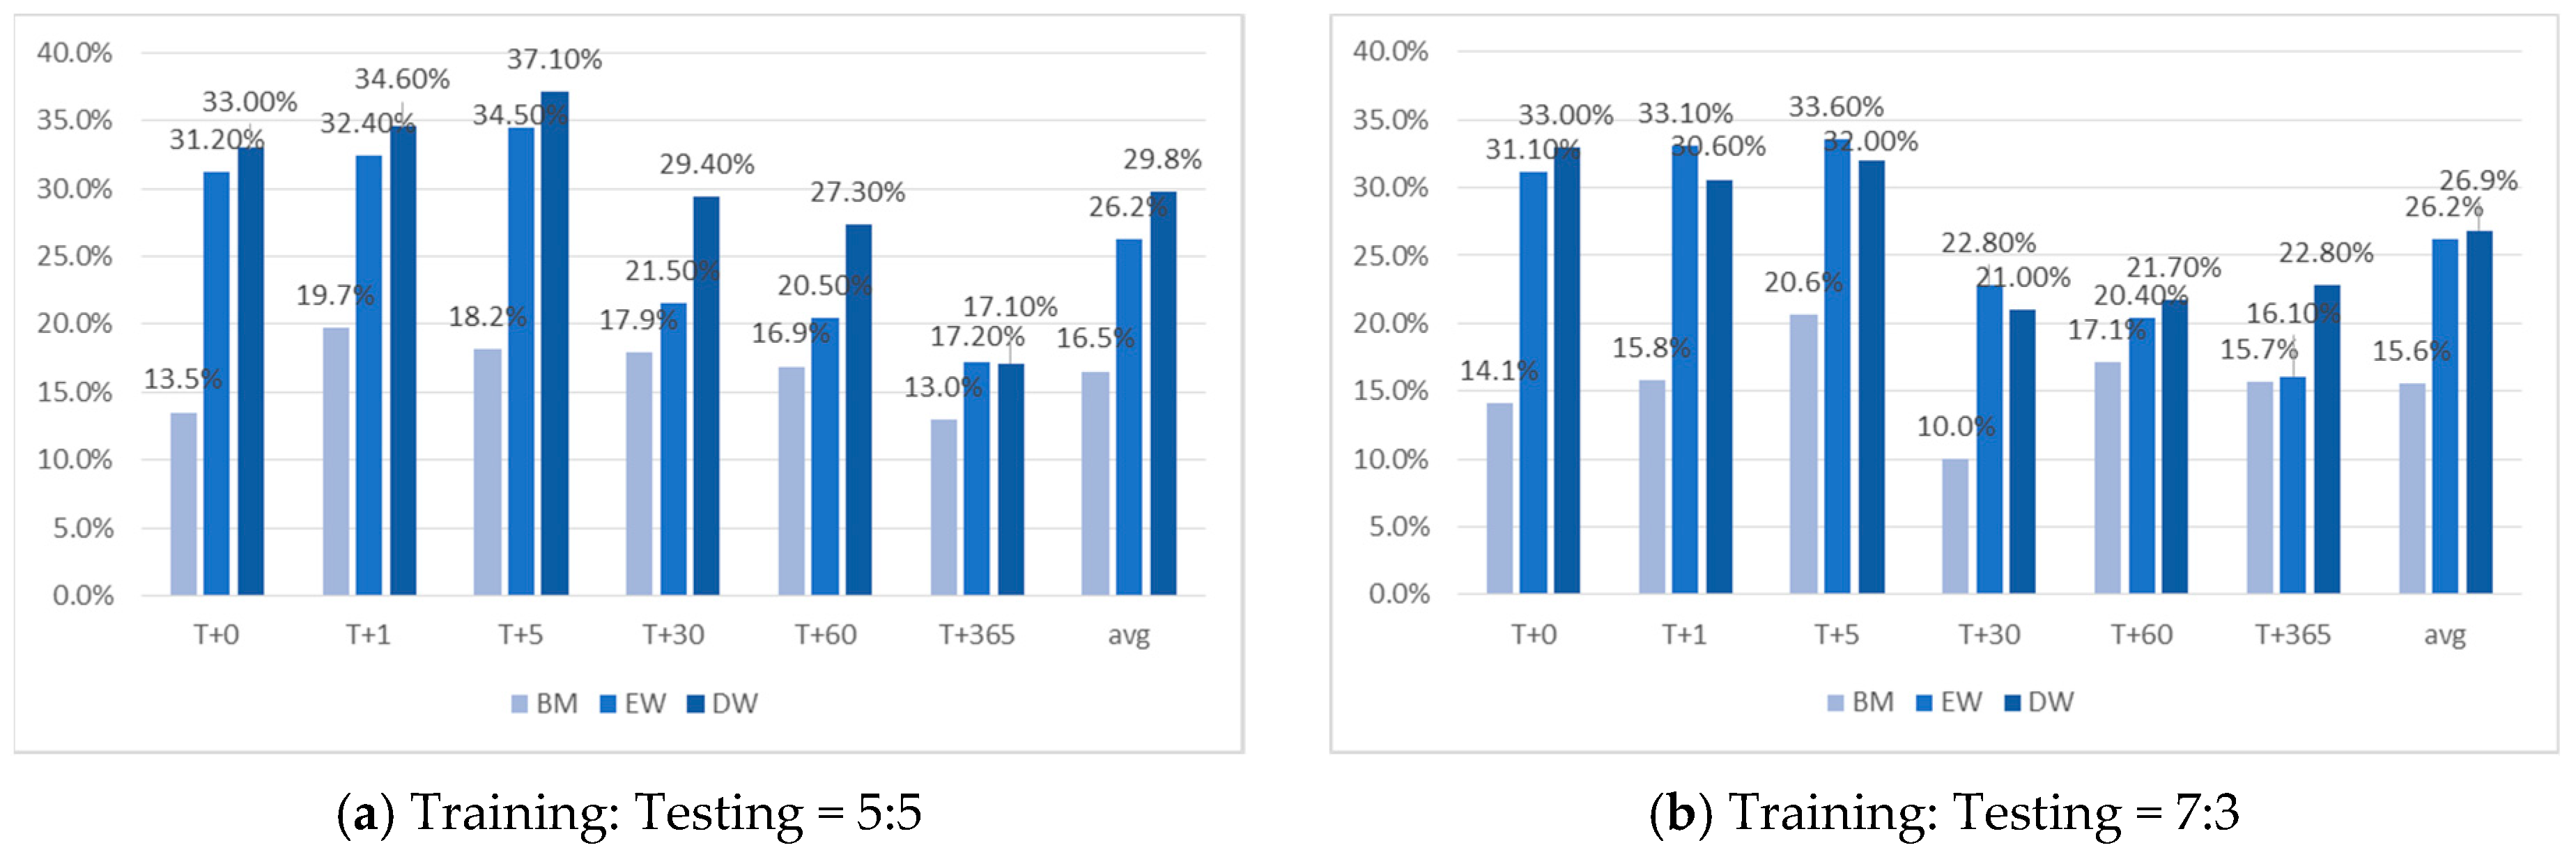
We calculate the returns of the equally weighted and decision weighted portfolios constructed by the rule generated from our experiments on the target days using the ratios of the training set to the testing set of 5:5 and 7:3. We also calculate the returns from a benchmark portfolio for each experiment.
Table 9 reports the average returns of the three portfolios constructed from 120 experiments, and
Figure 7 compares the returns of the three portfolios on the target days. The values in parentheses in
Table 9 are the difference between the returns from the constructed portfolio and the benchmark portfolio.
As shown in
Figure 7, the experimental results show that investment using the optimized rules generated from the rough set achieves excess returns compared to the benchmark returns. The average excess returns of the equally weighted portfolios (decision weighted portfolios) are 10.2% (12.3%). Indeed, the excess performance is found to be relatively high in the short-term period after the listing date, and the excess performance rapidly decreases over time. We find that the decision-weighted portfolios outperform the equally weighted portfolios on most target days. It is also noted that the returns of the benchmark portfolios are stable across the target days compared to those of the other portfolios.
5. Conclusions
This paper develops a machine learning portfolio allocation system for IPO stocks in Korean markets based on rough set theory and a GA. To reduce the issues of information asymmetry between institutional and individual investors, we use nonfinancial data that are publicly available to both individual and institutional investors in the IPO process. The GA is used to optimize the variables of IPO stocks with their values to generate the rule sets, which consist of condition attributes and decision attributes, based on rough set theory. Based on the rule sets generated from the training sets, we conduct 120 tests with various conditions involving the target days and the partition of the training and testing sets. First, we predict the prices of the stocks included in the testing sets using the rules generated from the training sets and calculate the prediction accuracy rate of stock prices on the target days. The average prediction accuracy on the listing date is approximately 63% and decreases as the number of days between the forecast date and the listing date grew. In the next step, we construct equally weighted and decision weighted portfolios using the rule set generated and compare the performance of these portfolios with the performance of benchmark portfolios. The results show that the constructed portfolios based on GA-rough set theory achieve excess returns compared to the benchmark returns. The average excess returns of the constructed portfolios are higher than 10%. We also find that the excess performance is relatively high in the short-term period after the listing date, and it rapidly decreases over time. The decision weighted portfolios are found to outperform the equally weighted portfolios on most target days. The experimental results provide useful information, and the system developed in this paper can be utilized as a portfolio allocation strategy for investors in IPO stocks in Korean markets.
Given the significant overall excess returns from the constructed portfolios compared to those from the benchmark portfolios, this paper confirms the validity of the portfolio allocation system based on GA-rough set theory. Investors in IPO stocks can formulate more efficient investment strategies using our system. In this sense, the system developed in this paper contributes to sustained economic benefits to IPO stock investors and the efficiency of financial markets to achieve sustained economic growth. In addition, this paper reduces the issues of information asymmetry between institutional and individual investors using nonfinancial data that are publicly available to both individual and institutional investors in the IPO process. Accordingly, the information asymmetry problem between institutional and individual investors could be resolved if more public information is disclosed in the IPO policy making process. However, this study has potential limitations. The system developed in this paper is based on IPO stocks in Korean markets. Therefore, the empirical results are limited to Korean market IPO data. Based on the idea of our GA-rough set methodology, future research can be enriched by developing a new system that can be utilized for other portfolios containing various types of financial assets in the global market.


