Article

Toward Knowledge-Based Economy: Innovation and Transformational Leadership in Public Universities in Texas and Qatar

Division of Sustainable Development (DSD), College of Science and Engineering (CSE), Hamad Bin Khalifa University (HBKU), Qatar Foundation (QF), Education City, Doha 341110, Qatar
*
Author to whom correspondence should be addressed.
Sustainability 2019, 11(23), 6721; https://doi.org/10.3390/su11236721
Submission received: 6 October 2019 / Revised: 9 November 2019 / Accepted: 20 November 2019 / Published: 27 November 2019

Abstract

:
The essentiality of the universities’ roles in enhancing economies and transforming societies is a global mantra. However, when it comes to wealthy and oil-dependent states such as Texas in the United States and Qatar in the Middle East, the impact of universities on sustainable economic development is questionable. This article discusses the transformational efforts within engineering colleges at two public universities in Texas and in Qatar to support their states’ visions in moving toward innovative and knowledge-based economies. The study examined the innovation capacity building of both institutions through measuring the transformational leadership styles in engineering colleges and its impact on the faculty’s innovative production of technical articles, patents, and sustainable development-related courses. The cultural impact of the two contexts on the leader–follower relationship was addressed in the discussion using Hofstede’s cultural dimension framework. The results showed that leaders in both colleges possess a transformational leadership style, albeit lower than the norm. This study disclosed that, in the high-power distance contexts, the idealized image of the leader contributed positively toward higher satisfaction of the followers with their leaders and current governance systems, while acknowledgment and rewards were the sources of satisfaction in low-power distance societies. Followers in a low uncertainty avoidance, individualistic, and short-term-oriented context achieved higher technical production. Both public universities expressed the need for government involvement in supporting the culture of innovation.

1. Introduction

As counties are moving toward a knowledge-based economy (KBE), higher education institutions (HEIs) need to prepare individuals to create, use, and disseminate knowledge and support innovation and technology [1]. The competitive advantage of countries moving from resource-based to knowledge-based economies resides in the creativity of their people and their capacity to create and develop new knowledge and application of science [2]. Building a national innovation ecosystem (sometimes called a knowledge innovation ecosystem (KIE), representing the relationship between people, enterprises, and institutions, which guides the flow of technology and knowledge within a country (Lundvall 1992; Nelson1993 [2])) that can fulfil societal and economic needs, while facing current and future challenges is fundamental for the KBE. Infrastructure, human capital, and innovation capacity are the key pillars for building a KIE system [2], and they are all firmly linked to HEIs. Physical, digital, and institutional infrastructure can be found in HEI equipped labs, as well as research and incubation centers, while knowledgeable and well-trained workforces are produced by HEIs, representing the human capital pillar of the KIE [2]. The third pillar, which is the innovation capacity, including the business dynamics, the types of research outputs, and the technology transfer mechanics, is all a function of HEIs. Moreover, the decentralization of the innovation process and the outsourcing of knowledge within firms, through what is called open innovation (OI) [3], was a grand opportunity for universities to be involved as key players in advancing technology and accelerating the formation of KIEs.
Higher education institutions, which are the focus of this study, are criticized for being traditional and not respondent to the contemporary challenges facing societies. The traditional education system, in isolation from the wider system, offers knowledge that is specific to a limited set of variables [4]. Engineering schools are specifically criticized for not being sufficiently engaged with the external world, as well as having a limited internal focus on viable technical solutions [4]. Providing sustainable solutions to contemporary challenges goes beyond considering renewable energy resources; it also requires human behavioral change and efficient energy systems. In light of this observation, the World Federation of Engineering Organizations (WFEO) and the International Engineering Alliance (IEA) signed a memorandum of agreement to work on engineering accreditation [5]. A number of expectations for engineering students internationally resulted from this agreement. As per the IEA, engineering graduates are expected to have the ability to analyze and understand the interactions between environmental, economic, social, and cultural aspects of society, in addition to the impact of their profession when proposing a solution to complex problems [5]. Gaining a holistic understanding of the wider system will enable engineers to create innovative solutions to mixed-nature challenges and, in the longer term, achieve social and economic sustainable development (SD) goals.
Innovation is a non-linear and complex process, which makes interactions among individuals working in innovation-related institutions an important factor in building the innovation capacity of countries. This study examined the efforts toward innovation capacity building in engineering colleges and its impact on the faculty’s innovative production at two public universities, one in Qatar and one in Texas, following the method developed by Reference [6]. Both studies, the current one and Reference [6], focused on the relationship between leaders (represented by the deans) and followers (represented by the faculty members) for institutions in different contexts and governing systems (the previous study examined the same public university in Texas and its international branch campus (IBC) in Qatar). The extent of the transformational leadership style of the two deans in the engineering colleges was examined. Four departments under the two engineering colleges were chosen to measure the satisfaction of the followers with their deans and current systems in supporting the innovation agenda. Innovation outputs by the followers (faculty of engineering) were measured by the researchers through the following indicators: technical paper publications, patent acquisitions, and h-index. In addition, the introduction of innovation and SD-related courses within the chosen four engineering departments at the two universities was studied to measure each university’s effort and participation in the transformation to a KBE and/or achieving SD.
This article is organized as follows: Section 2 provides background on the role of leadership in transforming toward KBE, innovation classification, and open innovation, as well as the role of the government and industry in supporting the transformation toward KBE. In addition, this section discusses the role of engineering colleges in achieving SD, and it concludes with an overview of the innovation performances of Qatar and the United states (US) in the Global Innovation Index framework (GII) and its indicators, in addition to a brief introduction to Hofstede’s cultural dimensions framework. Section 3 describes the methodology, samples, and tools used in this study. Section 4 and Section 5 offer an analysis of the results. The article concludes by highlighting the findings, as well as reflecting on methodology limitations by offering possible resolutions for further research.

2. Theoretical Background

2.1. Transformational Leadership Traits

Transformational leadership (TL) is associated with the process of leaders motivating followers to perform beyond expectation, and encouraging followers to look beyond their self-interest to the interest of the group or organization [7]. Followers of transformational leaders are capable of developing their skills by using their own abilities in taking greater responsibilities and making decisions [8]. This leadership style plays an important role in stimulating intellectual thinking that encourages followers to challenge the status quo and think outside the box to attain higher goals effectively [9]. All these skills and abilities developed under the supervision of a transformational leader strengthen intellectual powers and build greater capacity to develop a culture that encourages followers toward more innovative behavior [10,11]. Transformational leadership bears a number of features represented in four main traits that enable leaders with this style to positively influence their followers. The first trait of TL is idealized influence (II), and it represents the leaders’ charisma, values, and moral standards which make them ideal role models for their followers [12]. The second trait is inspirational motivation (IM), which represents the leaders’ ability to challenge their followers with high standards, give a sense of confidence, and provide encouragement and meaning to meet goals that are higher than their expectations [13]. The third trait of TL is intellectual stimulation (IS), where the leaders encourage and motivate followers to come up with creative and novel solutions for problems through challenging old assumptions and stimulating new perspectives [13]. The fourth trait of TL is individualized consideration (IC), where leaders with high emotional intelligence take care of their followers’ specific needs, performance, and development [14]. Considering all the abovementioned characteristics of the TL style, transformational leaders exhibit the needed leadership style for fostering innovation at universities, and specifically in engineering colleges.

2.2. Innovation Classification

Innovation is defined as the ability to see a need and think creatively about how that need might be met in a better way [15]. Innovation, derived from the Latin word novus, or new, involves the introduction of new or altered processes, products, technologies, methods, and practices [16]. As the stock of knowledge is increasing, the drive for innovation becomes stronger, especially in HEIs which promote the active acquisition and dissemination of knowledge [17,18]. In his seminal work, Perri 6 identified innovation as the second step after invention [19]. According to Perri 6 and other scholars, invention is the discovery of new knowledge, while innovation is the application of this knowledge [19,20,21,22]. Innovation can be divided into product innovation, process innovation, and organizational innovation [19].
Product innovation is the introduction of new types of goods and services, while process innovation is the introduction of new ways of producing goods and services [20,21,23]. The third type of innovation, organizational innovation, is divided into internal innovation (the adoption of new organizational structure) and external innovation (the establishment of new relationships between organizations) [24,25]. Other classifications for innovation include incremental, radical [26], service, technical, and administrative [27].
The development and implementation of novel ideas in the context of HEIs represent new courses, research projects, teaching materials, and curricula [28]. Studying product and process innovation in HEIs is essential as the educational performance and quality of such institutions depend heavily on its product and process innovations being adaptive to local and global changes [29,30]. In the context of this article, we refer to innovation as the process via which individual faculty members and teams generate and implement creative ideas (products) in response to novel, complex, and ill-defined problems [31].

2.3. Open Innovation

Many industries realized that the internally oriented approach to research and development (R&D) is now obsolete, and external resources of ideas and knowledge are needed to remain competitive, which is the reason why open innovation was embraced [32]. Open innovation (OI) represents a paradigm which “assumes that firms can and should use external ideas, as well as internal ideas, and internal and external paths to market, as the firms look to advance their technology” [32]. The aim for OI is to find additional value and achieve higher gains by bringing industrial innovation and public R&D together, in which universities are one of the latter’s main representatives [33].
The model of OI is centered on the R&D process within firms, and it is divided into inbound and outbound. Inbound OI is aimed at improving the innovation performance of the firm through establishing and managing associated knowledge links with external organizations [34]. Outbound OI, on the other hand, is aimed at establishing links to exploit the knowledge, commercially. In different collaborative activities, universities proved to benefit firms’ innovative performance and outcomes, in addition to being a knowledge provider [35,36]. By utilizing the concept of OI, the role of universities and HEIs not only benefited firms’ innovative activities, but also played an essential role in building the National Innovation System (NIS) in a number of countries such as Japan, Taiwan, and South Korea, especially in the post-war era [37].
Open innovation helped industry penetration in leading industries such as software, electronics, biotech, and pharma, which made these collaborations increasingly popular in the past decades [32]. Organizations such as Systems, Applications, and Products (SAP) and Microsoft increased their innovation capacity through building decentralized research labs on university campuses in the US through the adaptation of the OI framework [38]. The successful applications of decentralized R&D through OI confirmed that the university–industry relationship is fundamental and not merely a generalized link between the two [39]. Key organizational resources, such as leadership, are essential contributors in this relationship, as the capabilities and leadership style can drive organizations’ destinies [40,41]. Hence, OI should be adopted by leaders of both academia and industry as a driving force for enhanced innovative activities that lead to economic development and competitiveness.

2.4. Role of Government, Industry, and Academia in KBE Transformation

All countries that succeeded in transforming to KBE went through reformations that included the participation of governments, industry, and academia [2]. The role of the government was and still is to enhance the needed ecosystem to build KBE through designing the enabling policies and legislations, funding programs and institutions, and providing the proper incentives. Industry’s role involves building and enhancing the R&D ecosystem through R&D divisions, supportive funding and expertise, and supporting prototypes designs. Academia, on the other hand, has the role of promoting technology and innovation, becoming innovation and research hubs, and educating and training the next generation of leaders and the workforce. Consequently, industry–government–academia partnerships are strong enabling factors in the success and advancement of innovative production.
In the US context, the involvement of industry in developing the HEI role in innovation during the 1980s included the Bayh–Dole Act legislation and the Triple Helix model. The 1980 Bayh–Dole Act created a uniform patent policy enabling small businesses and non-profit organizations (like universities) to retain titles of their innovation (for research under federal agency funding programs) [42]. The value created between actors in this act included that universities were expected to give licensing preferences to small business as a way to encourage collaboration and promote commercial utilization of inventions arising from federal funding. On the other hand, the government retains a non-exclusive license to practice the patent throughout the world (www.autm.net/advocacy-topics/government-issues/bayh-dole-act/). Triple Helix, on the other hand, facilitates effective collaborations between universities and industry/business, and between the private sector and government agencies through profit motives for research and innovation. This collaboration is governed by the scope and effectiveness of the intellectual property regime, in addition to the availability of financial support, as well as value created for all actors within the innovation system to succeed [43]. Strong linkages with the industry can lead to major developments in innovation systems, as was the case in the Western world during the post-war period and the emergence of sophisticated innovative systems in Massachusetts Institute of Technology (MIT), Cambridge, and Stanford [43]. In other countries, different enablers were used to serve the purpose of transforming to KBE. Countries in southeast Asia, such as Singapore, benefited from the well-established commerce relationships and strategic location in a technology-intensive ecosystem in information and communication technology (ICT). Qatar, in the Middle East, has well-established HR systems, as well as mature information system and business processes, which are being developed to support the transition to KBE.

2.5. Higher Education, Sustainable Development, and Engineering

Higher education is known to be an essential accelerating vehicle for transforming the economy. In most countries that had reforms and policy generation to promote high and sustainable economic growth, investing in education to produce a knowledgeable and skilled workforce was paramount [44]. Having an effective education system is one of the key factors in achieving a stable macroeconomic and financial environment to accomplish sustained growth [45].
In the Gulf Cooperation Council (GCC), part of achieving SD is to diversify the economy and reduce the dependence on oil revenues, which is currently the main income resource for countries, representing 60% of total revenues [46]. National strategies in GCC countries, such as Vision 2020 in Oman, Vision 2021 in the United Arab Emirates (UAE), and Qatar National Vision (QNV) 2030, prioritize the importance of economic diversification to achieve SD [44].
The policies being implemented in these countries are drawn from international experience, focusing on boosting human capital development and providing highly skilled labor to support the development of high-productivity industries. These policies include investments in science, technology, and vocational education. In addition, they require higher expenditures on R&D, focused encouragement of entrepreneurship and innovation initiatives, and strengthening ICT infrastructure [44]. As science and technology represent the base for these progressions, engineering colleges need to react to these needs. An example of universities’ involvement in the innovative and knowledge-based economy (IKBE) through new university establishment and/or existing university reformation includes the Singapore University of Technology and Design (SUTD) and its partnership with MIT [1]

2.6. Engineering Education for Sustainable Development

Realizing the increasingly important role of education institutions, the United Nations (UN) named the decade of 2005–2014 the “UN Decade of Education for Sustainable Development” (DESD). Within the same period, the concept of Engineering Education for Sustainable Development (EESD) emerged, which was defined by the World Federation of Engineering Organizations (WFEO) as “the education that encourages engineers to play an important role in planning and building projects that preserve natural resources, are cost-efficient, and support human and natural environments” [47].
The WFEO Engineering 2030 Plan is focused on developing engineering capacity for a sustainable world through partnerships with government, academia, and industry. It recognizes the essential role that engineering plays in SD and achieving sustainable development goals (SDGs). WEFO called for integrating tertiary-level engineering education into strategies for achieving SDGs since a high number of goals are heavily dependent on science and engineering designs [48]. Supporting education and research for professional development through building strong local engineering education programs is necessary for long-term capacity building for the engineering workforce [49].
In a study of the current status of engineering education in Qatar and the aspirations for achieving 2030 goals, Abdulwahed and Hasna compared Qatar’s current engineering skills with the international engineering skills needed in innovation-leading countries such as US, United Kingdom (UK), Australia, and Malaysia [1]. The authors identified 22 main items, which included leadership competency (LsC), innovation competency (InC), ethics, and responsibility. The study resulted in a national road map for enabling a higher level of contribution of engineering and technology in driving innovation and KBE in Qatar. One of the outcomes of the survey conducted for this study was the need to focus more on innovation and knowledge-based competencies in engineering education in Qatar to meet the emerging needs of the country and accomplish its 2030 goals. The 300 participants in the survey represented different stakeholders of students, engineering faculty members, and industry professionals, and identified the top skills of ICT, leadership, innovation, research, problem solving, and communications.
In the United States, and other Western countries, the problem of low engagement in science, technology, engineering, and mathematics remains prevalent [50]. The problem started at the low education level in public schools, and its ramifications included a high number of dropouts in related majors in universities, poor payments for Science, Technology, Engineering, and Mathematics (STEM)-related professions, and failure to respond to the fast-changing demands in the field’s market caused by globalization [50,51,52,53]. A study conducted in 1993 on the weakness of engineering graduates as reported by industry leaders resulted in a number or outcomes, including a lack of design capabilities, lack of creativity and understanding of the manufacturing process, a narrow view of other disciplines, and the wide technical arrogance of engineers [50,54]. Since then, a number of reforms were carried out by multiple organizations to influence engineering education to be more inclusive and address social and environmental concerns, integrate research and education, and prioritize innovation in teaching and learning [50]. The drivers of this process were industrial advisory boards in universities and engineering professional societies (e.g., American Society for Engineering Education (ASEE), Institute of Electrical and Electronic Engineers (IEEE)), private foundations (e.g., National Collegiate Inventors and Innovators Alliance (NCIIA)), the Accreditation Board for Engineering and Technology (ABET), and National Science Foundation (NSF) [50].

2.7. Oil-Dependant States

Texas and Qatar are two oil-rich states whose developments were and continue to be premised on fossil-fuel extraction, while aiming toward transforming their economies from resource-based to KBE. As the national economic growth of the two countries was not dependent on scientific and technological factors but on natural resources, this could generate less pressure on their national universities to focus on innovation as part of their mission (in addition to teaching) [37].

2.7.1. The Case of Texas

Despite the fact that the state of Texas alone accounts for more than 35% of the overall oil production in the US, its richness in oil reserves contributes heavily to the advancement of higher education. In 1924, oil production in Texas reached 33 million barrels, recording a peak production for the oil industry and the diminishing of agriculture (www.talonlpe.com). This oil boom impacted the development of the education system and was evident in the expansion of universities due to the extensive funding support, endowments, and federal land donations (https://texasalmanac.com). In addition, vast strides were made by Texas legislations to establish higher learning institutions during the 1940s (https://tshaonline.org).

2.7.2. The Case of Qatar

Qatar, on the other hand, is another resource-rich state that possesses the second largest natural gas reserves after Russia, and it is considered the largest liquefied natural gas (LNG) exporter with an annual production of 77 million tons of natural gas (equivalent to 4.8 million barrels of oil) (https://thepeninsulaqatar.com). Just as in Texas, this production boom led to a heavy contribution of resources to the education sector and was evident in the national development plans. In 2008, Qatar’s national vision QNV 2030 was released, indicating a new era for the country in which diversifying the sources of the economy and moving toward KBE were among top priorities. The Qatar National Development Strategy’s (QNDS 2011–2016) first goal aimed at building an R&D eco-system and human capacity through improving the infrastructure, as well as research and development (R&D), and developing higher-quality education and a skilled workforce [55]. Today, higher education is the biggest contributor to R&D development in the country [56]; however, the country is facing vast challenges attributed to its classification as a small state (countries with population below five million as per the UN’s definition). This classification requires higher expenditures and dependence on expatriate teachers and administrators, foreign exchange programs, scholarships, curricula, and textbook development [57,58].

2.8. The United States and Qatar in the Global Innovation Index (GII)

The Global Innovation Index (GII) is a global framework that measures the innovation performance for countries through the efficiency ratio, which is calculated using a matrix of input and outputs indicators. The GII annual report, developed by Cornell University, a world leading graduate business school Institut Européen d’Administration des Affaires (INSEAD), and the World Intellectual Property Organization (WIPO), covers the political environment, education, infrastructure, and business sophistication of 133 countries around the world (www.globalinnovationindex.org).
The US is considered a leading country in innovation and it was among the top five (sometimes 10) countries in GII reports for the last 10 years (exception in year 2010 it came in the 11th place). The R&D expenditure in the US is equivalent to 2.78% of its gross domestic product (GDP). The highest innovative productivity growth was recorded in 2000. Following that year, it started to decline [59]. The US was one of the countries that experienced a decline in the gross domestic expenditure on R&D (GERD) in 2009, but recovered by the year 2016 [59]. Even though a decline was recorded in human capital, research (which was between 10th and 15th, and then became 21st) and infrastructure (which was between 10th and 15th, and then became 24th) indicators, US remained among the top contributors in terms of GERD, patent applications, scientific publications, quality of university, quality of scientific publications, and excellence of start-ups. MIT, Stanford, and Harvard University were the top three universities in the US, which enabled the US to preserve its position in innovation quality and surpass the United Kingdom (UK) in the quality of scientific publications. Innovation clusters (geographic concentrations of firms, suppliers, producers of related products and services, and specialized institutions in a particular field), such as Silicon Valley, have the largest impact on achieving high ranking in both input and output innovation [60,61,62].
Qatar, on the other hand, has a current position of 51st among the 133 countries in GII [59]. It is classified as performing under expectation (for the level of development) since its innovative output is low compared to the outputs of the other high-income group members to which Qatar belongs. Knowledge and technology outputs for Qatar such as patents by origin, scientific and technical articles, and h-index were low and indicated a weakness. Qatar currently spends 0.5% of its GDP on research from an allocated 2.8% of GDP (declared in 2008 by Amiri Decree No. 24). This allocated GDP percentage is close to R&D expenditure in the USA (2.78% of GDP) and Finland (2.75% of GDP), which are leading countries in innovation. It is higher than the allocated R&D funding in two counties among the top five innovative countries in the world which are the UK and Singapore (1.66% of GDP and 2.16% of GDP, respectively), and higher than the average R&D intensity of Organization for Economic Co-operation and Development (OECD) countries, which was equivalent to 2.37% in 2017 (www.oecd.org).
The statistics in GII for the past 10 years (2009 to 2019) show that Qatar’s strong ICT infrastructure reflected positively on the output indicators such as ICT business model creation and ICT organization models. This strong infrastructure in ICT placed Qatar within the top 10 countries with the highest creative output related to ICT (except in 2018, where Qatar was ranked 27th and 23rd for the two indicators) [59]. Input indicators related to human capital and research show weaknesses in expenditure on education, tertiary enrolment, full-time researchers, and gross expenditure on R&D, which was reflected clearly by the low knowledge creation indicators such as the production of patents and scientific and technical articles, as well as the h-index.
Despite its overall high rank, the US still experiences some structural weaknesses in education and tertiary education (ranked among the top 50), especially in science and engineering graduates (ranked among the top 100). This measure reflects a tremendous difference between its overall rank (among the top 10) and its classification as an innovation leader. On the other hand, Qatar shares similar weaknesses in education (ranked among the top 100), but possesses higher ranks in tertiary education, especially in science and engineering graduates (among top 15). GII reports and statistics show that US innovation outputs depend heavily on market sophistication, in which it is the leading country within its economic group and the world. This high performance not only helps increasing creative outputs, but also enhances the industry–university collaboration, another strength for the US, which, as a result, increases patents, h-index, and the quality of technical articles. As for Qatar, the infrastructure and the number of graduates in science and engineering can be developed to improve the outputs and move Qatar from performing below expectation to becoming innovation-efficient. The statistics show that both countries have enabling factors for big improvement within HEIs and their innovative outputs that need to be capitalized.

2.9. Hofstede’s Cultural Dimension Framework

Hofstede’s cultural dimensions were the most used and cited paradigm in cross-cultural psychology, intercultural communication, and international management studies for the last three decades [63]. Hofstede’s extensive empirical study that included collecting data from large multinational corporations in 40 different counties resulted in the identification of five work-related values, which differ across countries. The five dimensions included power distance, uncertainty avoidance, individualism (versus collectivism), and masculinity (versus femininity), in addition to Confucian work dynamics, which he later renamed long-term orientation (LTO) [64,65,66].
The power distance (PD) dimension represents “the extent to which the less powerful members of institutions and organizations within a country expect and accept that power is distributed unequally” [67]. It is the emotional distance that separates subordinates from their bosses [68]. The second dimension is uncertainty avoidance (UA), which represents the extent to which individuals and societies feel threatened by ambiguity and unknown situations [63]. High-UA societies are societies which are more stressed, consider difference as a threat, and need more rules and formalizations to avoid ambiguity [65,66]. Low-UA societies, on the other hand, are less stressed, embrace differences with curiosity, and have more tolerance toward different people and fewer rules, which is why innovation is more likely to happen at a faster paste [63,65,66]. The fourth dimension, which is masculinity versus femininity in societies, represents the gender roles in organizations and whether women can get equitable treatment and status to their men counterparts [63,65,66]. The fifth dimension was introduced seven years later after Hofstede’s first study to add a time dimension to the framework. LTO represents the “fostering of virtues oriented toward future rewards, perseverance, and thrift” [65]. Societies with high LTO tend to be more pragmatic, persistent in pursuing their goals, humble, and they need no self-assertion; thus, they are able to delay immediate gratification for their desires for long-term gains. On the other hand, societies with low LTO are more connected to the past, traditions, and national pride. They prefer immediate gratification for their desires, and they seek positive affirmation from others about themselves [65,67]. As organizations depend of people’s performance, understanding the cultural orientation is essential for comprehending its impact on individuals’ performances and beliefs about leadership [67].

3. Methodology

The explanatory sequential mixed method was used for this study to understand and explain the relationships between variables, which was a limitation of previous studies investigating the impact of TL on followers’ behaviors through correlations alone [69].
Quantitative data were collected through a survey at the initial stage, followed by a set of semi-structured interview questions with engineering faculties at a later stage. The semi-structured interviews were designed to start with a number of prepared questions that allowed the discussion to develop naturally in a flexible manner while establishing a natural rapport with the interviewee [70].
The independent and dependent variables were leadership styles and innovative indicators, respectively.

3.1. Research Instruments

The main instrument used in this study to determine leadership style was the Multifactor Leadership Questionnaire (MLQ) (Form 5X short). Participants were asked to evaluate their leaders by assessing the degree to which they observed their leaders engaging in specific behaviors. The behaviors included in the survey were the nine components of the three leadership styles of transformational, transactional, and/or passive/avoidant leadership [71,72]. Other scales included in the survey, in addition to demographics, were followership and system. The main form of the survey was electronic, and the questionnaire was administered using Survey Monkey (www.surveymonkey.com) with a reminder feature to ensure a follow-up process for collecting data.

3.2. Research Procedure

A survey of 55 items divided into three parts of MLQ Form 5X (45 items), followership (five items), and system (five items), in addition to demographics, was sent to the faculty members at both universities.
MLQ is an important tool to assess leadership styles since variation in leadership styles affects followers’ satisfaction, team effectiveness, and organizational success [73]. Faculty members were asked to assess their dean’s engagement in specific behaviors to understand his/her leadership style through the components of transformational leadership (five components), transactional leadership (two components), and/or passive/avoidant leadership (two components) [71,72]. Sample items from MLQ included the following: “my leader talks optimistically about the future,” “my leader spends time teaching and coaching,” and “my leader avoids making decisions.”
In the subsequent scale, four items [74] were used to evaluate the intrinsic motivation of followers. Sample items of intrinsic motivation scale included the following: “I enjoy finding solutions to complex problems,” “I enjoy coming up with new ideas for research, papers, and classes,” and “I enjoy engaging in analytical thinking.”
The system scale focused on the innovation drive for the current system and was assessed using five items inspired by the Higher Education Innovate self-assessment tool (HEinnovate) (https://heinnovate.eu). Sample items of the innovation-driven system scale included the following: “my college has a culture that induces more innovation,” “my college invests in staff development by providing diverse learning opportunities to support its innovation agenda,” and “incentives and rewards given to faculty/staff/students for their innovative initiatives are satisfying.”
The survey constructs were measured using a five-point Likert scale ranging from 0 = not at all to 4 = frequently if not always, except for items reflecting the type of system and the main motivation driver for innovation. The type of system item had four choices (a—leadership shapes the system, b—system guides the leader, c—system constrains the leader, and d—participatory process), and the motivation driver of innovation had three options (a—internal drive, b—system mechanism, and c—leadership influence).
The innovation indicators used in the study to represent the engineering faculty innovative outputs were published technical articles (including journals, conference papers, books, book chapters, and manuals), patents, and h-index. In addition, in this study, the number of undergraduate courses offered every academic year (since 2008) related to SD and/or innovation was added as another innovation indicator. The key words of sustainable development, sustainability, innovation, creativity, and environment were used to identify these courses in the student catalog. As stated in the researchers’ previous article, the selection of innovation indicators to measure innovative outputs was based on their importance to the R&D and HEI sectors, and their appearance in the GII. The data were collected from online resources that included the institutions’ websites, Google Scholar personal profiles, and research engines, such as Scopus. For patents, data were collected using JUSTIA, an American legal website specialized in legal information, in addition to the Google Scholar personal page for faculty members, in which patents were included according to their publication dates.
Face-to-face interviews with semi-structured questions were used for stage two of the qualitative data, which were designed based on the results obtained during the quantitative data collection phase of the study. Sample questions included in this phase included the following: “What do you think of the current process towards more innovative work at your college?”, “How is it done and who are the main players?” “How did the leadership and governance facilitate, and/or hinder your capacity of creativity and innovation?”, and “What do you suggest to make faculty contribute toward more innovative outputs?”.

3.3. Sample

The sample included four departments in Engineering Colleges at two public universities, one in Qatar referred to as PQA, and the other in Texas in the US referred to as PUS (PUS was referred to as MC and its data were partially published in Reference [9]). PQA is the first national institution of higher education in Qatar. It was established in 1977, and reported to the ruler of the country, His Highness the Emir until 2003. The university was fully funded and supported by the government, which is why it was subjected to the policies and procedures by the government [75]. Upon establishment, PQA was teaching-focused with very modest research output [75]. The first governing board of the university was the University Consultative Board of Regents (UCBR), established one year after the university was founded. It consisted of eight external international figures and university presidents, two representatives from the Ministry of Education, and two experts in medicine and public policy. The governing board, a representation of an advisory team to the Emir, was responsible for developing procedures and bylaws all of which needed to be directly approved by the Emir. After 2003, the Board of Regents (BOR) was established by an Emiri decree with the purpose of establishing PQA as an independent body governed by the BOR. Senior administrators continued to be appointed by the Emir, but such appointment now required BOR approval. The university continued its initial mission of being teaching-focused, but with higher concentration on research. The dean of the college of engineering considered for representing leadership for this study was appointed in 2016, resulting in one term of service until the time of this study.
PUS is a public land grant university in the US. Admission to the university was limited to white male students only until 1963 and 1964 when female students and African Americans were admitted. As PUS is a state university, one-third of the university’s funding comes from the students’ tuition, while the other two-thirds come from public and private partnerships. The BOR is appointed by the state’s governor and is responsible for setting the vision, the university’s priorities, and the means for achieving those priorities, in addition to the accountability process (strategic plan 2016–2021). A systematic review of the set goals against achieved goals is the BOR’s ongoing work. PQA and PUS share the fact that they were the first public institutions of higher education in their respective states, except for the fact that PUS is one hundred years older and its engineering college was founded in the same year of the university’s establishment, while, in PQA, the engineering college was founded three years after the university’s establishment. The dean of college of engineering considered to represent leadership for this study was appointed in 2012, resulting in two terms of service until the time of this study.

4. Results

4.1. Demographics

The survey was sent to 184 faculty members in PUS and 28 responses were received, in which 19 were complete, and nine were incomplete and discarded. For PQA, the survey was sent to 59 faculty members and 24 responses were received, in which 20 were complete, and four were incomplete and discarded from the analysis. The response rates (RRs) for both universities were 15.2% and 40.7%, respectively. Both PQA and PUS did not achieve the targeted response number needed as calculated per Equation (1), where Z is the confidence level, P is the percentage value, e is the margin of error, and P is the population size (Table 1). Even at the 0.9 confidence level and 10% margin of error, which was the lowest among the calculated ranges (Table 1), our sample was lower than this number, which was a limitation that needed to be considered when analyzing the data. However, a relatively low response rate in studies targeting management and/or organizational representatives was expected [76]. In any case, the sample was not affected by the low RR, and it was found to be representative of the population and valid (see Section 4.2 for reliability test), which were essential criteria for analysis [76,77].
Z 2 .   P ( 1 P ) e 2 1 + [ Z 2 P ( 1 P ) e 2 N ] .
The sample considered for the analysis consisted of 39 participants, with 20 participants from PQA and 19 participants from PUS. Overall, only four female faculty members participated (two from each university). This ratio was expected, since engineering colleges tend to be dominated by male faculty. The age groups to which the participants belonged were dissimilar at both institutions. The largest age group at PUS was 55 years and older, while the largest age group at PQA was 36–45 years. This age differential indicated different career stages for faculty members at both universities, which might result in diverse outputs by the two groups. Most of the faculty at both universities had more than six years of experience in their corresponding institutions. Half of the sample at both institutions had managerial experience in academia, as program chairs and/or associate deans. This was a supporting factor for participants understanding institutional leadership roles and responsibilities when assessing their own leaders. The representation of faculty with industrial experience was high, close to 90% and 70% for PUS and PQA, respectively, which indicated strong relationships and communication ties with the industry, and both were facilitating factors for partnerships and projects collaborations [78]. Demographics in percentage form for both institutions can be seen in Figure 1.
Fifteen faculty members at each university were contacted in stage two for qualitative data collection. Eleven faculty members from PUS and five from PQA agreed to participate. Overall, faster responses and more participation were recorded in PUS, which indicated more transparency and cooperation.

4.2. MLQ Descriptive Statistic
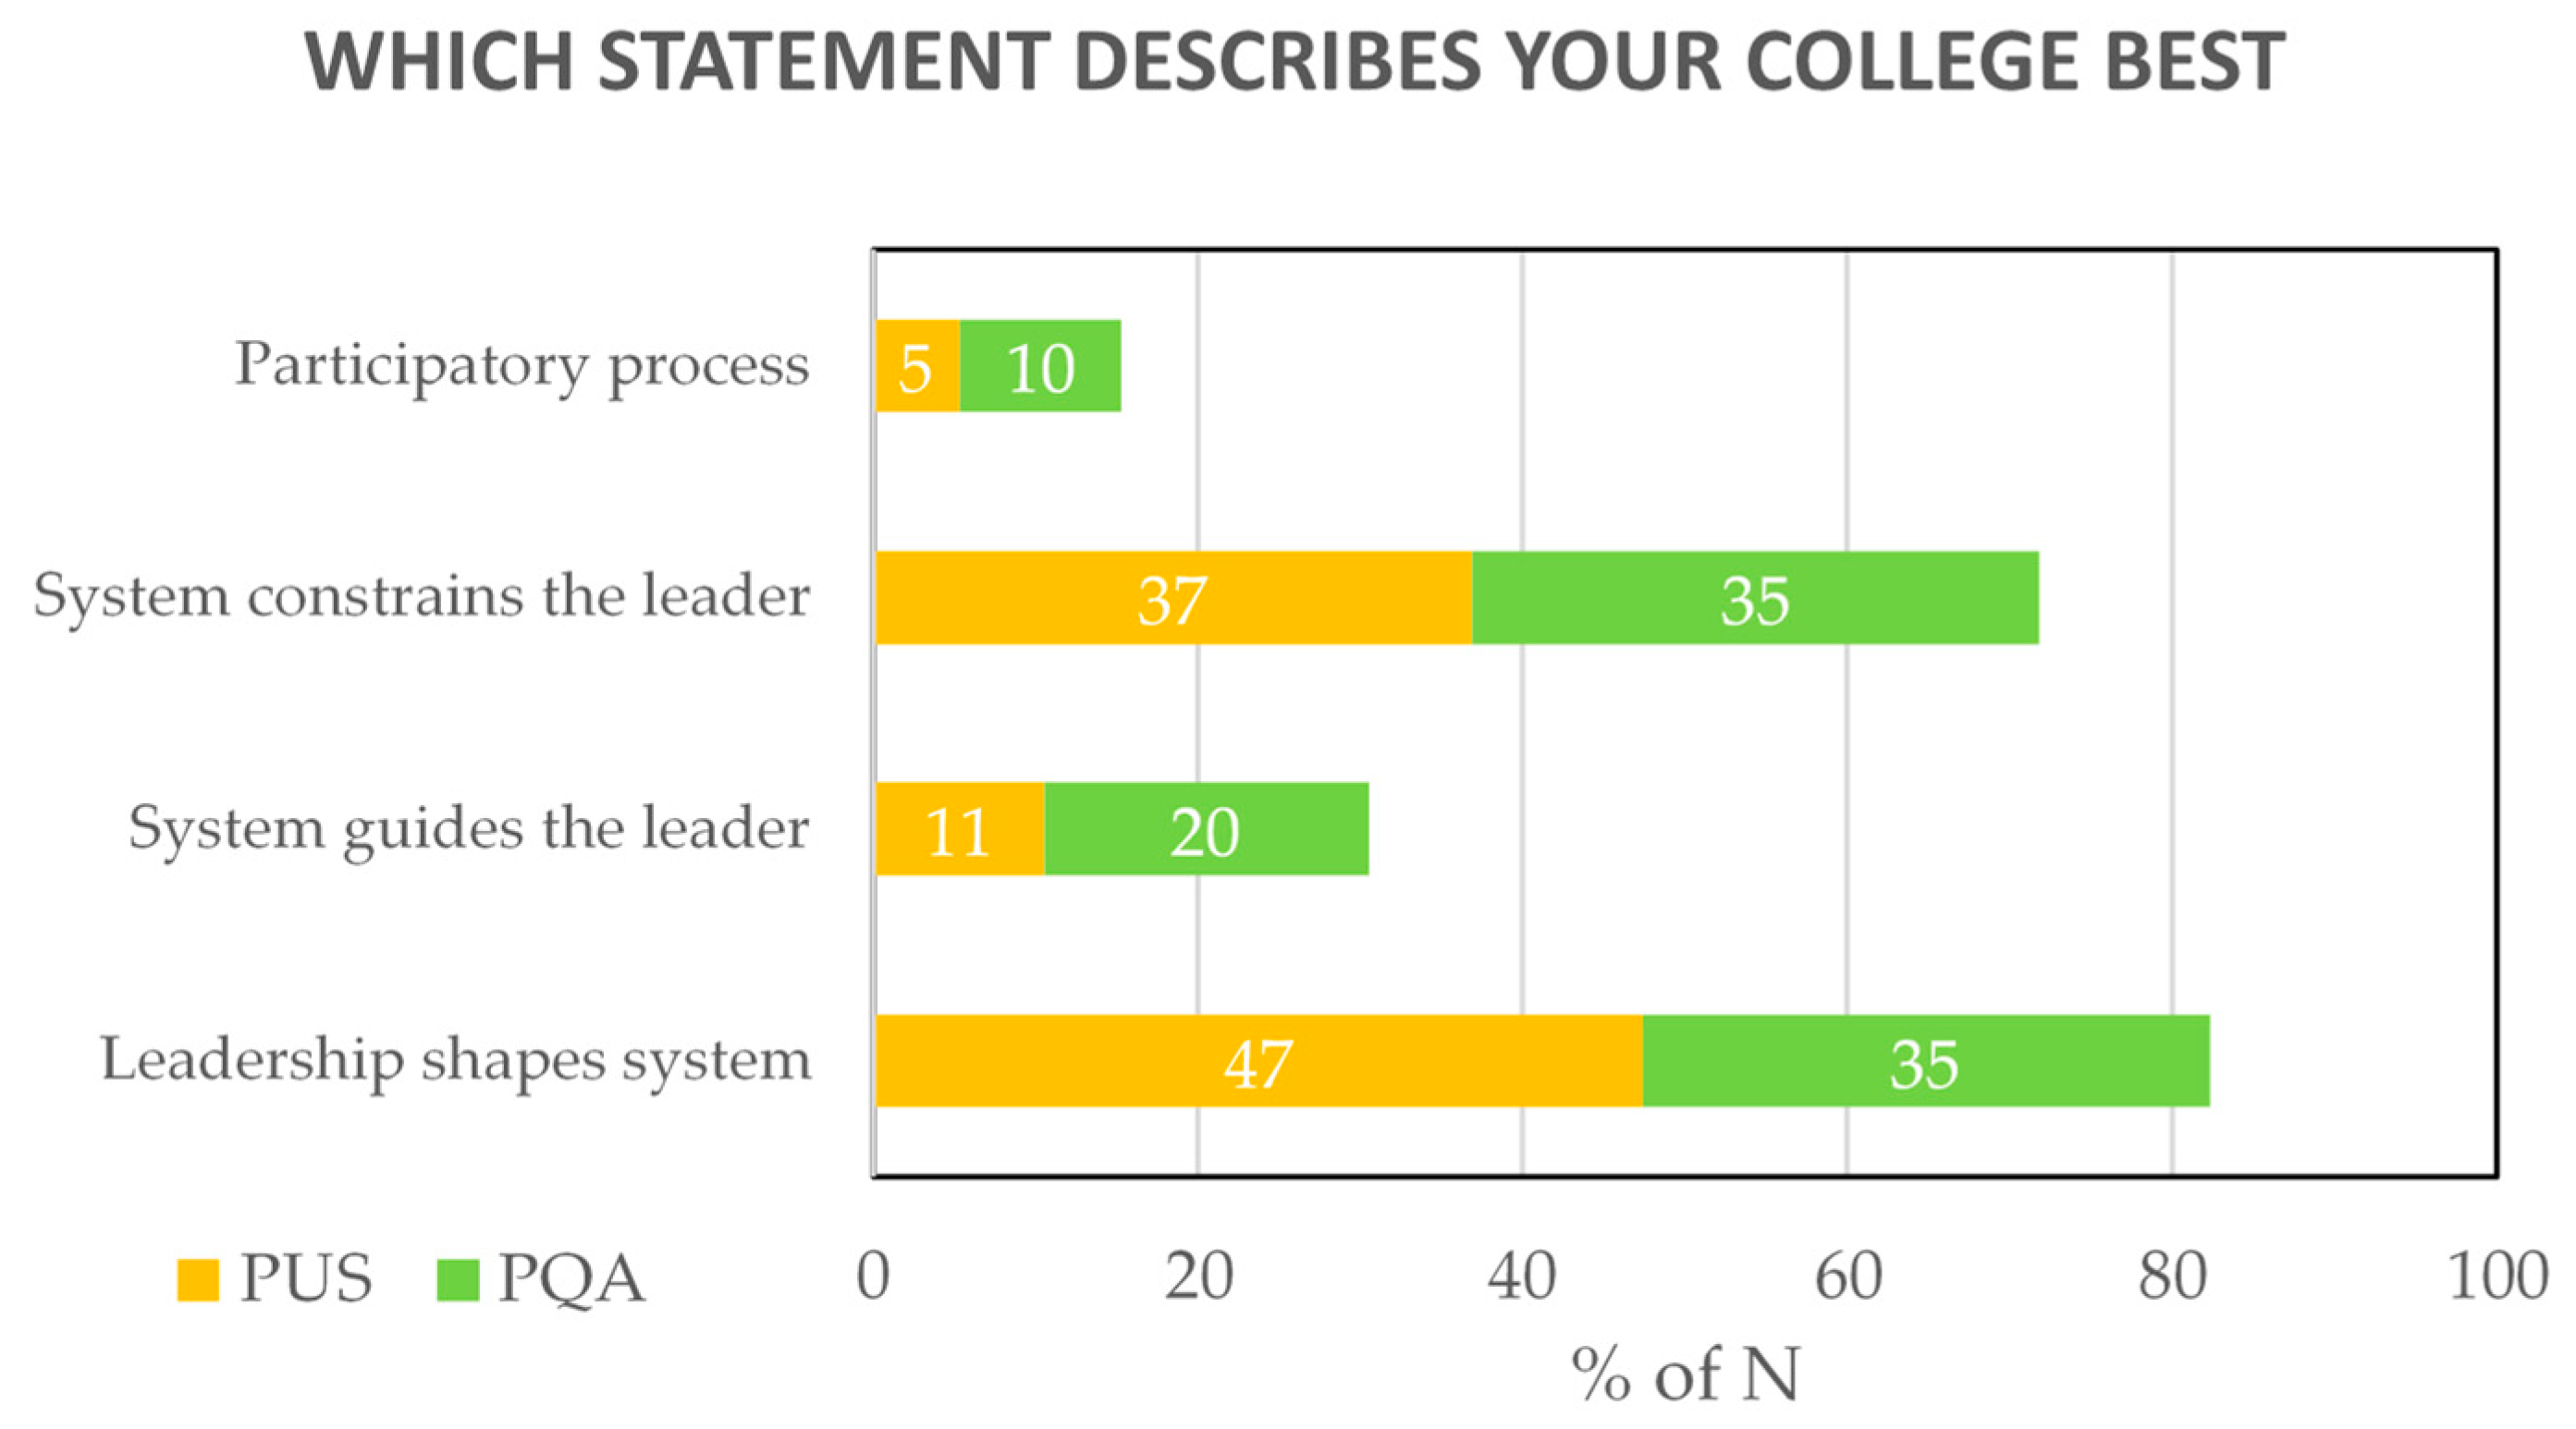
Cronbach alpha was calculated for all items in the MLQ, and it gave high reliability results of 0.898 for the combined sample, and 0.918 and 0.878 for PQA and PUS, respectively. As MLQ is multidimensional, Cronbach alpha was calculated for individual constructs within the MLQ [79,80], which included five Transformational Leadership components (idealized influence attribute II(A), idealized influence behavior II(B), inspirational motivation (IM), intellectual stimulation (IS), and individualized consideration (IC)), two Transactional Leadership components (contingent reward (CR), and management by exception active MBE (A)), two Passive Leadership components (management by exception passive MBE (P), and laissez-faire (LF)), and three components for Outcomes of Leadership (extra effort (EE), effectiveness (EF), and satisfaction (SAT)). All five transformational leadership constructs in addition to CR from transactional leadership resulted in α above 0.7, passed the reliability test, and were considered for the analysis, while MBE(A) from transactional leadership and both MBE(P) and LF constructs from passive leadership failed the reliability test, giving results below 0.7, and they were excluded from the analysis (Table 2 and Table 3).
The percentiles for leadership traits and outcomes were calculated for PQA and PUS (Table 4a,b). We compared our sample to the norm sample provided by References [71,72] at the 60th percentile (Table 5). The norm sample was taken from the US and had a sample size of 12,118 raters [71,72]. We chose this sample as it had similar raters’ conditions to our sample, being at a lower level. This meant that leaders were rated by their employees, and not by peer leaders or higher-level leaders in the institutions’ hierarchies. All leadership traits for our sample were lower than the norm sample, indicating lower transformational skills and, as a result, lower leadership outcomes, since TL is strongly associated with followers’ satisfaction and empowerment by leaders with a high TL style [51,81].
Distances from the norm sample were calculated for PQA and PUS (Table 6). PUS showed greater distance from the norm sample than PQA, indicating the lowest TL styles among the three samples.

4.3. System

The governance mechanism at the current systems in both institutions was assessed by a four-choice item. The item stated that “the following statement describes my engineering college the best” and provided four options including the following: “the leadership shapes the system,” “the system guides the leader,” “the system constrains the leader,” and “it is a participatory process.” These statements represented whether the current systems were hierarchal and controlled by the leader, rigid and supported the leaders, rigid but restrained the leaders, or a flat system where contribution was equal from all players. A tie was recorded for the top two options for PQA with 35% choosing leadership shaped the system and 35% choosing system constrained the leader (Figure 2). These contradicting choices were similar to the results for PUS with 47% of PUS faculty choosing leadership shaped the system, followed by 37% believing that the system constrained the leader. These results were unexpected because, while the first choice gave high power to the leader, the second choice limited that power. Despite the differences in the exact percentages, both institutions gave relatively similar order for highest to lowest choices by participants. This finding shows and supports the view that large state universities are similar in governance mechanisms as perceived by their employees.
The second item in the system section asked the participants about the existence of culture for innovation within the engineering colleges in both institutions. PQA exceeded PUS with more than 60% of their faculty indicating that the college “often” has a culture to induce innovation, while PUS had only 26% indicating the same (Figure 3). The majority of PUS (more than two-thirds) participants chose rarely and sometimes, indicating lower satisfaction with the existence of such culture. The third item asked about the availability and access to diverse learning opportunities by staff to induce more innovation. While 50% of PQA participants demonstrated “often”, a similar percentage indicated “rarely” in PUS. These percentages represented satisfaction at PQA and dissatisfaction at PUS with the learning opportunities available at these institutions to support achieving more innovation. The fourth item asked about the incentives and rewards provided to faculty to produce more innovative products, and the results were higher at PQA than PUS, indicating lower satisfaction at the latter institution. The recorded increase in “sometimes” indicated a conditional satisfaction by PUS faculty, which the interview outcomes later clarified in terms of reward satisfaction with published papers and dissatisfaction with other forms of innovative output (e.g., projects) (as the first was more acknowledged than the latter). The last item in this scale asked a general question about the overall satisfaction of participants with the current system in a percentage range. From the previous items’ results, it was expected that the satisfaction levels would be lower in PUS, and this item confirmed that expectation. However, surprising results were recorded in PQA, with more participants indicating higher satisfaction with culture, learning opportunities, and incentives and rewards, but when asked about the overall satisfaction, the numbers of participants were divided almost equally between the three ranges of satisfaction, which was not aligned with the previous results in items 2–4.

4.4. Followership

In fields demanding deep cognitive engagement and analytical thinking, self-drive is expected to be high for individuals involved in these domains [82]. The first item in the followership scale measured the main innovation driver for faculty members. More than 80% of the PUS faculty selected internal motivation as their main driver for innovation, showing a strong self-drive, while, for PQA, internal drive accounted for 45%, leaving the remaining 55% for external drivers such as system and leadership (Figure 4). System drive for PQA faculty followed internal drive closely with 40% (which was a one-participant difference) indicating that the system’s mechanisms, such as the required goals, targets, and promotions, had a high impact on PQA’s faculty motivation levels. Both institutions’ faculties believed in leadership’s impact on innovation with a minimum, yet considerable number of participants choosing leadership (Figure 4). These results supported the findings of item 1 in the system (Figure 5), which showed that a considerable amount of power was given to leadership at PUS and PQA, followed by system power, especially in PQA since it could constrain (35%) and/or guide the leadership (20%), with both indicating that the power position by the system affected the faculty’s motivation levels.
Items 2–5 in the followership scale [74] showed clearly that PUS faculty had high intrinsic motivation levels, with 90% of participants scoring at the highest end and no scores recorded in the lower end of the scale (Figure 5). On the other hand, PQA had 50% or less of their faculty scoring at the high end and 20–35% participants on the lower end of the scale for items evaluating enjoyment in solving complex problems, creating innovative ideas, and engaging in analytical thinking, indicating lower intrinsic motivation. Item 5 was a direct question about the overall intrinsic motivation level for the faculty, and it was used to confirm the results obtained in the previous items (2–4). PUS result for item 5 emphasized the results for items 2–4 within the same scale, as 94% indicated strong and the remaining 6% indicated neutral (Figure 6), in which the latter could be a corresponding percentage representing the 6–11% of participants choosing sometimes in items 2–4 (Figure 5). On the other hand, PQA had 100% of its faculty choosing strong when asked directly about their intrinsic motivation (Figure 6), which was not aligned with the results obtained from items 2–4, which was also meant to measure intrinsic motivation but indirectly. Some participants were expected to choose neutral, or even weak, as 20–35% rarely (or sometimes) enjoyed coming up with new ideas to complex problems and engaging in analytical thinking, which is the core of engineering work.

4.5. Correlation between Leadership, System, and Followership

Pearson (two-tailed) correlation in Statistical Package of Social Science (SPSS) (IBM Corporation, Armonk, NY, USA) was used to identify the significant relationships between TL, leadership outcomes, aspects of system, and followership. The Pearson coefficient showed high correlation values ranging from 0.606–0.938 with significant levels of p < 0.01. All five aspects of TLs (II (A), II (B), IM, IS, IC), in addition to the CR from transactional leadership, correlated positively with the leadership outcomes of EE, EF, and SAT for PQA and PUS (Table 7).
IC and II(B) from TL showed the highest correlation with the three leadership outcomes of followers’ perspectives on leaders’ extra effort and effectiveness, and their satisfaction with the leader with values ranging from 0.802 to 0.848 for PUS. For PQA, three leadership traits seemed to affect the same leadership output according to faculty members’ perspectives, which were II(A) and IM from TL, and CR from transactional leadership, with values range between 0.863 and 0.938 (Table 7).
Items 2–4, in the innovation driven system, correlated positively with all five aspects of TL and CR at significance levels of p < 0.01 and p < 0.05 for PUS (with the exception of item 2 which did not correlate with IC). The highest correlation with culture (item 2) and diverse learning (item 3) was achieved by II(B) with correlation values of 0.822 and 0.738, respectively. Incentives and rewards (item 4) correlated highly with II(A) with a value of 0.717. No correlation was found between system satisfaction (item 5) and leadership aspects, which confirmed the unexpected results in Section 4.3 for the low overall satisfaction by PQA faculty members with the overall system (indicating misalignment with previous results of high satisfaction with culture, learning opportunities, and incentives) (Table 8).
For PUS, items 2–4 correlated positively with all five aspects of TL and CR, (except for item 2 which did not correlate with IM). The leadership aspect that achieved the highest correlation with culture was II(A) (0.801), while CR showed the highest correlation with diverse learning (0.604), incentives and rewards (0.814), and system satisfaction (0.835). These results represented more evidence for the importance of a reward system and specific needs consideration to PUS faculty members. None of the leadership aspects correlated with intrinsic motivation items for PQA or PUS, indicating high independency of this scale (Table 9).
Combining results from the three sections showed that the two dominating leadership aspects for the PQA faculty satisfaction with leader and system were II(A) and II(B), while they were CR and IC for the PUS faculty since they achieved highest correlation values (Table 10)

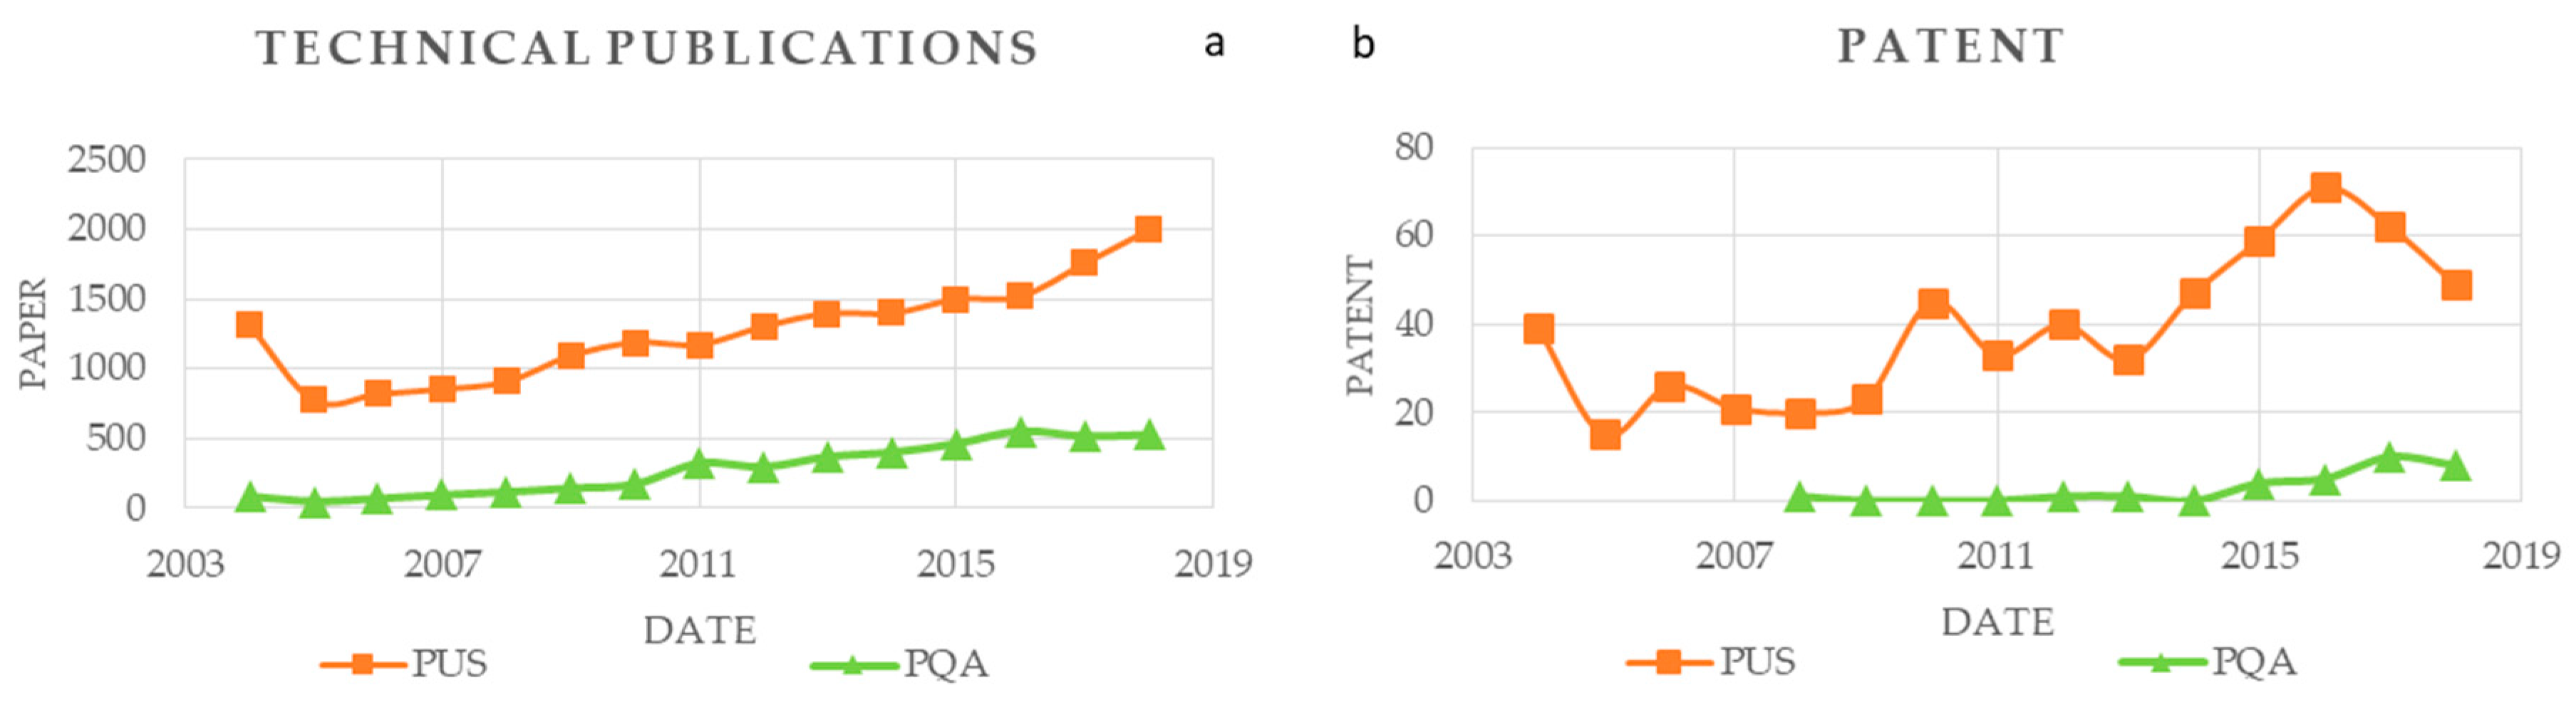
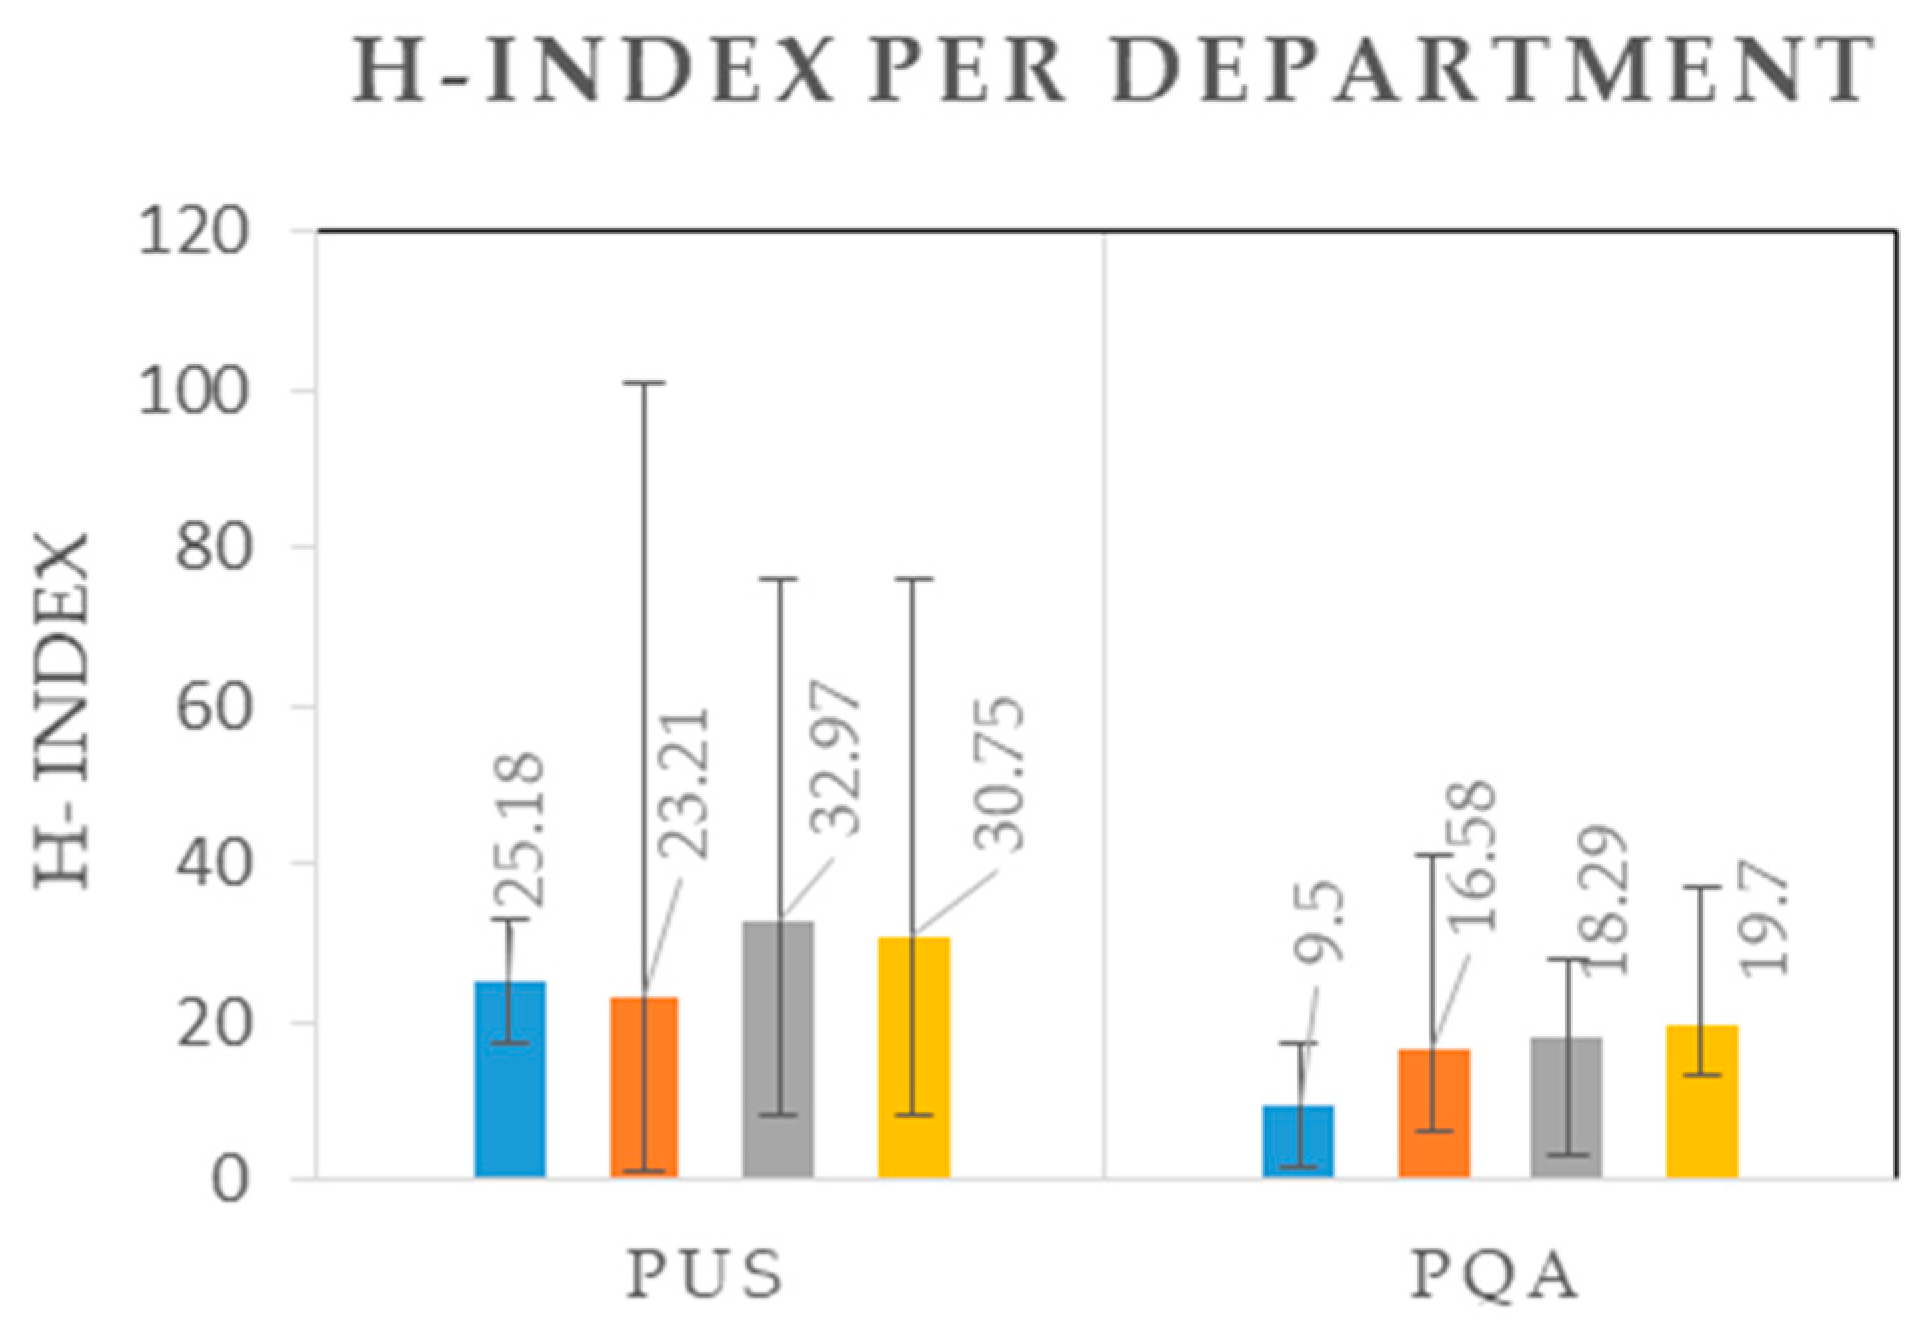
4.6. Innovative Output Indicators

PQA and PUS technical publications and filed patents for the four engineering departments were collected and plotted for the last 15 years to examine changes in production before and during the current leaders’ appointment dates. This was done to examine the possible effect of the leaders’ traits on followers’ innovative outputs. Figure 7 shows the total published papers and patents for active faculty members in their perspective institutions (taking into account the joining date of each faculty member in their perspective institutions). In Figure 8, both indicators were divided by the number of faculty members, considering the differences in the size of the two colleges, to allow a fair comparison.
Both institutions showed a gradual increase in technical publications, which reached a production of 2000 for PUS and 500 for PQA in 2018. This indicated a slower increase in PQA compared to PUS. When considering the number of faculty members, PQA became closer in paper production to PUS, especially in the last four years, indicating similar efficiency of technical production.
Unlike the gradual increase in technical articles, the production of patents in PUS was unstable. However, it recorded peak productions of 49 and 78 in 2010 and 2016, respectively. The patent production remained under 10 in PQA, and it registered its highest production of nine in 2017.
The average h-index was categorized and color-coded per department, as shown in Figure 9. PUS had 1.5–2.5-fold higher h-indices than PQA in all four departments. Taking into consideration the differences in faculty age group and years of experience, this result was expected. Moreover, having a higher number of full-time professors (than associate and assistant professors) in PUS supported the higher h-index values for PUS (Table 11).
The undergraduate student catalog was searched for courses related to innovation, sustainability, and SD in order to evaluate the engineering colleges’ effort toward transforming to IKBE through the inclusion of SD-related topics in the curriculum. Key words such as sustainability, sustainable development, innovation, creativity, environment, renewable, and alternatives were used as guidance for the research process. Between 2009 and 2019, PUS doubled the number of courses involving the mentioned keywords from five to 10, while the courses in PQA increased from four to six courses, recording a slight increase.

5. Discussion

The quantitative data of MLQ showed that both leaders (deans of engineering colleges) exhibited traces of TL styles; however, they were lower than the norm. This result supported the claim that changes in hierarchical organizations such as universities are not easy, especially due to the institutionalization of traditions and aggrandizement of hierarchies [83]. Leaders in HEI were described as reluctant to incorporate changes [84], which causes universities to lag behind with unchanged teaching methods for decades (http://futureuniversities.com). As TLs are stimulators for change, it was not a surprise for HEI leaders to score lower than the norm in TL traits, as HEIs are continuously described as traditional and change-resistant.
Comparing leaders’ TL styles and followers’ innovative outputs at both public universities, the PQA leader achieved higher scores than the PUS leader, while PUS faculty members achieved higher innovative production. Potential bias was expected upon giving the PUS female leader low TL-style scores in a male-dominated field. The role of congruity of prejudice toward female leadership was exemplified in Foschi’s double-standard theory [85,86]. Women can be perceived less favorably than men for leadership roles as certain leadership behaviors are often viewed negatively when enacted by female leaders, which formed possible explanations for the low evaluation.
The correlation between leadership traits and its outcomes, and between leadership traits and followership and system showed that the highest correlation for PQA was achieved by II(A) and II(B), while it was achieved by IC and CR for PUS. These results supported the authors’ previous results of the high effect of the context and surrounding culture on the leader–follower relationship and its impact on innovative outputs. According to Hofstede’s framework for developing hypotheses for cross-cultural organizational studies, there are four dimensions to consider: power distance (PD), uncertainty avoidance (UA), individualism versus collectivism (IVC), and masculinity versus femininity (MVF). The PD dimension refers to the inequality of power between superiors and subordinates [63]. Countries such as Russia, China, Mexico, and Arab countries are considered as high-PD societies, while the US is considered as a medium- to low-PD country according to Hofstede’s study results. Wu confirmed this result by conducting a study in the context of academia with university employees, which is more representative of our study, and reemphasized the tendency of PD to be medium to low in the US academic society [63]. PQA, being a high-PD society, with more than 90% of faculty members from high-PD countries, gave the leader high scores, representing a form of respect. In high-PD societies, power and authority is centralized, and respect toward leaders is a norm. These characteristics of high-PD societies explained the high correlation of PQA outcomes with the two TL traits of II(A) and II(B). Idealized influence represents followers’ respect, trust, and confidence in a leader’s vision. PQA followers appeared to be influenced by the idealized image of their leader, having confidence in their vision, admiration, and commitment.
Another distinctive feature of high-PD societies is the fact that individuals expect to be told what to do as superiority is common and accepted. In relation to innovation, in high-PD societies, it is likely to happen when supported by the hierarchy. During the interviews, the PQA faculty members expressed their belief in the central role played by the leader, as shown in the following statements:
“The main players in the innovation process are the top administration body. They do the encouragement and pay the money, which is the reason why it is important to have a leader with administrative experience; they do better in management. We need the right culture to support this.”
“It is a top-down process. The vision should be from the top, meaning the dean. However, department heads are very powerful in the implementation process and communicate it and stress it to their faculty. “
“It is certainly a top-down process; however, a leader needs a supporting powerful team with highly innovative individuals and early adaptors.”
The leadership involvement in cultivating innovation went beyond university leadership to request the government’s involvement. A faculty member from PQA believed that the ecosystem needs to be supported by the government, which is an indication that the government’s involvement is required even when more autonomy is normally cheered by the faculty.
“An ecosystem needs to be emphasized by the government. For example, they should replace outside consultancy with consultants from the university itself.”
On the other hand, PUS is located in a country where PD is described as medium to low. Individuals in these societies value independence and expect to be consulted as the power is decentralized. Innovation is more spontaneous and frequent in these societies due to the decentralized power and highly independent individuals. These characteristics of medium- to low-PD societies explained the high correlation of PUS outcomes with the two TL traits of CR and IC. PUS faculty members valued practical application and tangible gains represented in contingent rewards and individualized consideration for their work more than the image of the leader and their charisma. As their personal drive is already high, their needs are reflected in the facilitation that senior administrators can initiate. PUS faculty members claimed that high-level decisions, such as funding, are faster and more influential when they occur in a top-down manner, as expressed in the following statements:
“What the leaders take care of and pay attention to flourish faster, especially when tied to the award system and budget management.”
“We need their support in providing more funding for research. It is very stressful because of the high competition.”
In relation to IC specifically, leaders with high IC pay attention to their followers’ performance, needs, and development, which was a request by a number of faculty members. PUS faculty members expressed their concerns that more communication channels needed to be initiated by the leaders for better delivery for the specific needs of faculty, as shown in the following statements:
“Reducing the gap between faculty and leadership is needed because it minimizes the connection between both, limits the feedback delivered to leadership (from faculty), and limits the direct connection with leadership to describe what is needed exactly from faculty.”
“We need better connection. Sometimes changes happen and we don’t know about them in the right time.”
“Leaders need to set clear objectives and facilitate large-scale projects, forming teams and putting together mechanisms for funding (which are currently very good), but more is needed.”
“Reduced workload in things doesn’t affect innovation or teaching as we have a big amount of reporting.”
The following statements combined the IC for faculty needs and the CR as it resembled a reward mechanism that most faculty members aimed for:
“Projects and applied research need better acknowledgement and special reward as they are undervalued.”
“I would like leaders to consider having long-term institutional memory for faculty to be eligible for professorship and give more endowment. We have a similar thing, but we need more of it because it helps faculty and encourages them to do more.”
Federal and state support is essential for any university to function in the US. Hence, the government has an influence on the universities [83]. As a public university, the government’s role was evident in cultivating innovation through supporting research, which was acknowledged by a number of faculty members in the following statements:
“The government has a good system to define goals, select strong proposals, and follow up. Follow-up is extremely important.”
“The proposal review process is very detail-oriented. They check it carefully for achievable tasks and check the faculty’s previous work as part of this review process prior to the selection. It is a transparent fair process here. They care about how to manage the money effectively.”
“Government has the responsibility to cultivate a culture for innovation since they drive the funding.”
Uncertainty avoidance, the second dimension of Hofstede’s framework, represents individuals’ tolerance of ambiguity [63]. In high-UA societies such as Russia, Japan, France, and Arab countries, individuals feel threatened by the unknown, and organizations seem to have more rules to reduce uncertainty. Moreover, individuals in societies with high UA have a tendency to avoid differences, stay at the same jobs, and consider difference risky, which is why innovation is adapted slowly [66]. This explanation represents another justification for PQA faculty members requesting for change to be initiated by top leadership.
On the other hand, in low-UA societies such as Denmark, Austria, the Netherlands, and the US, individuals expect and accept ambiguity and do not feel threatened by the unknown, which is why fewer rules exist. Low-UA societies have more tolerance toward different people, and, for them, differences create curiosity; hence, innovation is much more likely to happen [63,66]. Granting faculty members a good autonomy level is evidence of the existence of fewer rules in PUS, and satisfaction was expressed by a faculty member in the following statements:
“We don’t want leadership to be an obstacle. Don’t delay me, but rather help me. A supporting factor here is the fact that it is a flat structure. We have a good autonomy level that helps us be more creative.”
“Our leadership gives the right autonomy level to faculty.”
Individualism and collectivism refer to how individuals value themselves as individuals and within their groups and organizations [63]. Individuals within high-individualism societies, such as the US, care about self-actualization and career progress more than the organization as a whole. In academia, writing books and publishing articles are evidence of scholarly productivity, and faculty members like to see their names in print [83]. Being competitive to achieve high academic production is a strong motivation in a highly individualistic society such as the US.
On the other hand, collectivist societies tend to care about the organization as a whole more than their own interest. Despite the fact that all academics like to see their names in print [83], being in a collective society might affect the strength of self-drive in PQA faculty members, which could have been the reason for 55% of PQA faculty members attributing the motivation for innovation to external factors such as system and leadership (Figure 4).
In the fifth dimension of Hofstede’s cultural dimension framework, which divides the societies into long-term- and short-term-oriented societies, both the US and the Middle East countries were described as short-term-oriented countries [67]. According to Hofstede, short-term-oriented societies are societies connected to the past, have national pride, and like to keep traditions. They prefer immediate gratification, care about preservation of face, and seek positive information about themselves. All these characteristics explain the faculty members’ need and request for acknowledgement for their work as it represents validation for one’s effort and worth.
Given the fact that substantive autonomy is given to faculty members (especially in PUS), the results shown in this study regarding undergraduate courses related to SD indicated a low number of courses introduced to the curriculum in the past decade. It can be argued that the students need a strong foundation, which is represented in the essential technical knowledge offered by the core courses in the colleges. However, creativity, innovation, and entrepreneurship knowledge are important as they are the anticipated needed skills for 2030 jobs as per “the Future of Jobs Report 2018” by the World Economic Forum [62].

6. Conclusions

This study was a continuation of a previous study that aimed to investigate the impact of TL on cultivating innovation in followers’ outputs in different contexts and governance systems. As the previous study examined the transformational efforts toward IKBE for engineering colleges in a public university in the US and its IBC in Qatar, this study incorporated two public universities, one in the US and one in Qatar, using different governing systems. Leadership styles in both studies showed traces of TL; however, the scores were lower than the norm. Having low TL in universities can constitute a possible barrier to any transformational process within universities since leaders with high TL styles are more effective in embracing change and challenging the status quo [87,88].
The effect of context on the followers’ participation and evaluation of their leaders and current systems was discussed in the view of Hofstede’s framework of cross-cultural studies. The study showed that differences in PD caused changes in expectations and perceptions in leadership styles in different societies [63]. The followers’ satisfaction with their leader and system was strongly correlated with II(A) and II(B) in PQA, while the same dependent variables achieved stronger correlation with IC and CR in PUS. As PQA is located in a high-PD society, the image and charisma of the leader represented a positive influence toward higher satisfaction by the followers with their leader and the system. In high PD (PQA), higher ranking for the leader means higher respect as power and hierarchy matter. The image of a major administrator, such as the dean, is important as their name, behavior, and decisions are public matters for discussion [83]. This was another reason why faculty members were careful about what to project about their dean, especially in high-PD nations. Moreover, the low participation rate, especially in interviews, could be attributed to the same cause factor.
On the other hand, for PUS, being in a lower-PD society, the main sources of faculty satisfaction were a tangible reward system and individualized recognitions, due to high individuality and independence which are valued more than respect in such societies. Faculty members emphasized the need for acknowledgment and a reward system that supported projects since they require more effort than technical publications (which are currently the basis for faculty evaluation). Encouraging and acknowledging projects that involve connections with the industry not only achieves individualized fulfillment, but also leads to economic and competitive development for the university, the industry, and the country as a whole. The academia–industry relationship is fundamental for the NIS [37,39], and it led the US to be classified as an innovation leader (as per GII reports). In the US individualistic, low UA, and low LTO context, followers achieved higher technical production, as shown in Figure 7, Figure 8 and Figure 9.
The study showed that greater support from administrators and management is needed as bottom-up sustainability-related initiatives in universities are “destined to fail in the longer term due to a lack of investment and administrative support” [84]. This result confirmed the effect of hierarchy and traditions on public universities, which might also be the reason for slow change and the low TL style in universities and university leaders. Another possible reason for the low TL and slow change is the fact that the study was conducted in oil-rich states in which resources are immense and innovation in academia might not be a priority, taking into consideration its long cycle for profit production. Another finding was the focus on fundraising and sponsorship opportunities as primary responsibilities of the deans as stated by faculty members. Cultivating the art of fundraising as the leitmotif of academic life was requested by faculty members, as more money is always desired and considered synonymous with development [83].
Unlike university ranking and accreditation schemes, which are gaining popularity (e.g., Ecocampus, People and Planet League), the curriculum failed to incorporate changes to include aspects of SD, which is why it is lagging behind other forms of implementing SD within HEI [84,89,90]. This study showed slow progress toward the inclusion of SD- and innovation-related courses in engineering curricula. Introducing core classes dedicated to SD, innovation, and creativity should be encouraged and supported by higher leadership in public universities, as they form one of the strategies toward innovation in sustainability [91]. Faculty members can easily implement these inclusions without incorporating major changes in the business model, which most cases of leadership resist. As all studies have limitations, the current study was subject to a few that could be addressed in future studies. Our design was limited to four output indicators, while other forms of innovation indicators, such as input (e.g., R&D head count) and process (e.g., courses and conferences attended annually per faculty or university–government–industry collaboration) can be considered for examination in future studies. A special focus on the university–government–industry collaboration indicator, under the framework of OI, should be the target for future studies, as its huge impact on innovation was confirmed. Furthermore, our sample focused on engineering colleges, and as innovation is not restricted to engineering, other disciplines should be considered for future studies to capture a holistic picture of TL impact on the overall academic arena. Even though the sample passed the validity test and was eligible for analysis, the number of responses received for this study was insufficient. The researchers anticipate that this was due to the sensitivity of the issue since it involved leadership. A number of participants hesitated to take the survey, as it required assessing their dean; hence, different strategies need to be used to collect more responses and assure confidentiality, especially in a high-UA context.

Author Contributions

Conceptualization, data curation, methodology, validation, analysis, and writing—original draft were the responsibility of R.S.A.-M., the corresponding author. Supervising and editing were the responsibility of M.K., the second author.

Funding

This research received no external funding

Acknowledgments

The authors would like to acknowledge Danya AlSaleh for reviewing this article and providing thoughtful recommendations that helped improve the quality of this manuscript.

Conflicts of Interest

The authors declare no conflicts of interest.

References

  1. Abdulwahed, M.; Hasna, M.O. Engineering and Technology Talent for Innovation and Knowledge-Based Economies; Springer: Cham, Switzerland, 2014. [Google Scholar] [CrossRef]
  2. Khorsheed, M.S. Learning from Global Pacesetters to Build the Country Innovation Ecosystem. J. Knowl. Econ. 2016, 8, 177–196. [Google Scholar] [CrossRef]
  3. Chesbrough, H. The era of open innovation. MIT Sloan Manag. Rev. 2003, 44, 35–41. [Google Scholar]
  4. Felgueiras, M.C.; Rocha, J.; Caetano, N. Engineering Education Towards sustainability. In Proceedings of the 4th International Conference on Energy and Environment Research (ICEER 2017), Porto, Portugal, 17–20 July 2017. [Google Scholar]
  5. WFEO. WFEO MoU. 2014. Available online: http://www.wfeo.org/wfeo-iea-mou/ (accessed on 15 November 2015).
  6. Al-Mansoori, R.S.; Koc, M. Transformational Leadership, System, and Intrinsic Motivation in Higher Education Institutes: Faculty Perspectives in Engineering Colleges. Sustainability 2019, 11, 4072. [Google Scholar] [CrossRef]
  7. Muenjohn, N.; Armstrong, A. Transformational Leadership: The influence of culture on the leadership behaviours of expatriate managers. Int. J. Bus. Inf. 2007, 2, 265–283. [Google Scholar]
  8. Den Hartog, D.N.; Van Muijen, J.J.; Koopman, P.L. Transactional versus transformational leadership: An analysis of the MLQ. J. Occup. Organ. Psychol. 1997, 70, 19–34. [Google Scholar] [CrossRef]
  9. Felfe, J.; Goihl, K. Transformational Leadership and Commitment. Organ. Dev. Leadersh. 2002, 11, 87–124. [Google Scholar]
  10. Aryee, S.; Walumbwa, F.O.; Seidu, E.Y.M.; Otaye, L.E. Impact of high performance work systems on individual- and brand-level performance: Test of a multilevel model of intermediate linkages. J. Appl. Psychol. 2012, 97, 667. [Google Scholar] [CrossRef]
  11. Dorenbosch, L.; van Engen, M.; Verhagen, M. On-the-job innovation: The impact of job design and human resource management through production ownership. Creat. Innov. Manag. 2005, 14, 129–141. [Google Scholar] [CrossRef]
  12. House, R.J.; Howell, J.M. Personality and Charismatic Leadership. Leadersh. Q. 1992, 3, 81–108. [Google Scholar] [CrossRef]
  13. Bass, B. Does the transactional–transformational leadership paradigm transcend organizational and national boundaries? Am. Psychol. 1997, 52, 130–139. [Google Scholar] [CrossRef]
  14. Northouse, P.G. Leadership Theory and Practice, 6th ed.; Sage: Thousand Oaks, CA, USA, 2012. [Google Scholar]
  15. Price, R.M. Infusing Innovation into Corporate Culture. Organ. Dyn. 2007, 36, 320–328. [Google Scholar] [CrossRef]
  16. Zyl, H.; Preez, N.; Schutte, C. Utilizing formal innovation models to support and guide industry innovation projects. S. Afr. J. Ind. Eng. 2007, 18, 203–219. [Google Scholar]
  17. Uppenberg, K. Innovation and Economic Growth; EIB Papers 1/2009; European Investment Bank, Economic and Financial Studies: Kirchberg, Luxemberg, 2009. [Google Scholar]
  18. Freeman, C. Continental, national and sub-national innovation systems—Complementarity and economic growth. Res. Policy 2002, 31, 191–211. [Google Scholar] [CrossRef]
  19. Perri, G. Innovation by nonprofit organizations: Policy and research issues. Nonprofit Manag. Leadersh. 1993, 3, 397–414. [Google Scholar] [CrossRef]
  20. Elster, J. Explaining Technical Change; Cambridge University Press: Cambridge, UK, 1983. [Google Scholar]
  21. Davies, S. Concentration. In Economics of Industrial Organisation; Davies, S., Lyons, B., Dixon, H., Geroski, P., Eds.; Longman, Harlow: London, UK, 1991. [Google Scholar]
  22. Gomulka, S. The Theory of Technology Change and Economic Growth; Routledge: London, UK, 1990. [Google Scholar]
  23. Kamien, M.I.; Schwartz, N.L. Market Structure and Innovation; Cambridge University Press: Cambridge, UK, 1982. [Google Scholar]
  24. OECD. The Measurement of Scientific and Technological Activities—Proposed Guidelines for Collecting and Interpreting Technological Innovation Data; Oslo Manual; OECD: Paris, France, 2005. [Google Scholar]
  25. Williamson, O.E. Antitrust Enforcement and the Modern Corporation. In Policy Issues and Essays on Research Opportunities in Industrial Organization; Fuchs, V.R., Ed.; National Bureau of Economic Research: New York, NY, USA, 1972. [Google Scholar]
  26. Sáenz, J.; Aramburu, N.; Rivera, O. Knowledge sharing and innovation performance—A comparison between high-tech and low-tech companies. J. Intellect. Cap. 2009, 10, 22–36. [Google Scholar] [CrossRef]
  27. Damanpour, F.; Walker, R.M.; Avellaneda, C.N. Combinative Effects of Innovation Types and Organizational Performance: A Longitudinal Study of Service Organizations. J. Manag. Stud. 2009, 46, 650–675. [Google Scholar] [CrossRef]
  28. Al-Husseini, S.; Elbeltagi, I. Transformational leadership and innovation: A comparison study between Iraq’s public and private higher education. Stud. High. Educ. 2016, 41, 159–181. [Google Scholar] [CrossRef]
  29. Jaskyte, K. Transformational Leadership, Organizational Culture and Innovation in Nonprofit Organizations. Nonprofit Organization and Leadership 2004, 15, 153–168. [Google Scholar] [CrossRef]
  30. Obendhain, A.; Johnson, W. Product and Process Innovation in Service Organizations: The Influence of Organizational Culture in Higher Education Institutions. J. Appl. Manag. Entrep. 2004, 9, 91–113. [Google Scholar]
  31. Anderson, N.; Potočnik, K.; Zhou, J. Innovation and Creativity in Organizations: A State-of-the-Science Review, Prospective Commentary, and Guiding Framework. J. Manag. 2014, 4, 1297–1333. [Google Scholar] [CrossRef]
  32. Chesbrough, H. Open Innovation: The New Imperative for Creating and Profiting from Technology; Harvard Business School Press: Harvard, MA, USA, 2003. [Google Scholar]
  33. Leydesdorff, L.; Ivanova, I. “Open innovation” and “triple helix” models of innovation: Can synergy in innovation systems be measured? J. Open Innov. Technol. Mark. Complex. 2016, 2, 11. [Google Scholar] [CrossRef]
  34. Chesbrough, H.W. Open Business Models: How to Thrive in the New Innovation Landscape; Harvard Business School Publishing: Cambridge, MA, USA, 2006. [Google Scholar]
  35. Howells, R.L.; Ramlogan, R.; Cheng, S.L. Universities in an open innovation system: A UK perspective. Int. J. Entrep. Behav. Res. 2012, 18, 440–456. [Google Scholar] [CrossRef]
  36. Hanel, P.; St-Pierre, M. Industry–university collaboration by Canadian manufacturing firms. J. Technol. Transf. 2006, 31, 485–499. [Google Scholar] [CrossRef]
  37. Krishna, V.V. Universities in the National Innovation Systems: Emerging Innovation Landscapes in Asia-Pacific. J. Open Innov. Technol. Mark. Complex. 2019, 5, 43. [Google Scholar] [CrossRef]
  38. Gassmann, O.; Enkel, E.; Chesbrough, H. The future of open innovation. R D Manag. 2010, 40, 213–221. [Google Scholar] [CrossRef]
  39. Perkmann, M.; Walsh, K. University-industry relationships and open innovation: Towards a research agenda. Int. J. Manag. Rev. 2007, 9, 259–280. [Google Scholar] [CrossRef]
  40. Carneiro, A. When leadership means more innovation and development. Bus. Stragy Ser. 2008, 9, 176–184. [Google Scholar] [CrossRef]
  41. Samad, S. The Influence of Innovation and Transformational Leadership on Organizational Performance. Soc. Behav. Sci. 2012, 57, 486–493. [Google Scholar] [CrossRef]
  42. Leydesdorff, L. The Knowledge-Based Economy and the Triple Helix Model. Ann. Rev. Inf. Sci. Technol. 2010, 44, 365–417. [Google Scholar] [CrossRef]
  43. Baark, E. The Role of Universities in the Innovation Systems of the Gulf: Vocational Training or Gateways to the World of Knowledge? In Proceedings of the Gulf Research Meeting 2015 Workshop 6: Transnational Knowledge Relations and Researcher Mobility for Building Knowledge-Based Societies and Economies in the Gulf, Cambridge, UK, 24–27 August 2015. [Google Scholar]
  44. Callen, T.; Cherif, R.; Hasanov, F.; Hegazy, A.; Khandelwal, P. Economic Diversifcation in the GCC: The Past, the Present, and the Future; IMF Staff Discussion Note; The International Monetary Fund: Washington DC, USA, 2014. [Google Scholar]
  45. IMF. Financing for Development—Revisiting the Monterrey Consensus; Policy Paper; IMF: Washington, DC, USA, 2015. [Google Scholar]
  46. Saif, I. The Oil Boom in the GCC Countries, 2002–2008: Old Challenges, Changing Dynamics; Carnegie Middle East Center: Beirut, Lebanon, 2009. [Google Scholar]
  47. Byrne, E.P.; Desha, C.; Fitzpatrick, J.J.; Hargroves, K. Engineering education for sustainable development: A review of international progress. In Proceedings of the 3rd International Symposium for Engineering Education, Cork, Ireland, 30 June–2 July 2010. [Google Scholar]
  48. WEFO. Capacity Building for Engineering. 2019 Presentation to UNESCO Members Delegations. Available online: https://www.wfeo.org/wp-content/uploads/un/January-2019/WFEO_UNESCO_Member_Nation_Presentations_1Feb2019-Final.pdf (accessed on 7 July 2019).
  49. Kelly, W.E. Brief of GSDR: Engineering Education for Sustainable Development. 2016. Available online: https://sustainabledevelopment.un.org/content/documents/970027_Kelly_Engineering%20Education%20for%20Sustainable%20Development.pdf (accessed on 6 July 2019).
  50. Prados, J.W. Engineering Education in the United States: Past, Present and Future. 1998. Available online: www.ineer.org/Events/ICEE1998/Icee/papers/255.pdf (accessed on 28 September 2019).
  51. Smith, G.P. The New Leader: Bringing Creativity and Innovation to the Workplace; Chart Your Course Publications: Conyers, GA, USA, 2002. [Google Scholar]
  52. Seymour, E.; Hewitt, N.M. Talking about Leaving: Why Undergraduates Leave the Sciences? Westview Press: Boulder, CO, USA, 1997. [Google Scholar]
  53. Butz, W.P.; Bloom, G.A.; Gross, M.E.; Kelly, T.K.; Kofner, A.; Rippen, H.E. Is There a Shortage of Scientists and Engineers? Issue Paper: Science and Technology; The RAND Corporation: Santa Monica, CA, USA, 2006. [Google Scholar]
  54. Todd, R.H.; Sorensen, C.D.; Magleby, S.P. Designing a Capstone Senior Course to Satisfy Industrial Customers. J. Eng. Educ. 1993, 82, 92–100. [Google Scholar] [CrossRef]
  55. Qatar Foundation Research and Development. Qatar National Research Strategy 2012; Qatar Foundation: Doha, Qatar, 2012. [Google Scholar]
  56. Ministry of Development Planning and Statistics (MDPS). Results of Research and Development Survey in the State of Qatar. 2012. Available online: https://www.mdps.gov.qa/en/statistics/Statistical%20Releases/Social/RAndD/2015/RD_Qatar_2015_En.pdf (accessed on 29 September 2019).
  57. Crossley, M.; Bray, M.; Packer, S. Education in Small States: Policies and Priorities; Commonwealth Secretariat: London, UK, 2011. [Google Scholar]
  58. Crist, J.T. Innovation in a Small State: Qatar and the IBC Cluster Model of Higher Education. Muslim Wolrd 2015, 105, 93–115. [Google Scholar] [CrossRef]
  59. Cornell University; INSEAD; WIPO. The Global Innovation Index 2018: Energizing the World with Innovation; Cornell University: Ithaca, NY, USA; INSEAD: Fontainebleau, France; WIPO: Geneva, Switzerland, 2018. [Google Scholar]
  60. Cornell University; INSEAD; WIPO. The Global Innovation Index 2016: Winning with Global Innovation; Cornell University: Ithaca, NY, USA; INSEAD: Fontainebleau, France; WIPO: Geneva, Switzerland, 2016. [Google Scholar]
  61. Cornell University; INSEAD; WIPO. The Global Innovation Index 2017: Innovation Feeding the World; Cornell University: Ithaca, NY, USA; INSEAD: Fontainebleau, France; WIPO: Geneva, Switzerland, 2017. [Google Scholar]
  62. WEF. What Are the 21st-Century Skills Every Student Needs? World Economic Forum: Geneva, Switzerland, 2016. [Google Scholar]
  63. Wu, M.-Y. Hofstede’s cultural dimensions 30 years later: A study of Taiwan and the United States. Intercult. Commun. Stud. 2006, 15, 33–42. [Google Scholar]
  64. Hofstede, G. Culture’s Consequences: International Differences in Work-Related Values; Sage: Newbury Park, CA, USA, 1984. [Google Scholar]
  65. Hofstede, G. Cultures and Organizations: Software of the Mind; McGrawHill: New York, NY, USA, 1991. [Google Scholar]
  66. Hofstede, G. Culture’s Consequences: Comparing Values, Behaviors, Institutions, and Organizations across Nations; Sage Myers: Thousand Oaks, CA, USA, 2001. [Google Scholar]
  67. Hofstede, G.; Hofstede, G.J.; Minkov, M. Cultures and Organizations: Software of the Mind: Intercultural Cooperation and its Importance for Survival, 3rd ed.; McGrawHill: New York, NY, USA, 2010. [Google Scholar]
  68. Mulder, M. The Daily Power Game; Martinus Nijhoff: Leiden, The Neitherlands, 1977. [Google Scholar]
  69. Li, H.; Sajjad, N.; Wang, Q.; Muhammad Ali, A.; Khaqan, Z.; Amina, S. Influence of Transformational Leadership on Employees’ Innovative Work Behavior in Sustainable Organizations: Test of Mediation and Moderation Processes. Sustainability 2019, 11, 1594. [Google Scholar] [CrossRef]
  70. Wilson, S.; Maclean, R. Research Methods and Data Analysis for Psychology; McGraw-Hill Higher Education: New York, NY, USA, 2010. [Google Scholar]
  71. Bass, B.M.; Avolio, B.J. Manual for the Multifactor Leadership Questionnaire (form 5X); Mind Garden: Redwood City, CA, USA, 2000. [Google Scholar]
  72. Avolio, B.J.; Bass, B.M. Multifactor Leadership Questionnaire; ManualandSamplerSet, 3rd ed.; Mind Garden Inc.: Palo Alto, CA, USA, 2004. [Google Scholar]
  73. Bass, B.; Avolio, B.J. Improving Organizational Effectiveness Through Transformational Leadership. J. Organ. Chang. 1994, 17, 177–193. [Google Scholar]
  74. Tierney, P.; Farmer, S.M.; Graen, G.B. An examination of leadership and employee creativity: The relevance of traits and relationships. Pers. Psychol. 1999, 52, 591–620. [Google Scholar] [CrossRef]
  75. Baker, D.N. Reaching Higher Qatar University 1977–2015; Qatar University: Doha, Qatar, 2015. [Google Scholar]
  76. Baruch, Y. Response Rate in Academic Studies—A Comparative Analysis. Hum. Relat. 1999, 52, 421–438. [Google Scholar] [CrossRef]
  77. Roth, P.L.; BeVier, C.A. Response Rates in HRM/OB Survey Research: Norms and Correlates, 1990–1994. J. Manag. 1998, 24, 97–117. [Google Scholar] [CrossRef]
  78. Richter, D.; Loendorf, W. Faculty With Industrial Experience Bring A Real World Perspective to Engineering Education. In Proceedings of the ASEE Annual Conference, Honolulu, HI, USA, 24–27 June 2007. [Google Scholar]
  79. Nunnally, J.; Bernstein, L. Psychometric Theory; McGraw-Hill Higher Inc.: New York, NY, USA, 1994. [Google Scholar]
  80. Cohen, R.; Swerdlik, M. Psychological Testing and Assessment; McGraw-Hill Higher Education: Boston, MA, USA, 2010. [Google Scholar]
  81. Kotter, J.P.; Schlesinger, L.A. Choosing Strategies for Change. Harv. Bus. Rev. 2008, 57, 106–114. [Google Scholar] [CrossRef]
  82. Walker, C.O.; Greene, B.A.; Mansell, R.A. Identification with academics, intrinsic/extrinsic motivation, and self-efficacy as predictors of cognitive engagement. Learn. Individ. Differ. 2006, 16, 1–12. [Google Scholar] [CrossRef]
  83. Rosovosky, H. The University: An Owner’s Manual; W.W. Norton and Company: New York, NY, USA, 1990; p. 309. [Google Scholar]
  84. Ávila, L.V.; Filho, W.L.; Brandli, L.; MacGregor, C.; Hill, P.M.; Özuyar, P.G.; Moreira, R.M. Barriers to Innovation and Sustainability at Universities Around the World. J. Clean. Prod. 2017, 164, 1268–1278. [Google Scholar] [CrossRef] [Green Version]
  85. Eagly, A.H.; Karau, S.J. Role congruity theory of prejudice toward female leaders. Psychol. Rev. 2002, 109, 573–598. [Google Scholar] [CrossRef] [PubMed]
  86. Foschi, M. Double Standards for Competence: Theory and Research. Annu. Rev. Sociol. 2000, 16, 21–42. [Google Scholar] [CrossRef]
  87. Oliveira, K.C.C. Relacionando Liderança Transformacional e Inovação na Educação. Master’s Thesis, Instituto Superior de Contabilidade e Administração do Porto, Matosinhos, Portugal, 2017. [Google Scholar]
  88. Leithwood, K.; Jantzi, D. Transformational school leadership for large-scale reform: Effects on students, teachers, and their classroom practices. Sch. Eff. Sch. Improv. 2006, 17, 201–227. [Google Scholar] [CrossRef]
  89. Capdevila, I.; Bruno, J.; Jofre, L. Curriculum greening and environmental research co-ordination at the Technical University of Catalonia, Barcelona. J. Clean. Prod. 2002, 10, 25–31. [Google Scholar] [CrossRef]
  90. Müller-Christ, G.; Sterling, S.; van Dam-Mieras, R.; Adomßent, M.; Fischer, D.; Rieckmann, M. The role of campus, curriculum, and community in higher education for sustainable development—A conference report. J. Clean. Prod. 2014, 62, 134–137. [Google Scholar] [CrossRef]
  91. Velazquez, L.; Munguia, N.; Sanchez, M. Deterring sustainability in higher education institutions. Int. J. Sustain. High. Educ. 2005, 6, 383–391. [Google Scholar] [CrossRef]
Figure 1. Demographic results for PUS (United States public university) and PQA (Qatar public university) in percentages.
Sustainability 11 06721 g001
Figure 2. Faculty members’ perspectives for the governance systems in their respective institutions (item 1).
Sustainability 11 06721 g002
Figure 3. Items 2–5 in the system scale assessing the faculty’s satisfaction with the culture, learning opportunities, incentives, and rewards, in addition to the overall satisfaction level with the current system. Note: Rarely = “not at all” and “once in a while”; Often = “fairly often” and “frequently if not always” merged together.
Sustainability 11 06721 g003
Figure 4. Innovation drivers for engineering faculty. Note: Internal = achievements, self-satisfaction, and personal goals; System = required goals and minimum achievements per year, promotion; Leadership = supportive and encouraging leadership providing an open-door open discussion strategy.
Sustainability 11 06721 g004
Figure 5. Items 2–4 in followership scale as adopted from Reference [64] to assess intrinsic motivation. Note: Rarely = “not at all” and “once in a while”; Often = “fairly often” and “frequently if not always” merged together.
Sustainability 11 06721 g005
Figure 6. Item 5 in followership scale representing a direct measure for the faculty’s intrinsic motivation.
Sustainability 11 06721 g006
Figure 7. (a) Number of published technical papers in selected departments in PQA and PUS since 2004. (b) Number of patents in selected departments in PQA and PUS since 2004.
Sustainability 11 06721 g007
Figure 8. (a) Number of technical papers published divided by the number of faculty members. (b) Number of produced patents divided by the number of faculty members.
Sustainability 11 06721 g008
Figure 9. H-index for PQA and PUS faculty members in the four selected engineering departments.
Sustainability 11 06721 g009
Table 1. Calculated sample size needed for different confidence levels and margin of error based on Equation (1). PUS—United States public university; PQA—Qatar public university.
Margin of ErrorLevel of Confidence
0.950.9
PUS
N = 184
3%157148
5%124110
10%6350
PQA
N = 59
3%5655
5%5148
10%3732
Table 2. Descriptive data for PQA and PUS combined sample.
N = 39MSDα
Transformational leadership
II(A)2.2820.8370.893
II(B)2.4170.8220.852
IM2.8010.7330.767
IS1.6921.0020.819
IC1.4300.9410.863
Transactional Leadership
CR1.8390.9840.884
MBE(A)1.6990.8220.498
Passive Leadership
MBE(P)1.1790.954−0.231
LF1.1090.699−0.552
Leadership outcomes
EE1.7261.2990.866
EF2.1091.1030.895
SAT1.9491.2710.866
Note: α, Cronbach alpha representing reliability; underlined numbers indicate low reliability (α < 0.7).
Table 3. Descriptive data for PQA and PUS represented separately.
N = 20
PQA
Public university in Qatar
N = 19
PUS
Public university in US
MSDαMSDα
Transformational leadership
II(A)2.5880.7960.8921.9610.7740.858
II(B)2.6000.9230.8992.2240.6710.786
IM2.8630.7500.8472.7370.7290.757
IS2.1130.8640.8441.2500.9650.73
IC1.9250.7990.8530.9080.7960.858
Transactional Leadership
CR2.2000.9130.8751.4610.9330.860
MBE(A)1.8881.0240.4291.5000.4860.578
Passive Leadership
MBE(P)0.8500.8210.0481.5260.9820.237
LF0.8500.656−0.4001.3820.6530.556
Leadership outcomes
EE2.2331.1900.8841.1931.2180.799
EF2.5380.9910.9251.6581.0550.832
SAT2.6001.1650.8601.2631.0050.850
Note: Underlined numbers indicate low reliability (α < 0.7).
Table 4. (a) Percentile scores for leader’s individual traits based on faculty’s rating (Qatar); (b) Percentile scores for leader’s individual traits based on faculty’s rating (US).
(a)
N = 20TransformationalTransactionalPassiveLeadership Outcomes
PercentileII(A)II(B)IMISICCRMBE(A)MBE(P)LFEEEFSAT
50.760.501.250.750.750.26 0.000.500.00
101.080.651.350.780.780.58 0.070.580.10
202.052.252.501.101.051.30 1.072.002.00
302.332.332.501.501.251.65 2.002.082.15
402.502.502.751.951.752.10 2.002.502.70
502.502.633.002.251.882.38 2.332.633.00
602.902.753.002.502.252.75 2.532.753.00
703.182.753.182.682.502.75 3.003.003.00
803.253.453.652.752.703.00 3.003.453.50
903.703.983.983.432.983.00 4.003.984.00
(b)
N = 19TransformationalTransactionalPassiveLeadership Outcomes
PercentileII(A)II(B)IMISICCRMBE(A)MBE(P)LFEEEFSAT
50.751.251.250.000.000.00 0.000.000.00
101.001.501.750.250.000.25 0.000.250.00
201.251.752.250.250.000.50 0.000.750.00
301.501.752.500.500.501.25 0.330.750.50
401.751.752.501.000.501.25 0.331.001.00
501.752.002.501.000.751.25 0.671.751.50
602.002.252.751.000.751.50 1.002.251.50
702.252.253.252.001.501.75 2.002.501.50
803.003.003.502.251.502.50 3.002.502.50
903.253.254.002.752.253.00 3.003.003.00
Note: The shaded area represents the omitted values due to failing reliability test (Table 5). II(A), idealized influence attribute; II(B), idealized influence behavior; IM, inspirational motivation; IS, intellectual stimulation; IC, individualized consideration; CR, contingent reward; MBE(A), management by exception active; MBE(P), management by exception passive; LF, laissez-faire; EE, extra effort; EF, effectiveness; SAT, satisfaction, (0= not at all, 1 = once in a while, 2 = sometimes, 3 = fairly often, 4 = frequently if not always).
Table 5. Leadership style traits and leadership outcomes for Qatar, US, and norm sample at the 60th percentile.
60th PercentileTransformationalTransactionalPassiveLeadership Outcomes
II(A)II(B)IMISICCRMBE(A)MBE(P)LFEEEFSAT
Norm
N = 12,118
3.253.003.253.003.173.13 3.003.253.50
PQA
N = 20
2.902.753.002.502.252.75 2.532.753.00
PUS
N = 19
2.002.252.751.000.751.50 1.002.251.50
Table 6. Distances of leadership traits and leadership outcomes for PQA and PUS from the norm sample at the 60th percentile.
Sustainability 11 06721 i001
Trait/OutcomePQA Distance from NormPUS Distance from Norm
II(A)−0.35−1.25
II(B)−0.25−0.75
IM−0.25−0.5
IS−0.5−2
IC−0.92−2.42
CR−0.38−1.63
EE−0.47−2
EF−0.5−1
SAT−0.5−2
Table 7. Pearson correlation between leadership aspects and leadership outcomes.
PQAPUS
EEEFSATEEEFSAT
TransformationalII(A)0.774 **0.938 **0.870 **0.622 **0.782 **0.773 **
II(B)0.860 **0.888 **0.847 **0.606 **0.805 **0.742 **
IM0.760 **0.901 **0.897 **0.707 **0.771 **0.669 **
IS0.754 **0.752 **0.707 **0.693 **0.682 **0.637 **
IC0.766 **0.801 **0.729 **0.802 **0.800 **0.848 **
TransactionalCR0.863 **0.875 **0.859 **0.785 **0.801 **0.804 **
** Correlation is significant at the 0.01 level (two-tailed).
Table 8. Pearson correlation between leadership aspects and system items.
PQAPUS
CultureDiverse LearningIncentives And RewardsSystem SatisfactionCultureDiverse LearningIncentives And RewardsSystem Satisfaction
Transform-ationalII(A)0.796 **0.558 *0.717 **0.2340.801 **0.504 *0.692 **0.665 **
II(B)0.822 **0.738 **0.684 **0.1870.784 **0.553 *0.624 **0.618 **
IM0.792 **0.600 **0.698 **0.2500.527 *0.4160.534 *0.517 *
IS0.645 **0.590 **0.569 **0.0400.778 **0.602 **0.642 **0.612 **
IC0.527 *0.4380.493 *0.2040.672 **0.585 **0.762 **0.805 **
TransactionalCR0.749 **0.729 **0.703 **0.2410.769 **0.604 **0.814 **0.835 **
** Correlation is significant at the 0.01 level (two-tailed); * Correlation is significant at the 0.05 level (two-tailed).
Table 9. Pearson correlation between leadership aspects and intrinsic motivation items.
PQAPUS
Innovation DriverSolving Complex ProblemsProducing New IdeasAnalytical ThinkingInternal Motivation levelInnovation DriverSolving Complex ProblemsProducing New IdeasAnalytical ThinkingInternal Motivation level
TransformationalII(A)−0.0880.3330.1310.0600.348−0.2580.2170.3100.3670.126
II(B)0.0270.3040.0910.2070.079−0.2990.1720.2900.2350.062
IM−0.1030.4370.1950.1440.198−0.1820.3120.3200.324−0.214
IS−0.1930.176−0.0440.1620.107−0.3730.1800.1910.1730.077
IC−0.2650.106−0.0100.1600.273−0.357−0.148−0.0780.065−0.238
TransactionalCR0.075−0.014−0.165−0.007−0.025−0.4270.0530.1500.217−0.068
PQA, public university in Qatar; PUS, public university in the US; II(A), idealized influence attribute; II(B), idealized influence behavior; IM, inspirational motivation; IS, intellectual stimulation; IC, individualized consideration; CR, contingent reward.
Table 10. Dominating leadership aspects for different items in leadership outcomes and system scales (according to highest Pearson correlation results).
PQAPUS
Leadership outcomes:
EECRIC
EFII(A)II(B)
SATIMIC
System:
Innovative CultureII(B)II(A)
Diverse learning opportunitiesII(B)CR
Incentives and rewardsII(A)CR
Overall system satisfactionnoneCR
Table 11. Faculty distribution in the four engineering departments included in the study for PUS and PQA.
ProfessorAssociate ProfessorAssistant Professor
PUS1074836
% of N56.0225.1318.85
PQA252511
% of N40.9840.9818.04

