Article

The Spatial Pattern of Urban Settlement in China from the 1980s to 2010

School of Geography and Ocean Science, Nanjing University, Nanjing 210023, China
*
Author to whom correspondence should be addressed.
Sustainability 2019, 11(23), 6704; https://doi.org/10.3390/su11236704
Submission received: 10 October 2019 / Revised: 21 November 2019 / Accepted: 25 November 2019 / Published: 27 November 2019

Abstract

:
The dynamic urbanization process of China has stimulated a massive growth of urban settlements in the past few decades. With the development of remote sensing technology and the release of the long-time Landsat archive, spatial characteristics of urban settlement are gradually analyzed on a large scale, and various patterns are developed for describing and analyzing it. However, the urban settlement patterns were mainly quantified by the landscape metrics in existing studies, the underlying features shaping urban settlement pattern were always neglected. In this study, we establish a systematic and comprehensive ‘urban development index system’ for describing China’s urban settlement pattern and its evolutions during the end of the 1980s through to 2010 by using a series of statistical methods. Results show that (1) urban settlement pattern in 2010 is quantified comparatively simpler and more completely than in the end of the 1980s; (2) urban settlements in western and eastern regions present integrated pattern and homogeneous attributes, while urban settlements in central and northeastern regions present relatively complex pattern and various attributes; (3) urban settlements with the most variable pattern are accompanied by the most dynamic population and economic capacity, followed by landscape dispersion. Topographic complexity of urban settlements generally remained unchanged or with slight fluctuations, therefore, it has limited influence on settlement pattern evolution.

1. Introduction

Urbanization is a global phenomenon, with dimensions and effects differing across the globe [1]. The development of the urban population is usually considered an important measurement of urbanization [2]; it increased rapidly from 751 million to 4.2 billion from 1950 to 2018 in the world, and it is further expected that another 2.5 billion will be living in cities on our planet by 2050 [3]. Meanwhile, global urban land is expanding at twice the rate of population growth, and it is expected to exceed 1.1 million km2 by 2050 [4]. In general, world population growth, incorporation of small towns due to urban expansion and increasing migration from countryside to metropolis are the main driving forces of rapid urban expansion over the past few decades.
China is an exceptional example of rapid urbanization. Seto [5] found that urban expansion in China had been the fastest among 67 major powers in the world. The winner of the Nobel Prize in economics Joseph E. Stiglitz even said, “the urbanization of China and the development of high technology in the United States will be the two major events that affect the development of human society in the 21st Century” [6]. With the reform and opening-up policy starting at the end of the 1970s, the continuing economic growth of China stimulated the movement of large numbers of people from rural to urban areas [7], leading to the rapid growth of urban lands [8]. According to the 1982 census, the urbanization rate of China was merely 20.6%. However, it had increased significantly to 49.7% by 2010 [9]. Nowadays, the number is approaching 60% (www.stats.gov.cn). The dynamic increase of urban population was no doubt accompanied with a significant expansion of urban lands [10]. Lin et al. [11] found that the average annual growth rate of urban construction land (i.e., land urbanization) of 658 cities in China was 6.89% during 2000 and 2010, which was obviously faster than that of population urbanization (around 2.75%) at the same time period; Chen et al. [12] found that the urban areas in China expanded incredibly with a net growth of 513% between 1981 and 2012 according to the statistical data, while the net growth of urban population was 253%.
As the most direct embodiment of urbanization from space [13], the fast expansion of urban settlements has already attracted a great deal of attention. Remote sensing has developed into a crucial data source for documenting urban settlements and their dynamics over time [14]. Numerous remote sensing data are applied to monitoring urban expansion with research scales ranging from single city [15] to mega-region [16] or urban corridors [17], from country [18] to continental [19] or even to global [20]. The monitoring frequency ranges from long time periods of up to 45 years mostly at low or medium resolution scales as provided from MODIS or Landsat data to short time periods of only a few years at all scales including VHR data and three-dimensional information [21,22].
The advent of these new, large, and multi-temporal data sets from multi-source remote sensing allows researchers to empirically direct research towards the understanding of the underlying laws of urban settlement patterns [23]. The spatial features of urban settlements on a large scale were explored and analyzed by the existing studies, such as spatial distribution [24], space morphology [25], expansion pattern [26], and regional difference [27]. Furthermore, the various urban settlement patterns were described based on their spatial features. For instance, Taubenböck et al. [28] measured urban settlement patterns in the Pearl River Delta region by developing new dimensions from the perspective of urban landscape; Liu et al. [29] selected ten metrics to quantify the urbanization patterns of 16 mega cities over the world, all selected metrics were landscape metrics; Xu and Min [30] quantified the spatiotemporal patterns of urban expansion in 18 Chinese cities also based on multi landscape metrics.
Urban settlement pattern is the predominant visible result of the described on-going process of urbanization [31]. The formation and development of it is considered influenced by natural, socio-economic, cultural, and political attributes jointly, among others [32]. However, on a large research scale, most existing studies only applied landscape/spatial metrics to quantify the appearance of urban settlement patterns, the underlying features shaping these urban settlement patterns were frequently neglected due to data scarcity or the complexity of the relationships. Thus, it is imperative to utilize a more systemic and comprehensive framework for analyzing various factors and shaping urban settlement patterns.
The expected continuing dynamic urbanization process will change spatial settlement patterns and will foster structural transformation [33], especially for countries such as China, which is currently undergoing rapid urbanization. This study aims to understand China’s urban settlement pattern and its evolution over time in a multidimensional way based on the understanding of the conceptual framework of urban settlement pattern (Section 2). The study links demographic and economic developments, as well as the topographic situations with the dynamics and patterns of spatial urbanization. As a result, the following workflow was developed:
  • An ‘urban development index system’ is established based on indicators of topographic situation, demographic, and economic developments, as well as landscape pattern.
  • Statistical methods for analyzing the underlying relationships between urban settlement patterns and dynamics and the related indicators are applied.
  • Urban settlement patterns are described and its evolutions are analyzed across China during the period of time from the end of the 1980s until 2010.
The framework of this study is structured as follows (Figure 1): Section 3 introduces the study area and all data sources. Section 4 presents the construction of the ‘urban development index system’ for measuring settlement pattern of urban lands based on the different data sets. Beyond this, the section presents the data pre-processing steps and the statistical methods for evaluating settlement patterns. In Section 5 the results on urban settlement patterns and their evolutions in China between the end of the 1980s and the year 2010 are presented. In Section 6, the main driving forces for the settlement evolution and the merits and drawbacks of this ‘urban development index system’ are discussed. Finally, Section 7 concludes the paper with a summary.

2. Conceptual Framework of Urban Settlement Pattern

The development of landscape metrics originates from ecology, and consists of spatial patterning and geographic distribution of organisms [34]. The metrics allow for the characterization of landscape patterns and their effects on ecological processes by using landscape measures and considering the time course [35]. Since the late 1980s, the landscape metrics adopted to quantify organisms were gradually introduced into geographic research for quantifying the landscape structure of geographical elements (such as urban land, cultivated land, etc.) [36]. Subsequently, McGarigal and Marks [37] developed a landscape metric system for the practical applications on geographical elements, which includes sizes, shapes, densities, distances, among other metrics. The landscape characteristics of geographical elements that were widely studied then benefited from this landscape metric system [38,39]. Meanwhile, the concept of ‘spatial pattern’ was developed. According to most existing studies, the general landscape characteristics of geographical elements were considered as their spatial patterns. For instance, the general landscape characteristics of urban settlements such as distributions, morphologies, and sizes are considered as the spatial patterns of urban settlements [28,29,30].
As indicated above, the demographic, economic, social, cultural, and political situations have major influences on urbanization [32]. Although landscape patterns are crucial for measuring urban settlement patterns, it must be noted that urban settlement patterns are the product of multiple factors [40]. Therefore, in the present study, an ‘urban development index system’ was developed for understanding urban settlement patterns in a multidimensional way. Multidimensional is understood here as the synergistic analysis of the evolution of settlement patterns over time in relation to the following multiple possibly influencing factors: Topographical, economic, as well as demographic developments. Urban settlement pattern is understood here as the general spatial characteristics formed by the multiple possibly influencing factors.

3. Study Area and Data Source

3.1. Study Area

According to the ‘Administrative Division of the People’s Republic of China Handbook 2010′, 337 established administrative units are covering the entire country, including four municipalities (Beijing, Tianjin, Shanghai, and Chongqing), 283 prefecture level cities, 17 prefectures, 30 autonomous prefectures, and three leagues. The spatial analysis in this study is based on the 2010 administrative division. Although administrative unities have partly changed since the 1980s, the unchanged divisions were applied as they guarantee the stability and consistency of all calculated indices over time. Hong Kong, Macao, and Taiwan are not taken into consideration because of data absence. For simplification, the term ‘cities’ is used from here on instead of administrative units.

3.2. Data Source

3.2.1. Urban Land

‘Urban lands’ of 337 cities were extracted from the National Land Use/Cover Database of China (NLUD-C) for two-time steps: The end of 1980s and 2010. To do so, the administrative boundaries for 2010 were applied for both time periods. NLUD-C is the main authoritative data source focusing on the status and dynamics of land use/cover since the 1980s in China [41]. It was established based on medium spatial resolution images (30 m) with a scale of 1:100,000. Land use/cover status and dynamics from NLUD-C are mapped via visual interpretation according to a hierarchical classification system. The accuracy for urban land is measured higher than 90% through repeated interpretation and field verification [42].
The thematic class ‘Urban land’ from the NLUD-C is defined as land used for urban settlement from the perspective of ‘land use’; it includes all built-up area in large, medium and small cities, counties and towns. Non-developed lands surrounded by built-up area, such as gardens and parklands, are also included.

3.2.2. Topographic Data

The topographic situation influences the spatial arrangement of urban land patterns [25]. For example, urban land patterns and the expansion of some cities such as Lanzhou or Qinhuangdao are directed by specific topographic situations such as steep, hilly terrains, or water bodies. In this study, digital elevation models (DEM) are used for the evaluation of the topographic situation. The DEM is obtained from ASTER GDEM V2, which is globally available free of cost from the website of Japan Aerospace Exploration Agency (http://www.gdem.aster.ersdac.or.jp). It features a spatial resolution of 30 m and is thus geometrically in line with the land use classification.

3.2.3. Demographic and Socio-Economic Data

Population growth and economic development are the most direct driving forces for urban expansion [43]. Related data are collected from various statistical reports on the basis of the 2010 administrative division, including the ‘China City Statistical Yearbooks (CCSY)’, ‘China Population and Employment Statistics Yearbooks (CESY)’ and ‘provincial statistical yearbooks’ in 1987 and 2010. With the rapid urban development and influences of administrative adjustment, boundaries of some cities changed during the period from the 1980s to 2010. Those cities were identified based on the administrative divisions in the 1980s and in 2010. Statistical data of these dynamic areas are obtained through various provincial statistical yearbooks or urban statistical yearbooks.

4. Urban Development Index System for Evaluating Urban Settlement Pattern and Data Processing

4.1. Urban Development Index System

The evaluation of the interplay of spatial urban land expansion and spatial pattern characteristics, topographic situations, and socio-economic or demographic drivers is challenging, and these factors might not be exhaustive. However, the indicators have been repeatedly cited in the literature as relevant influencing factors.
To reveal potential correlations between these different drivers, an ‘urban development index system’ was created. A selection of attributes was used for the following three categories: ‘topographic situations’, ‘demographic and economic drivers’, and ‘urban landscape characteristics’. Three main principles for the urban development index system establishment were formulated: 1) An even number of metrics were selected per category; 2) all selected metrics directly related to the patterns and dynamics of urban land; 3) metrics were selected per category which target complementary perspectives. The ‘urban development index system’ constructs a frame for evaluating and comparing the individual categories and identifying possible relationships across categories.
Based on these principles mentioned above, the following 12 metrics (four per category) were selected (Table 1): The ‘topographic situation’ is described per city by the metrics average height (AVEDEM) [44] and average slope (AVEslope) [45]. These measures allow the description of the general terrain situation (steep or flat) of urban lands. In addition, the relief amplitude of the terrain (RADEM) [46] and the slope anomaly (SAslope) [47] are used to measure the terrain fluctuation. All metrics are calculated exclusively within the urban lands of the particular time period of a city.
For the ‘socio-economic drivers’ the following metrics were applied: Urban population density (UD) [48] provides information on people per spatial unit and indicates the population capacity of urban lands; urbanization rate (UR) [12] measures the proportion of urban population in the total population in a city and represents the urbanization level; tertiary industry density (TD) [49] measures the economic turnover per unit urban land and indicates the service capacity of urban lands; tertiary industry proportion (TP) [50] measures the importance of service and the structure of economy in a city.
For the ‘landscape characteristics’ category the following metrics describing the patterns of urban lands were selected: Mean patch size (MPS) [51], area weighted mean distance (AWMD) [52], dispersion index (DI) [28], and fractal dimension (FRAC) [53]. MPS measures the average patch size of urban land patches in a city. It is a basic measure of patch size; AWMD measures the average distance between urban land patches in a city. It is a measure to describe the concentration of spatial development; DI measures the structure of urban land patches in a city, i.e., the degree of dispersion is described with small urban patches accounting for a clustered monocentric city and large urban patches accounting for a polycentric or even dispersed pattern; and FRAC measures the complexity of urban land patches in a city, i.e., whether the patch shapes are geometric or of complex shape. The details on all metrics are introduced in Table 1.
These 12 metrics are not exhaustive and other perspectives might add to the analysis. However, these metrics are meaningful variables for approaching the urban system from different perspectives for analyzing multiple aspects of urbanization processes.

4.2. Data Processing

4.2.1. Data Normalization

The 12 selected metrics have different dimensions; for a joint analysis, they were normalized to a common scale. A two-step procedure was applied: First, all index values were normalized by using the Z-score method. Second, the influences of discrete data were eliminated. In this work, 10 classes of each metric were adopted according to its standard deviation (SD), and 10 intensity values from 1 to 10 were assigned (Table 2).

4.2.2. Principal Component Analysis

There is data redundancy in the 12 metrics, therefore, principal component analysis (PCA) was adopted. PCA is a statistical method which aims to reduce the dimensions of metrics and convert multiple metrics into few principal components [54]. After PCA processing, all 12 metrics were recounted for loading most information on the first few principal components and the data redundancies of the 12 metrics were reduced. When carrying out PCA, three steps were applied, including 1) data normalization (Section 4.2.1); 2) calculating a correlation matrix, principal component loading matrix and eigenvalues; 3) principle components screening and nomenclature. Table 3 shows the loading matrix and eigenvalues of the 12 metrics. The first three components are considered as the relevant principal components in this study. They feature high eigenvalues (close to or greater than 2) and load more than 60% information [55] of all 12 metrics. Principal components are named according to the information loading of the 12 metrics. The first principal component mainly indicates the topographic information of urban lands with absolute contributions of AVEDEM, RADEM, AVEslope, and SAslope. The second principal component features a high negative relation to the DI index, and mainly exhibits landscape dispersion. The higher the DI, the lower the value of the second principal component is. The third principal component mainly illustrates the urban population density and the tertiary industry density. Therefore, the three principal components are as follows: 1) Topographic complexity, 2) landscape dispersion, 3) population and economic capacity, respectively.
The mean intensity values of the three principal components are 5.25, 5.37, and 5.48, respectively. To facilitate the qualitative description of the principal components, these 10 intensities were divided equally into five intervals, including [0, 2], [2, 4], [4, 6], [6, 8], and [8, 10], and defined semantically as ‘extremely low’, ‘low’, ‘medium’, ‘high’, and ‘extremely high’ when describing urban lands’ topographic complexity and population and economic capacity, and as ‘extremely high’, ‘high’, ‘medium’, ‘low’, and ‘extremely low’ when describing the landscape dispersion information of urban lands (Table 4).

4.2.3. Cluster Analysis

This study aimed to classify urban lands with differing features of the urban development index system into different categories. Therefore, cluster analysis was implemented based on the principle components of the 12 metrics. A hierarchical clustering method was used and Euclidean distances were applied. There exists no clear and satisfactory method for the identification of the number of appropriate clusters. The number of clusters was set based on four criteria which were presented by Bemirmen [56] using a hierarchical approach: 1) Distances between clusters should be large; 2) the number of clusters should be moderate; 3) the numbers of samples per cluster should be relatively uniform; 4) the same clusters should exist when different clustering methods are adopted.
After the cluster analysis, all cities (urban lands) were classified into different categories based on the principle components. Most of the cities (urban lands) belonging to the same category have similar geographical locations and share common borders. If the cities share a border, those cities were combined into large agglomerations which belong to the same category (Figure 2). More than 80% of agglomerations contained more than five cities, but only two-thirds contained more than six cities. Agglomerations containing less than four cities were considered too detailed to exhibit the laws of urban land patterns. Based on this, two principles were set for rearranging the results of the cluster analysis: 1) Cities which are within the same agglomeration and share a boundary for areas which feature more than or equal to five units were spatially merged, and this merged area was then considered a combined area in the study (Figure 2a,c); 2) the remaining cities that were too disperse to merge with those cities of the same categories and surrounded by combined areas (Figure 2b), were merged into their surrounding combined areas. As a result, 340 cities were recombined into several large agglomerations (regions).

4.3. The Evolution of Settlement Pattern

In this study, the evolution of settlement pattern of urban lands during the 1980s until 2010 are described and analyzed from two aspects: Dynamics of spatial patterns of urban land and dynamics of attributes influencing urban land development. For the analysis of spatial pattern evolutions, the spatial pattern of urban lands in the 1980s and 2010 are overlapped. Subsequently, all zones (combined areas) are rearranged and reclassified into two categories: Zone of unchanged spatial patterns and zone of changing spatial patterns. Urban lands in the former zone maintain the internal identity or similarity of all attributes for both time periods of analysis. This indicates that the spatial distributions of categories of urban lands remain unchanged, but the attributes of these urban lands may change from the 1980s to 2010. Contrarily, urban lands in the zone of changing spatial pattern indicate that the spatial distributions of categories of urban lands changed over the time period and the internal identity or similarity of all attributes altered from 1980s to 2010.

5. Results

5.1. Spatial Urbanization Dynamics and Regional Disparities of Urban Expansion Across China

Urban lands in China expanded dramatically, from 23,642.84 km2 at the end of the 1980s to 68,064.23 km2 in 2010, so overall by 188%. At the national level urban lands nearly doubled over the two decades of monitoring. The general spatial distribution of urban land shows a decreasing trend from the southeastern coastal areas to the northwestern inland areas. Urban land is measured with highest densities for the eastern areas and its expansion was the most dynamic in the large urban agglomerations in the Yangtze River Delta (YRD), Beijing-Tianjin-Hebei region (BTH), and Pearl River Delta (PRD).
Eastern provinces (municipalities) cover less than 10% of the whole national land area, however, 41.84% of all urban lands were concentrated there already at the end of the 1980s; this share increased to 52.28% in 2010. Urban lands have therefore increased 2.63 times in these areas since the 1980s. Western provinces (municipalities) cover more than two-thirds of the whole national land area; however, urban lands covered only 21.45% at the end of the 1980s and that decreased to 17.27% of all urban lands in 2010. The growth rate of urban lands, at 1.32 times, measured significantly slower for the monitored time period. In the central areas and the northeastern areas urban lands increased 1.62 times and 0.99 times, respectively during the monitored time period. In general, the proportion and growth speed of urban lands reveals large regional differences in China.

5.2. Urban Categories in the End of 1980s and 2010

This study found that the developed ‘urban development index’ values changed considerably within the time period from the late 1980s until 2010. This is especially true for the population and economy capacity, followed by the landscape dispersion. The topographic complexity did not change significantly although expanding urban lands settled in new regions. 340 cities were classified into nine categories in the 1980s; however only seven categories were classified in 2010 for two reasons: First, the same Euclidean distance between different categories was set as threshold according to the Bemirmen criteria [56]; second, the differences of the ‘urban development index’ values between different cities decreased from the 1980s to 2010.
The characteristics of each category were presented by the mean values of the three principle components (topographic complexity, landscape dispersion, and population and economic capacity). The values of principle components of each category were further semantically described by ‘extremely high’, ‘high’, ‘medium’, ‘low’, and ‘extremely low’ for interpretation. Ultimately, all categories were described by their prominent features for understanding, the description priorities are given to altitude and population (Table 5).

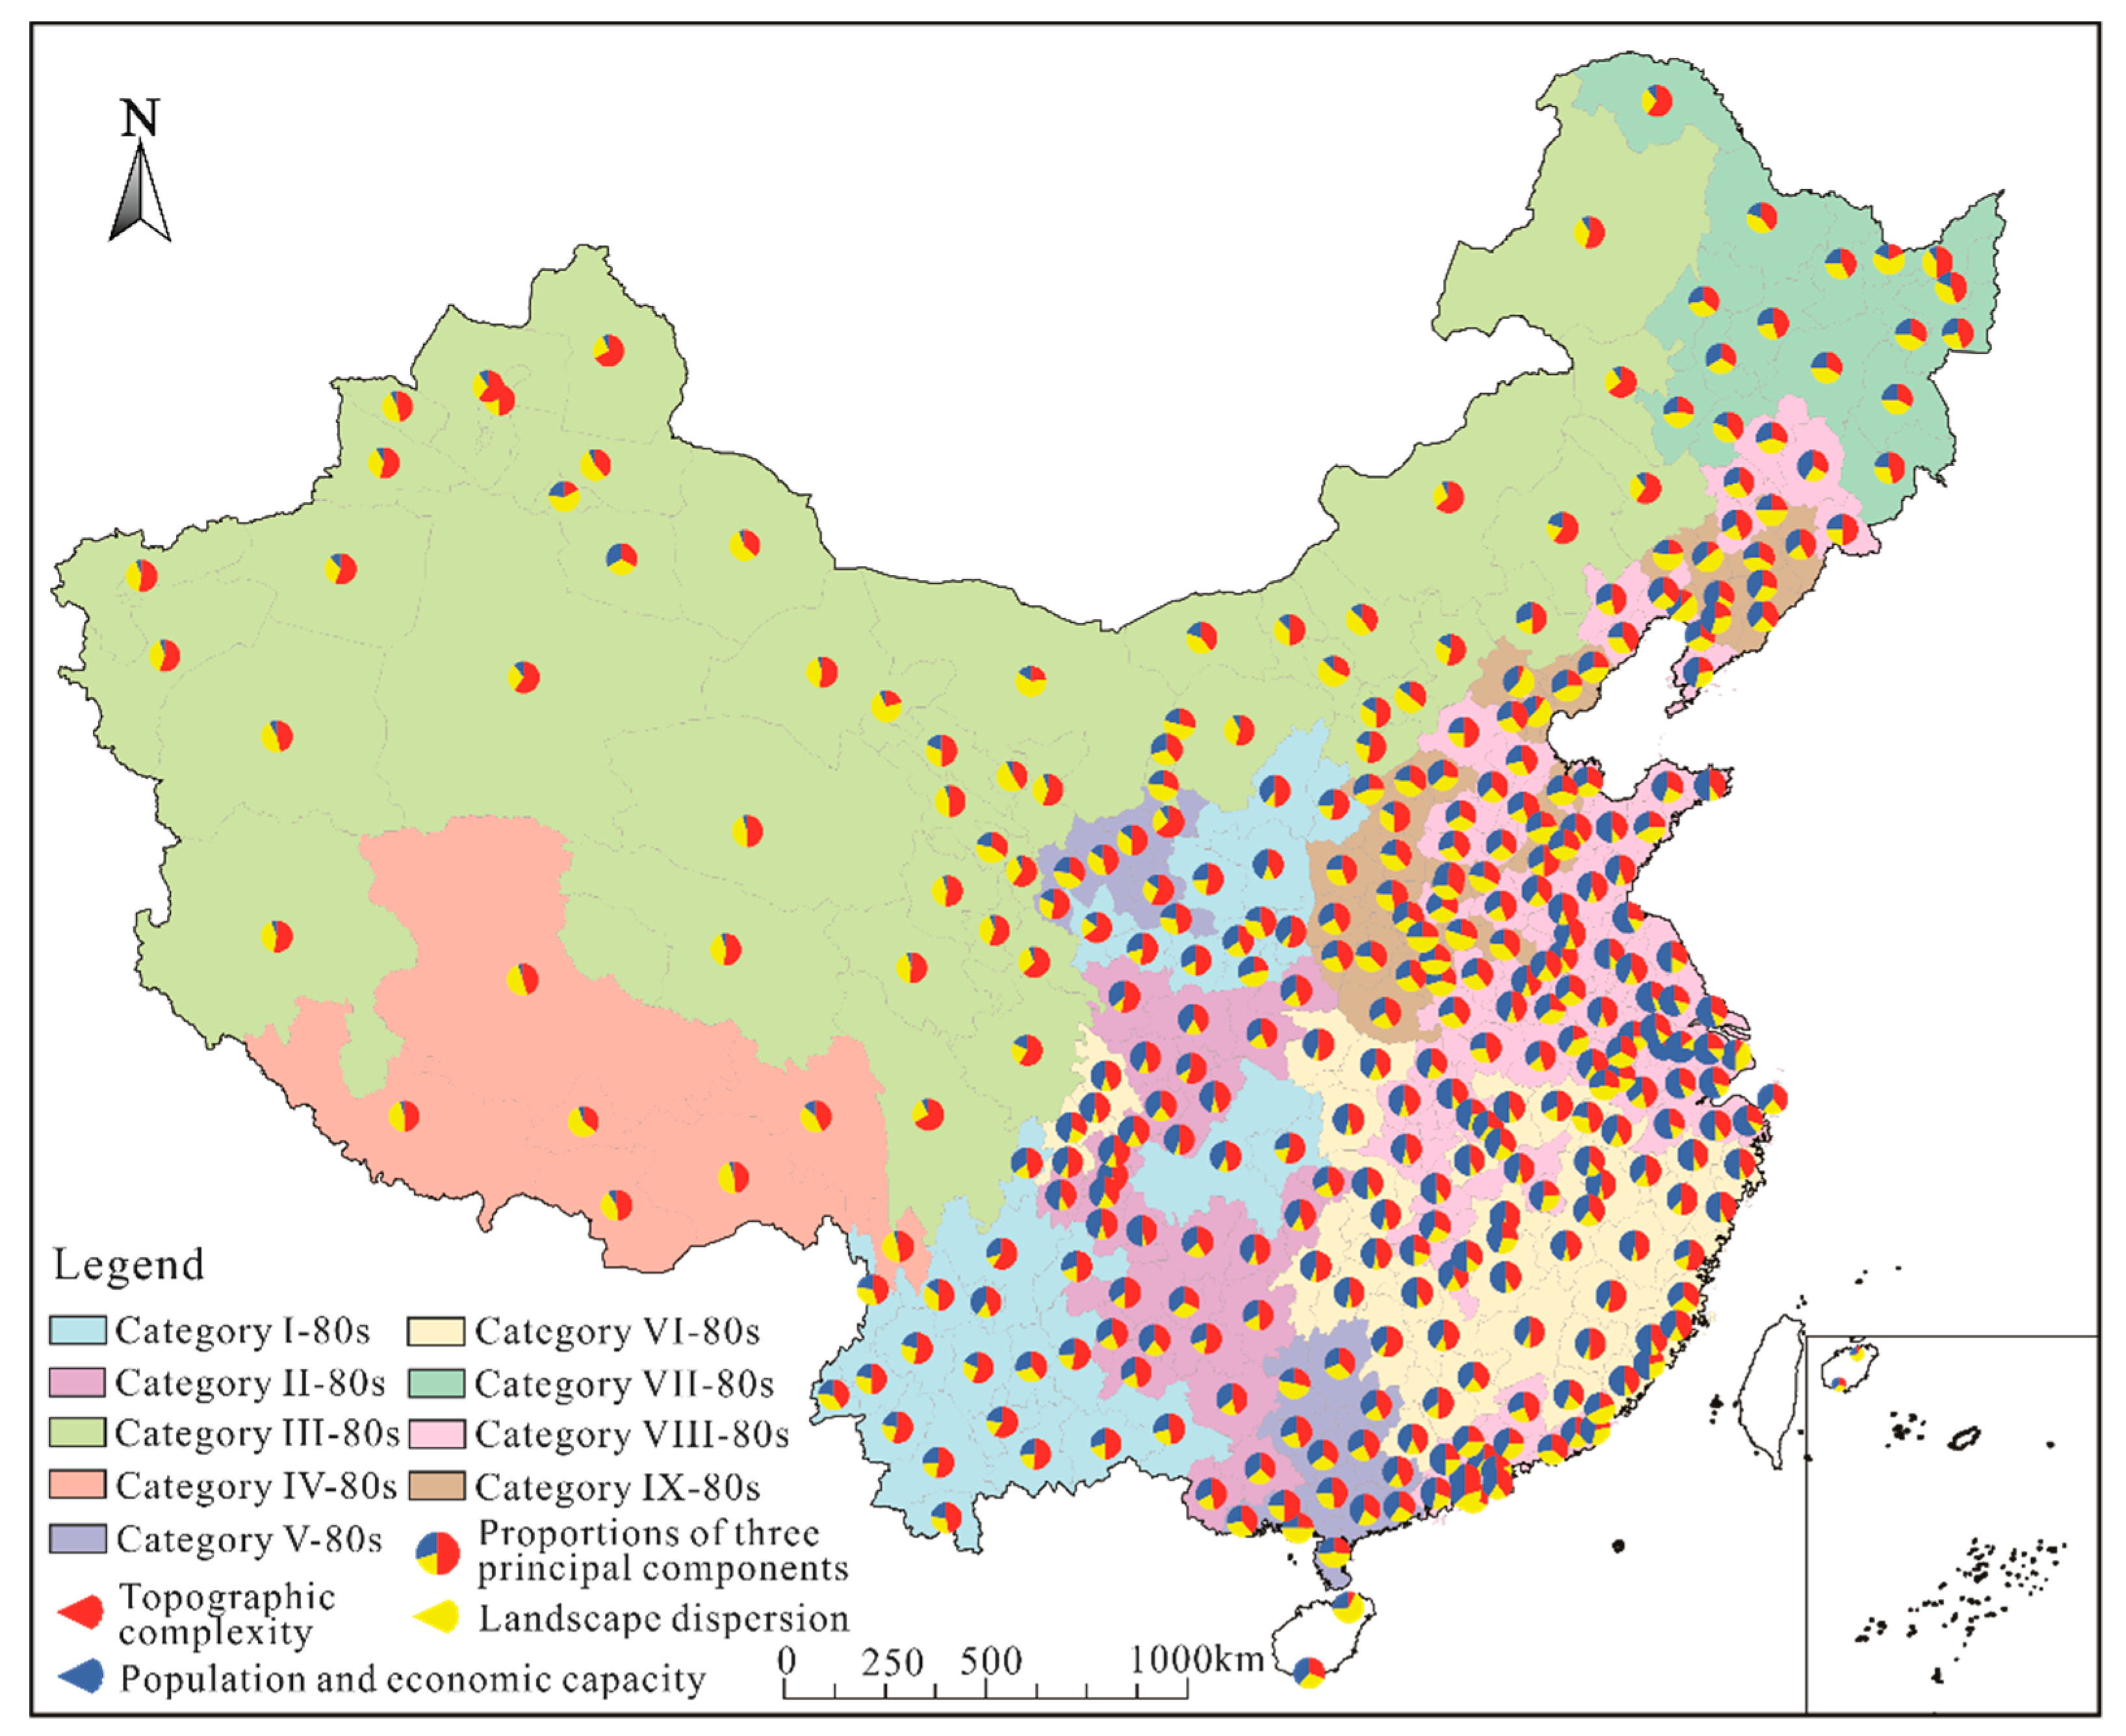
5.3. The Spatial Distributions of Urban Categories in the End of 1980s and 2010

The spatial distributions of urban settlement categories in the end of 1980s and 2010 are shown in Figure 3 and Figure 4. Urban settlements in different categories in the two figures correspond to the categories in Table 5.
The dynamic and disparity of population and economic capacity is the highest during the end of the 1980s and 2010, followed by landscape dispersion and topographic complexity. The temporal changes of urban settlement pattern show that more homogeneous attributes of urban settlement are measured in 2010 than in the 1980s. In other words, the disparity of the attributes of urban lands in the 1980s is more remarkable than in 2010.
In general, the comparison of categories of urban settlement across the country reveals that the northwestern region features homogeneous attributes while in the southeastern region of China more variable attributes of urban settlement are measured. Therefore, fewer categories and simple patterns of urban settlement are found in the northwestern region of China, but multiple categories and complex patterns of urban settlement characterize the southeastern region of China.
Topographic complexity of urban settlements is the highest in the southwestern of China, because of its complex terrain and landform. The landscape dispersion of urban settlements in central and coastal provinces is the highest. In western inland areas or metropolitan regions, the dispersion is generally low. Population and economic capacity of urban settlements in the southwestern and southeastern coastal region of China is significantly higher than that in other regions.

5.4. Evolutions of Settlement Pattern of Urban Lands during 1980s and 2010

According to Section 4.3, seven geographic zones across China were found where settlement patterns were relatively constant (they are named A, B, C, G, J, O, and Q, respectively) and there were ten zones, which featured changing settlement pattern (they are named D, E, F, H, I, K, L, M, N, and P, respectively) (Table 6). The stable regions are mainly found in the western regions, while the changing regions are mainly located in the central, eastern, and northeast regions (Figure 5).
The study shows that the topographic complexities of urban settlements are generally the highest in western regions of China. Although urban expansion took place, the newly developed land did not alter the topographic complexity in the period of monitoring. The area covers zones A, B, C, E, and F. In contrast, the topographic complexities of urban settlements are generally the lowest in eastern coastal low-lands of China. They are measured unchanged or with moderate decrease. The involved area covers zone J, K, M, and O. Topographic complexities of urban settlements in central and northeast regions are generally at a medium level, and switch back and forth between low and high.
The evolution of urban landscape dispersion is generally highest in central China and in parts of the eastern regions, covering zones L, M, N, and K. Landscape dispersions in Xizang and Qinghai (zone B and C) featured the lowest values on the national scale. Landscape dispersions in other regions are moderate.
Finally, population and economic capacity of urban settlements generally were the highest in the southwestern regions and in parts of the northwestern regions of China; however, with only moderate changes since the 1980s. This covers zone D, E, and F. Urban settlements with medium population and economic capacity are generally in coastal areas north of the Yangtze River (zone K), but with high population and economic capacity in coastal areas south of the Yangtze River (zone M and O). Population and economic capacities of urban settlements in Xizang, Qinghai, Xinjiang, and Inner Mongolia (zone A, B, C, and G) are the lowest and generally with moderate increase.

6. Discussion

The dynamic change of China’s urban settlement pattern has been proven during the past few decades accompanying the fast rapid of urban growth and urbanization process [57]. The urban settlement pattern and its evolution were frequently analyzed and understood from the perspective of urban landscape pattern [28,29,30]. However, the urban settlement patterns described by the existing studies are landscape patterns rather than the settlement patterns shaped by many underlying features. Against this background, this study comprehensively considered the attributes of urban settlement and took not only landscape characteristics but also natural and socio-economic attributes into account [58]. Twelve typical urban development indices were selected for establishing an ‘urban development index system’ (see Table 1). In order to meet the spatial analysis of this study, all selected indices were set with exact spatial matching with urban lands [59]. Ultimately, the urban settlement patterns and their evolutions during the end of 1980s and 2010 were described and analyzed using a series of statistical methods. However, the ‘urban development index system’ developed by this study has some limitations. The system construction is restricted by both accessibility of data and workloads on a national scale, various indices are simplified and only twelve typical indices are selected. The essential changes for revealing the urban settlement pattern would not be affected, however, the abundant and detailed information about urban settlement attributes will be missed and settlement pattern evolutions on a small scale are difficult to interpret.
Several notable characteristics of China’s urban settlement patterns and their evolution were discovered by this study. First, population and economic capacity of urban settlements in the southwestern and southeastern coastal regions of China is significantly high. The terrain in the southwestern region is extremely variable and there is not enough suitable space for urban expansion [60]. As a consequence, the population and economic capacity of urban settlements is high [61]. On the other hand, the southeastern coastal region is the most developed region in China, with population and economy highly concentrated in this region [62]. Therefore, the population and economic capacity of urban settlements is also high. Second, the urban settlement pattern in the northwestern region of China measured as very simple for the two-time intervals: The end of the 1980s and 2010. On the contrary, the urban settlement patterns in eastern and central regions of China are very complex. It may partly explain why there are so many urban agglomerations and economic zones in eastern and central regions of China [63]. Third, the zones of changing urban settlement pattern centralize mainly in eastern and central areas of China; population and economic capacity present the most distinct dynamics in these zones [64], followed by landscape dispersion. Therefore, the influence of population and economic capacity on the evolutions of urban settlement pattern is considered the most powerful, followed by landscape dispersion, with topographic complexity having the weakest influence.
There are some problems with population and economic data processing and landscape pattern application which need to be solved or improved. For instance, the statistical yearbook is the main data source of population and economic data. However, the frequent adjustment of administrative divisions makes exact spatial matching between statistical data and urban lands difficult [65]. In addition to this, it is difficult to maintain the same statistic caliber on a large research scale and within a long-time sequence. The complexity of the data source, different statistic calibers, and incompleteness of statistical data will cause a loss of accuracy of statistical data spatialization [66]. Therefore, how to overcome the defects of statistical data and improve the precision of statistical data spatialization needs to be a focus in geography studies.
As landscape pattern is an important part of spatial pattern, various landscape metrics are applied to describe the landscape patterns. FRAGSTATS is a computer software program designed to compute a wide variety of landscape metrics for categorical map landscape patterns [37]. It is authoritative and popular in geographical and ecological studies [38,39]. However, in practical application, it was found that the current landscape metrics are unable to meet the needs of current research. Many studies gradually explore landscape characteristics by improving existing landscape metrics or even developing new landscape metrics [67]. This study improved a landscape metric (AWMD) to avoid the effects from administrative boundaries and small discrete urban patches, and further applied a new landscape metric (DI) to discover the characteristics of urban landscape in-depth. Exploring and developing more innovative and improved landscape metrics should be a pressing need for future landscape pattern studies.

7. Conclusions

Urban settlement patterns and their evolutions across China during the end of 1980s and 2010 are described and analyzed based on the developed ‘urban development index system’ by processing a series of statistical steps. Urban settlements of China were classified into nine categories in the end of 1980s but seven categories in 2010 by cluster analysis based on the three principal components (topographic complexity, landscape dispersion, and population and economic capacity). The spatial distribution of these categories indicates that urban settlements in the western region featured integrated patterns and homogeneous attributes, followed by the eastern region, while urban settlements in central and northeast regions featured relatively complex patterns and various attributes; urban settlements with unchanging patterns during 1980s and 2010 were mainly located in the western region, while urban settlements with changing patterns were primarily located in the eastern and central regions. Furthermore, the population and economic capacity was discovered as the main driving force of the dynamic of urban settlement patterns, followed by the landscape dispersion.
All the results of this study present the general spatial characteristics of China’s urban settlements formed by the multiple possibly influencing factors and their spatio-temporal evolution, which can establish a foundation for scientifically recognizing the urbanization process in China from space. For instance, urban settlements with the same pattern presented obvious spatial aggregation in distribution from the 1980s to 2010, which is found corresponding to the division of several emerging urban agglomerations, such as the Central Plains Urban Agglomeration, the Chengdu-Chongqing City Group, and the Triangle of Central China. This discovery can be a reference for understanding the evolution process of these emerging urban agglomerations during the past few decades. Furthermore, the evolution of urban settlements in China’s eastern region and the main driving force discovered by this study can be a reference for formulating development planning programs for the developed Coastal Economic Zone. Last but not least, the series of fixed statistical methods used to describe China’s urban settlement pattern from the 1980s to 2010 is also able to describe China’s urban settlement pattern after 2010 as long as the data is available.

Author Contributions

Conceptualization, L.S. and T.Z.; Methodology, L.S.; Writing—original draft preparation, L.S.; Writing—review and editing, T.Z.

Funding

This research was funded by the National Natural Science Foundation of China, grant number 41901230 and China Postdoctoral Science Foundation, grant number 2019M651775.

Conflicts of Interest

The authors declare no conflict of interest.

References

  1. Lian, H.; Lejano, R.P. Interpreting institutional fit: Urbanization, development, and China’s “land-lost”. World Dev. 2014, 61, 1–10. [Google Scholar] [CrossRef]
  2. Wang, X.R.; Hui, E.C.M.; Choguill, C.; Jia, S.H. The new urbanization policy in China: Which way forward? Habitat Int. 2015, 47, 279–284. [Google Scholar] [CrossRef]
  3. United Nations. Department of Economic and Social Affairs, Population Division, 2018. 2018 Revision of the World Urbanization Prospects. Available online: https://www.un.org/development/desa/publications/2018-revision-of-world-urbanization-prospects.html. (accessed on 5 October 2019).
  4. Angel, S.; Parent, J.; Civco, D.L.; Blei, A.; Potere, D. The dimensions of global urban expansion: Estimates and projections for all countries, 2000–2050. Prog. Plann. 2011, 75, 53–107. [Google Scholar] [CrossRef]
  5. Seto, K.C.; Fragkias, M.; Güneralp, B. A meta-analysis of global urban land expansion. PLoS ONE 2011, 6, e23777. [Google Scholar] [CrossRef] [PubMed]
  6. Ye, L.; Wu, A.M. Urbanization, land development, and land financing: Evidence from chinese cities. J. Urban Aff. 2014, 36, 354–368. [Google Scholar] [CrossRef]
  7. Ren, X. From Chicago to China and India: Studying the City in the Twenty-First Century. Annu. Rev. Sociol. 2018, 44, 497–513. [Google Scholar] [CrossRef]
  8. Shi, L.; Zhang, Z.; Liu, F.; Zhao, X.; Wang, X.; Liu, B.; Hu, S.; Wen, Q.; Zuo, L.; Yi, L.; et al. City size distribution and its spatiotemporal evolution in China. Chin. Geogr. Sci. 2016, 26, 703–714. [Google Scholar] [CrossRef]
  9. Ren, X. Urban China; Polity Press: Cambridge, UK, 2013. [Google Scholar]
  10. Wang, L.; Zhu, J.; Xu, Y.; Wang, Z. Urban built-up area boundary extraction and spatial-temporal characteristics based on land surface temperature retrieval. Remote Sens. 2018, 10, 473. [Google Scholar] [CrossRef]
  11. Lin, X.; Wang, Y.; Wang, S.; Wang, D. Spatial differences and driving forces of land urbanization in China. J. Geogr. Sci. 2015, 25, 545–558. [Google Scholar] [CrossRef]
  12. Chen, M.; Liu, W.; Lu, D. Challenges and the way forward in China’s new-type urbanization. Land Use Policy 2016, 55, 334–339. [Google Scholar] [CrossRef]
  13. Shi, L.; Taubenböck, H.; Zhang, Z.; Liu, F.; Wurm, M. Urbanization in China from the end of 1980s until 2010–spatial dynamics and patterns of growth using EO-data. Int. J. Digit. Earth 2019, 12, 78–94. [Google Scholar] [CrossRef]
  14. Wang, P.; Huang, C.; de Colstoun, E.C.B. Mapping 2000–2010 impervious surface change in India using global land survey Landsat data. Remote Sens. 2017, 9, 366. [Google Scholar] [CrossRef]
  15. Chen, J.; Chang, K.T.; Karacsonyi, D.; Zhang, X. Comparing urban land expansion and its driving factors in Shenzhen and Dongguan, China. Habitat Int. 2014, 43, 61–71. [Google Scholar] [CrossRef]
  16. Taubenböck, H.; Esch, T.; Felbier, A.; Wiesner, M.; Roth, A.; Dech, S. Monitoring urbanization in mega cities from space. Remote Sens. Environ. 2012, 117, 162–176. [Google Scholar] [CrossRef]
  17. Georg, I.; Blaschke, T.; Taubenböck, H. A global inventory of urban corridors based on perceptions and night-time light imagery. ISPRS Int. J. Geo-Inf. 2016, 5, 233. [Google Scholar] [CrossRef]
  18. Xiao, P.; Wang, X.; Feng, X.; Zhang, X.; Yang, Y. Detecting China’s urban expansion over the past three decades using nighttime light data. IEEE J. Sel. Top. Appl. Earth Obs. Remote Sens. 2014, 7, 4095–4106. [Google Scholar] [CrossRef]
  19. Taubenböck, H.; Weigand, M.; Esch, T.; Staab, J.; Wurm, M.; Mast, J.; Dech, S. A new ranking of the world’s largest cities—Do administrative units’ obscure morphological realities? Remote Sens. Environ. 2019, 232, 111353. [Google Scholar] [CrossRef]
  20. Chen, Z.; Yu, B.; Zhou, Y.; Liu, H.; Yang, C.; Shi, K.; Wu, J. Mapping Global Urban Areas from 2000 to 2012 Using Time-Series Nighttime Light Data and MODIS Products. IEEE J. Sel. Top. Appl. Earth Obs. Remote Sens. 2019, 12, 1143–1153. [Google Scholar] [CrossRef]
  21. Wang, M.; He, G.; Zhang, Z.; Wang, G.; Zhang, Z.; Cao, X.; Wu, Z.; Liu, X. Comparison of spatial interpolation and regression analysis models for an estimation of monthly near surface air temperature in China. Remote Sens. 2017, 9, 1278. [Google Scholar] [CrossRef]
  22. Huang, B.; Zhao, B.; Song, Y. Urban land-use mapping using a deep convolutional neural network with high spatial resolution multispectral remote sensing imagery. Remote Sens. Environ. 2018, 214, 73–86. [Google Scholar] [CrossRef]
  23. Liu, F.; Zhang, Z.; Shi, L.; Zhao, X.; Xu, J.; Yi, L.; Liu, B.; Wen, Q.; Hu, S.; Wang, X.; et al. Urban expansion in China and its spatial-temporal differences over the past four decades. J. Geogr. Sci. 2016, 26, 1477–1496. [Google Scholar] [CrossRef]
  24. Merkens, J.L.; Vafeidis, A.T. Using information on settlement patterns to improve the spatial distribution of population in coastal impact assessments. Sustainability 2018, 10, 3170. [Google Scholar] [CrossRef]
  25. Taubenböck, H.; Kraff, N.J.; Wurm, M. The morphology of the Arrival City—A global categorization based on literature surveys and remotely sensed data. Appl. Geogr. 2018, 92, 150–167. [Google Scholar] [CrossRef]
  26. Zheng, W.; Shen, G.Q.; Wang, H.; Hong, J.; Li, Z. Decision support for sustainable urban renewal: A multi-scale model. Land Use Policy 2017, 69, 361–371. [Google Scholar] [CrossRef]
  27. Zhang, Z.X.; Wen, Q.K.; Liu, F.; Zhao, X.L.; Liu, B.; Xu, J.Y.; Yi, L.; Hu, S.G.; Wang, X.; Zuo, L.J.; et al. Urban expansion in China and its effect on cultivated land before and after initiating “Reform and Open Policy”. Sci. China Earth Sci. 2016, 59, 1930–1945. [Google Scholar] [CrossRef]
  28. Taubenböck, H.; Wiesner, M.; Felbier, A.; Marconcini, M.; Esch, T.; Dech, S. New dimensions of urban landscapes: The spatio-temporal evolution from a polynuclei area to a mega-region based on remote sensing data. Appl. Geogr. 2014, 47, 137–153. [Google Scholar] [CrossRef]
  29. Liu, Z.; He, C.; Wu, J. General spatiotemporal patterns of urbanization: An examination of 16 world cities. Sustainability 2016, 8, 41. [Google Scholar] [CrossRef]
  30. Xu, X.; Min, X. Quantifying spatiotemporal patterns of urban expansion in China using remote sensing data. Cities 2013, 35, 104–113. [Google Scholar] [CrossRef]
  31. Generaal, E.; Timmermans, E.J.; Dekkers, J.E.C.; Smit, J.H.; Penninx, B.W.J.H. Not urbanization level but socioeconomic, physical and social neighbourhood characteristics are associated with presence and severity of depressive and anxiety disorders. Psychol. Med. 2019, 49, 149–161. [Google Scholar] [CrossRef]
  32. Gu, C. Urbanization: Processes and driving forces. Sci. China Earth Sci. 2019, 62, 1351–1360. [Google Scholar] [CrossRef]
  33. Zhang, Q.; Su, S. Determinants of urban expansion and their relative importance: A comparative analysis of 30 major metropolitans in China. Habitat Int. 2016, 58, 89–107. [Google Scholar] [CrossRef]
  34. Turner, M.G. Landscape ecology: The effect of pattern on process. Annu. Rev. Ecol. Syst. 1989, 20, 171–197. [Google Scholar] [CrossRef]
  35. Gieras, J.F. Superconducting electrical machines-State of the art. Organ. 2009, 12, 9. [Google Scholar]
  36. Riitters, H.K.; O’Neill, R.V.; Hunsaker, C.T.; Wickham, J.D.; Yankee, D.H.; Timmins, S.P.; Jonets, K.B.; Jackson, B.L. A factor analysis of landscape pattern and structure metrics. Landsc. Ecol. 1995, 10, 23–39. [Google Scholar] [CrossRef]
  37. Mcgarigal, K.; Marks, B.J. Spatial pattern analysis program for quantifying landscape structure. Gen. Tech. Rep. 1995, 351, 1–122. [Google Scholar]
  38. Asgarian, A.; Amiri, B.J.; Sakieh, Y. Assessing the effect of green cover spatial patterns on urban land surface temperature using landscape metrics approach. Urban Ecosyst. 2015, 18, 209–222. [Google Scholar] [CrossRef]
  39. Grafius, D.R.; Corstanje, R.; Harris, J.A. Linking ecosystem services, urban form and green space configuration using multivariate landscape metric analysis. Landsc. Ecol. 2018, 33, 557–573. [Google Scholar] [CrossRef] [Green Version]
  40. Tan, M.; Li, X. The changing settlements in rural areas under urban pressure in China: Patterns, driving forces and policy implications. Landsc. Urban Plan. 2013, 120, 170–177. [Google Scholar] [CrossRef]
  41. Jiyuan, L.; Wenhui, K.; Zengxiang, Z.; Xinliang, X.; Yuanwei, Q.; Jia, N.; Wancun, Z.; Shuwen, Z.; Rendong, L.; Changzhen, Y.; et al. Spatiotemporal characteristics, patterns, and causes of land-use changes in China since the late 1980s. J. Geogr. Sci. 2014, 24, 195–210. [Google Scholar]
  42. Zhang, Z.; Wang, X.; Zhao, X.; Liu, B.; Yi, L.; Zuo, L.; Wen, Q.; Liu, F.; Xu, J.; Hu, S. A 2010 update of National Land Use/Cover Database of China at 1:100000 scale using medium spatial resolution satellite images. Remote Sens. Environ. 2014, 149, 142–154. [Google Scholar] [CrossRef]
  43. Xu, Q.; Zheng, X.; Zhang, C. Quantitative analysis of the determinants influencing urban expansion: A case study in Beijing, China. Sustainability 2018, 10, 1630. [Google Scholar] [CrossRef] [Green Version]
  44. Linard, C.; Tatem, A.J.; Gilbert, M. Modelling spatial patterns of urban growth in Africa. Appl. Geogr. 2013, 44, 23–32. [Google Scholar] [CrossRef] [PubMed]
  45. Sakieh, Y.; Amiri, B.J.; Danekar, A.; Feghhi, J.; Dezhkam, S. Simulating urban expansion and scenario prediction using a cellular automata urban growth model, SLEUTH, through a case study of Karaj City, Iran. J. Hous. Built Environ. 2015, 30, 591–611. [Google Scholar] [CrossRef]
  46. Liu, J.; Zhang, G.; Zhuang, Z.; Cheng, Q.; Gao, Y.; Chen, T.; Huang, Q.; Xu, L.; Chen, D. A new perspective for urban development boundary delineation based on SLEUTH-InVEST model. Habitat Int. 2017, 70, 13–23. [Google Scholar] [CrossRef]
  47. Nolesini, T.; Frodella, W.; Bianchini, S.; Casagli, N. Detecting slope and urban potential unstable areas by means of multi-platform remote sensing techniques: The volterra (Italy) case study. Remote Sens. 2016, 8, 746. [Google Scholar] [CrossRef] [Green Version]
  48. Jiao, L. Urban land density function: A new method to characterize urban expansion. Landsc. Urban Plan. 2015, 139, 26–39. [Google Scholar] [CrossRef]
  49. Tian, L.; Ge, B.; Li, Y. Impacts of state-led and bottom-up urbanization on land use change in the peri-urban areas of Shanghai: Planned growth or uncontrolled sprawl? Cities 2017, 60, 476–486. [Google Scholar] [CrossRef]
  50. You, H.; Yang, X. Urban expansion in 30 megacities of China: Categorizing the driving force profiles to inform the urbanization policy. Land Use Policy 2017, 68, 531–551. [Google Scholar] [CrossRef]
  51. Fang, C.; Li, G.; Wang, S. Changing and Differentiated Urban Landscape in China: Spatiotemporal Patterns and Driving Forces. Environ. Sci. Technol. 2016, 50, 2217–2227. [Google Scholar] [CrossRef]
  52. Ramachandra, T.V.; Bharath, A.H.; Sowmyashree, M.V. Monitoring urbanization and its implications in a mega city from space: Spatiotemporal patterns and its indicators. J. Environ. Manage. 2015, 148, 67–81. [Google Scholar] [CrossRef]
  53. Benza, M.; Weeks, J.R.; Stow, D.A.; López-Carr, D.; Clarke, K.C. A pattern-based definition of urban context using remote sensing and GIS. Remote Sens. Environ. 2016, 183, 250–264. [Google Scholar] [CrossRef] [PubMed] [Green Version]
  54. Jollife, I.T.; Cadima, J. Principal component analysis: A review and recent developments. Philos. Trans. R. Soc. A Math. Phys. Eng. Sci. 2016, 374. [Google Scholar] [CrossRef] [PubMed]
  55. Kano, M.; Hasebe, S.; Hashimoto, I.; Ohno, H. A new multivariate statistical process monitoring method using principal component analysis. Comput. Chem. Eng. 2001, 25, 1103–1113. [Google Scholar] [CrossRef]
  56. Norusis, M. SPSS 16.0 Advanced Statistical Procedures Companion; Prentice Hall Press: New York, NY, USA, 2008. [Google Scholar]
  57. Liu, F.; Zhang, Z.; Zhao, X.; Wang, X.; Zuo, L.; Wen, Q.; Yi, L.; Xu, J.; Hu, S.; Liu, B. Chinese cropland losses due to urban expansion in the past four decades. Sci. Total Environ. 2019, 650, 847–857. [Google Scholar] [CrossRef]
  58. Ren, X. Governing the Informal: Housing Policies Over Informal Settlements in China, India, and Brazil. Hous. Policy Debate 2018, 28, 79–93. [Google Scholar] [CrossRef]
  59. Dahal, K.R.; Chow, T.E. Characterization of neighborhood sensitivity of an irregular cellular automata model of urban growth. Int. J. Geogr. Inf. Sci. 2015, 29, 475–497. [Google Scholar] [CrossRef]
  60. Liu, M.; Xu, X.; Sun, A.Y.; Wang, K.; Yue, Y.; Tong, X.; Liu, W. Evaluation of high-resolution satellite rainfall products using rain gauge data over complex terrain in southwest China. Theor. Appl. Climatol. 2014, 119, 203–219. [Google Scholar] [CrossRef]
  61. Qu, W.; Zhao, S.; Sun, Y. Spatiotemporal patterns of urbanization over the past three decades: A comparison between two large cities in Southwest China. Urban Ecosyst. 2014, 17, 723–739. [Google Scholar] [CrossRef]
  62. Shi, L.; Liu, F.; Zhang, Z.; Zhao, X.; Liu, B.; Xu, J.; Wen, Q.; Yi, L.; Hu, S. Spatial differences of coastal urban expansion in China from 1970s to 2013. Chin. Geogr. Sci. 2015, 25, 389–403. [Google Scholar] [CrossRef]
  63. Xu, M.; He, C.; Liu, Z.; Dou, Y. How Did Urban Land Expand in China between 1992 and 2015? A Multi-Scale Landscape Analysis. PLoS ONE 2016, 11, e0154839. [Google Scholar] [CrossRef] [Green Version]
  64. Wang, G.; Wang, M.; Wang, J.; Yang, C. Spatio-temporal characteristics of rural economic development in eastern coastal China. Sustainability 2015, 7, 1542–1557. [Google Scholar] [CrossRef] [Green Version]
  65. Wang, K.; Qi, W. Space-time relationship between urban municipal district adjustment and built-up area expansion in China. Chin. Geogr. Sci. 2017, 27, 165–175. [Google Scholar] [CrossRef]
  66. Zhang, K.H.; Song, S. Rural-urban migration and urbanization in China: Evidence from time-series and cross-section analyses. China Econ. Rev. 2003, 14, 386–400. [Google Scholar] [CrossRef]
  67. Lausch, A.; Blaschke, T.; Haase, D.; Herzog, F.; Syrbe, R.U.; Tischendorf, L.; Walz, U. Understanding and quantifying landscape structure—A review on relevant process characteristics, data models and landscape metrics. Ecol. Model. 2015, 295, 31–41. [Google Scholar] [CrossRef]
Figure 1. Framework and workflow of this study.
Sustainability 11 06704 g001
Figure 2. Diagrammatic sketch of agglomeration rearrangement: (a) all cities within the same agglomeration are merged; (b) remaining city is surrounded by combined area; (c) border exists between different combined areas.
Sustainability 11 06704 g002
Figure 3. Spatial distribution of urban land categories in the end of 1980s.
Sustainability 11 06704 g003
Figure 4. Spatial distribution of urban land categories in 2010.
Sustainability 11 06704 g004
Figure 5. Dynamics of settlement patterns of urban lands during 1980s and 2010.
Sustainability 11 06704 g005
Table 1. Specific metrics used for the urban development index system.
Index CategoriesIndex NameDescriptionUnitsRange
Topographic situationsAverage DEM (AVEDEM) [44]Average DEM of urban lands in one cityMeterAVEDEM > 0
Relief amplitude of DEM (RADEM) [46]Standard deviation of DEM of urban lands in one cityMeterRADEM > 0
Average slope (AVEslope) [45]Average slope of urban lands in one cityDegreeAVEslope > 0
Slope anomaly (SAslope) [47]Standard deviation of slope of urban lands in one cityDegreeSAslope > 0
Socio- economic driversUrban population density (UD) [48] UD = Urban   population Urban   land   area
(It is used for measuring the population capacity of per unit urban area in a city)
10,000 people/km2UD > 0
Urbanization rate (UR) [12] UR = Urban   population Total   population
(It is used for measuring the urbanization level of a city)
Percent0 ≤ UR ≤ 100
Tertiary industry density (TD) [49] TD = Tertiary   industry   value Urban   land   area
(It is used for measuring the service capacity of per unit urban area in a city)
10,000 yuan/km2TD > 0
Tertiary industry proportion (TP) [50] TP = Tertiary   industry   value Gross   domestic   product
(It is used for measuring the structure of economy in a city)
Percent0 ≤ TP ≤ 100
Landscape characteristicsMean patch size (MPS) [51] MPS = i = 1 n a i / n
(It is used for measuring the average patch size of urban land patches in a city)
km2MPS > 0
Area weighted mean distance (AWMD) [52]X = ( i = 1 n a i · x i ) /A; Y = ( i = 1 n a i · y i ) /A;
AWMD = i = 1 n a i ( x i X ) 2 + ( y i Y ) 2 / A
(It is used for measuring the average distance between urban land patches in a city)
kmAWMD > 0
Dispersion index (DI) [28]MLPI = n m a x i = 1 a i / A ; NPnorm = n 1 10 A 1 × 100%
MLPInorm = M L P I 1 10 A 1 1 10 A × 100%;
DI = N P n o r m + ( 100 M L P I n o r m ) 2
(If the DI values approach 100 the number of patches is high and the dominance of the largest patch is very low, if the DI values approach 0 the number of patches is low and the largest patch is integrating almost the entire urban landscape.)
None0 ≤ DI ≤ 100
Fractal dimension (FRAC) [53]FRAC = 2/ [ i = 1 n ( l n p i · l n a i ) 1 n i = 1 n p i i = 1 n a i i = 1 n l n p i 2 1 n ( i = 1 n l n p i ) 2 ]
(If the FRAC values approach 1 the urban patches with very simple and regular outlines, if the FRAC values approach 2 the urban patches with very complex and convoluted outlines)
None1 < FRAC < 2
Note: A and n are the total area and total number of urban land patches, respectively; xi and yi are the abscissa and ordinate of urban land patch i, respectively; ai and pi are the area and perimeter of urban land patch i, respectively.
Table 2. Interval divisions of normalized indices
ClassInterval DivisionIntensity ValueClassInterval DivisionIntensity Value
Class 1(−∞, −2)1Class 6(0, 0.5)6
Class 2(−2, −1.5)2Class 7(0.5, 1)7
Class 3(−1.5, −1)3Class 8(1, 1.5)8
Class 4(−1, −0.5)4Class 9(1.5, 2)9
Class 5(−0.5, 0)5Class 10(2, +∞)10
Table 3. Total variance explanation and component matrix.
ComponentInitial EigenvalueIndexComponent
EigenvaluesVariance PercentageCumulative Percentage123
13.2827.3027.30AVEDEM0.670.40−0.40
22.1317.7845.08RADEM0.760.17−0.20
31.9916.5861.66AVEslope0.810.150.42
41.3311.0672.72SAslope0.750.150.46
50.796.5679.27UD0.42−0.100.69
60.584.8584.13UR−0.390.450.28
70.544.5388.66TD−0.130.380.76
80.453.7192.36TP−0.010.270.13
90.352.8995.25MPS−0.330.370.02
100.282.3797.62AWMD0.23−0.01−0.43
110.221.8599.47DI0.22−0.790.12
120.060.53100.00FRAC−0.29−0.430.37
Table 4. Interval divisions of three principal components and their qualitative descriptions.
IntervalTopographic ComplexityLandscape DispersionPopulation and Economic Capacity
[0, 2]Extremely lowExtremely highExtremely low
[2, 4]LowHighLow
[4, 6]MediumMediumMedium
[6, 8]HighLowHigh
[8, 10]Extremely highExtremely lowExtremely high
Table 5. Clustering results of urban lands based on principal components for the late 1980s and for 2010; five qualitative descriptions of urban development indices are adopted: Extremely high (EH), High (H), Medium (M), Low (L), and Extremely low (EL).
Categories in the 1980sProminent Features of Categories in the 1980sTopographic ComplexityLandscape DispersionPopulation and Economic CapacityNumber of Cities
I-80sUndulating discrete zone9.42EH3.33H5.17M24
II-80sUndulating populous zone9.00EH3.48H8.00EH34
III-80sUndulating low-population zone8.57EH5.78M1.21EL28
IV-80sAggregated low-population zone7.21H8.86EL1.36EL14
V-80sMedium discrete and populous zone6.51H4.82M4.21M38
VI-80sDiscrete populous zone6.23H1.56EH6.08H47
VII-80sDiscrete low-population zone5.14M3.67H2.62L21
VIII-80sFlat discrete zone3.61L2.08H4.25M77
IX-80sFlat low-population zone3.20L5.50M3.76L54
Categories in 2010Prominent Features of Categories in the 2010Topographic ComplexityLandscape DispersionPopulation and Economic CapacityNumber of Cities
I-10Undulating low-population zone9.44EH9.28EL2.33L19
II-10Undulating aggregated zone8.37EH6.71L5.96M38
III-10Aggregated populous zone7.48H6.62L9.62EH61
IV-10Aggregated low-population zone5.24M6.69L2.48L31
V-10Medium undulating and discrete zone4.18M4.69M7.82H45
VI-10Medium discrete and populous zone2.22L4.86M5.57M88
VII-10Flat populous zone2.06L8.79EL6.40H55
Table 6. Dynamics of settlement patterns and urban development indices between the late 1980s and 2010; five qualitative descriptions of urban development indices are adopted: Extremely high (EH), High (H), Medium (M), Low (L) and Extremely low (EL); three variation trends are adopted for dynamic description: Increase (↑), maintain unchanged (→) and decrease (↓).
ZoneZone of Unchanging Settlement PatternCoverage Areas (Provinces)Topographic ComplexityLandscape DispersionPopulation and Economic Density
1980s- trend- 2010
AXinjiangEH ↓ MM ↓ LEL ↑ L
BXizang and small part of YunnanEH → EHM ↓ ELEL ↑ L
CQinghai, north Gansu, and west SichuanEH → EHM ↓ ELEL ↑ L
D×South Ningxia and small part of ShaanxiH ↑ EHM ↓ LL ↑ M
E×Guizhou, Chongqing, east Sichuan, Shaanxi, and small parts of Hunan, Hubei, Guangxi, and GansuEH ↓ HM → MEH → EH
F×Major Yunnan and small parts of Sichuan and GuangxiEH → EHH ↓ LM ↑ H
GMajor Inner MongoliaEH ↓ MM ↓ LEL ↑ L
H×Major Heilongjiang, Jilin, and part of LiaoningM → MM↓ LL → L
I×South LiaoningL → LM → ML ↑ M
JBeijing-Tianjin-Tangshan regionM ↓ LM ↓ ELL ↑ H
K×Jiangsu, Shanghai, major Shandong, half Zhejiang and small part of AnhuiL → LH ↓ MM → M
L×Shanxi, Henan, south Hebei, and parts of Anhui and ShandongL → LM → MM → M
M×Fujian, south Zhejiang, north Guangdong, and small parts of Hunan and JiangxiH → HEH ↓ MH → H
N×Hunan, Hubei, and major JiangxiM → MEH ↓ MM ↑ H
OPearl River Delta regionL → LM ↓ ELM ↑ H
P×Major Guangxi and small part of GuangdongH ↓ LM ↓ ELM ↑ H
QHainan islandH ↓ LM ↓ ELM ↑ H

