1. Introduction
Energy security and environmental protection have become prominent challenges in contemporary energy systems. Integrated energy systems (IES) have been proposed to solve the problems of outstanding security, high energy efficiency, and excellent economic performance [
1]. An integrated energy system should meet diverse energy demands while improving the energy efficiency, using electricity as core energy while integrating various energy sources (e.g., natural gas, thermal, and wind energy) in a region to achieve uniform dispatch [
2].
Advanced information technologies for energy data exchange and intelligent dispatch strategies are necessary for effectively managing a complex IES. Nevertheless, the different physical characteristics and complex coupling among different energy sources have made establishing precise mathematical models of IES systems a challenge for researchers, which has correspondingly rendered a number of traditional model-based approaches unsuitable for IES management. Artificial intelligence (AI) methods have achieved more satisfactory results than traditional modeling methods in data analysis and decision optimization problems [
3,
4]. On the other hand, an explosion in the availability of data has been witnessed over the last decade. Massive amounts of data are now routinely collected in many industries [
5,
6,
7,
8]. Furthermore, a large amount of data is available in the energy industry: Transaction data from retailers, order patterns across supply chains from suppliers [
6], global weather data [
9], historical demand profiles [
10], and (in some cases) real-time power consumption information [
11,
12]. Many precious laws are hidden in this massive amount of data, strongly driving an active area of research in which a number of studies based on data-driven technologies have been carried out. Large amounts of operational and control data are required for adopting the methods proposed in the aforementioned research, if reasonable control strategies are to be achieved.
In the day-ahead scheduling domain, it is necessary to provide accurate forecast data, such as weather data or load data, as the basis of control strategies. Considering that data-driven approaches can better approximate the non-linear relationships between predicted data and related factors, they have been exploited as the prime choice. In [
13], the ability to handle the time-series problem by long-short-term memory (LSTM) was exploited to construct a photovoltaic (PV) system output power prediction model. In [
14], the internal structure and features of complex wind speed sequences and predict wind power were characterized. The performances of two different time-series approaches (deep learning and non-deep learning) in the application of day-ahead building-level load forecasts have been systematically compared in [
15], where the deep learning method presented better performance. A Long-Short-Term Memory network with multi-input and multi-output models was trained to forecast electricity demand, based upon the season, in [
16]. Searching for the non-linear relationship between control strategies and control effects from IES operational data is another research direction. Generally, IES operation is carried out by collaborative optimization, rather than a simple superposition of multiple energy supply systems, which can be modeled as a large-scale optimization problem. In [
17], an energy management system for combined heat and power (CHP), in order to minimize operating costs and carbon dioxide emissions, was designed using a reinforcement learning approach. In [
18], an RL-based online power management strategy was proposed, which could reduce the energy loss effectively—the relative decrease of the total energy loss was shown to reach 16.8%.
In addition, some researchers have made other attempts using data-driven methods. In [
19], the defects of using model-based tools in a smart grid system with massive data was pointed out, and introduced random matrix theory to map the energy system. Alahakoon and Yu [
20] carried out an advanced analysis, referring to a number of techniques in many specific fields, such as data mining, knowledge discovery, machine learning technologies, and so on.
At present, research into data-driven and model-free control methods for IES operation is still in its early stage, while load or renewable energy prediction technologies are relatively mature. This is because large amounts of operational and control data are pivotal for adopting data-driven methods for IES operations. For data prediction researches, a large amount of high-quality data, including weather, radiation, and wind speed data, are available. On the contrary, IES operational and control data are rare. Even in the existing data sets, the scope of running scenarios is not yet rich enough. To address this problem, we present an IES scenario generation approach, based on a Generative Adversarial Network (GAN) [
21]. GAN-based methods, such as star-GAN [
22], energy-based GAN [
23], and cycle-GAN [
24], have attracted a lot of attention for their powerful ability to generate data and mixing generated data with genuine data.
In this paper, an adversarially trained agent is trained to generate IES operating scenarios, based on a probability distribution of target data using a GAN framework. The framework contains one data generator and one data discriminator. The generator is trained to generate new data with a similar probability distribution as the target data set, while the discriminator is trained to distinguish between generated data and real data. The generated data shows a high similarity to the raw IES operating data. In addition, scenes which do not exist in the original data set are generated, correspondingly improving the overall diversity of the data. Furthermore, we test the effectiveness of generating data for data-driven methods using the proposed control strategy, based on the Q-learning algorithm for a simple renewable energy and storage system. We aim to evaluate whether the GAN-based generator can assist the formulation of a data-driven control strategy. Furthermore, we compare the control performance of a strategy trained under the original data set and the extended data set. The result shows that using the expanded data set can effectively improve the sample richness and developed control effect. Our contributions are as follows:
An adversarially trained IES data generator, which interprets real operating data and generates new data with the same distribution as the real data, is introduced. We hope to solve the problems of insufficient real operating scenarios in data-driven methods for IES by the proposed generator. Through this method, a large number of IES operating data could be generated to supplement the monotonous raw data set. Furthermore, we can obtain IES operating data on various operating states such as normal operating status, fault status, and edge status, so as to study control strategies that can be used for more operating conditions (i.e., Quick response strategies can be generated in the event of a system failure).
A model-free control method for a renewable energy and storage system is proposed, where generated data is used to improve the control performance. Q-learning is a decision-making method that can cope with high randomness and uncertainty. In this way, the agent can learn to generate the control strategy with highest reward under different IES operations. In addition, we use a dataset that has been extended by the generator to train the agent and achieve better performance in diverse operating scenarios.
We provide both qualitative and quantitative results on the IES operating scenarios generator and control strategy for renewable and storage system, showing its superiority over the original data.
The remainder of this paper is organized as below. Section II describes the GAN-based generator. Section III details the renewable energy, storage system, and control strategy. Case studies are presented in Section IV, and Section V gives the conclusions.
2. Materials and Methods
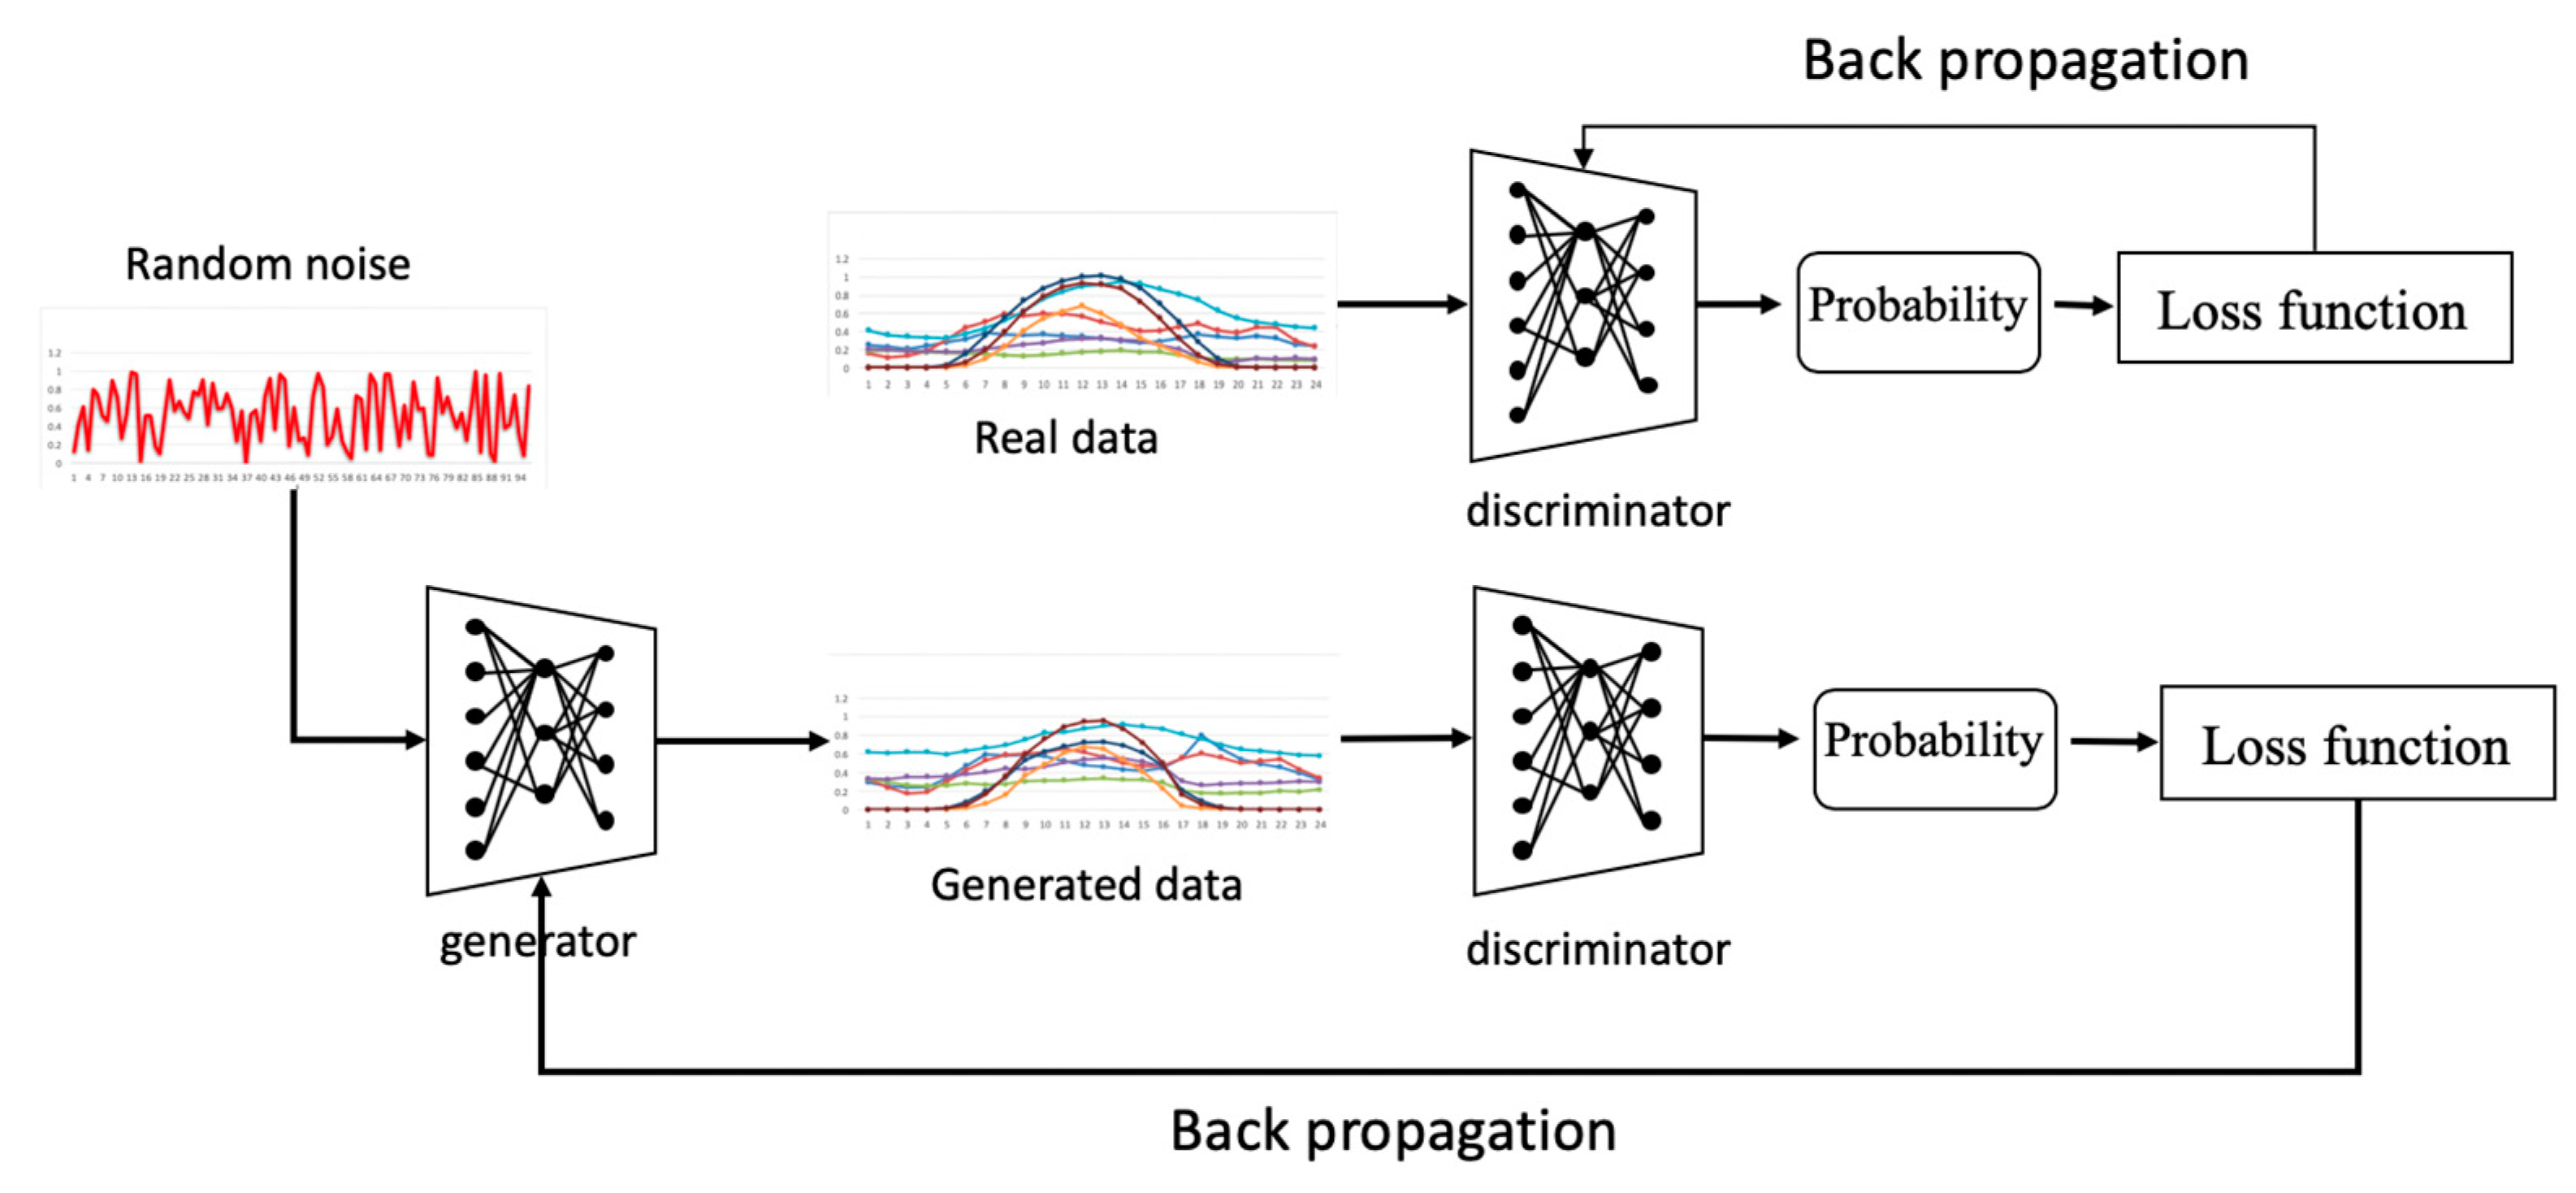
A GAN is a state-of-art AI framework, which was first used for image generation. GANs have also been extended for use in picture translation, style synthesis, image inpainting, and so on. Due to the complexity of IES operations, it is difficult to learn optimal operation rules for IES without sufficient operational data. In this section, we propose an operating scenario generation approach based on GAN technology. The core idea of a GAN is to establish a game relationship between a generator and a discriminator. The generator generates samples to deceive the discriminator network, while the discriminator tries to distinguish the real samples from the generated samples. The general structure of a GAN is shown in
Figure 1. The generator generates IES operational data from a random noise input. The input of the discriminator is either generated data or real data, and the output is a probability of whether the input is real data.
In this paper, we aim to construct a generative model capable of sampling from some target data distribution . For example, when given a batch of real load operating data with a distribution over a region, the generative model generates data with a similar distribution as the real data. Thus, our task is equivalent to recovering a distribution such that . We model as a convolutional neural network (CNN), , which is called the generator network.
In order to optimize
, an adversarial framework [
19] was employed, in which the generator
aims to maximally confuse a discriminator
which is trained to distinguish between samples drawn from
and samples generated by the model. As a result, the distribution defined by
gradually becomes closer to
. We give the concrete training objectives for
and
below.
2.1. Objectives
As shown in
Figure 1, generators and discriminators improve their generative and discriminatory power, respectively, by back-propagation. For the generator, its back-propagation process is designed to narrow the gap between the generated data and the real data. When the generated data and the real data are input to the discriminator, the discriminator outputs the predicted probability that the set of data is real data. Back-propagation for discriminator is used to expand the predictive probability between real and generated data. Next, we will detail the objective function by which the above back-propagation process operates.
To begin with, m points
are sampled from the target data distributions
. The probability of using the generator
to generate the target data is
where
represents the network parameters of the generator. The aim of training process is to find the
which maximizes
[
25]:
As the generator is an arbitrary, non-differentiable function, we cannot optimize (2) using naïve gradient descent. Therefore, we follow the method presented in [
26]:
We define a prior on input noise variables , then represent a mapping to the target data space as , where is a differentiable function represented by the generator convolutional neural network (CNN) with parameter . We also define another CNN , which outputs the probability that came from the target data, rather than from . Our training objective is to maximize the probability of assigning the correct label to both training examples and samples from . We simultaneously train to minimize .
Thus,
and
play the following two-player minimax game with value function
:
Generator: The objective for
is minimize
. We hope the generated data from
is as close to the real data as possible. The loss function for the generator is:
Discriminator: The objective for
is to maximize
, which denotes that the discriminator maximizes the probability gap between the generated data and the real data. The loss function for discriminator is:
where
is the gradient of
and
is a coefficient between 0 and 1. In [
24], it has been noted that adding an additional item to the objective function can address the problem of gradient disappearance. Therefore, we use interpolation algorithm to obtain
.
The whole training process is as follows:
- (1)
Input a batch of random noise to to obtain a set of fake sample data ;
- (2)
Sample m points randomly from the target data;
- (3)
Calculate the values of the objectives for the discriminator and generator;
- (4)
Back-propagate and update the network parameters ; and
- (5)
Repeat steps 1–4 until convergence.
2.2. Networks
The generator and discriminator are multi-layer neural networks, where the discriminator is a convolutional neural network and the generator is a deconvolution network. The parameters are updated to reduce the distance between the current state and the objective function. In this subsection, we will introduce the specific structure of the two networks and the input and output dimensions.
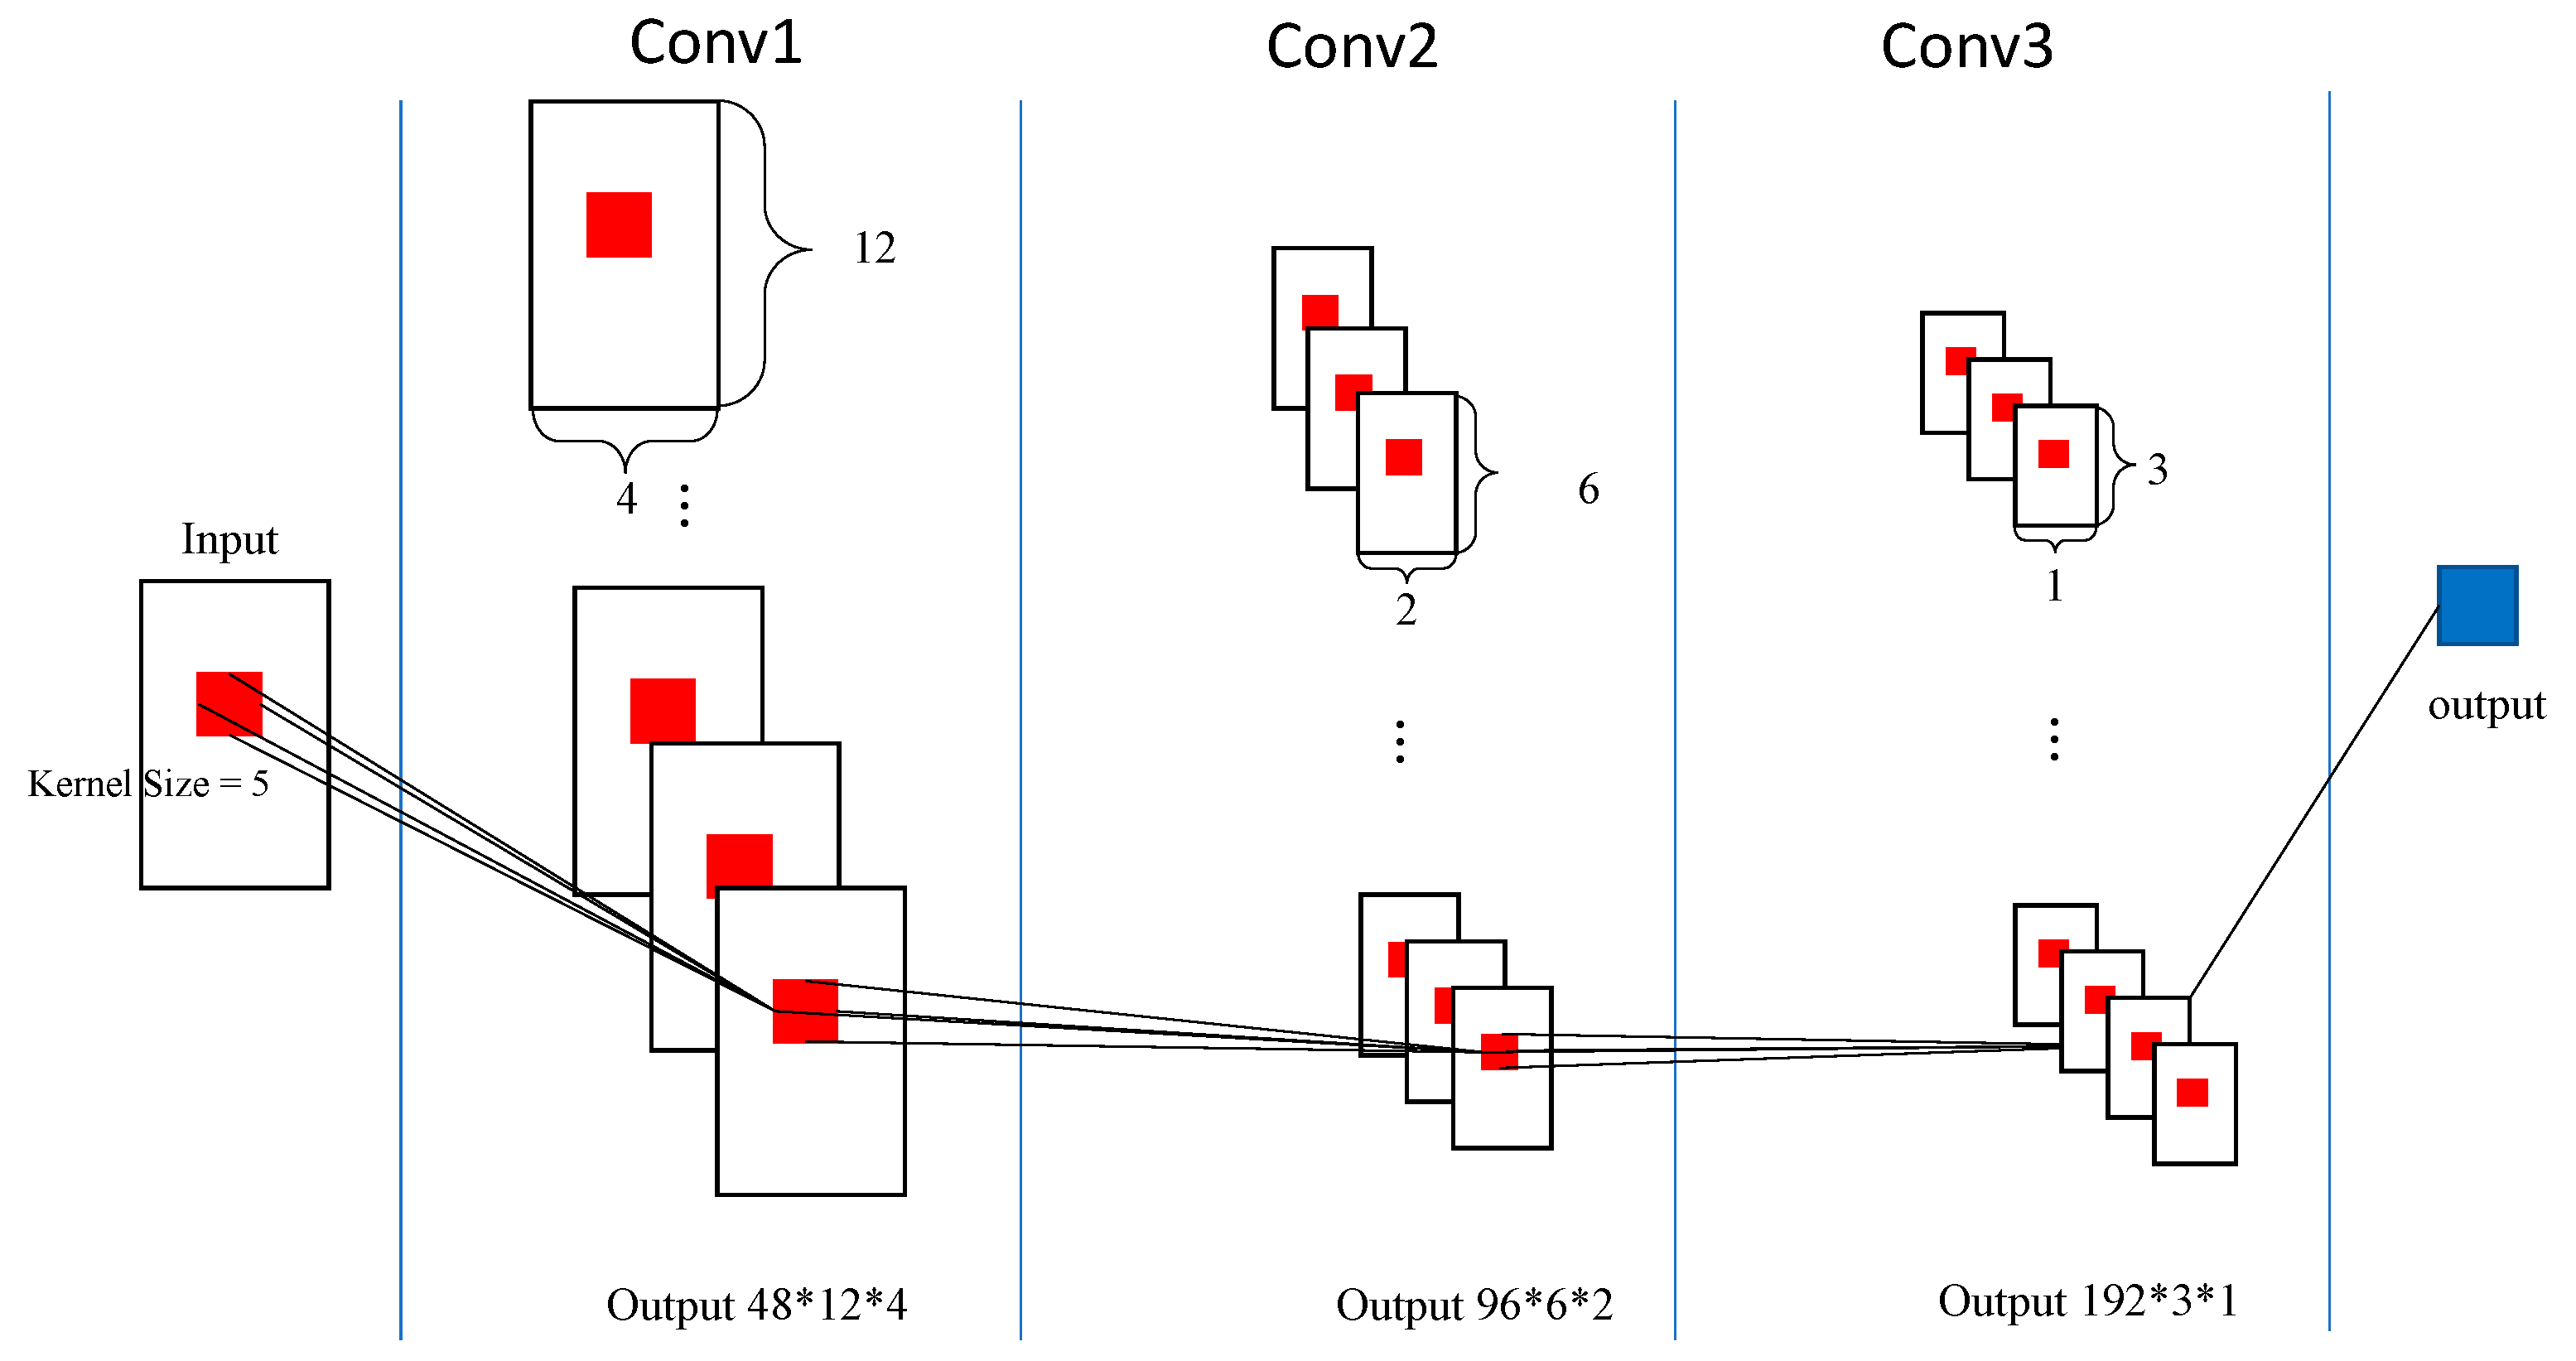
The discriminator module consists of three convolution layers and one fully connected layer, where the filter sizes of the first, second, and third convolution layers are all 5 × 5. The convolution step is 2. The structure is formally presented in
Figure 2.
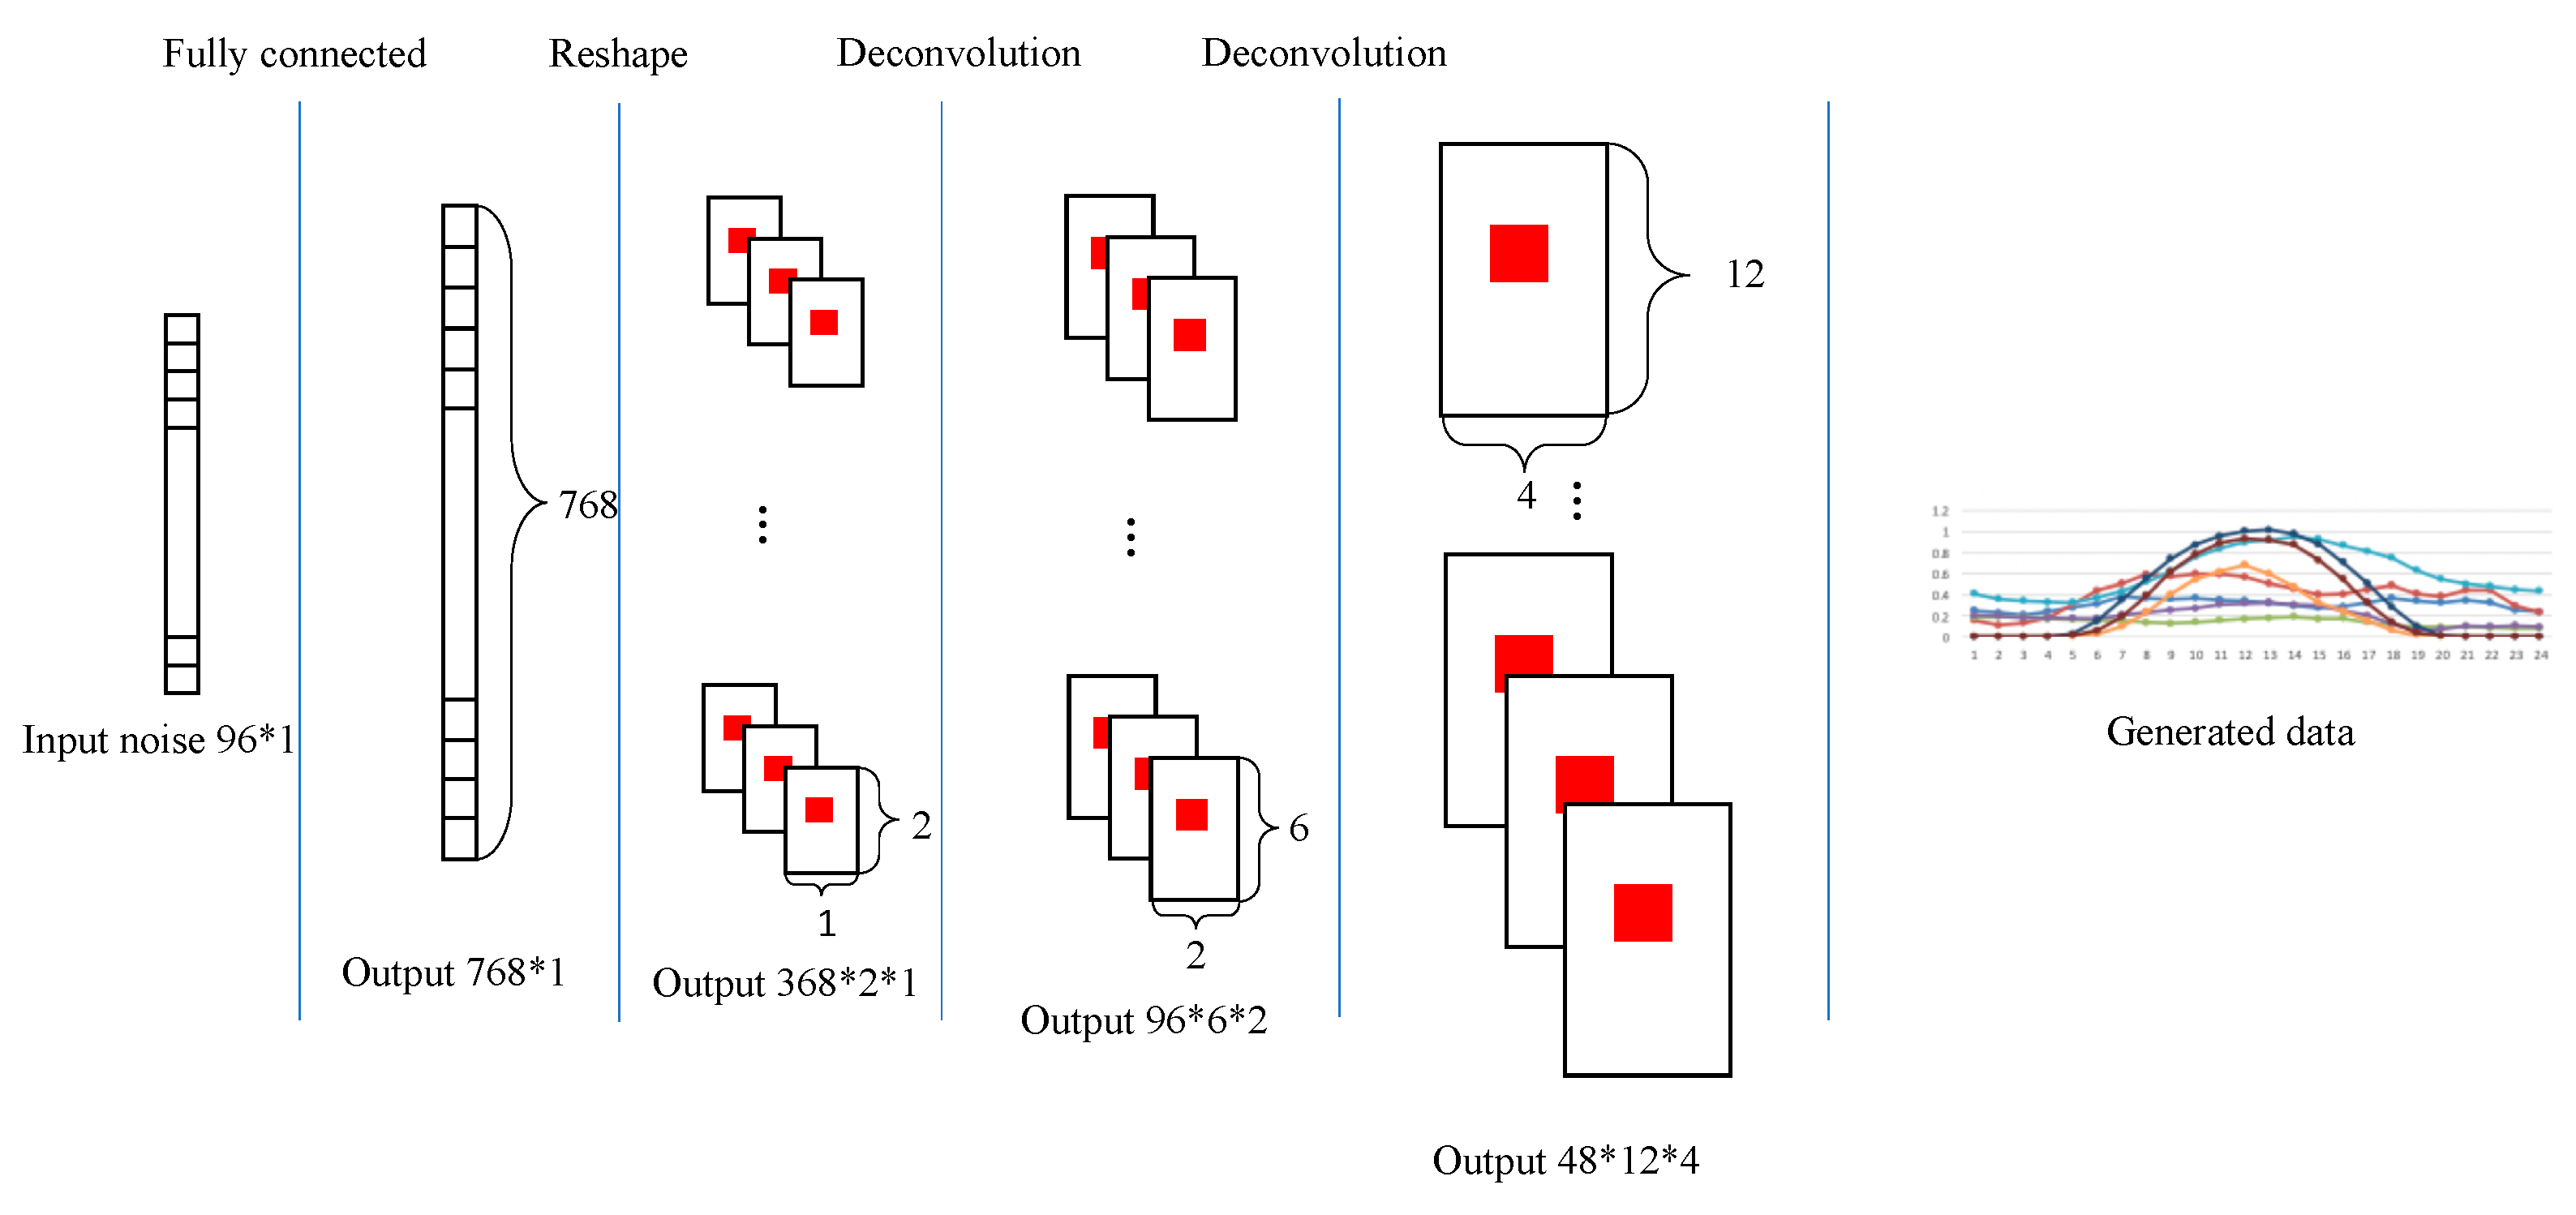
The generator module consists mainly of a fully connected layer and four deconvolutional layers. The input of the generator is a set of random arrays of size 96 × 1. The generator is similar to the inverse process of the discriminator, and the structure is demonstrated in
Figure 3. The (Output 48∗12∗4) denotes the size of data arrays, which means that the data is a three-dimensional array, and the size of the first dimension is 48, the size of the second dimension is 12, and the size of the third dimension is 4.
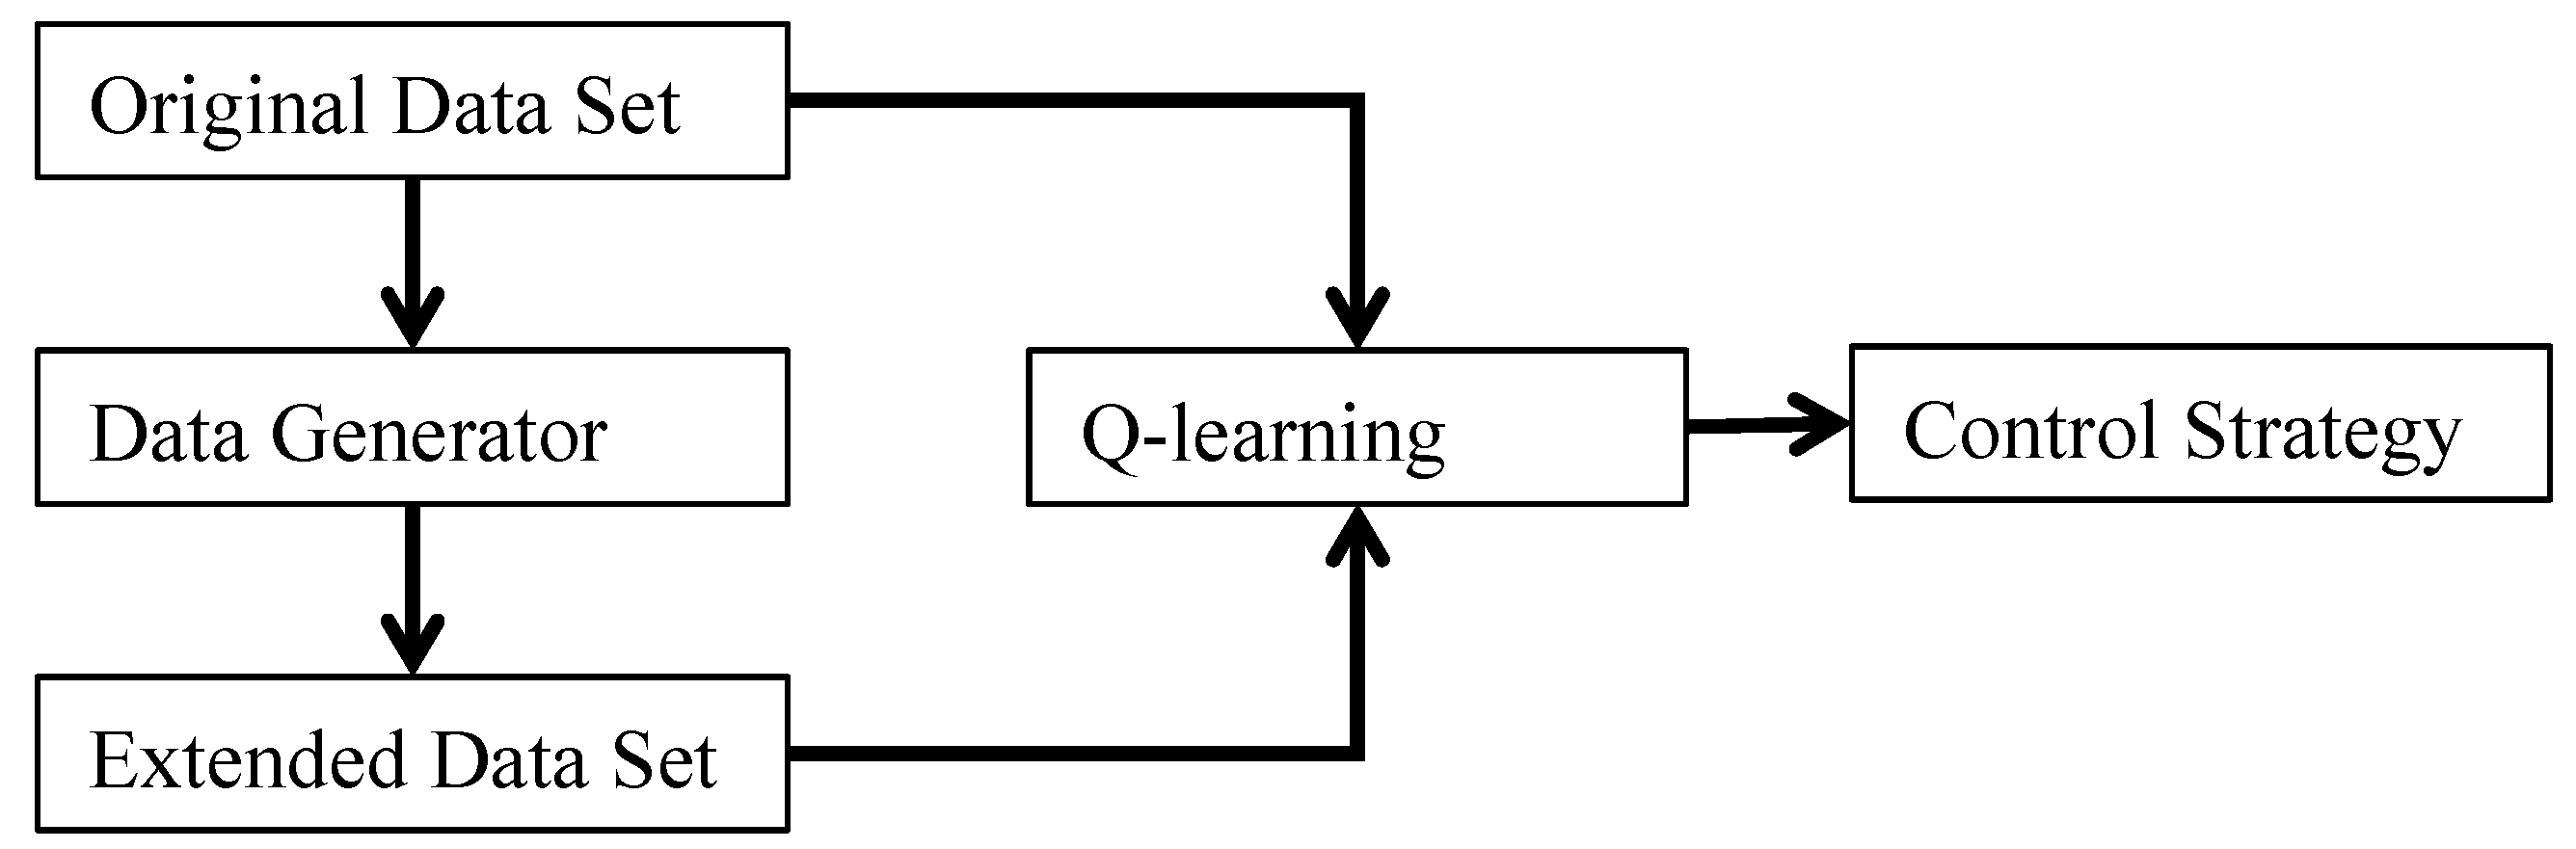
2.3. Q-Learning Algorithm Based on Extended Data
Our research aims to generate sufficient IES operating data for model-free methods (i.e., Deep learning or Reinforcement learning) to study IES comprehensively. In this section, we introduce a control strategy based on the Q-learning algorithm, which requires rich and varied training sample data to guarantee stability. Therefore, we used the data generator to expand the training set and compared the result with that using the sample without expansion. The extension process is shown in
Figure 4.
2.4. Problem Statement
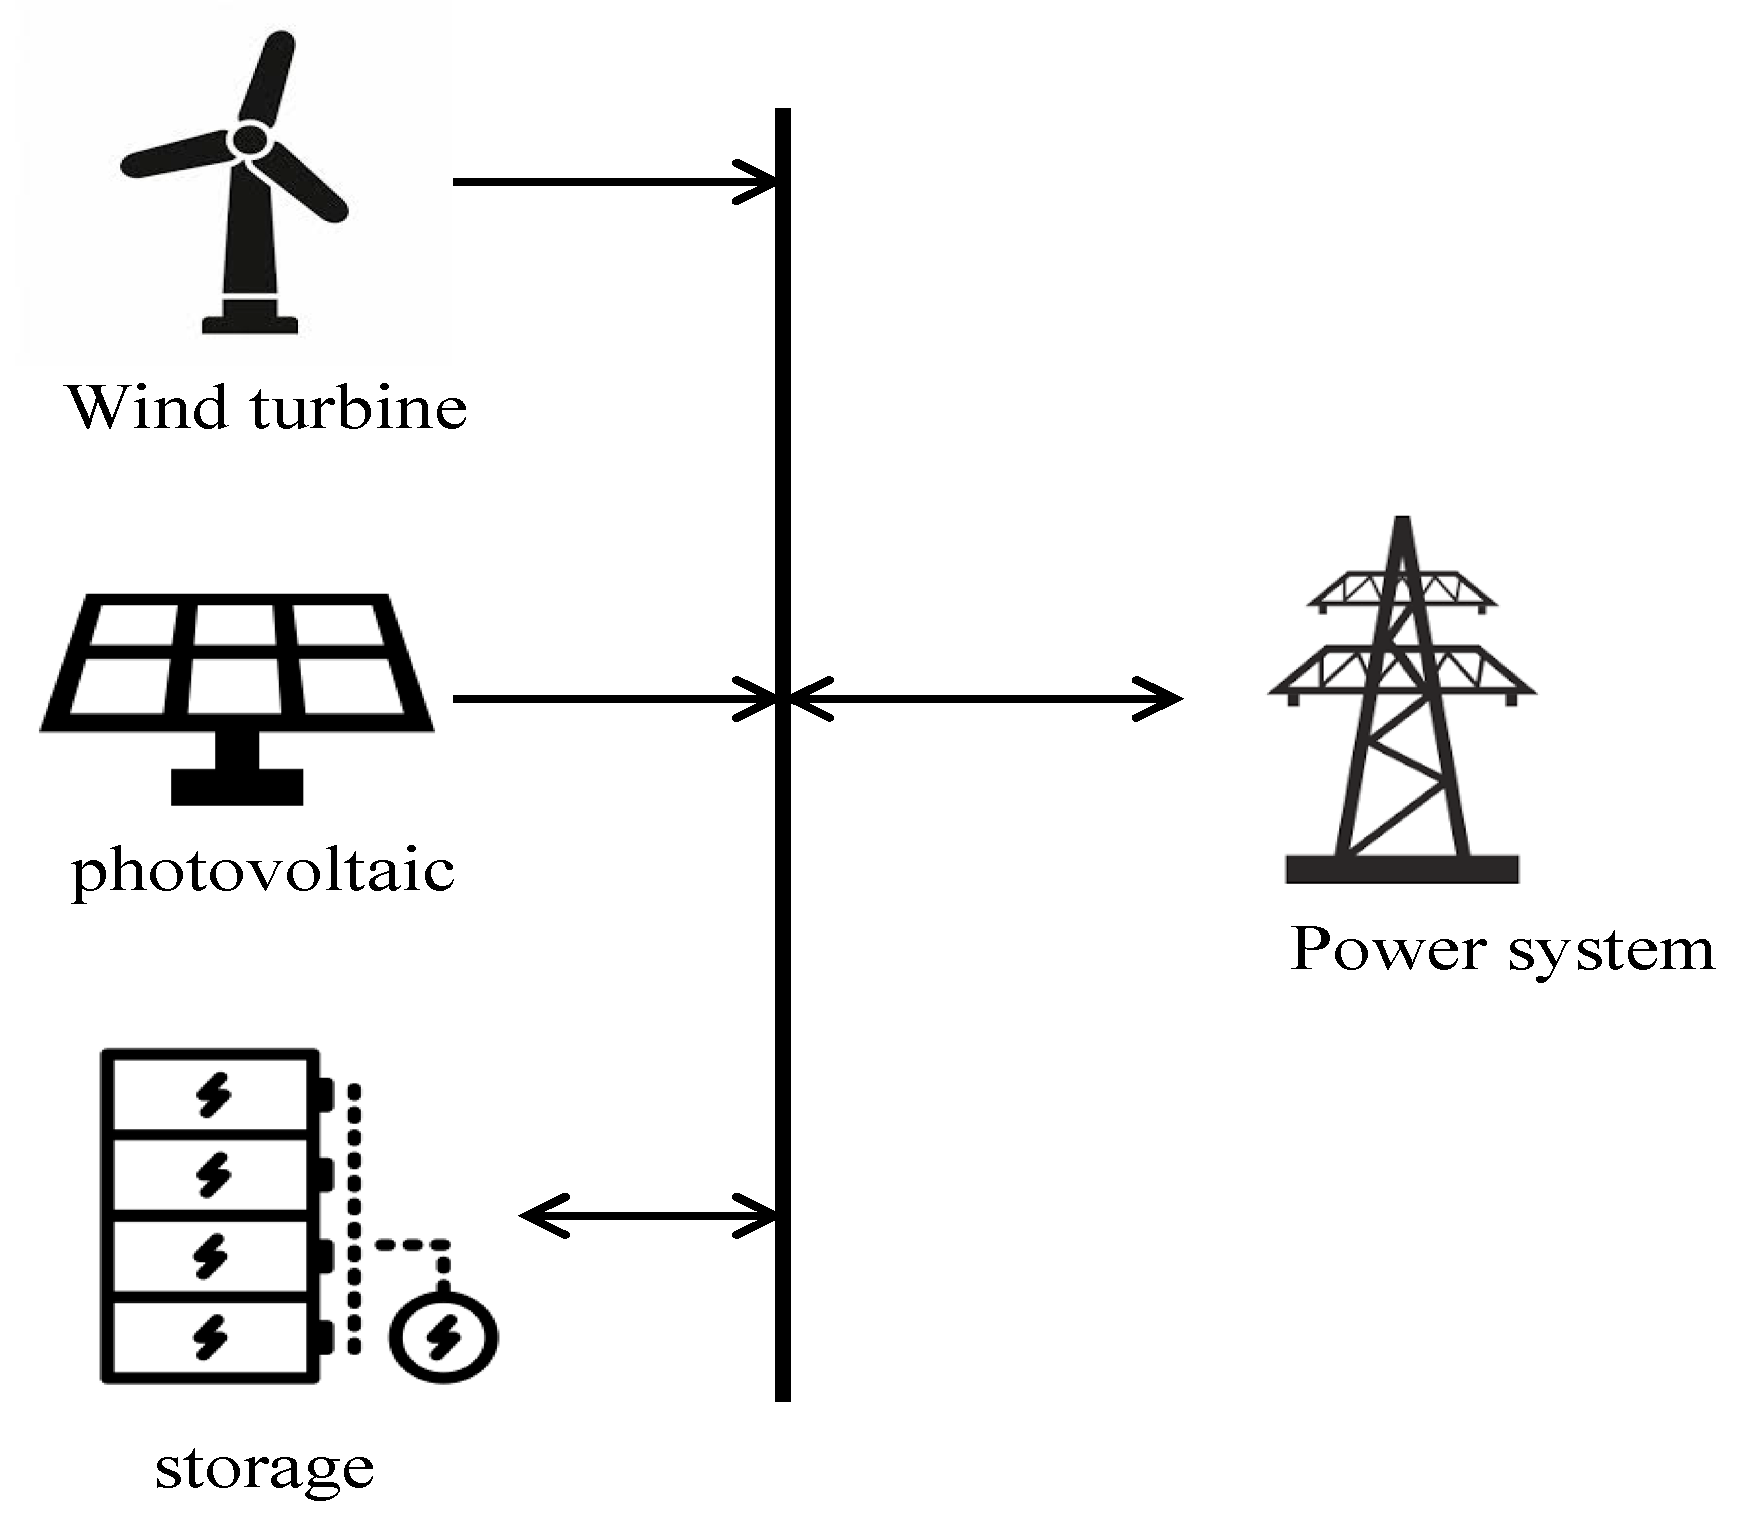
The goal of co-operation between a renewable energy system and an energy storage system (
Figure 5) is to maximize the benefits of the system. A renewable energy generation system can benefit by selling electricity to the grid. It also needs to buy some spinning reserves to compensate for the instability of renewable energy sources. On the other hand, if the control strategy deviates greatly from the actual load, there will be energy abandonment, storage switching with high frequency, and other undesirable outcomes. Hence, we learn the operating rules, by using the Q-learning algorithm, to choose the optimal control strategy in different situations.
We define the predicted value of renewable power generation during the period t during the day to be
, the charging and discharging power of energy storage system to be
, and the interactive power with power grid to be
:
Due to the uncertainty of a renewable energy system, it is necessary to purchase reserve capacity from the grid. Compensation for storage is required when the actual power generation of renewable energy exceeds the reserve range:
where
and
are the standby capacities for up- and down-regulation, respectively.
Objective: The objective function is given by maximizing the accumulative return during one period:
where
denotes the number of periods,
is the price of electricity,
is the price for reserve capacity, and
denotes Penalty costs.
Penalty costs: A renewable energy system needs to pay penalty fees when the co-operation system cannot meet the demands of power grid dispatching. The following defines the penalty costs:
When the charging and discharging power of an energy storage system exceeds the charging and discharging limit, the charging or discharging power will be restricted to upper or lower limits, respectively. In this case, the grid has to accept an excess load, which increases the burden on the power grid:
2.5. Q-Learning
The Q-learning algorithm is a learning algorithm which is based on previous experience or operational data. An agent learns how to control the system efficiently through constant attempts. In an attempt, there is first an interaction with the environment, which is defined as an action. At the same time, the environment will give rewards, according to the quality of the action. The agent stores the experience gained from each interaction in a Q-table. The Q-table can be regarded as a two-dimensional table. One dimension records the scene in the environment, and the other dimension records the behavior that an agent can take [
27].
Table 1 gives an example of a Q-table, where
s represents the environment,
a represents an action, and
Q records the degree of learning. The values in the Q-table are modified, according to the formula (10).
After enough attempts, the experience learned by agents tends to converge, rather than grow. At this point, the Q-table can be considered stable.
During the assessment phase, the agent will choose an action by Equation (11):
where
is the action corresponding to the maximum Q value in the Q-table, and
is the exploration factor, which denotes that the agent has a capacity to explore other actions randomly, rather than choose the action with the maximum Q value; such that it does not fall into a local optimum.
In a renewable energy system, the environment refers to the whole system and an action refers to control instructions for storage. Therefore, the optimization problem is translated into the problem of maximizing rewards.
Data: There are many parameter settings involved in every training episode, such as photovoltaic and wind power or energy price. This means that sufficient scenarios are needed in the training set; otherwise, the agent will not learn control strategies for the missing scenarios. Thus, we expanded our training set by the data generation method presented in
Section 2.
Environment: The state in the scenario includes the power generation of the renewable energy and the power storage . First, is discretized into an N-dimensional interval: [0, ), [, ), …, [, ]. Then, is discretized into an M-dimensional interval: [0,), [, ), …, [, ].
Action: Similar discretization processing is needed for action set, including the charging and discharging rate and reserve capacities and .
4. Discussion
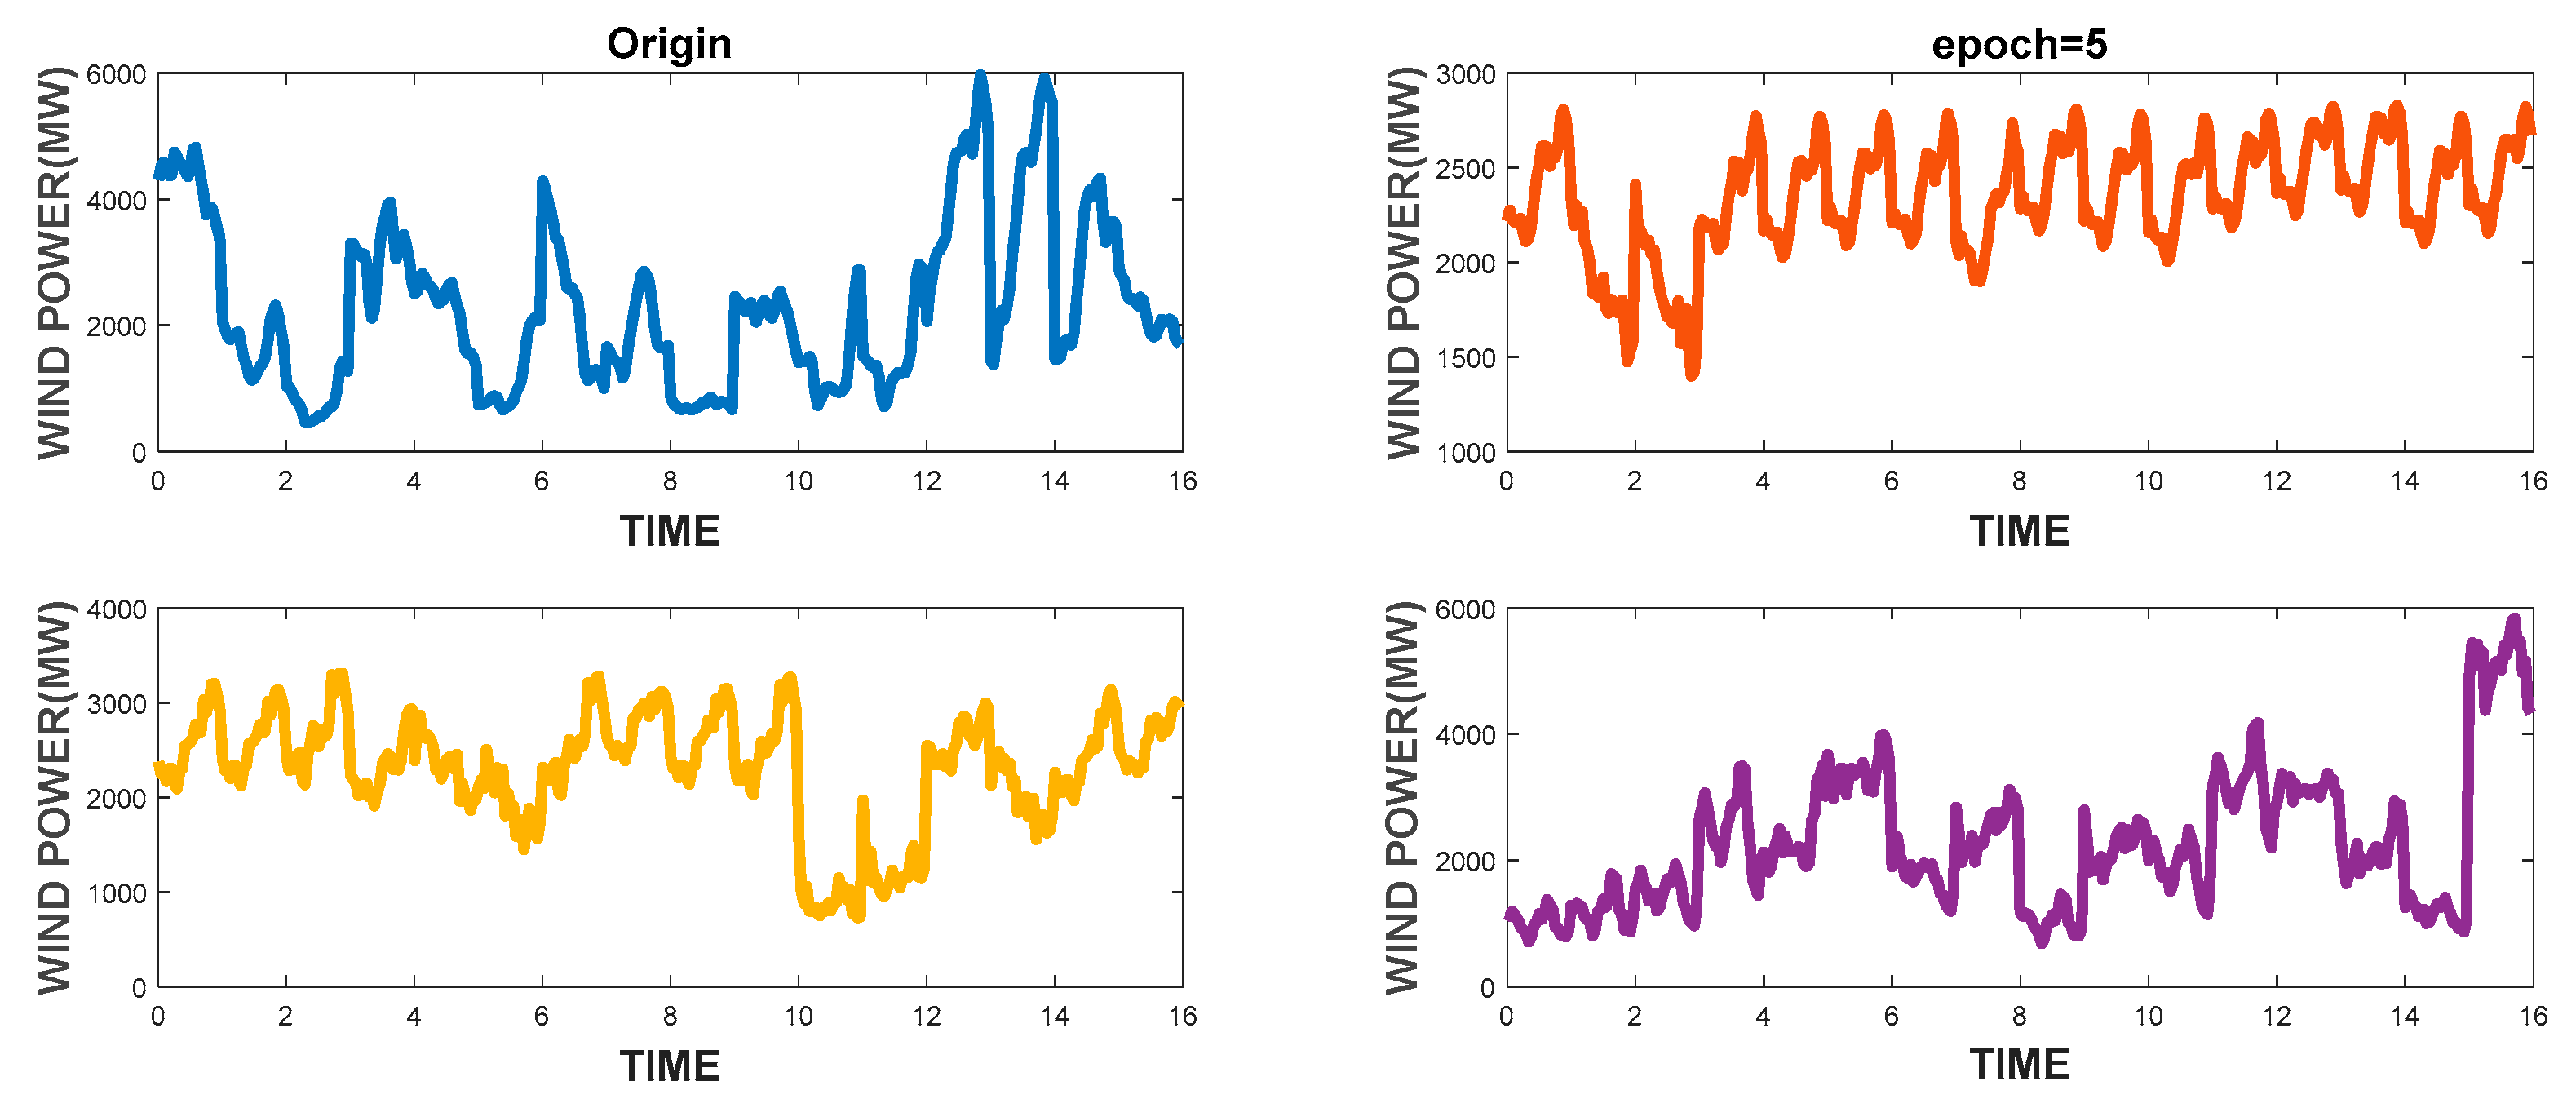
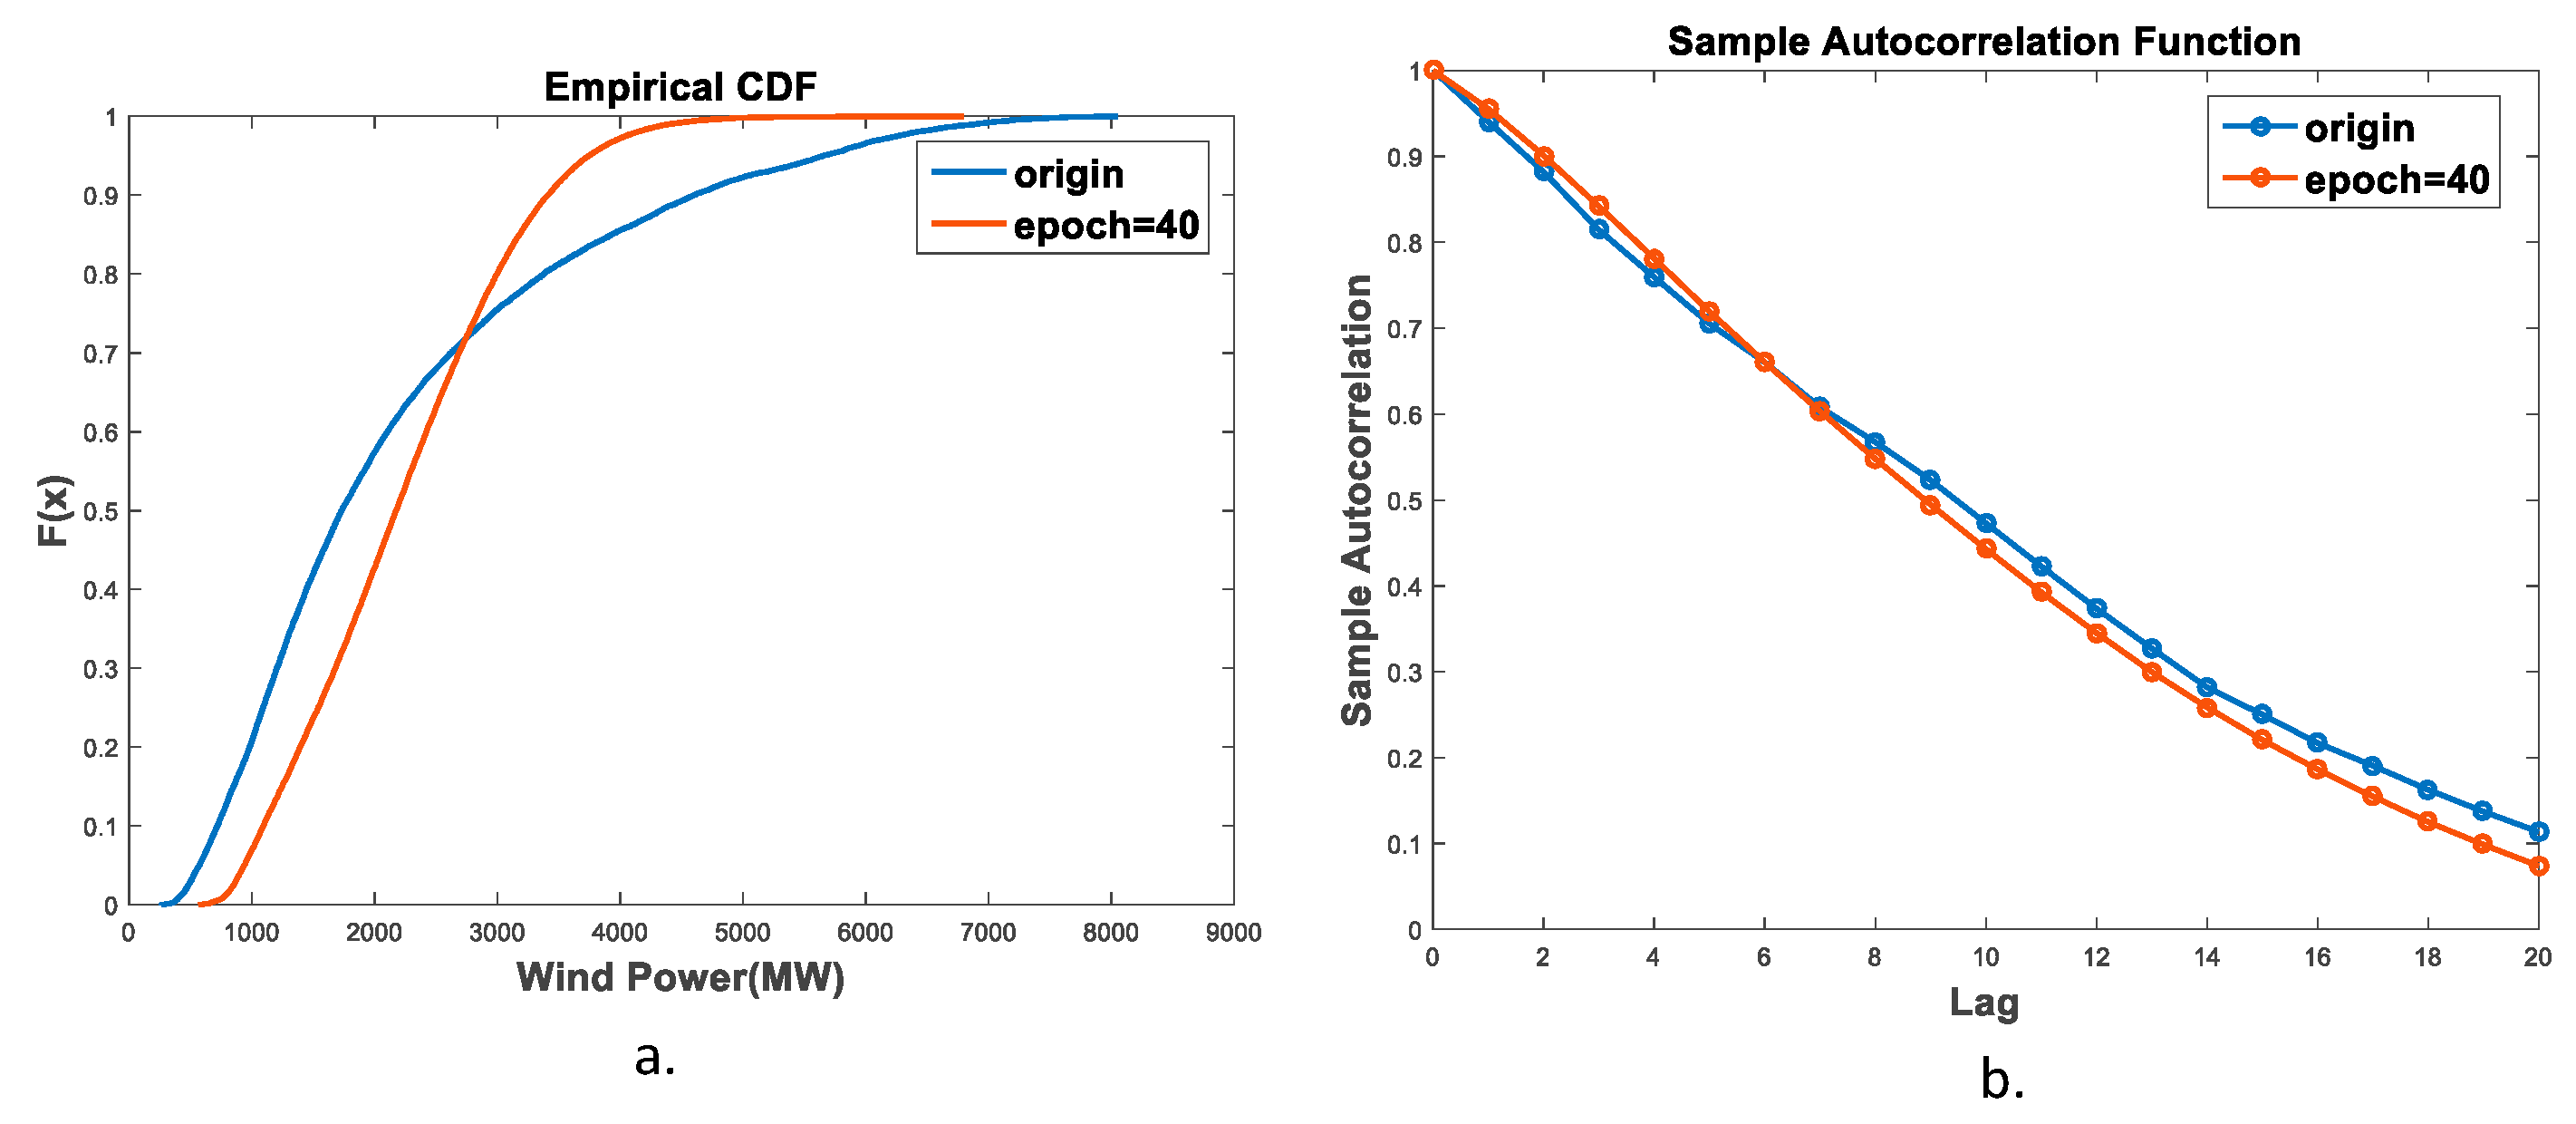
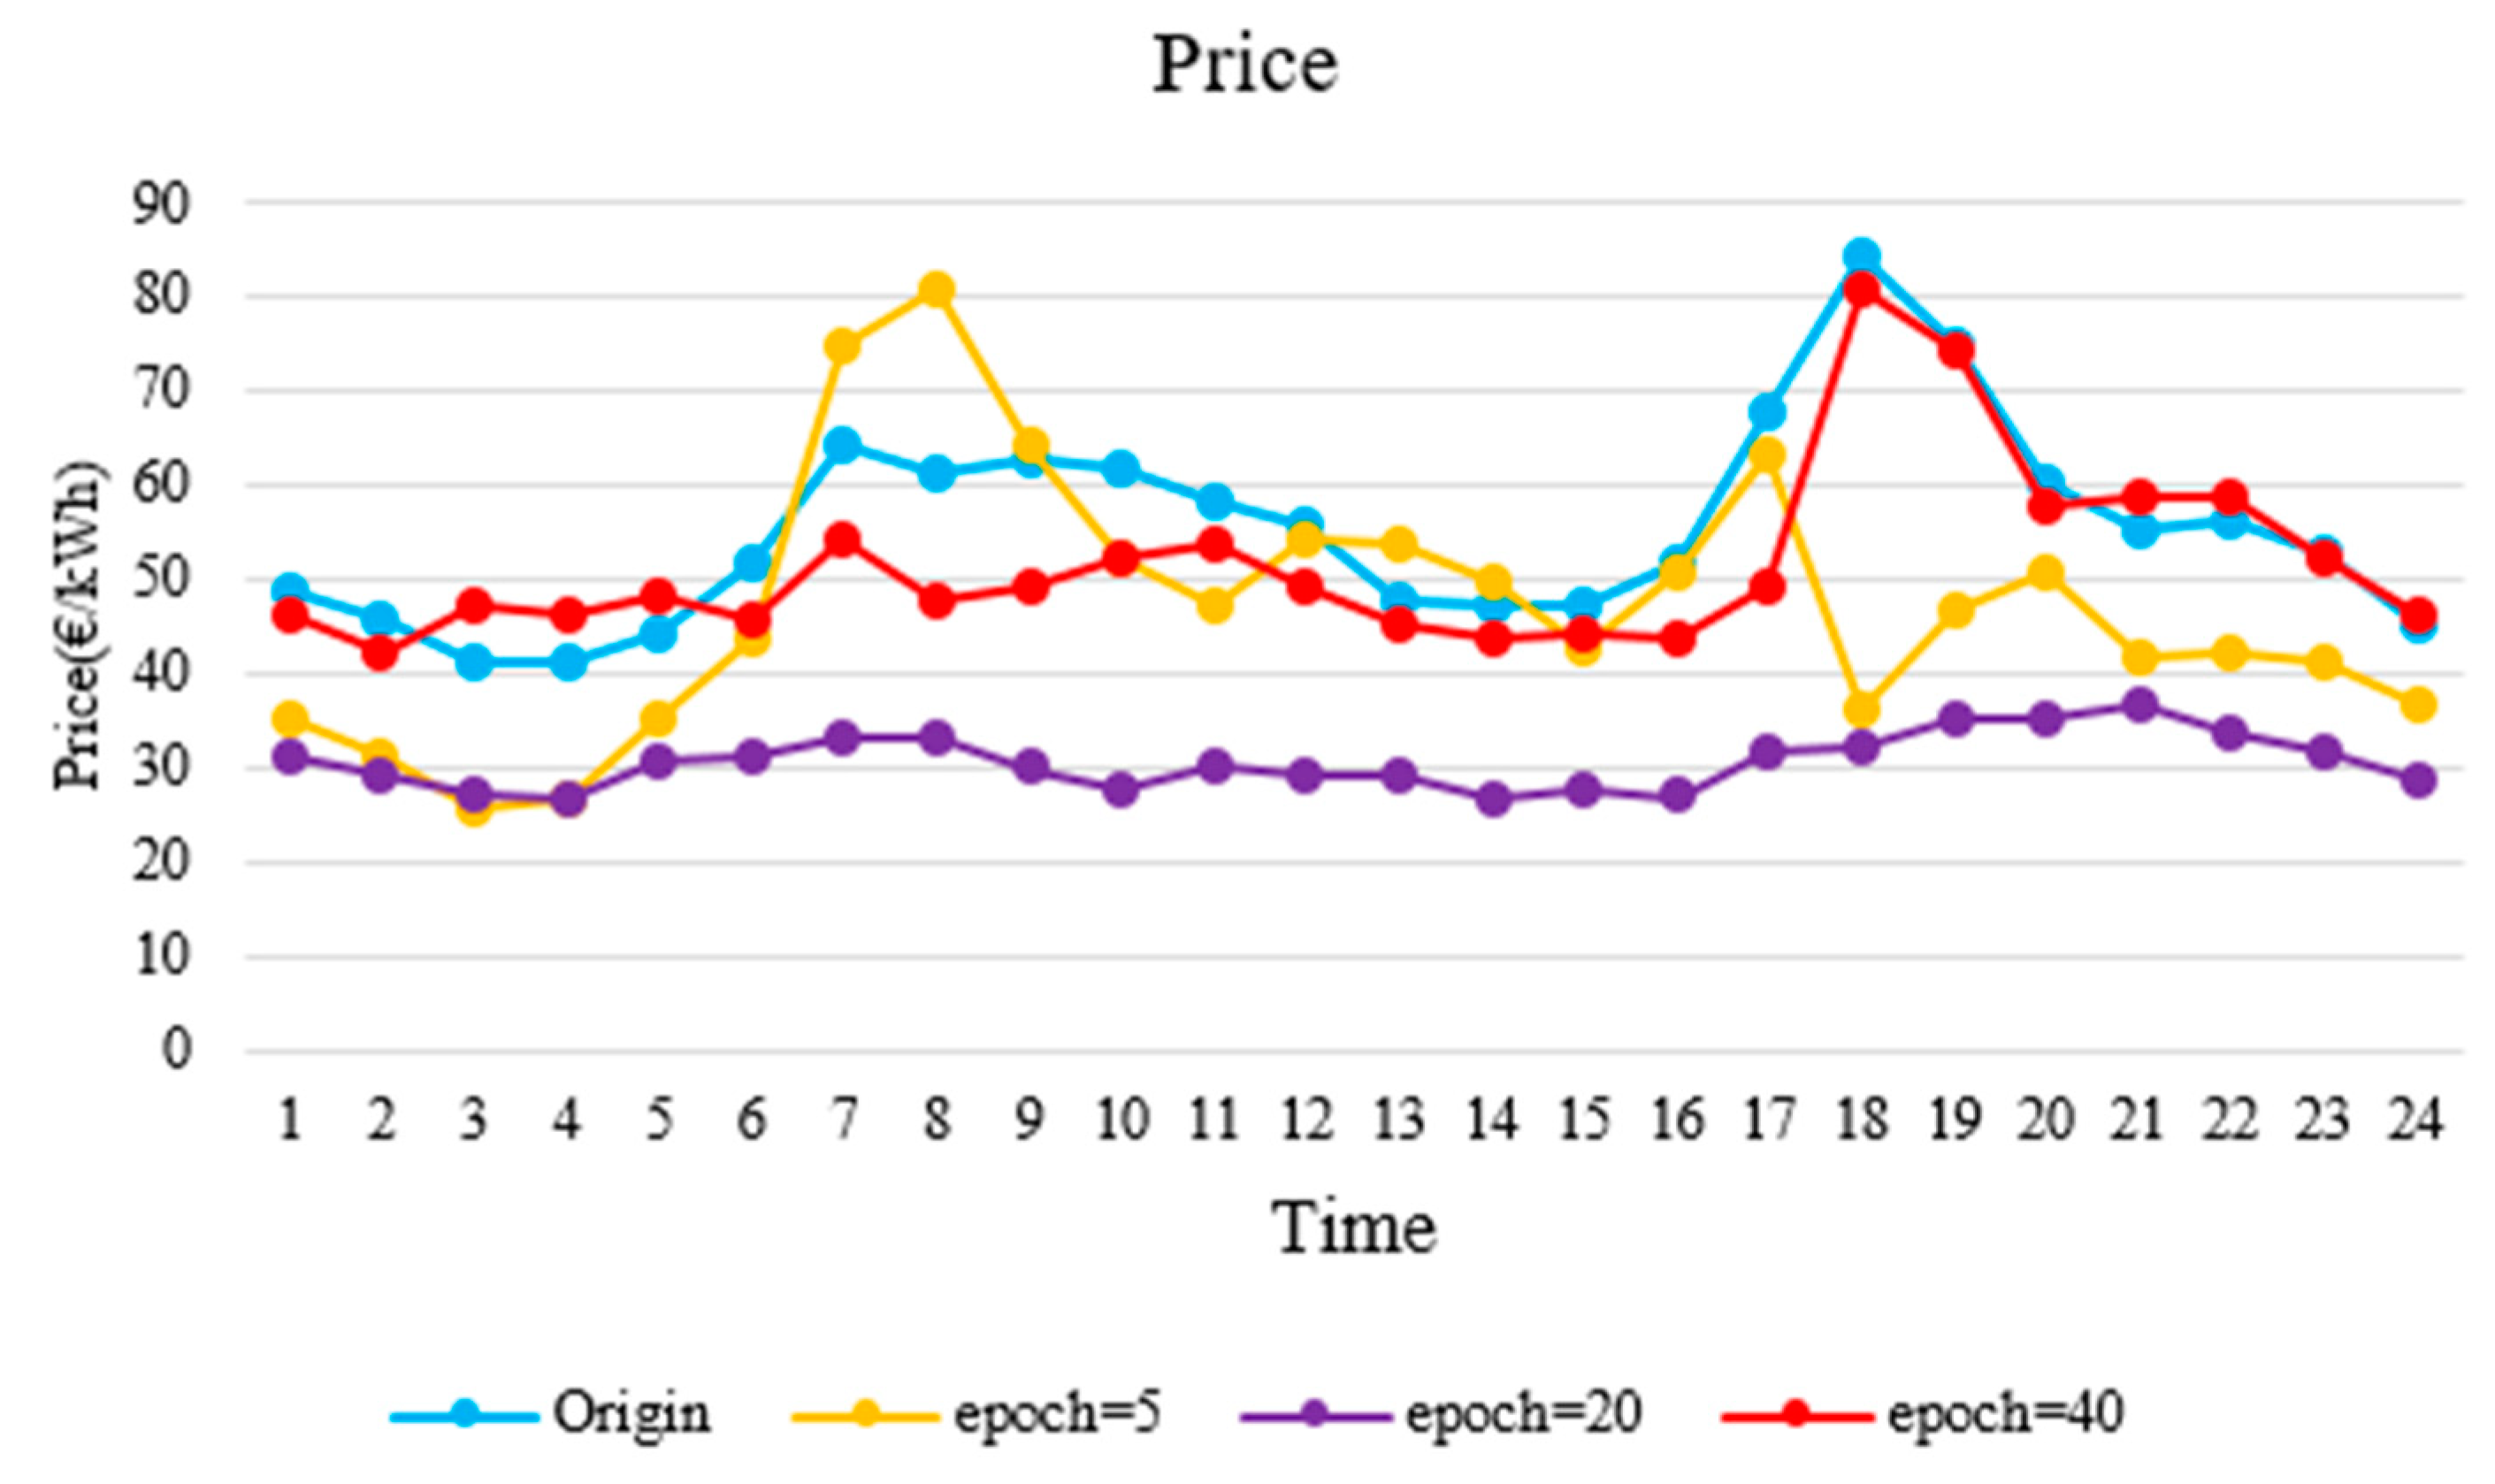
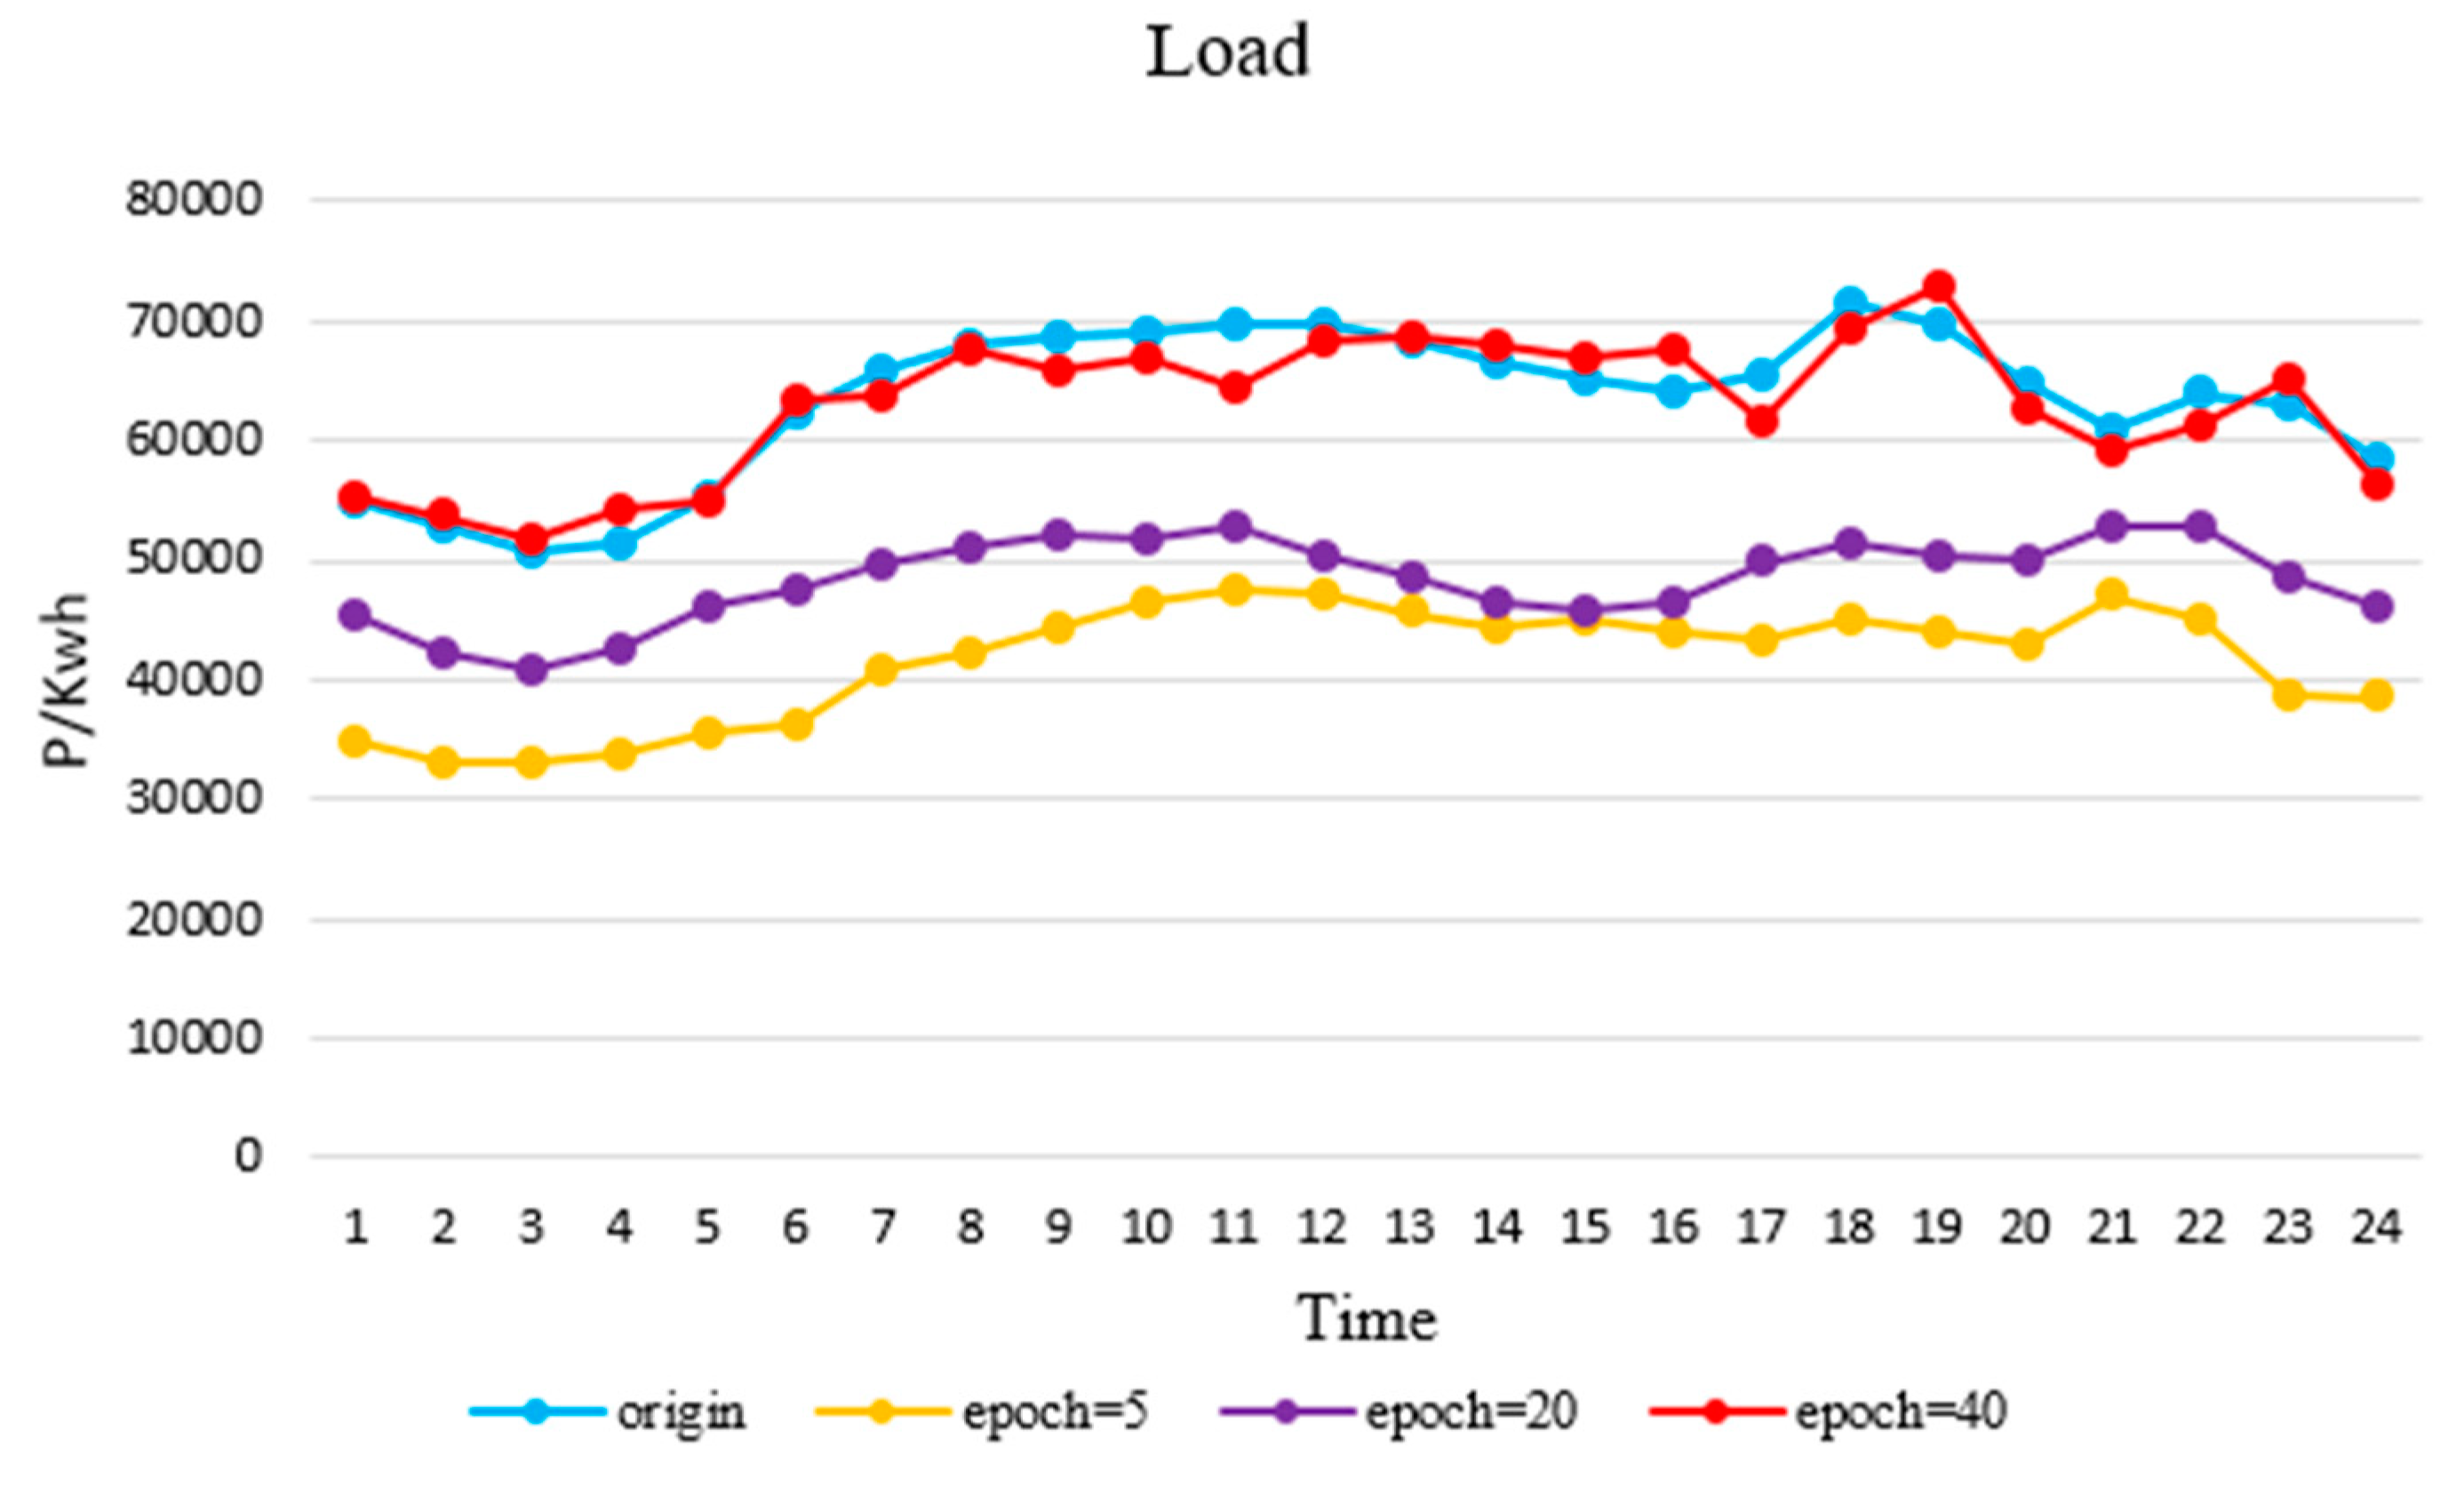
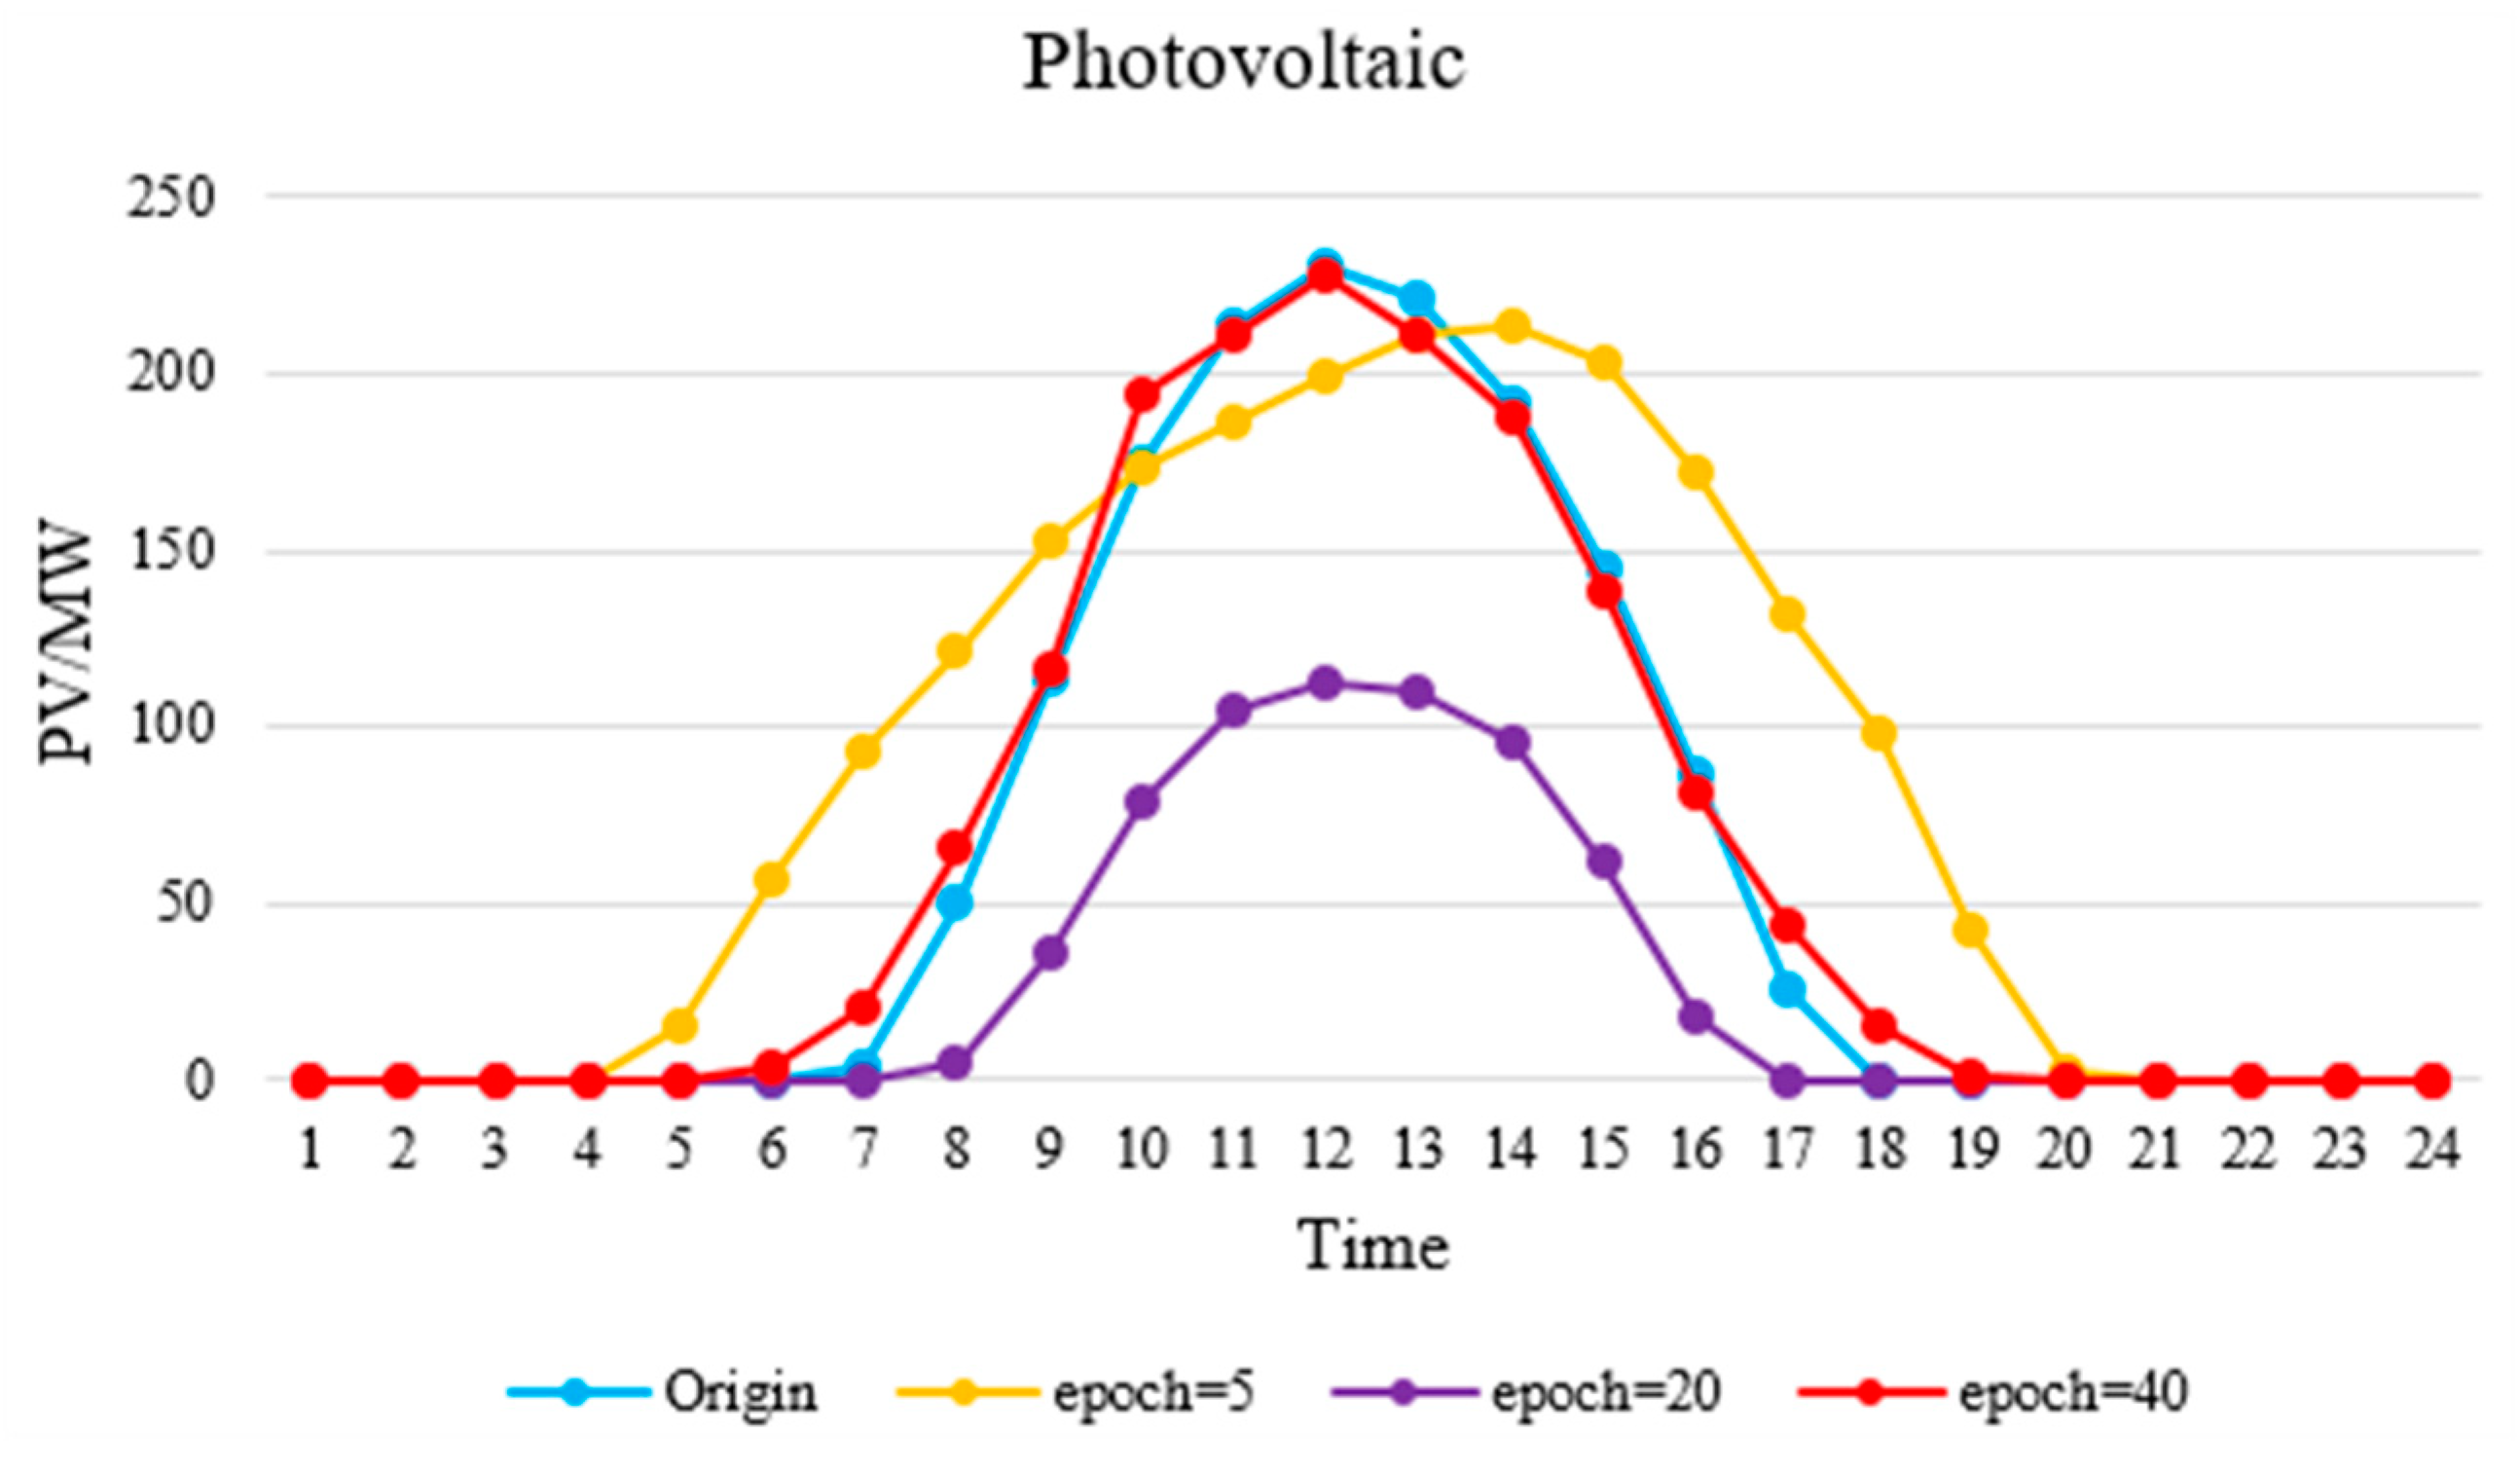
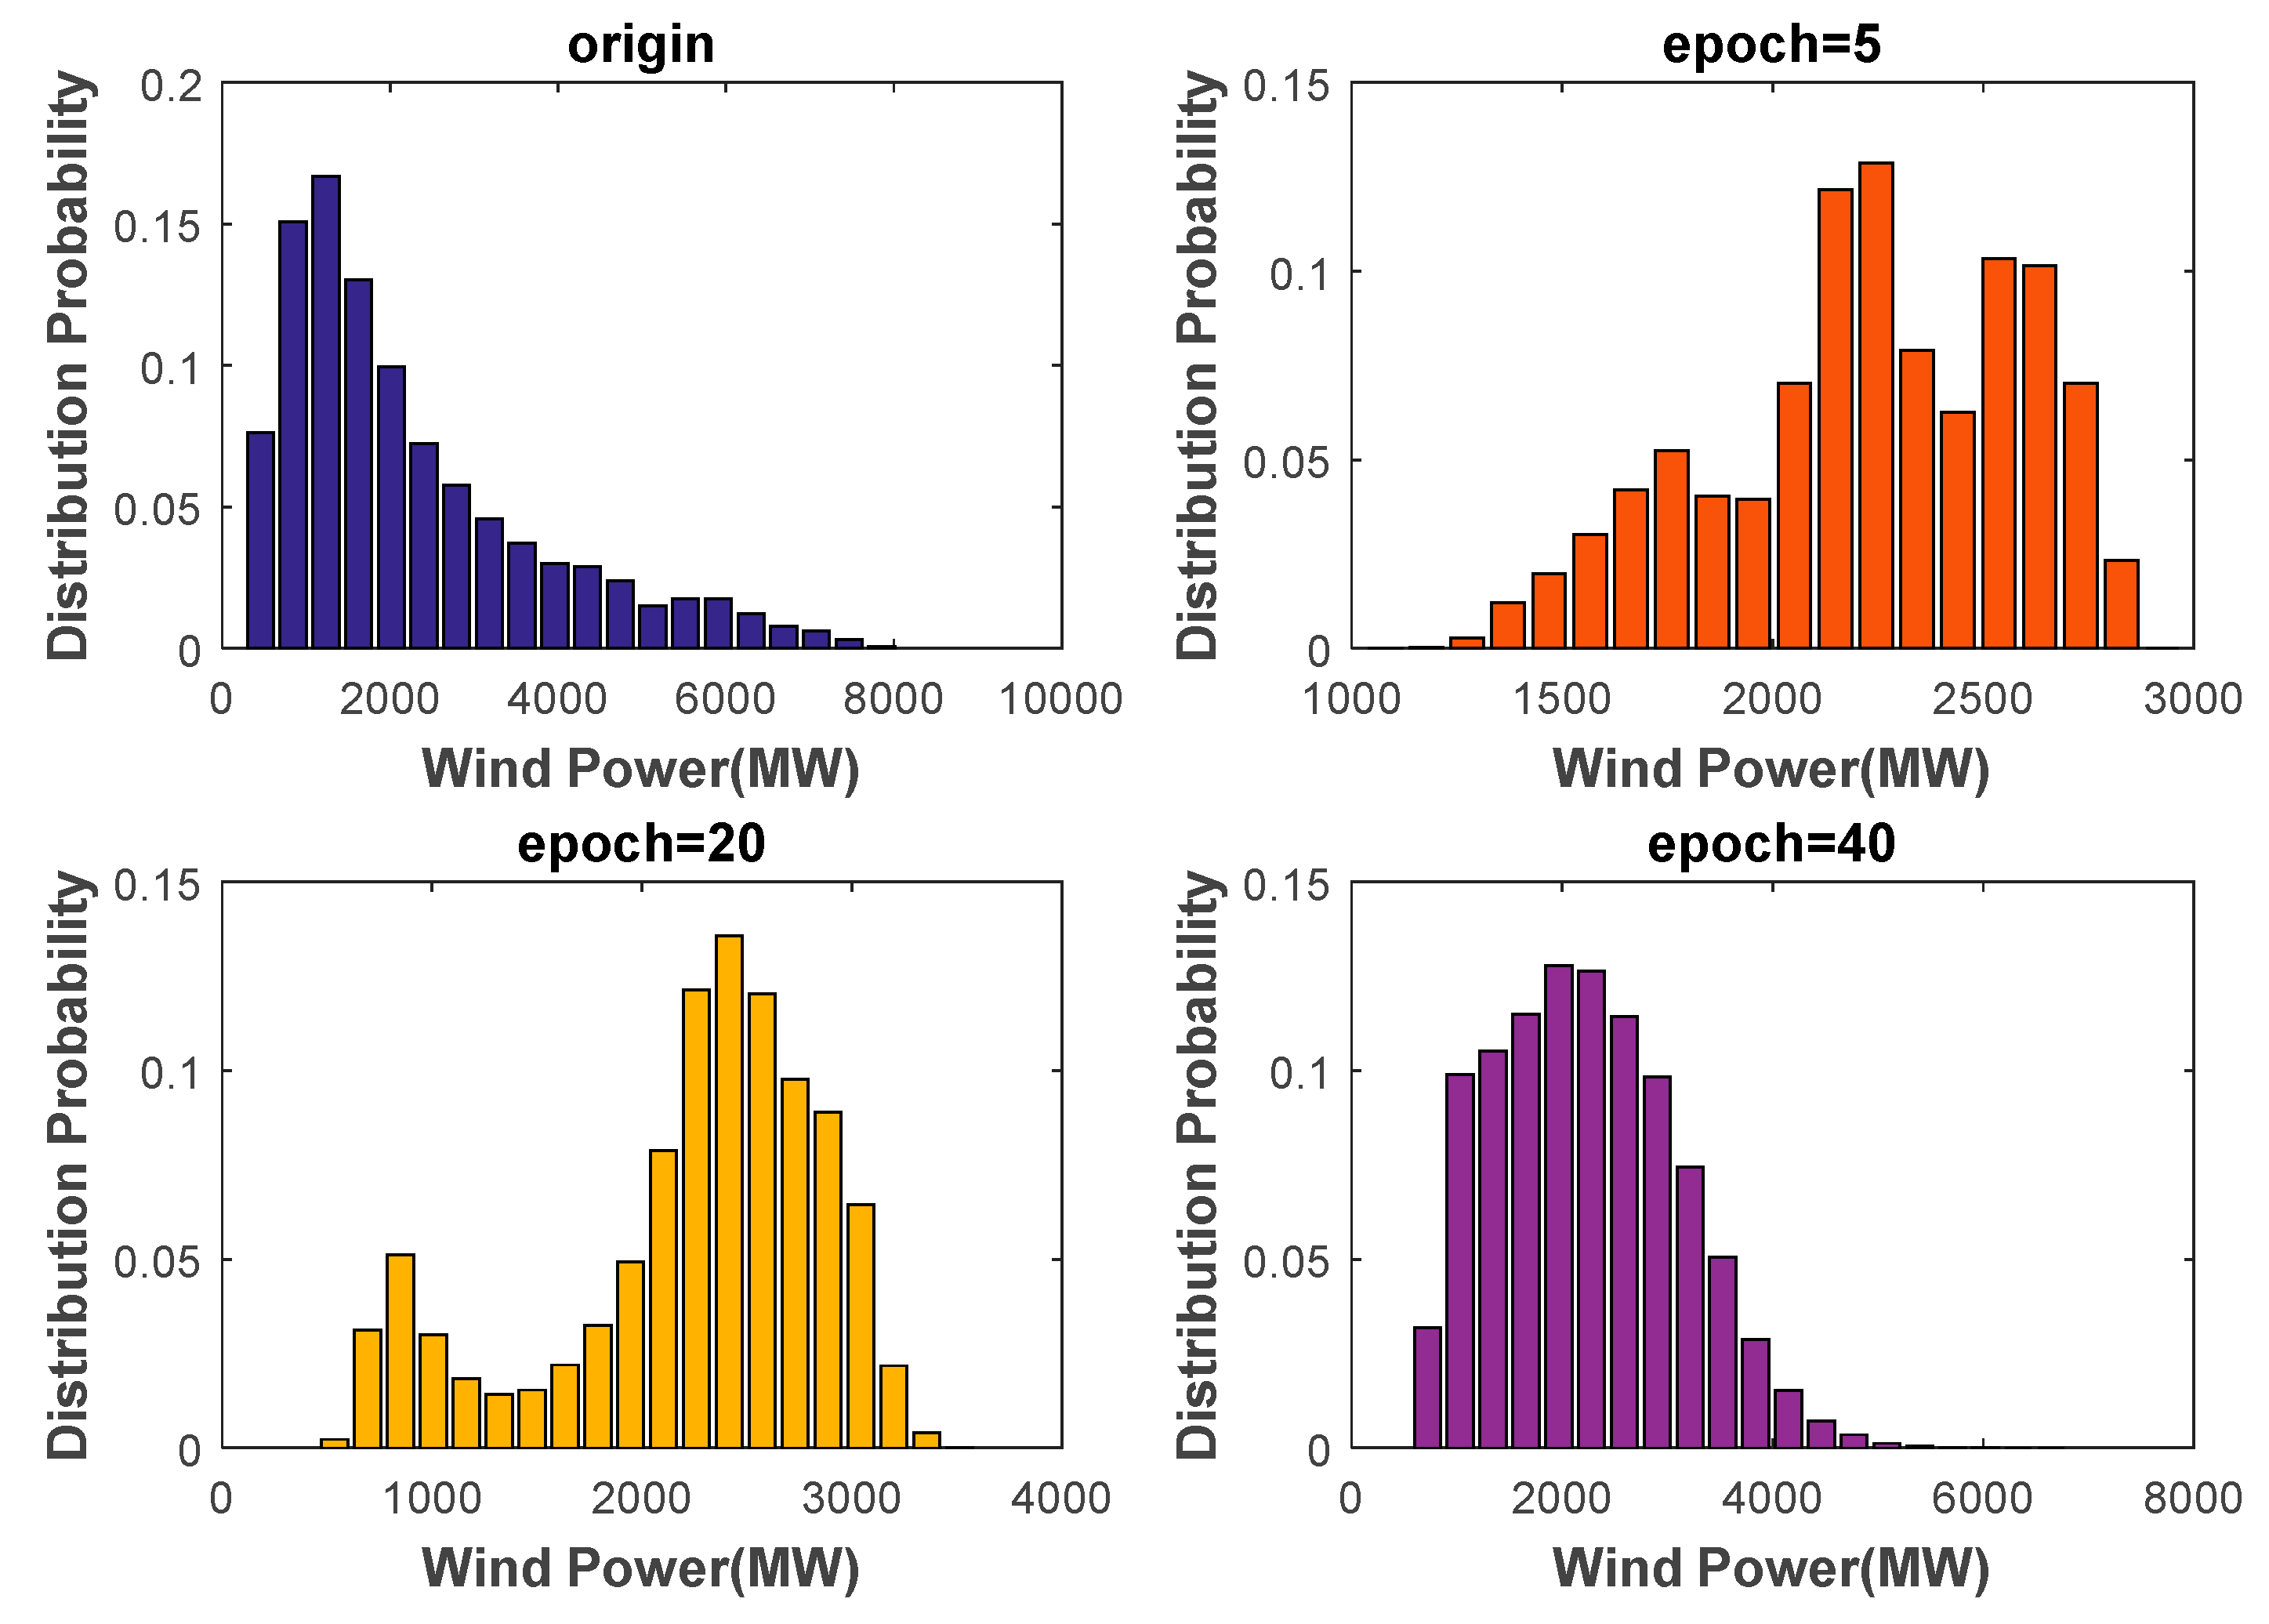
In this paper, we proposed an IES operating scenario generator, based on a GAN method using a single generator and a discriminator. Besides diversifying the scope of the data, the generator generated IES scenarios of high visual quality, owing to its ability to capture time sequence characteristics. In addition, the CDF similarity of the wind turbine output reached 83.43%, and the autocorrelation coefficient similarity reached 88.72%.
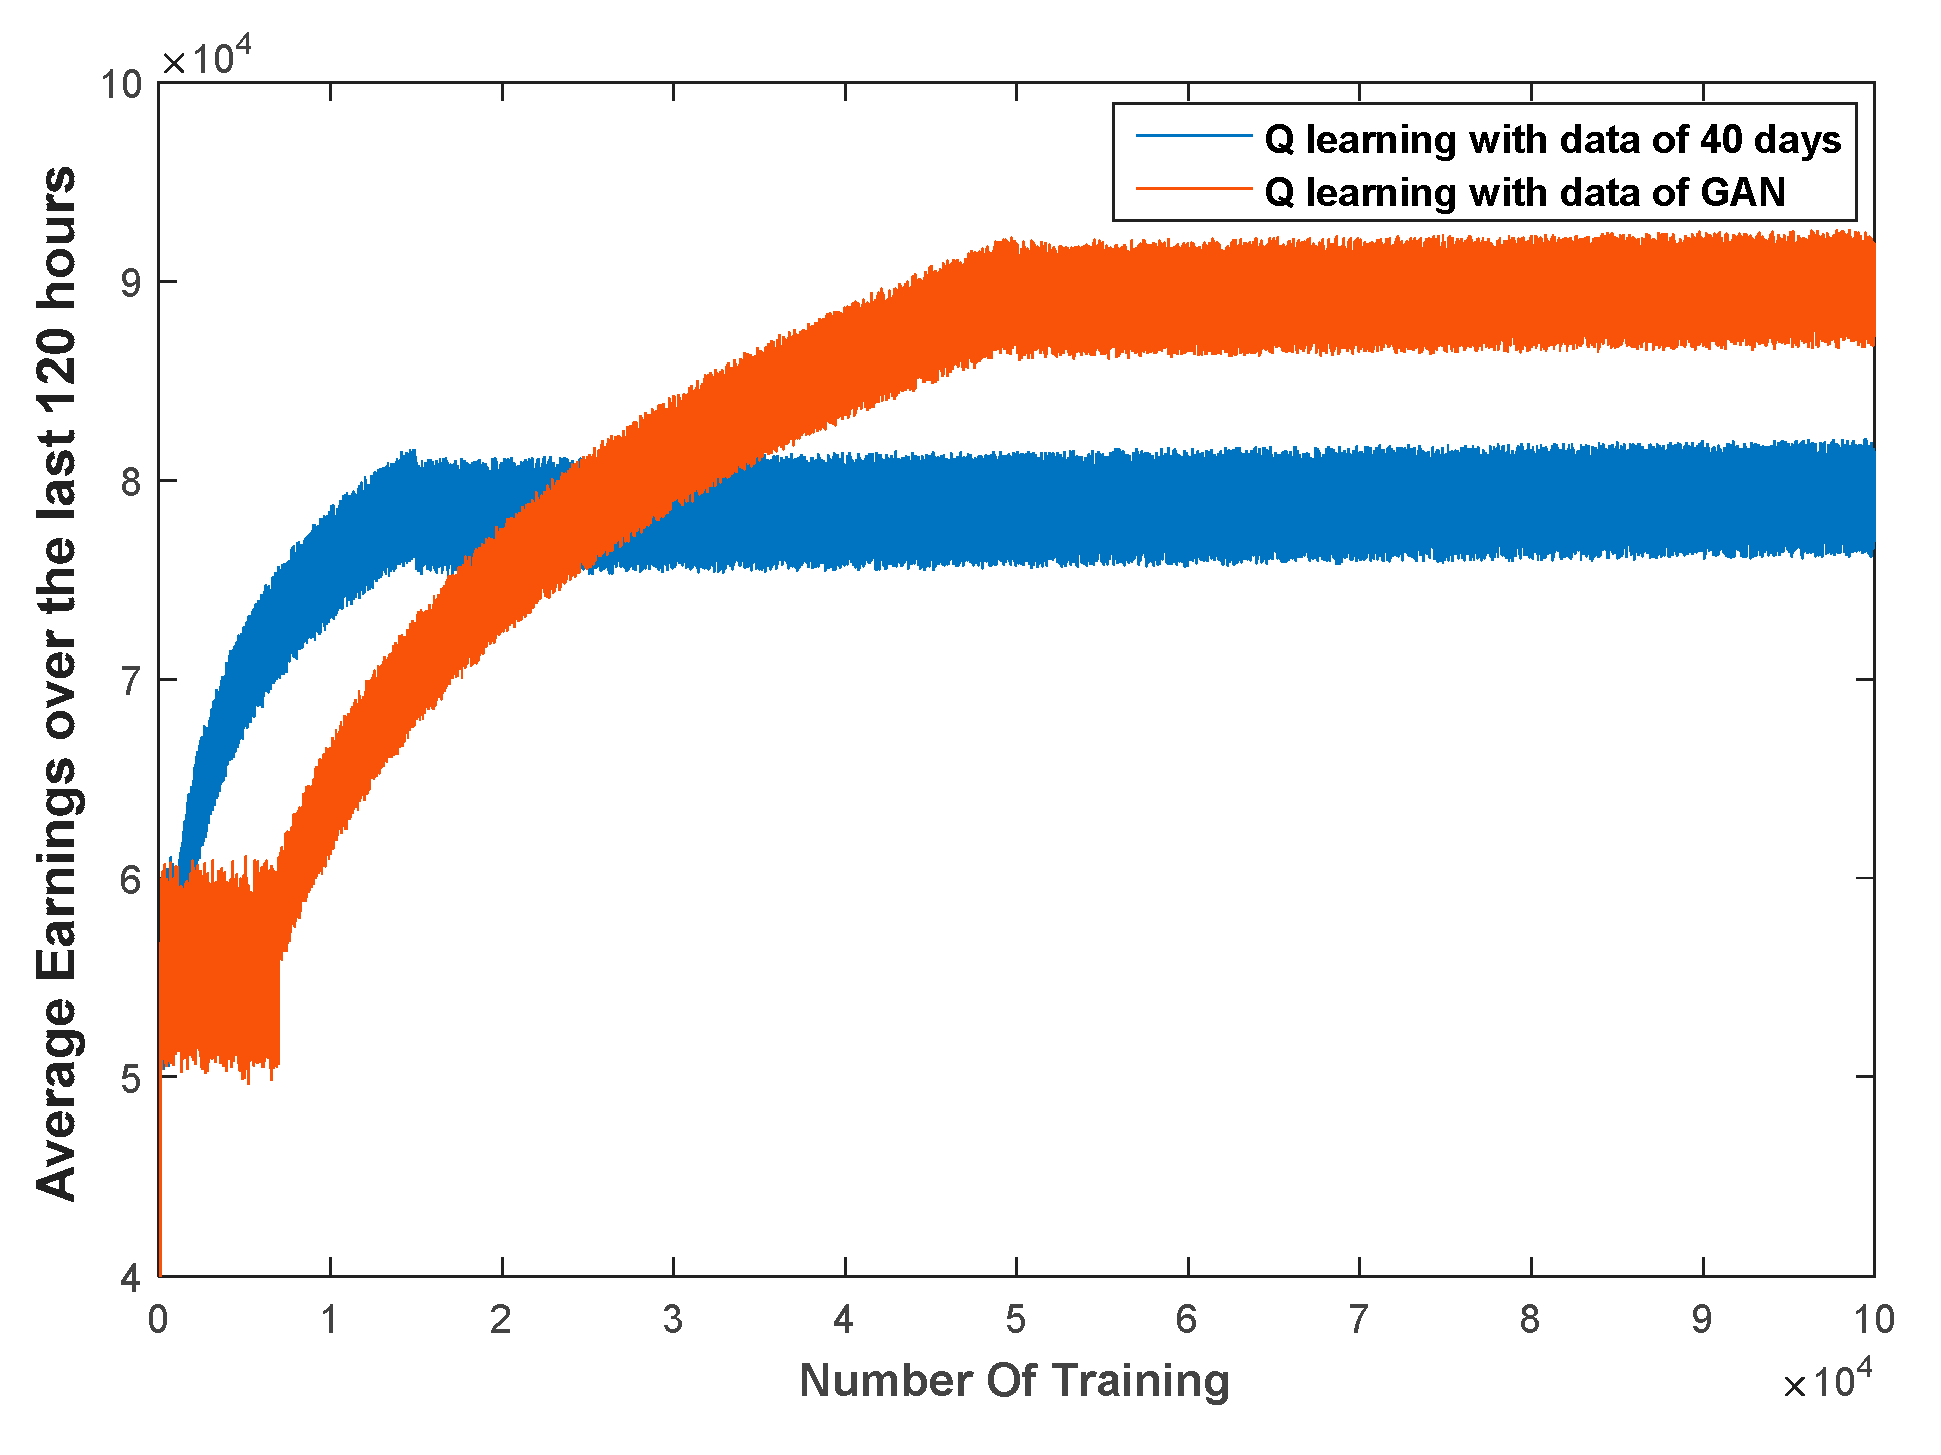
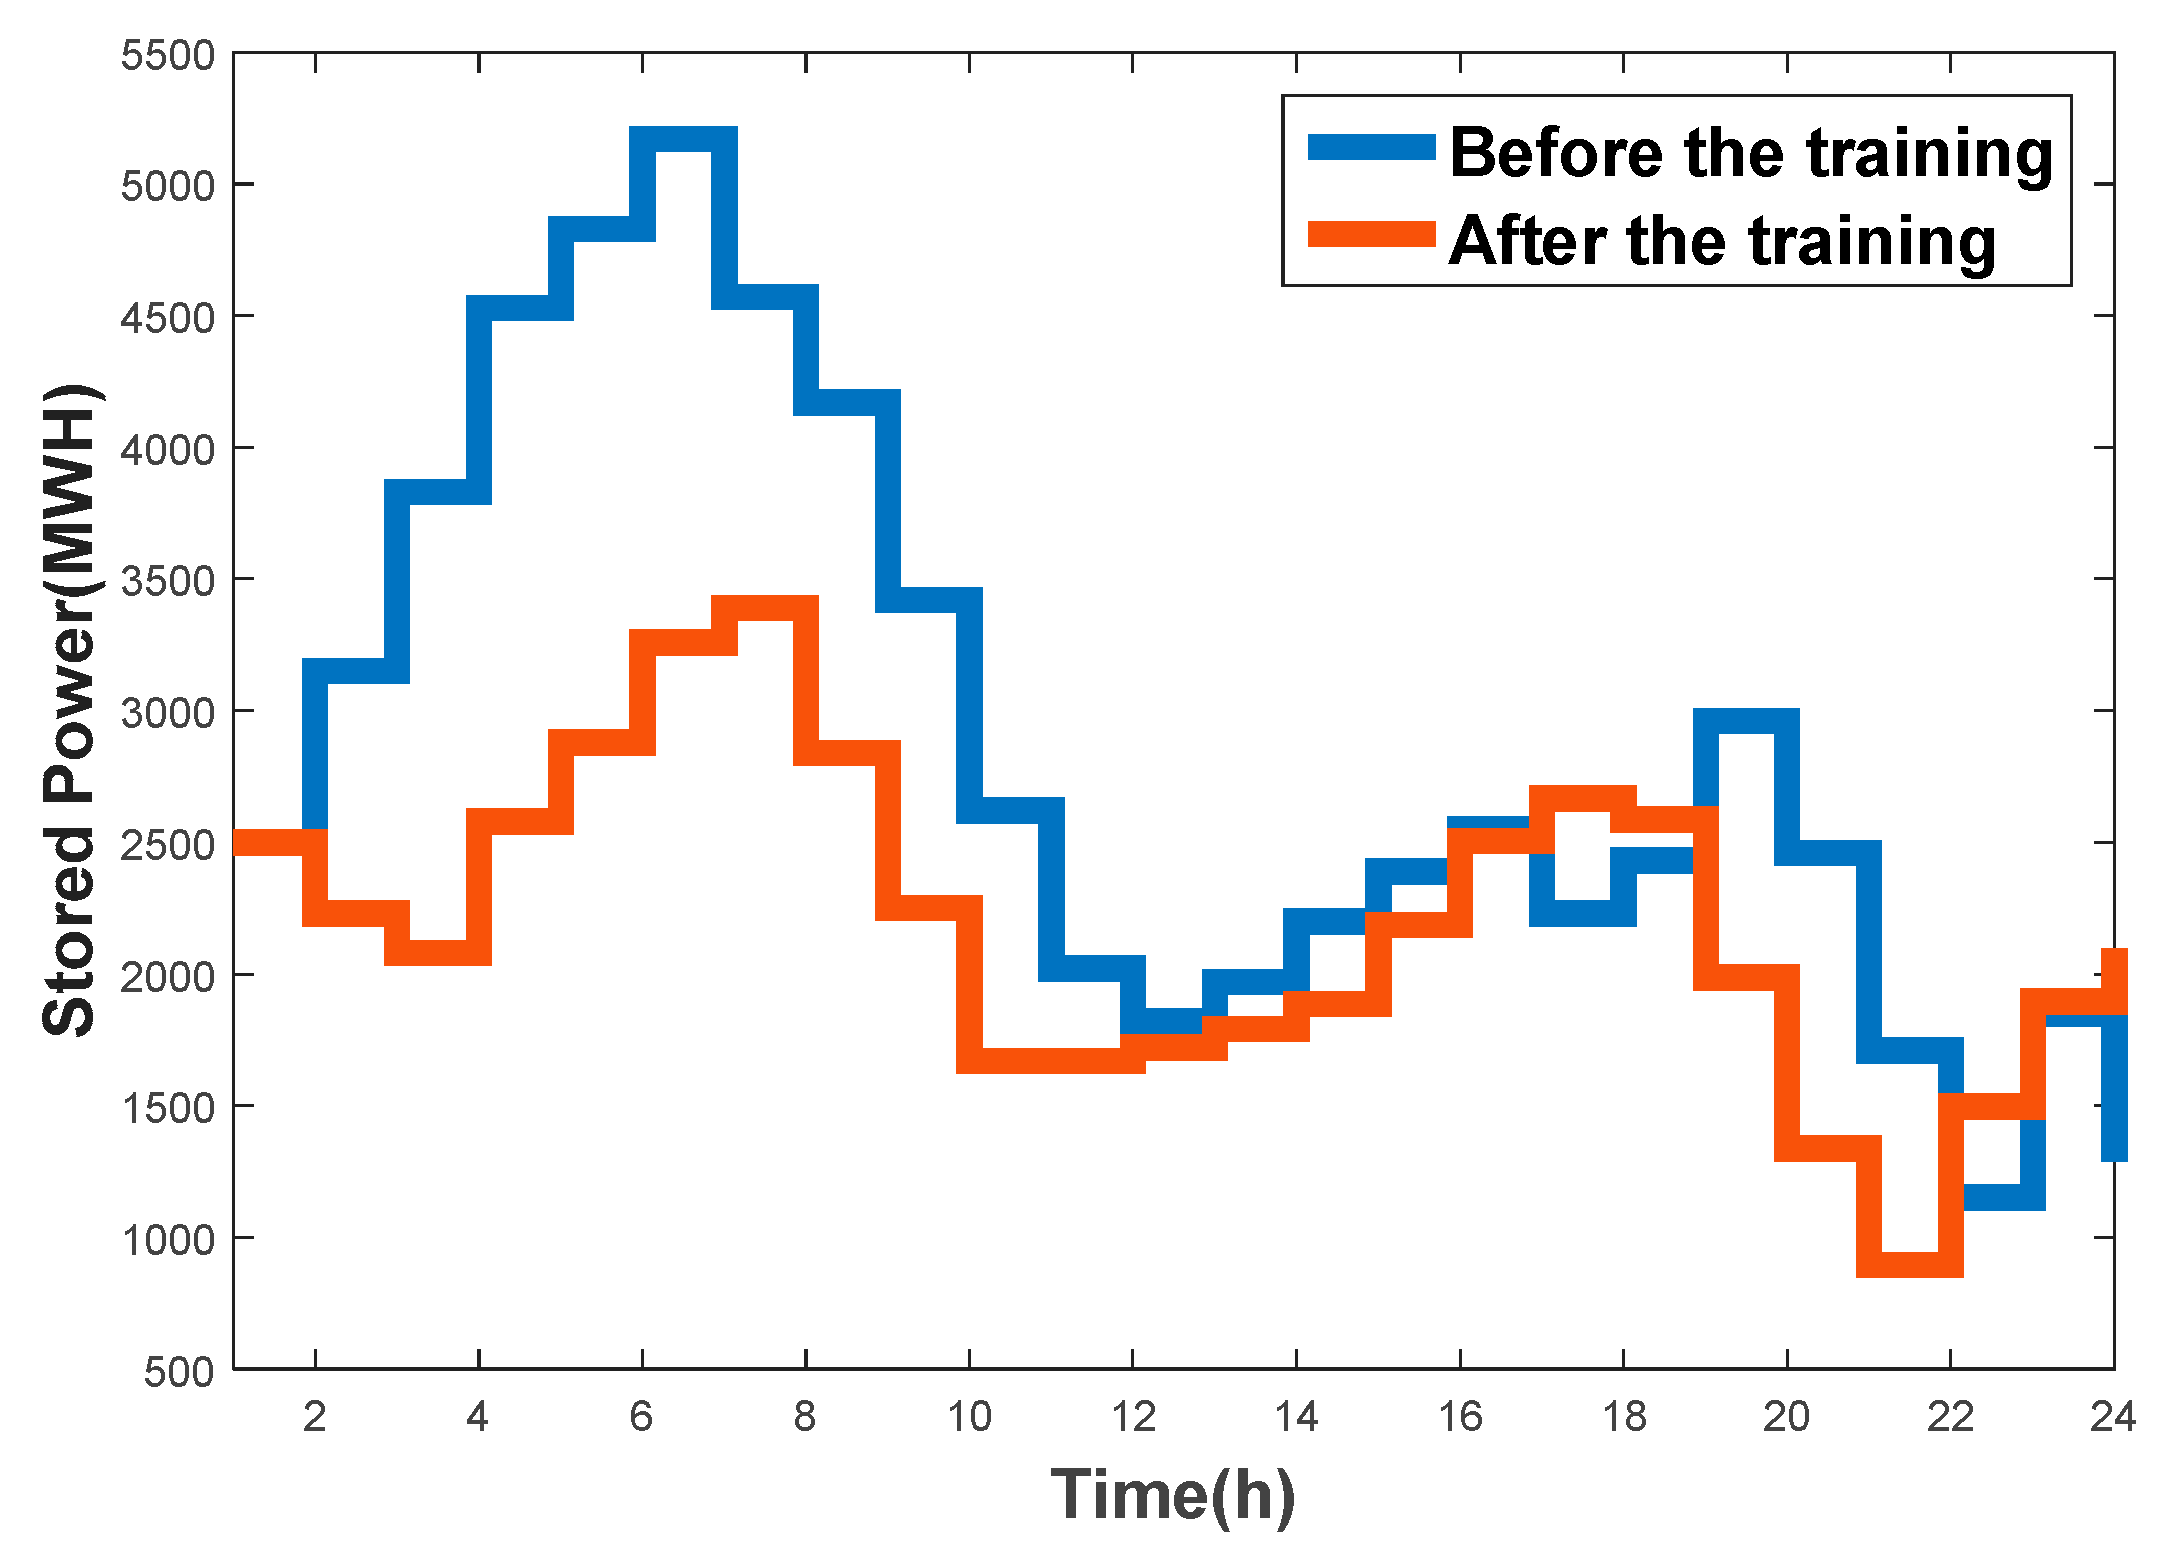
Furthermore, we proposed a control strategy for a new energy and storage system, based on the Q-learning method. For a system with high uncertainty, the Q-learning method does not depend on explicit mathematical expressions but, instead, chooses actions according to learned experience (as stored in a Q-table). This method has strong requirements for the training set: Only training sets containing a comprehensive scope of operating scenarios can allow the agent to learn accurate mapping relations in the training process. The agent selects the most appropriate control action, according to the Q-table, with relation to the current scenario. Hence, we trained the Q-table with both the original data and the expanded data using GAN method for comparison. The results showed that the average hourly income using the latter was 12,000€ more than that of the former, which verifies the richness and authenticity of the extended data.
According to these qualitative and quantitative result analyses, the performance of GAN generator accords with our original design. It could generate data that are similar to the raw data distribution, which could support the data-driven method research for IES. It can be seen from the existing researches of data-driven methods in IES that more high-quality operational data is beneficial to improve the accuracy of the model or control strategy. [
19] addresses a big data modeling for complex smart grid, its result of fault detection shows that multiple fault structures cannot be detected. We infer that the lack of these structures in training set causes the problem. If the generated fault samples are added to the training set, the generality of model can be improved. [
5] gives a big data analysis method for estimating driving range of an electric vehicle, and achieved high accuracy. Its accurate model of batteries is based on large, comprehensive operational data.
However, there are limitations in the work. In future works, we will consider more factors in terms of the generators, including the IES network architecture and transport characteristics of different energy. On this basis, we hope to build a comprehensive integrated energy system operation scenario generation method. When users input the structure of the integrated energy system, the generator could generate matching operational data. Data-driven technology does not conflict with classical analysis or pretreatment. When it is not possible to solve the problem with a mechanistic model, data-driven method is a good alternation. We hope this study can serve as the basis for data-driven research, which could ensure adequate and high-quality research data resources.


