Article

Study on Evolution of Food Safety Status and Supervision Policy—A System Based on Quantity, Quality, and Development Safety

1
China Institute of Regulation Research, Zhejiang University of Finance & Economics, Hangzhou 310018, China
2
School of Public Affairs, Zhejiang University, Hangzhou 310058, China
*
Author to whom correspondence should be addressed.
Sustainability 2019, 11(23), 6656; https://doi.org/10.3390/su11236656
Submission received: 11 October 2019 / Revised: 16 November 2019 / Accepted: 19 November 2019 / Published: 25 November 2019

Abstract

:
This paper aims to construct an index system of evaluating food safety status, composed of three sub-systems—quantity safety, quality safety, and development safety. The index system is designed to collect annual data from 2005 to 2017 and run a chronological evaluation on China’s food safety status based on an entropy method. The evaluation results indicate that though China’s food safety supervision effect has been stably sound, the highest score is 0.7392 (in 2017). In addition, the proportions of the above three sub-systems were changed towards a balanced trend, with quality safety rising from less than 7% to 36.19% as a significant part of the evaluation of the effect of food safety supervision. In terms of single indexes, agrochemical input intensity and the ontology of agro-production safety have made relatively great contributions, while the indexes that embody price safety lack stability, and the roles of indexes related to development safety in the effect of food safety supervision have been increasingly recognized and valued.

1. Introduction

Information asymmetry is the source of food safety issues, leading to adverse selection, moral hazards, and higher transaction cost in the food market. To solve the consequent problem of low-efficiency allocation of market resources, the Chinese government, in light of the transmission features of food safety information, has been carrying out increasingly strict supervision on food safety and the food market. For example, China issued the Agricultural Product Quality Safety Law of the People’s Republic of China in 2006 and the Food Safety Law of the People’s Republic of China in 2009, established the “Food Safety Committee of the State Council” in 2010, and proposed food safety as a national strategy during the 13th Five-Year Plan. In so doing, China tried to improve the food market and thus curb further chaos via a better supervision system based on sound laws and regulations. Facing frequent and repeating food safety issues, however, the government suffers questioning of the effectiveness of its supervision. Some scholars categorize insufficient supervision, information asymmetry, and lack of public trust in supervision as major reasons for food safety issues [1], making the supervision effect the focus of all walks of life. In addition, food safety supervision is not only an integral part of social supervision, but also one of China’s current measures to keep a balanced structure of supply and demand, and to improve the quality and efficiency of the supply side. Caswell et al. divided food safety information into symmetric information and asymmetric or incomplete information, and believed that in case of asymmetric information, food labels would turn food from trusted goods into goods with search attributes [2]. Previous studies on the effectiveness of food safety supervision mainly focused on whether supervision could solve the problem of information asymmetry. In detail, Li Gongkui et al. put forward that lack of government supervision drove the food market into “a market for lemons”, and that government supervision can indirectly help information transfer to offset market failure due to poor food safety caused by information asymmetry [3]. Caswell et al. and Antle found that the effectiveness of food safety supervision based on marketization is in significant relation to the information disclosure system, including the formation mechanism for reputations of producers and operators, food certification, and label regulation [4,5]. Wang Junhao and Zhou Deyi et al. proposed that during government supervision, supervisors, producers, operators, and consumers are in a multiple “principal–agent relationship”, and that information asymmetry between supervisors and supervisees, superior and subordinate supervisors, and supervisors and consumers may affect food safety as well as the effectiveness of food safety supervision [6,7]. Nonetheless, as the role of government supervision became increasingly recognized as that of solving information asymmetry in food safety, scholars started to pay attention to how to improve the effectiveness of supervision. Research directions from the perspective of economics include consumer behavior [8], externality of food safety issues [9], property rights definition [10], and behavioral games in food safety supervision [11]. In the meantime, targeted legal systems [12,13], standardization and detection systems [14], and tracing and early warning systems [15,16] have been accounted as critical methods for improvement of the effectiveness of supervision. Recently, the effect of supervision on food safety has been gradually gaining the attention of scholars worldwide. Scholars held the view that to improve the effectiveness of supervision, we need to not only increase the intensity but also reform the patterns [17,18,19]. Although relevant researches have systemically studied the effectiveness of government supervision and tried to find the way towards ideal effect by continuously rectifying the existing patterns, few of them have evaluated the effect of supervision.
In recent years, a few scholars started to evaluate the effect of food safety supervision, focusing on studying the economic efficiency, institutional performance, and mechanism of supply and demand of food safety supervision. According to Antle, the cost of supervision of the safety of meat products is higher than the profits, failing to reach the expected economic efficiency [20]. Liu Peng, by studying the food safety supervision systems in China during each time period and surveying the changes in food safety in recent years, came to the conclusion that food safety in China has been in a “V-shaped” trend. In addition, based on the status quo, Liu Peng proposed a future reform direction for China’s supervision [21]. Wang Dianhua argued that, in line with the step curve, the market behavior of food safety supervision might not achieve the expected effect because of its inability to meet the diverse needs of consumers. Li Zhongdong applied the VAR (Value at Risk) model to run analysis on five indexes—labor productivity, gross output of the food industry, supervision frequency, punishment frequency, and pass rate in spot checks, and found that supervision frequency, punishment frequency, and labor productivity are beneficial to improving the effect of safety supervision on the food industry [22]. All of these efforts are sound references for evaluating the effect of food safety supervision, but they cannot cover the overall goals of the current supervision. Though government supervision needs to consider both cost and profit, the food safety issue is not just an economic issue, but an issue related to peoples’ health, social stability, and international relations. In fact, the social significance of such supervision may be more critical than its role in the economy. The non-competitiveness of food safety information and non-excludability of supervision require the evaluation of the effect of government supervision to be comprehensive, as food is a special commodity. Additionally, the indexes of the evaluation must be kept in line with the supervision goals in certain periods. However, current practical evaluations of the effect of food safety supervision and index systems are far from enough. Therefore, study of the efficiency and food safety status are of urgent significance. This paper aims to construct an index system of evaluating the effect of supervision on food safety and to analyze the trends of the effect of supervision in China from 2005 to 2017 via an entropy method. At the same time, based on the analysis, this paper proposes reasonable suggestions on policies as a reference for the improvement of China’s system for supervision of food safety.

2. Development History of Food Safety Supervision in China

Evaluation of food safety status depends on what particular food demands the society has in a particular period of time, and government intervention is to make sure that the supply chain meets the food demands. Therefore, the content of supervision mostly matches the evaluation of the effect of supervision and, in fact, demonstrates the goals of government supervision. In general, since the founding of the new China, food safety supervision in China has been divided into the following four stages.

2.1. Absolutely Centralized Supervision (1949–1964)

In the early days of the new China, the Chinese government established the system of planned economy and demanded that every supervision mechanism runs under this mandatory system, so that food safety supervision was in an “absolutely centralized” pattern. During the war period, the country favored heavy industry over agriculture, resulting in a shortage of food supply; the supervision back then was centered around guaranteeing the “quantity safety”. After China fully released its agricultural labor force and coordinated factors like land and capital via land reform, cooperation, and peoples’ communes in the countryside, food quantity skyrocketed along with the supervision effect, particularly in the early days of this “absolutely centralized supervision”. In this stage, the “quality safety” was chiefly supervised by the Ministry of Health to solve problems in food safety.

2.2. Mixed Supervision (1965–1992)

Facing the quantity safety crisis (“Three Years of Natural Disasters”) and the emerging problem of quality safety of food, the State Council issued the Regulation on the Implementation of the Food Safety Law of the People’s Republic of China in August of 1965 to modify the food safety supervision pattern. According to the Regulation, the Ministry of Health carried out unified management of the administrative departments in the food safety industry, while administrative departments and organizations still had a say in the enaction of standards, which was hence called “mixed supervision”. As the original planned economy was transformed into a market economy in 1978, decentralization policies like household responsibility systems in rural areas and restructuring of contracting in urban economies led to a lack of superior administrative departments. As a result, changes happened in the coordination system which applied to the administrative departments of both health and food industries under the “absolutely centralized supervision” set up by the Regulation. Meanwhile, economic entities that had not been restructured faced stressful challenges, and the administrative departments started to feel reluctant to accept food safety supervision by health departments. In 1982, the Chinese government issued its first law concerning food safety—the Food Hygiene Law of the People’s Republic of China (for Trial Implementation). However, market trends had not been fully adjusted. Leading and administrative departments were still in charge of food safety issues.

2.3. Primary Stage of Stage-Based Supervision (1993–2002)

In 1993, the State Council carried out institutional reform and canceled seven economic administrative ministries and commissions, leaving no departments in charge of grain and oil, aquatic products, or catering. The food safety supervision pattern in the last stage was hence transformed from “internal” into “external supervision”. In 1995, the Food Hygiene Law of the People’s Republic of China determined the responsibilities of departments responsible for food safety supervision in each stage “from farmland to peoples’ tables”. In 2000 and 2002, the Chinese government respectively issued Product Quality Law of the People’s Republic of China and Law of the People’s Republic of China on Import and Export Commodity Inspection, marking the initiation of the “stage-based” supervision pattern. However, while the quantity safety of food was effectively guaranteed, supervision of the quality safety was not enough, causing frequent food safety issues. Food safety supervision was not fully put into practice and the effect was far from satisfactory in this stage.

2.4. Development Stage of Stage-Based Supervision (2003–Present)

As the institutional reform advanced even further, the China Food and Drug Administration (CFDA) was founded in 2003. Since then, quantity safety of food was supervised by the Ministry of Agriculture, quality safety by the CFDA and Ministry of Agriculture, and development safety by the Ministry of Environmental Protection and the Ministry of Land and Resources, marking the entrance to the “development stage of stage-based supervision”. Later, Animal Epidemic Prevention Law of the People’s Republic of China, Agricultural Product Quality Safety Law of the People’s Republic of China, and Food Safety Law of the People’s Republic of China were consequently published and were repeatedly amended. In 2010, the Food Safety Committee of the State Council was founded, making clear the responsibilities of each department in food safety supervision and giving shape to the stage-based supervision pattern. The previous Five-Year Plans further prioritized “development safety” of food, particularly in the agricultural product sector. Furthermore, in 2016, “food safety” was elevated as a national strategy. In addition, the State Council conducted a new institutional reform in 2018, including major adjustments beneficial to food safety supervision, ushering food safety supervision into a new developmental period.

3. Construction, Data Sources, and Research Methods of the Index System

3.1. Construction of the Index System

Construction of the index system for evaluating food safety status must comprehensively demonstrate the content of food safety. Food safety was initially described as “food security” by the Food and Agriculture Organization (FAO) of the United Nations in 1974. Later, as food quantity, especially grain yield, picked up gradually, the content of food safety shifted accordingly. In 1996, the World Health Organization (WHO) defined food safety as “according to their original use for food production and consumption so that consumers will not suffer as a guarantee”, paying more attention to food quality and hygiene. Since the 21st century, as the relationship between food safety and agricultural resources was gradually recognized, agricultural ecological safety would affect not only the intergenerational equity of food safety, but also the quantity and quality safety. The content of food safety was hence enlarged. Lu Liangshu divided food safety into quantity, quality, and development safety [23], covering the basic content of food safety and meeting the goals of supervision. This paper, therefore, also divided the index system into three sub-systems (Table 1).
The quantity safety sub-system is constructed in line with the criteria of measuring grain safety and food safety [24], covering eight indexes related to the primary commodities and industrial products of food—per capita consumption of grain, meat and poultry products, agricultural products, and edible vegetable oil, as well as per capita yield of grain, meat, agricultural products, and edible vegetable oil. In addition, as price is the focal point of producers, operators, and consumers during consumption [25], and price safety is a method towards harmony of interests and equitable distribution in food safety [26], this paper chose the retail price index (RPI) of drinks, tobacco, and alcohol to describe the price safety of the food quantity safety.
The quality safety sub-system is relatively complicated without much previous experience from which to draw. This paper took the following factors into account. (i) Food pass rate: Food pass rate can accurately show the status quo of food safety under government supervision, so it is mostly regarded as a critical index by scholars in different countries to measure the effect of supervision. However, due to the large volume of data, pass rate in spot checks were usually applied in researches [27]. (ii) Pesticide residue: Pesticide residue is a severe food safety issue [28], but relevant safety information on pesticide residue on food falls into the category of “credence good” and could not be evaluated empirically [29], and therefore needs strict government supervision. Among the five development goals in the National Plan for Food Safety During the Period of the Thirteenth Five-Year Plan issued by the State Council in 2016, three (food safety spot checks, abatement of agricultural pollution sources, and the establishment of food safety standards) are related to pesticide residue. This indicates that pesticide residue is an integral part of food safety supervision in China, based on which this paper chose the pass rates of pesticide residue in vegetables and aquatic products as two indexes. (iii) Indirect consumer evaluation: In the food market, a typical buyer’s market, consumers’ evaluations of quality safety could show the quality safety indirectly via their purchase behavior when they repurchase the same food or directly reflect the quality safety via complaints. During consumption, food commodities and catering services all need to address quality and safety issues. In this case, this paper selected “ratios of quality and safety complaints about food commodities and catering services” as the index of indirect consumer evaluation. In addition, the “ratio of quality and safety complaints about agricultural means of production” was selected as an index, as the source of food production would yield an impact on the quality safety via production.
In the meantime, the development safety sub-system takes sustainable agricultural development and intergenerational food security into consideration.
(i) Ontological safety of agricultural production, including three indexes—total crop acreage per capita, proportion of watershed lakes with water quality of Class III and above, and proportion of seas with water quality of Class II and above. Such indexes describe the ontological safety in guaranteeing the quantity and quality safety of food. The reason for choosing “proportion of watershed lakes with water quality of Class III and above” was that the Environmental Quality Standards for Surface Water (GB 3838-2002, GB stands for national standard in China) issued by Ministry of Environmental Protection and General Administration of Quality Supervision, Inspection, and Quarantine of the People’s Republic of China, according to utilization purposes and protection objectives, divides the surface water bodies of rivers, lakes, and reservoirs into five classes: Class I is mainly applicable to the water from sources or the national nature reserves. Class II is mainly applicable to the first class of protected areas for centralized sources of drinking water, the protected areas for rare fish, and the spawning fields of fish and shrimps. Class III is mainly applicable to the second class of protected areas for centralized sources of drinking water, protected areas for common fish, and swimming areas. Class IV is mainly applicable to the water areas for industrial use and entertainment in which they are not directly touched by human bodies. Class V is mainly applicable to the water bodies for agricultural uses and landscape requirements. Only water bodies of Class III and above are suitable for drinking water and aquaculture. The reason for choosing “proportion of seas with water quality of Class II and above” was that the Sea Water Quality Standard (GB in China 3097-1997) issued by the Ministry of Environmental Protection and State Oceanic Administration, according to different application functions and protection objectives, divides the sea water quality into four classes: Class I is applicable to marine fishery water areas, marine natural protection areas, and rare marine organism protection areas; Class II is applicable to aquaculture areas, bathing beaches, water sports or entertainment areas, or areas for industrial use directly related to human consumption, which are not directly touched by human bodies; Class III is applicable to industrial water areas and coastal tourist areas; Class IV is applicable to sea ports and marine development areas. Only sea water of Class II and above is suitable for aquaculture and industries directly related to human consumption.
(ii) Intensity of agricultural chemistry: Fertilizers and pesticides were originally applied in agriculture as an external supply means for agricultural production so as to increase the yield [30]. However, due to the hazards that they bring to agricultural resources, the environment, and food safety, they were defined as negative indexes in the evaluation system of sustainable development [31,32]. Therefore, this paper selected fertilizer application rate per crop acre and pesticide application rate per crop acre as two indexes.
(iii) Water-saving irrigation area ratio: This reflects the water-use efficiency (WUE) in agricultural production and the effectiveness of resource utilization [33,34]. This paper, consequently, chose the ratio of water-saving irrigation area to farmland irrigation area.

3.2. Data Sources

Data for the indexes applied in this paper are from the period of 2005 to 2017. Data for the indexes in the quantity safety sub-system (A) came from the China Statistical Yearbook for the corresponding year (2006–2018); data during 2005 to 2012 for food pass rate in spot checks (Q1) came from the official website of the China Association for Quality Inspection (http://www.chinatt315.org.cn), and data during 2013 to 2017 from the official website of the State Administration for Market Regulation of the People’s Republic of China (http://www.samr.gov.cn); data for pass rates of pesticide residue in vegetables (Q2) and pesticide residue in aquatic products (Q3) came from the Routine Monitoring of the Ministry of Agriculture on the Quality of Agricultural Products (http://www.moa.gov.cn) of the corresponding years; data for the ratio of quality and safety complaints about agricultural means of production (Q4), ratios of quality and safety complaints about food commodities (Q5), and ratios of quality and safety complaints about catering services (Q6) from Almanac of the Industry and Commerce Administration of the People’s Republic of China of the corresponding years (2006–2018); data for total crop acreage per capita (D1), proportion of watershed lakes with water quality of Class III and above (D2), and proportion of seas with water quality of Class II and above (D3) from China Statistical Yearbook on Environment of the corresponding years (2006–2018); data for fertilizer application per crop acre (D4), pesticide application rate per crop acre (D5), and ratio of water-saving irrigation area to farmland irrigation area (D6) from China Rural Statistical Yearbook of the corresponding year (2006–2018).

3.3. Research Methods

This paper applied an entropy method to analyze the index system for the evaluation of food safety supervision. This entropy method could display the change rate of indexes in the system based on the index weight to effectively describe the differences among indexes. At present, this entropy method has been well applied in many fields, including in development evaluation and early warning measurement [35].
(i) For the positive and negative directions in the system, this paper used range standardization to quantify all the indexes. Positive indexes are:
X i j = ( X i j X min , j ) / ( X max , j X min , j ) .
Negative indexes are:
X i j = ( X max , j X i j ) / ( X max , j X min , j ) .
X i j represents the j index value in the year i; X i j represents the value of X i j after standardization; X min , j and X max , j represent the minimum value and the maximum value of the j index in all years, respectively. According to the standardized values of the indexes, the ratio of the j standardized value in the year i is:
R i j = X i j / i = 2005 2017 X i j .
(ii) Entropy value and weight of indexes.
Entropy describes the probability of feature information in indexes, indicating the degree of order of the j index. The ratio of the standardized value of the j index is employed to calculate the entropy value of the j index:
h j = K i = 2005 2017 R i j ln R i j .
K is a constant related to m, the number of years (m = 10 in this index system). In the information disordered system, the entropy value reaches the maximum: h = 1; in terms of years, the j index is completely disordered, so R i j = 1 / m and K = 1 / ln m . The utility value (d) of the j index is determined by the difference between 1 and the entropy value (h):
d j = 1 h j .
Therefore, the weight of the j index can indicate the significance of the index. Here is the formula:
w j = d j / j = 1 n d j .
(iii) Evaluation of the status of the index system.
First, we need to calculate the evaluation value of the j index in the year of i:
f i j = w j R i j .
Then, we get to the effect score of the year i:
F i = j = 1 n f i j .
Greater F i means better food safety status.

4. Empirical Analysis Based on the Entropy Method

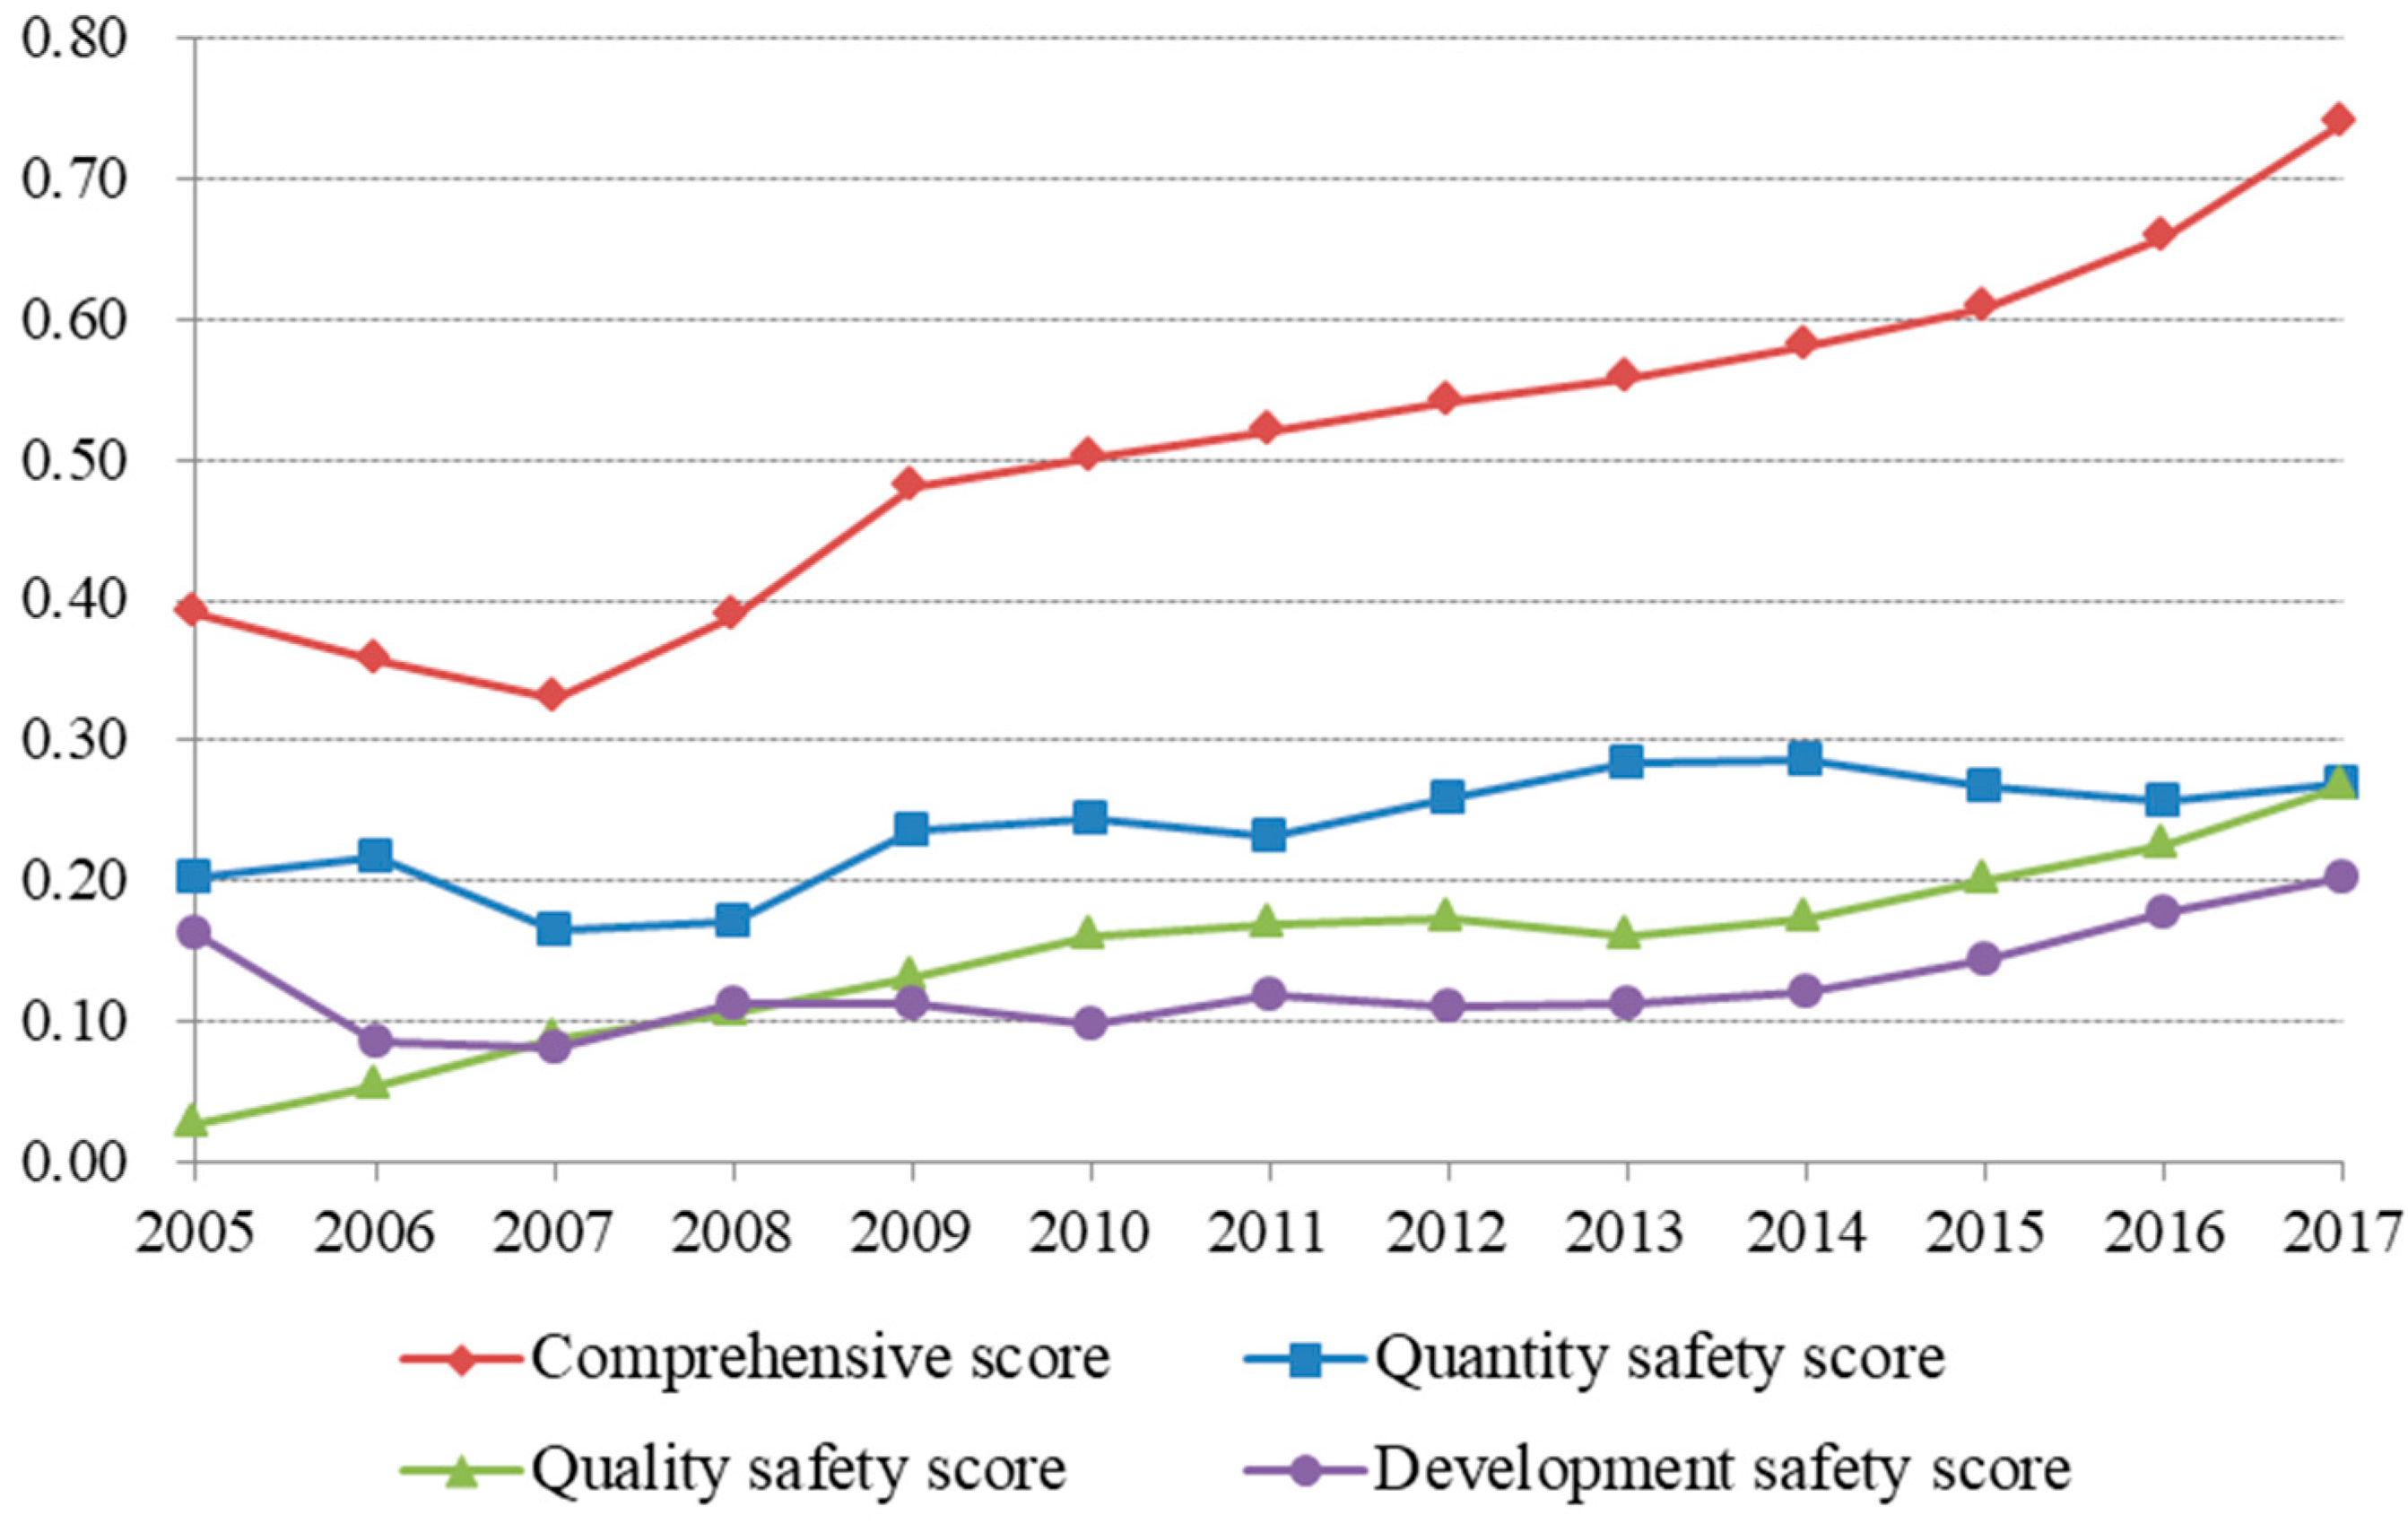
Since 2005, the food safety status in China has been picking up in a stable trend (Figure 1). The lowest score was in 2007, due to the relatively low score of the quantity safety. Though the quality safety increased dramatically in that year, the quantity safety still had a dominant effect on the overall status. On the other hand, it proved that the improvement of food safety status depends on the concerted efforts of the three sub-systems—quantity, quality, and development safety. As for the specific indexes, the “negative” RPI rocketed from 102.56 (in 2006) to 112.30 (in 2007). Price safety is equal to equitable distribution. Meanwhile, though China always implemented strict supervision policies to make the commodity price stable, RPI saw a drastic year-to-year growth in 2007, resulting in failure of the food safety supervision. The reason lay in the increased demand from the international market, the cost of the food industry, and the supply shortage of food in China.
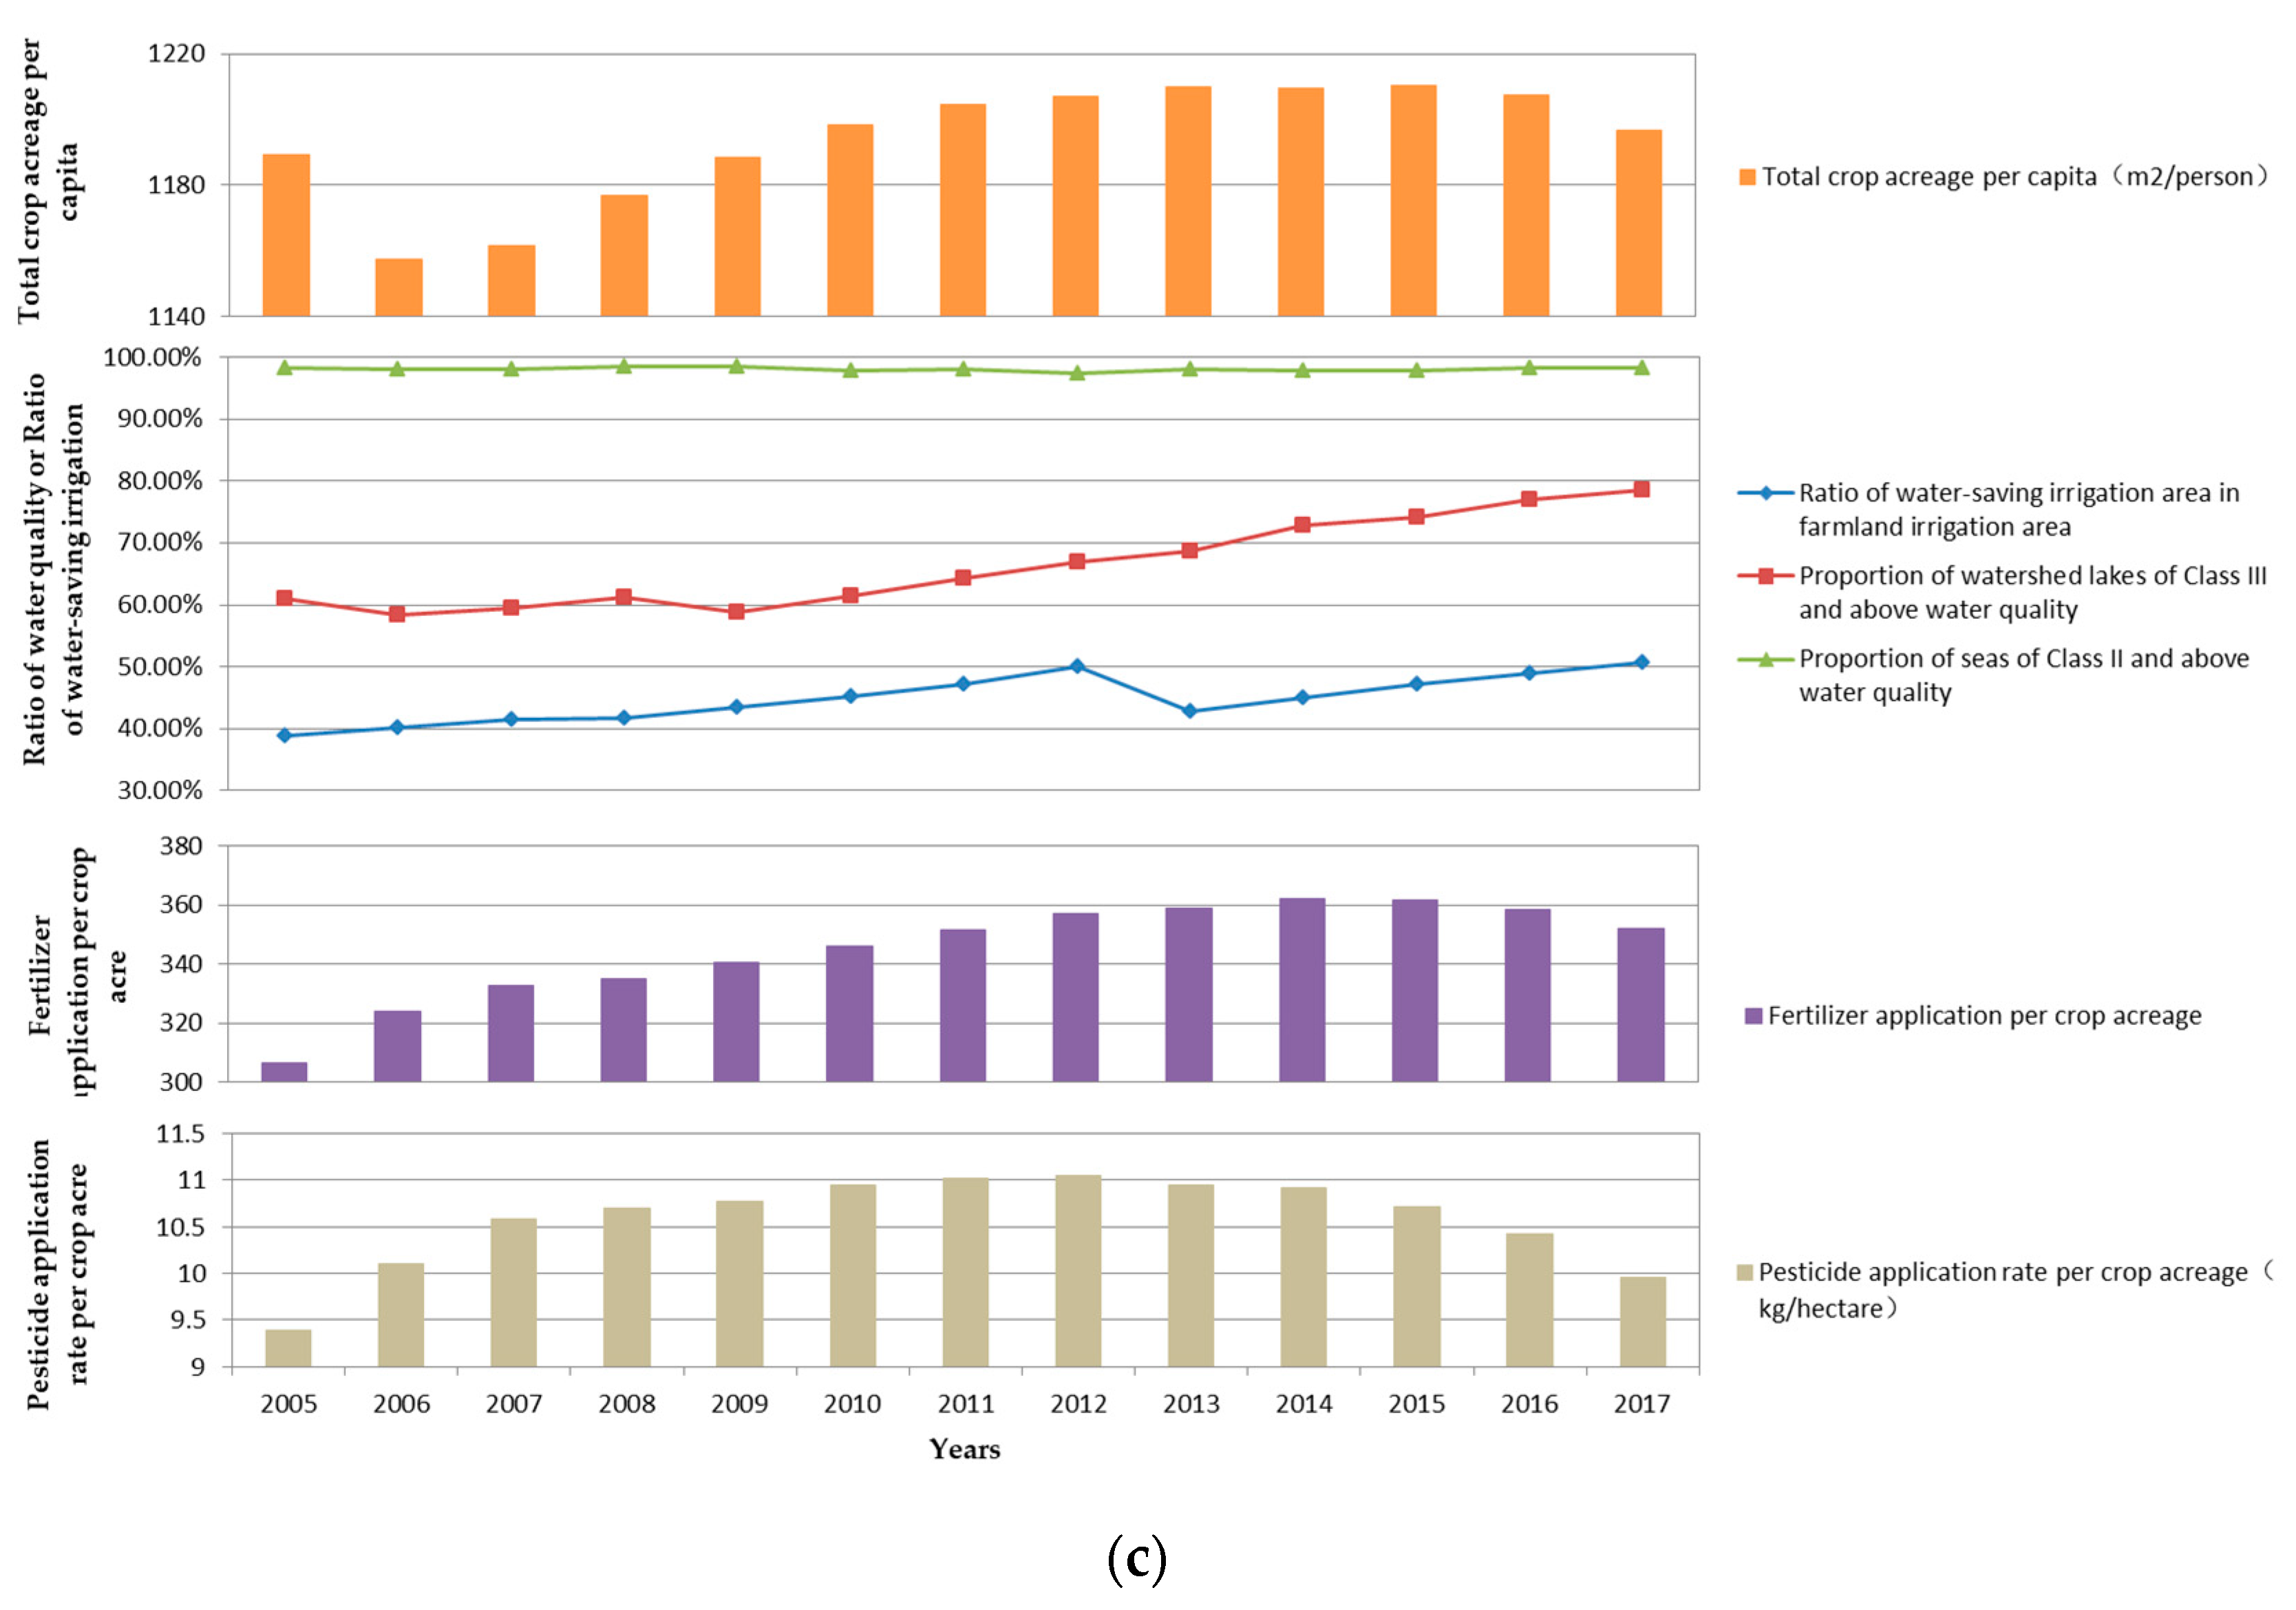
In detail, the effect of the quality safety sub-system underwent a fast growth. China’s 11th Five-Year Plan clearly declared the ensuring of quality safety and food safety of agricultural products in the sections concerning “promoting the development of modern agriculture” and “safeguarding the safety of peoples’ life and property”. The plan also proposed specific requirements for standardization and the construction of a supervision system. Later, as the laws and regulations were amended, a supervision system was established, criteria and certification were perfected, traceability and early warnings were set up, and supervision on quality safety was tightened, the effect of supervision on food quality safety rose from 0.0262 (in 2005) all the way to 0.2675 (in 2017), and went from accounting for less than 7% to 36.19% and becoming an integral part of the evaluation of the effect of food safety supervision. The development safety sub-system showed a declining and fluctuating state before 2012, and the lowest value appeared in 2007 (0.0802); it began to grow stably from 2012, and reached the largest value in 2017 (0.2021), when the significance of development safety in food safety became recognized, and supervision of development safety was also increasingly strengthened. The 11th Five-Year Plan put forward concrete demands for “preventing and treating pollution from the source” and “applying fertilizer and pesticide in a scientific way”, and began controlling pollution in key watersheds, regions, and coastal zones, regulating the degree of participation of agricultural chemistry in production. As a result, the growth of the application intensity of agricultural chemistry slowed down. The purity of fertilizer application per total sown area is taken as an example (Figure 2c). Its growth rate dropped from 5.66% (in 2006) to −0.11% (in 2017). In comparison, the effect of the quantity safety sub-system became less significant. For instance, though the score for quantity safety dropped greatly in 2011, it did not affect the uptrend of the overall evaluation, unlike in 2007. The reason was that food safety is, in nature, an absolute concept, so that quantity, quality, and development safety are equally important and need to progress in a balanced way. All of the Five-Year Plans since 2006 treated the three sub-systems as priorities of government supervision.
In terms of the indexes (Table 2), the contributions to the evaluation of status are relatively even. Ratio of quality and safety complaints about food commodities, pesticide application per crop acre, proportion of watershed lakes with water quality of Grade III and above, and ratio of quality and safety complaints about catering service—all in the development safety sub-system—contributed the most (weight over 4.70%). Among them, the two indexes of ratio of quality and safety complaints indicated a negative direction, which directly reflected consumers’ satisfaction with the quality safety situation. Almost at the same time (in 2008 and 2009), they began to decrease significantly, indicating that the trend of food quality and safety in the consumer terminal is getting better (Figure 2b). To be more specific, the proportion of watershed lakes with water quality of Grade III and above rose from the original 60.90% to 78.50%, while pesticide application per crop acre, after a lasting growth, saw a continuous drop in 2012 (Figure 2c). This means that under government supervision, the development safety experienced great changes and the effect of supervision was relatively obvious. In addition, there were four indexes whose contribution rates were less than 4.40%. Per capita consumption of meat and poultry products and per capita consumption of edible vegetable oil were both in quantity safety. As the quantity of agricultural products and industrial food products picked up stably, China’s food yield has well surpassed food consumption. In 2017, for example, the per capita yield of edible vegetable oil has reached 4.20 times of its per capita consumption, showing that the Chinese diet structure needed to be adjusted. Moreover, RPI of food was not stable, and experienced three major fluctuations in 2007, 2008, and 2011 during the period between 2005 and 2017, reaching 112.30, 114.38, and 111.90 respectively, with a percentage gain over 10%. It had a great impact on food safety status, indicating that the government supervision was far from enough in this index.

5. Conclusions

This paper analyzed the development of food safety supervision in China. Then, this paper constructed an index system for evaluation, consisting of three sub-systems—quantity, quality, and development safety; chronological evaluation on China’s food safety status was run based on an entropy method for the period from 2005 to 2017, and finally came to the following conclusion.
(i) China’s food safety status kept a stable trend. Despite the fluctuation in 2007, the score increased from 0.3899 (2005) to 0.7392 (2017), with a growth rate of 88.82%; the food safety situation improved significantly.
(ii) The contribution of the quality safety sub-system to the improvement of food safety is obvious, increasing from less than 7% to 36.19%. Although development safety has been rising steadily since 2012, its contribution rate in 2017 was still lower than the other two sub-systems, so more attention should be paid to it. Meanwhile, quantity safety gave away its dominance as the overall evaluation criterion for effect on food safety status, which tended to depend on the balance of quantity, quality, and development safety. One low-ranking factor could hardly affect the overall evaluation score.
(iii) Ratio of quality and safety complaints about food commodities, proportion of watershed lakes with water quality of Grade III and above, pesticide application per crop acre, and ratio of quality and safety complaints about catering service made relatively greater contributions. Indirect consumer evaluation was more targeted at direct reflection of the food safety status. Moreover, contributions from indexes of quantity safety declined, and RPI of food that demonstrates price safety lacked stability, due to shortage of government supervision.

6. Inspiration for Policies

(i) As agriculture and the food industry advance, food supply is no longer the only factor to which food safety pays attention. Meanwhile, as the social demand for higher-quality food and food diversity gets stronger, quantity safety shall remain as the key point of food safety supervision. In the long run, government supervision of food safety should keep adjusting and improving in terms of supervision of quantity safety, motivate the broader society to participate in the supply side reform of agricultural products and the food industry, and adjust to the changes in the structure of food quantity demand. At the same time, supervision of quantity safety needs to focus on the stability of the food price to guarantee the quantity safety of food by appropriately releasing grain reserves, as well as using other management methods like price support for agricultural products and food.
(ii) Currently, quality safety remains as the key point of food safety supervision. Hence, we must establish sound legal, administrative, standardization, and certification systems, as well as tracing and early warning systems, focusing on solving the quality safety issues in food commodities and catering services. In addition, we need to maintain the safety from the source, give full play to prevention or standardization methods like market access, as well as control methods like taxes, to consistently reduce chemical input in agricultural production. On top of that, we ought to enhance spot checks and report on agricultural means of production, and encourage consumers to participate in evaluating the food safety status to make the food safety supervised by both the government and the society, further ensuring a bright future of quality safety supervision effectiveness.
(iii) Development safety involves the source safety and intergenerational equity, especially the quantity and quality safety of food. To deal with the relationship between the increased agricultural production and non-point source pollution driven by agrochemical input, we must use subsidies and control methods to facilitate the alternatives of external compensation for production factors, strictly reduce the intensity of agrochemical input, and gradually ease the problems of reduction of output in agriculture and pesticide residue brought by fertilizer and pesticide pollution. In the meantime, we must tighten the prevention and control of water pollution, implement strict emission standards and detailed emission indexes, and carry out research and development on production technologies beneficial to development safety with the aid of subsidy methods.

Author Contributions

Conceptualization, J.Y. and Y.L.; software, J.Y.; validation, J.Y.; formal analysis, J.Y.; investigation, J.Y.; resources, J.Y.; data curation, J.Y.; writing—original draft preparation, J.Y.; writing—review and editing, J.Y.; visualization, J.Y.; supervision, J.Y.; project administration, J.Y.; funding acquisition, J.Y.

Funding

This research was funded by the Social Science Youth foundation of Ministry of Education of China, grant number 18YJCZH218 and the National Natural Science Foundation of Zhejiang Province, grant number LY18G030029.

Acknowledgments

This research was funded by The New Type Key Think Tank of Zhejiang Province “Research Institute of Regulation and Public Policy”.

Conflicts of Interest

The authors declare no conflict of interest.

References

  1. Ortega, D.L.; Wang, H.H.; Wu, L.; Olynk, N.J. Modeling heterogeneity in consumer preferences for select food safety attributes in China. Food Policy 2011, 36, 318–324. [Google Scholar] [CrossRef]
  2. Caswell, J.A.; Padberg, D.I. Toward a more comprehensive theory of food label. Am. J. Agric. Econ. 1992, 74, 460–468. [Google Scholar] [CrossRef]
  3. Li, G.K.; Ying, R.Y. “Lemon market” and institutional arrangement—An analytical framework on the quality and safety guarantee of agricultural products. J. Agrotech. Econ. 2004, 2, 16–21. [Google Scholar]
  4. Caswell, J.A.; Mojduszka, E.M. Using informational labeling to influence the market for quality in food products. Am. J. Agric. Econ. 1996, 78, 1248–1253. [Google Scholar] [CrossRef]
  5. Antle, J.M. Efficient food safety regulation in the food manufacturing sector. Am. J. Agric. Econ. 1996, 78, 1242–1247. [Google Scholar] [CrossRef]
  6. Barling, D.; Lang, T. The politics of food. Polit Quart. 2003, 1, 4–7. [Google Scholar] [CrossRef]
  7. Tompkin, R.B. Interactions between government and industry food safety activities. Food Control 2001, 12, 203–207. [Google Scholar] [CrossRef]
  8. Variyam, J.N.; Blaylock, J.; Smallwood, D.M. Modeling nutrition knowledge, attitudes, and diet-disease awareness the case of dietary fibre. Stat. Med. 1996, 15, 23–25. [Google Scholar] [CrossRef]
  9. Perry, W.R.; Marsh, T.; Jones, R.; Sanderson, M.W.; Sargeant, J.M.; Griffin, D.D.; Smith, R.A. Joint product management strategies for E. coli O157 and feedlot profits. Food Policy 2007, 32, 544–565. [Google Scholar] [CrossRef]
  10. Peacock, W.J. The role of gene technology in food agribusiness systems. Food Aust. 2000, 52, 367–370. [Google Scholar]
  11. Kako, T. Food self-sufficiency and food security. J. Rural Probl. 2000, 35, 171–176. [Google Scholar] [CrossRef]
  12. Roasto, M.; Hérman, A.; Hanninen, M.L. A food safety perspective. In Ecology and Animal Health; Baltic University Press: Uppsala, Sweden, 2012. [Google Scholar]
  13. Dijk, H.V.; Houghton, J.; Kleef, E.V.; Lans, I.V.D.; Rowe, G.; Frewer, L. Consumer responses to communication about food risk management. Appetite 2008, 50, 340–352. [Google Scholar] [CrossRef] [PubMed]
  14. Caswell, J.A.; Hooker, N.H. HACCP as an international trade standard. Am. J. Agric. Econ. 1996, 78, 775–779. [Google Scholar] [CrossRef]
  15. Regattieri, A.; Gamberi, M.; Manzini, R. Traceability of food products: General framework and experimental evidence. J. Food Eng. 2007, 81, 347–356. [Google Scholar] [CrossRef]
  16. Kim, R. Japanese consumers’ use of extrinsic and intrinsic cues to mitigate risky food choices. Int. J. Consum. Stud. 2010, 32, 49–58. [Google Scholar] [CrossRef]
  17. Jouanjean, M.A.; Maur, J.C.; Shepherd, B. Reputation matters: Spillover effects for developing countries in the enforcement of US food safety measures. Food Policy 2015, 55, 81–91. [Google Scholar] [CrossRef]
  18. Sohn, M.C.; Oh, S. Global harmonization of food safety regulation from the perspective of Korea and a novel fast automatic product recall system. J. Sci. Food Agric. 2014, 94, 1932–1937. [Google Scholar] [CrossRef]
  19. Carlo, R.; Maria, P.A.; Di, F.A. Using private food safety standards to manage complexity: A moral hazard perspective. Agric. Econ. Rev. 2014, 15, 113–127. [Google Scholar]
  20. Antle, J.M. No such thing as a free safe lunch: The cost of food safety regulation in the meat industry. Am. J. Agric. Econ. 2000, 82, 310–322. [Google Scholar] [CrossRef]
  21. Liu, P. Chinese food safety regulation an empirical study on regime change and performance evaluation. J. Public Manag. 2010, 7, 63–78. [Google Scholar]
  22. Li, Z.D.; Zhang, Z.S. Analysis of Food Safety Regulation Effect and Its Influencing Factors. Available online: http://www.cnki.com.cn/Article/CJFDTotal-ZNJJ201506011.htm (accessed on 16 November 2019).
  23. Lu, L.S. Strategic Adjustment of Agricultural Structure and Food Safety in China in The New Era. Available online: http://www.cnki.com.cn/Article/CJFDTotal-ZGWY200204000.htm (accessed on 16 November 2019).
  24. Smith, L.C.; Obeid, A.E.E.; Jensen, H.H. The geography and causes of food insecurity in developing countries. Agric. Econ. Blackwell 2015, 22, 199–215. [Google Scholar] [CrossRef]
  25. Dai, F.; Ji, G.P. A new kind of pricing model for commodity and estimating indexes system for price security. Chin. J. Manag. Sci. 2001, 9, 62–69. [Google Scholar]
  26. Mohand, N.N.; Hammoudi, A.; Radjef, M.S.; Hamza, O.; Perito, M.A. How do food safety regulations influence market price? A theoretical analysis. Br. Food J. 2017, 119, 1687–1704. [Google Scholar] [CrossRef]
  27. Jacxsens, L.; Uyttendaele, M.; Dexlieghere, F.; Rovira, J.; Oses, S.; Luning, P.A. Food Safety Performance Indicators to Benchmark Food Safety Output of Food Safety Management System. Int. J. Food. Microbiol. 2010, 141, 181–184. [Google Scholar] [CrossRef]
  28. Atafar, Z.; Mesdaghinia, A.; Nouri, J.; Homaee, M.; Yunesian, M.; Ahmadimoghaddam, M.; Mahvi, A.H. Effect of fertilizer application on soil heavy metal concentration. Environ. Monit. Assess. 2010, 160, 83–89. [Google Scholar] [CrossRef]
  29. Casweu, J.A. How labeling of safety and process attributes affects markets for food. Agric. Resour. Econ. Rev. 1998, 27, 151–158. [Google Scholar] [CrossRef]
  30. Yang, J.H.; Lin, Y.B. Spatiotemporal evolution and driving factors of fertilizer reduction control in Zhejiang Province. Sci. Total Environ. 2019, 660, 650–659. [Google Scholar] [CrossRef]
  31. Okey, B.W. Systems approaches and properties, and agroecosystem health. J. Environ. Manag. 1996, 48, 187–199. [Google Scholar] [CrossRef]
  32. Dyson, J.S. Ecological safety of paraquat with particular reference to soil. Planter 1997, 73, 467–478. [Google Scholar]
  33. Pan, Z.W.; Jin, J.L.; Liu, X.W.; Zhou, R.X. Mechanism and Evaluation Method of Water Resources Utilization System Vulnerability. J. Nat. Resour. 2016, 31, 1599–1609. [Google Scholar]
  34. Rao, J. Research on the plight of water-saving agriculture construction in china by project system. Issues Agric. Econ. 2017, 1, 83–90. [Google Scholar]
  35. Boer, P.T.D.; Kroese, D.P.; Rubinstein, R.Y. A Fast cross-entropy method for estimating buffer overflows in queueing networks. Manag. Sci. 2004, 50, 883–895. [Google Scholar] [CrossRef] [Green Version]
Figure 1. Evaluation of food safety status from 2005 to 2017.
Sustainability 11 06656 g001
Figure 2. Time evolution of each index from 2005 to 2017. Note: (a) describes the changes of various indexes of quantity safety sub-system; (b) describes the changes of various indexes of quality safety sub-system; (c) describes the changes of various indexes of development safety sub-system.
Sustainability 11 06656 g002aSustainability 11 06656 g002b
Table 1. The index system of food safety status.
Sub−SystemIndexUnitDirection
Quantity safety (A)Per capita consumption of grain (A1)kg/person(−)
Per capita consumption of meat and poultry products (A2)kg/person(−)
Per capita consumption of aquatic products (A3)kg/person(−)
Per capita consumption of edible vegetable oil (A4)kg/person(−)
Per capita yield of grain (A5)kg/person(+)
Per capita yield of meat (A6)kg/person(+)
Per capita yield of aquatic products (A7)kg/person(+)
Per capita yield of edible vegetable oil (A8)kg/person(+)
Retail price index (RPI) of food (A9)%(−)
RPI of drinks, tobacco, and alcohol (A10)%(−)
Quality safety (Q)Food pass rate in spot checks (Q1)%(+)
Pass rate of pesticide residue in vegetables (Q2)%(+)
Pass rate of pesticide residue in aquatic products (Q3)%(+)
Ratio of quality and safety complaints in agricultural means of production (Q4)%(−)
Ratio of quality and safety complaints in food commodities (Q5)%(−)
Ratio of quality and safety complaints in catering service (Q6)%(−)
Development safety (D)Total crop acreage per capita (D1)m2/person(+)
Proportion of watershed lakes of Class III and above water quality (D2)%(+)
Proportion of seas of Class II and above water quality (D3)%(+)
Fertilizer application per crop acre (D4)kg/hectare(−)
Pesticide application rate per crop acre (D5)kg/hectare(−)
Ratio of water−saving irrigation area to farmland irrigation area (D6)%(+)
Table 2. Weights of evaluation indexes on food safety status.
Sub-SystemIndexWeight (%)
Quantity safety (A)Per capita consumption of grain (A1)4.6160%
Per capita consumption of meat and poultry products (A2)4.3602%
Per capita consumption of aquatic products (A3)4.5304%
Per capita consumption of edible vegetable oil (A4)4.3383%
Per capita yield of grain (A5)4.5722%
Per capita yield of meat (A6)4.5717%
Per capita yield of aquatic products (A7)4.6015%
Per capita yield of edible vegetable oil (A8)4.6031%
RPI of food (A9)4.4760%
RPI of drinks, tobacco, and alcohol (A10)4.5213%
Quality safety (Q)Food pass rate in spot check (Q1)4.4033%
Pass rate of pesticide residue in vegetables (Q2)4.3839%
Pass rate of pesticide residue in aquatic products (Q3)4.3509%
Ratio of quality and safety complaints in agricultural means of production (Q4)4.6919%
Ratio of quality and safety complaints in food commodities (Q5)4.7400%
Ratio of quality and safety complaints in catering service (Q6)4.7018%
Development safety (D)Total crop acreage per capita (D1)4.4260%
Proportion of watershed lakes of Class III and above water quality (D2)4.7102%
Proportion of seas of Class II and above water quality (D3)4.4475%
Fertilizer application per crop acre (D4)4.6423%
Pesticide application rate per crop acre (D5)4.7071%
Ratio of water-saving irrigation area in farmland irrigation area (D6)4.6047%