Article

Sustainable Synergies between the Cultural and Tourism Industries: An Efficiency Evaluation Perspective

1
Department of Tourism Management, Business School, Guangxi University, No.100 East Daxue Road, Nanning 530004, Guangxi, China
2
Applied Economics Postdoctoral Research Station, Guangxi University, No.100 East Daxue Road, Nanning 530004, Guangxi, China
3
Department of Management, Jones College of Business, Middle Tennessee State University, MTSU Box75, Murfreesboro, TN 37132, USA
4
Foster College of Business, Bradley University, 135 Westlake Hall, 1501 West Bradley Avenue, Peoria, IL 61625, USA
*
Author to whom correspondence should be addressed.
Sustainability 2019, 11(23), 6607; https://doi.org/10.3390/su11236607
Submission received: 26 October 2019 / Revised: 11 November 2019 / Accepted: 20 November 2019 / Published: 22 November 2019

Abstract

:
Cultural tourism has received widespread attention for its role in promoting cultural heritage and economic growth. However, there is insufficient research regarding how to verify the synergy between culture and tourism and how to ensure its sustainability in the integration of the cultural and tourism industries (CTI). This study establishes an interdisciplinary composite analytical framework from the perspective of efficiency evaluation. China, a country that has advocated the integration of CTI since 2009, is the research setting. The findings indicate that the technical efficiency of the tourism industry has increased significantly since the involvement of the cultural industry. Meanwhile, economically underdeveloped regions have opportunities to catch up with developed regions in terms of technical efficiency, and they perform better in terms of sustainable productivity growth. Importantly, U-shaped and inverted U-shaped curves were found in the coordinate systems composed of groups comprising the coupling coordination degree and the efficiency-related index, respectively. This finding reveals the existence of a running-in effect in the integration process of CTI, thereby contributing to both theory and policy-making.

1. Introduction

Cultural tourism is a subcategory of tourism in which travelers visit cultural attractions or regions with unique cultural or historical identities in order to experience new cultures and obtain new knowledge [1,2]; this form of tourism also indirectly promotes the preservation of local cultural heritage in addition to boosting economic growth [3]. The emergence of multiple market segments in cultural tourism has inspired scholars to pay attention to the integration and synergies between these segments [4,5,6,7]. In 2018, the United Nations World Tourism Organization (UNWTO) published a report on Tourism and Culture Synergies, which covered survey data from 69 member states and 61 experts in related fields. This study confirmed that a broad integration scope of tourism and culture not only includes “tangible (e.g., national and world heritage sites, monuments, historical places and buildings, cultural routes) and intangible heritage (e.g., crafts, gastronomy, traditional festivals music, oral traditions, religious/spiritual tourism“, but also “contemporary culture (e.g., films, performing arts, design, fashion, new media)” [8]. Thus, currently, the integration of culture and tourism is spreading and is omnipresent, and destinations rich in cultural and tourism resources usually have a high degree of consistency or overlap in the market [1,9,10]. Exploring and evaluating the synergy between culture and tourism is conducive to enhancing theoretical understanding, promoting joint marketing, and inspiring policy-making. However, there is still insufficient research regarding how to verify this synergy and how best to sustain it during the integration of the culture and tourism industries (CTI). Quantitative research in the related field only focuses on a single sector from an efficiency evaluation perspective [11,12,13] or on the degree of coupling coordination between them [14]; it is still rare to regard culture and tourism as industries and explore the synergy between them from an interdisciplinary point of view.
By regarding the CTI together as a complete system or black box, in this study we established a composite evaluation framework consisting of three dimensions from the perspective of efficiency evaluation, to measure the technical efficiency, sustainable productivity growth, and coupling coordination degree. Specifically, the slacks-based measure (SBM) model of data envelopment analysis (DEA), the Malmquist index of total factor productivity (TFP), and the coupling coordination degree model were applied in the research. We further examined the impact of the cultural industry on efficiency and compared the relationships between various outcomes.
This study utilized data from 31 Chinese provinces and regions from 2010 to 2016. There are several reasons why China is an ideal setting to study these issues. First, China is one of the world’s major countries in terms of tourism, with its total tourism revenue ranking second in the world. The number of world heritage cultural and mixed sites in China ranks third worldwide, attracting a large number of domestic and foreign tourists each year [15,16,17]. Various creative cultural tourism projects have also attracted the attention of the capital market. Second, since 2009, the Chinese government has issued a series of policies to promote the integration and coordinated development of CTI [18], which is consistent with the data period used in this study. Third, according to the China National Institutional Reform Program, in 2018, the former Ministry of Culture and former National Tourism Administration merged into a single Ministry of Culture and Tourism. Scholars believe that the integration of CTI is a realistic development direction, in line with the need for tourism market transformation in China [19]. In particular, culture and tourism are closely related and widely distributed in China, which makes it possible to study and compare regional efficiency. Through strict selection since 1982, China has 134 state-listed famous historical and cultural cities covering 31 provinces and autonomous regions [20]. This indicates that each region involved preserves an unusual wealth of cultural relics of high historic value. In addition, since 1998, China has identified 339 excellent tourist cities, including most of the abovementioned cities or regions [21]. These regions not only have traditional cultural tourism attractions such as museums, art galleries, ancient towns, and historic sites, but also have contemporary theme parks, performing arts, and accommodation and dining facilities with unique local culture. In line with many countries, China does not have accurate statistics on the cultural tourism market size. However, according to the statistical report released by the National Bureau of Statistics, the added value from tourism-related industries and cultures-related industries in China in 2017 was both substantial and similar, with 3721 billion Chinese Yuan (CNY) and 3472 billion CNY, respectively [22,23].
The main contributions of this study are as follows. First, an analytical framework is proposed from the perspective of interdisciplinary and efficiency evaluation, which explores the sustainable synergies in three measurement dimensions. Second, by controlling the input–output indicators, CTI efficiency is significantly higher than that of the tourism industry, which suggests that achieving synergies is beneficial to the tourism industry. Third, U-shaped and inverted U-shaped curves were found in the coordinate systems composed of the groups of the coupling coordination degree and the efficiency-related index, respectively. This finding indicates the presence of a running-in period in efficiency growth, thereby contributing to both theory and policy-making.
The remainder of this paper is organized as follows. Section 2 is a literature review. Section 3 describes the evaluation framework and presents the evaluation models. Section 4 discusses the results and findings, and Section 5 concludes.

2. Literature Review

The term “culture industry” was first used in the book Dialectic of Enlightenment published in 1947 [24]. The commercialization and standardization of art and entertainment as a result of the cultural industry have promoted widespread public acceptance of cultural consumption, although there is controversy regarding its potential negative impact [25,26]. Meanwhile, the tourism industry is one of the fastest-growing industries in the world [27]. Specific focus on the cultural aspect of the tourism experience marks a new stage of tourism development that began in the mid-1980s [28]. Cultural tourism is the most common keyword in this field. It is widely acknowledged that culture is not a bounded, unchanging entity, which has led to the fact that defining cultural tourism is difficult and complex [29]. The definition of cultural tourism by the UNWTO from both broad and narrow approaches has gained greater consensus. In their broad definition, “All movements of persons might be included in the definition because they satisfy the human need for diversity, tending to raise the cultural level of the individual and giving rise to new knowledge, experience and encounters.“ Their narrow definition is restricted to “Movements of persons for essentially cultural motivations such as study tours, performing arts and cultural tours, travel to festivals and other cultural events, visits to sites and monuments.“ Estimated by the broad definition, the number of international cultural tourists accounts for about 40% of the total number of international tourists [8].
Culture is not only a tourism resource from a supply perspective but also a psychological need of tourists from a demand perspective [30]. The attributes and behaviors of cultural tourists are of primary concern from a tourism demand point of view. Age, education, and income have proven to have positive effects on people’s engagement in cultural tourism activities [11,31,32]. Higher incomes, higher levels of education, and better cultural and aesthetic knowledge are common features of tourists engaged in cultural tourism, such as heritage and art tourism [33,34]. In other words, cultural tourism attractions are more likely to appeal to individuals with higher socioeconomic status [35,36,37]. Through an analysis of more than 20,000 questionnaires, Artal-Tur found that cultural tourists spend more money, stay longer, and have higher tourism satisfaction levels than do ordinary tourists [38]. Therefore, the cultural tourism market is highly valued by enterprises and the market owing to its high consumption, good quality, and relatively stable visitor flow [39]. From the perspective of tourism supply, cultural facilities and activities, such as cultural festivals, art galleries, and historic sites, are the main attractions for cultural tourists [40]. Among the various cultural tourism products, art museums and galleries in major European cities are “must-see” attractions; these include the National Gallery in London and the Louvre in Paris [34]. In addition to cultural tourism facilities, individuals engaged in cultural production play a key role in exploiting the cultural capital concentrated in the major historical centers of Europe [31]. Cultural tourism enables those who have given up their indigenous identities to relearn some of the cultural habits of their ancestors, enhancing national identity and promoting employment [41].
Synergy is an emerging branch of cultural and tourism research. Although slightly different in meaning, the term “synergy” is often associated with the terms integration, coordination, and convergence to express a similar trend between these two industries [7,42]. In some representative theoretical studies, Zhang put forward the mechanism model of CTI convergence, which can be elaborated on from the aspects of technology, product, enterprise, and market [43]. Richard indicated that the rapid development of new technologies, such as augmented reality and mobile devices, has promoted cultural tourism transformation in recent years, and the convergence of CTI will bring new market opportunities for traditional cultural tourism [42]. In empirical research, Picard, in a case study of Bali, confirmed that tourism is not an external force that impacts the tourist destination but instead plays an important role in the formation and integration of Balinese culture [6]. Zhang applied the coupling coordination degree from the field of physics to analyze the coordination between culture and tourism [14]. Although these studies seem relatively scattered, the synergies of CTI have become a new topic of concern for researchers and international organizations, including the UNWTO [8].
In the field of sustainable development of culture and tourism, the issue of integration, closely related to the synergy effect, attracted the attention of Loulanski in 2011. In line with the widely recognized concept of “sustainability” or “sustainable development” [44], Loulanski reviewed 483 works to arrive at 15 generalized factors affecting the sustainable integration of cultural heritage and tourism [7]. “Controlled/balanced growth of tourism development“ is one of the most important aspects that can be quantitatively measured. However, the study did not give a specific plan for further sustainable evaluation.
Evaluation of the economic impact of culture on tourism has long been a focus of research. The development of cultural tourism has enhanced visibility regarding its economic significance, such as stimulating tourist flows, promoting income and employment, and protecting cultural heritage [45]. Ticket revenues from cultural events, such as exhibitions and performances, are positively correlated with the number of domestic and international tourists, while noncultural activities remain statistically insignificant [9]. However, some disputes and doubts exist regarding the economic attractiveness of such tourism for certain cities [46,47]. A special issue of the Journal of Cultural Economics in 2017 focused on the relationship between cultural tourism and the economy [48]. A series of articles explored cultural-tourism-related topics from an economic perspective, such as the behavior characteristics of cultural tourism consumers and the attractiveness of cultural tourism facilities to tourists. [49]. Srakar and Vecco discussed the impact of tourism arising from large-scale cultural events on an economy, especially on a macro level [50]. This study provided evidence for a positive relationship between the cultural and economic effects of tourism.
In the field of tourism economy research methodology, Fuchs and Matthias introduced the DEA benchmarking method to the efficiency evaluation of service production processes at tourism destinations [12]. Since then, a series of studies have analyzed the efficiency of tourism-related economies. Bosetti applied DEA to evaluate sustainable tourism management in 20 regions of Italy [13]. Cracolici extended this evaluation to 103 regions in Italy and compared the difference between a stochastic production function and DEA [51]. In order to further explore the factors influencing tourism destination efficiency, some studies adopted a two-stage DEA method to study France [52], Spain [53], Italy [54,55], and the entire world [56]. With continuously improving tourism time series data, the introduction of TFP enables DEA efficiency analysis to provide more in-depth productivity progress comparisons [57]. Some researchers have further extended the use of the DEA method to cultural tourism facilities and destinations [58,59,60].
This study explores the synergy in the integration process of CTI and its sustainability. From an efficiency evaluation perspective, we adopted an empirical strategy and conducted research based on panel data from China.

3. Methodology

3.1. Analytical Framework and Data

To verify the synergy effect and its sustainability, a conceptual model is proposed to clarify the relationships among the tourism industry, cultural industry, and sustainable development. The sustainable CTI in this research is defined as an overlap of these three concepts, as shown in Figure 1. In this conceptual model, CTI is constantly coordinating in the process of integration. From an efficiency evaluation perspective, the coordinated quality of the system can be measured by its efficiency. As the synergy effect is usually the result of coordination [61], positive synergies can increase the efficiency-related index, whereas negative synergies reduce the efficiency-related index. Although sustainability is a target, including progress in economic, environmental, and socio-cultural areas [45], we should also consider the cost aspect. Therefore, the economic growth of CTI productivity can be viewed as an important sign of achieving sustainability.
In efficiency evaluation, the choice of input and output indicators and data availability are key issues. Referring to the Cobb–Douglas production function model and relevant literature [12,62], for this research we selected human resources and investment from both industries as inputs and economic outcomes as the outputs for CTI efficiency evaluation. Specifically, tourism fixed assets were used as a tourism investment indicator, the number of employees in the tourism sector was used as a tourism human resources indicator, and the total income of tourism enterprises was used as a tourism revenue indicator. Input in cultural undertakings was used as a cultural investment indicator, the number of employees in the cultural sector was used as a cultural human resource indicator, and the total income of the cultural sector was used as a cultural revenue indicator. In order to study the impact of the cultural industry on efficiency, the efficiency of the tourism industry was defined separately. The differences in the indicators between the tourism industry and CTI in the efficiency evaluation are shown in Table 1. Furthermore, panel data from 31 provinces, regions, and municipalities in China (excluding Hong Kong, Macao, and Taiwan) from 2010 to 2016 were used. By using the price index, nominal investments and revenue were used in real terms, without taking the influence of price changes into account. All data were taken from The Yearbook of China Tourism Statistics, Statistical Yearbook of China, and Statistical Yearbook of Chinese Cultural Relics.
A composite analytical framework consisting of three dimensions was established based on the efficiency evaluation, as shown in Figure 2. For the dimension of efficiency, the CTI was regarded as a system or black box, and its technical efficiency was measured using the SBM model of DEA. In this study we further examined synergies by comparing efficiency-related indicators between CTI and the tourism industry. For the dimension of sustainable productivity growth, the Malmquist index, based on the efficiency measures above, was applied to assess productivity performance over the years. Regarding coordination evaluation, the coupling coordination degree model was used to further clarify the characteristics of the process of CTI coordination, as both input and output indicators are important characterizations of the corresponding industries.

3.2. SBM-DEA Model

DEA is a systematic analysis method proposed by Charnes, Cooper, and Rhodes [63]. As DEA has invaluable advantages in dealing with multi-input and multi-output indices, it has been widely used in different industries and sectors. The SBM model is a nonradial DEA method proposed by Tone in 2011, which deals with the slacks directly to make the measurement of the efficiency of decision-making units (DMUs) more realistic and accurate [64].
Let us define xij (i = 1, 2, …, m) as inputs of DMUj (j = 1,2, …, n) and yrj (r = 1, 2, …, q) as outputs of DMUj. The output-oriented SBM model for this study is represented in Equation (1):
m a x 1 ρ = 1 + 1 q r = 1 q s r + y r k   s . t .   j = 1 n x i j λ j + s i = x i k     j = 1 n y r j λ j s r + = y r k       λ j 0 ,   s r + 0 ,   s i 0
where ρ represents the technical efficiency from the SBM model of constant returns to scale (CRS); k represents the current DMU to be measured; λj is the coefficient of linear combination of DMUj; and S+ and S are the deficiency of output and redundancy of input, respectively. ρ = 1 and S+ = S- = 0 indicates that the DMU is efficient and there is no input redundancy or output deficiency. ρ < 1 indicates inefficiency. Referring to the relevant literature [65], the efficiency values in this research were further categorized into four levels as follows: ρ = 1 represents superior efficiency, 0.8 ≤ ρ < 1 represents high efficiency, 0.6 ≤ ρ < 0.8 represents moderate efficiency, and 0 ≤ ρ < 0.6 represents low efficiency.
In order to explore the impact of cultural industries on efficiency, we measured and compared efficiency-related indicators from the tourism industry and CTI. According to the SBM model, when the efficiency value is less than 1, the magnitude of the slack movement can reflect the cause of the efficiency loss [64]. Therefore, the redundancy rate of input can be calculated by dividing each input slack movement of CTI efficiency by the corresponding input value. Meanwhile, the deficiency rate of the output can be calculated by dividing each slack output movement of CTI efficiency by the output value.

3.3. Malmquist Index of TFP

The Malmquist index of TFP was introduced by Malmquist in 1953 [66]. By combining the Malmquist index and DEA theory, Fare proposed an intertemporal variation of the Malmquist index to measure productivity growth [67]. To decompose the results more accurately and improve the analysis, in this research we used the global Malmquist productivity index method, which gives a single measure of productivity change [68]. The Malmquist index, represented in Equation (2), can be divided into technical efficiency change (EC) and technical change (TC) through Equation (3). Therefore, it can be applied to measure the internal relationship between EC, TC, and TFP. For the SBM model with the constraint e   λ = 1, Equation (3) can further decompose the EC into pure technical efficiency change (PEC) and scale effect change (SEC), as shown in Equation (4) [69].
M x k t + 1 , y k t + 1 , x k t , y k t = E g x k t + 1 , y k t + 1 E g x k t , y k t
M x k t + 1 , y k t + 1 , x k t , y k t = E t + 1 x k t + 1 , y k t + 1 E t x k t , y k t E g x k t + 1 , y k t + 1 E t + 1 x k t + 1 , y k t + 1 E t x k t , y k t E g x k t , y k t = E C × T C    
M = P E C × S E C × T C
where M is the Malmquist index of TFP for the DMUs; E represents the efficiency value calculated by the DEA model; and t and t + 1 represent different time periods. The superscript of E indicates the benchmark, and g indicates the global attribute. If the Malmquist index, or its decomposition, is greater than 1, it indicates that the corresponding M or its decomposition is improved; in contrast, if it is less than 1, it indicates deterioration. In this study, the technical efficiency of the SBM and the Malmquist index were calculated using MaxDEA 7.0 software provided by Beijing Realworld Software Company Ltd of China.

3.4. Model of the Coupling Coordination Degree

As a tool for assessing two or more systems, the coupling coordination degree is a combination of the coupling degree and coordination degree. Coupling originates from physics and refers to the phenomenon in which two or more systems interact with each other in various ways to achieve synergies [70]. In this study, the coupling degree is the level of nonlinear relationships of mutual interactions between CTI. However, as the coupling degree does not accurately suggest the level of development, we further integrate a coordination degree to make up for this deficiency [71]. In this research, input–output indicators were used for evaluating the coupling coordination degree of CTI. The calculation process is as follows.
(1) Data Standardization
As all indicators in this study were positive, Equation (5) was adopted for standardization of the data:
c i = c i m i n i / m a x i m i n i t i = ( t i m i n i ) / m a x i m i n i
where c i and t i present standardized values of the input and output indicators of the CTI, respectively.
(2) Comprehensive Evaluation Index
This can be regarded as the contribution of a subsystem to the overall system, calculated using Equations (6) and (7):
U C = i = 1 n a i c i
U T = i = 1 n b i t i
where Uc and UT represent the comprehensive evaluation indices of the cultural and tourism industries, respectively, and ai and bi are the weight of each indicator. Given the equal importance of input and output indicators in CTI, the weight of this study was distributed as follows: When all indicators were included in the evaluation, the two input indicators were given a weight of 0.25 each, and the output indicator accounted for 0.5. When only the input indicators were included, each indicator had a weight of 0.5.
(3) The coupling degree CCTI of CTI can be calculated using Equation (8).
C C T I = 2 U C · U T / U C + U T U C + U T 1 / 2
(4) The coordination degree can be calculated using Equation (9):
T = α U C + β U T
where T represents the coordinating index. The weight values α and β were set to 0.5 for each because of their equal significance for CTI.
(5) The coupling coordination degree can be calculated using the following equation:
D = C C T I × T
where D represents the coupling coordination degree. In line with the related research [71], in this study we categorized the coupling coordination degree into the following four levels: 0.8 < D ≤ 1 represents a superior coupling coordination degree, 0.5 < D ≤ 0.8 represents a high coupling coordination degree, 0.4 < D ≤ 0.5 represents a moderate coupling coordination degree, and 0 < D ≤ 0.4 represents a low coupling coordination degree.

4. Results and Findings

4.1. Evaluation of Efficiency: The Technical Efficiency of CTI

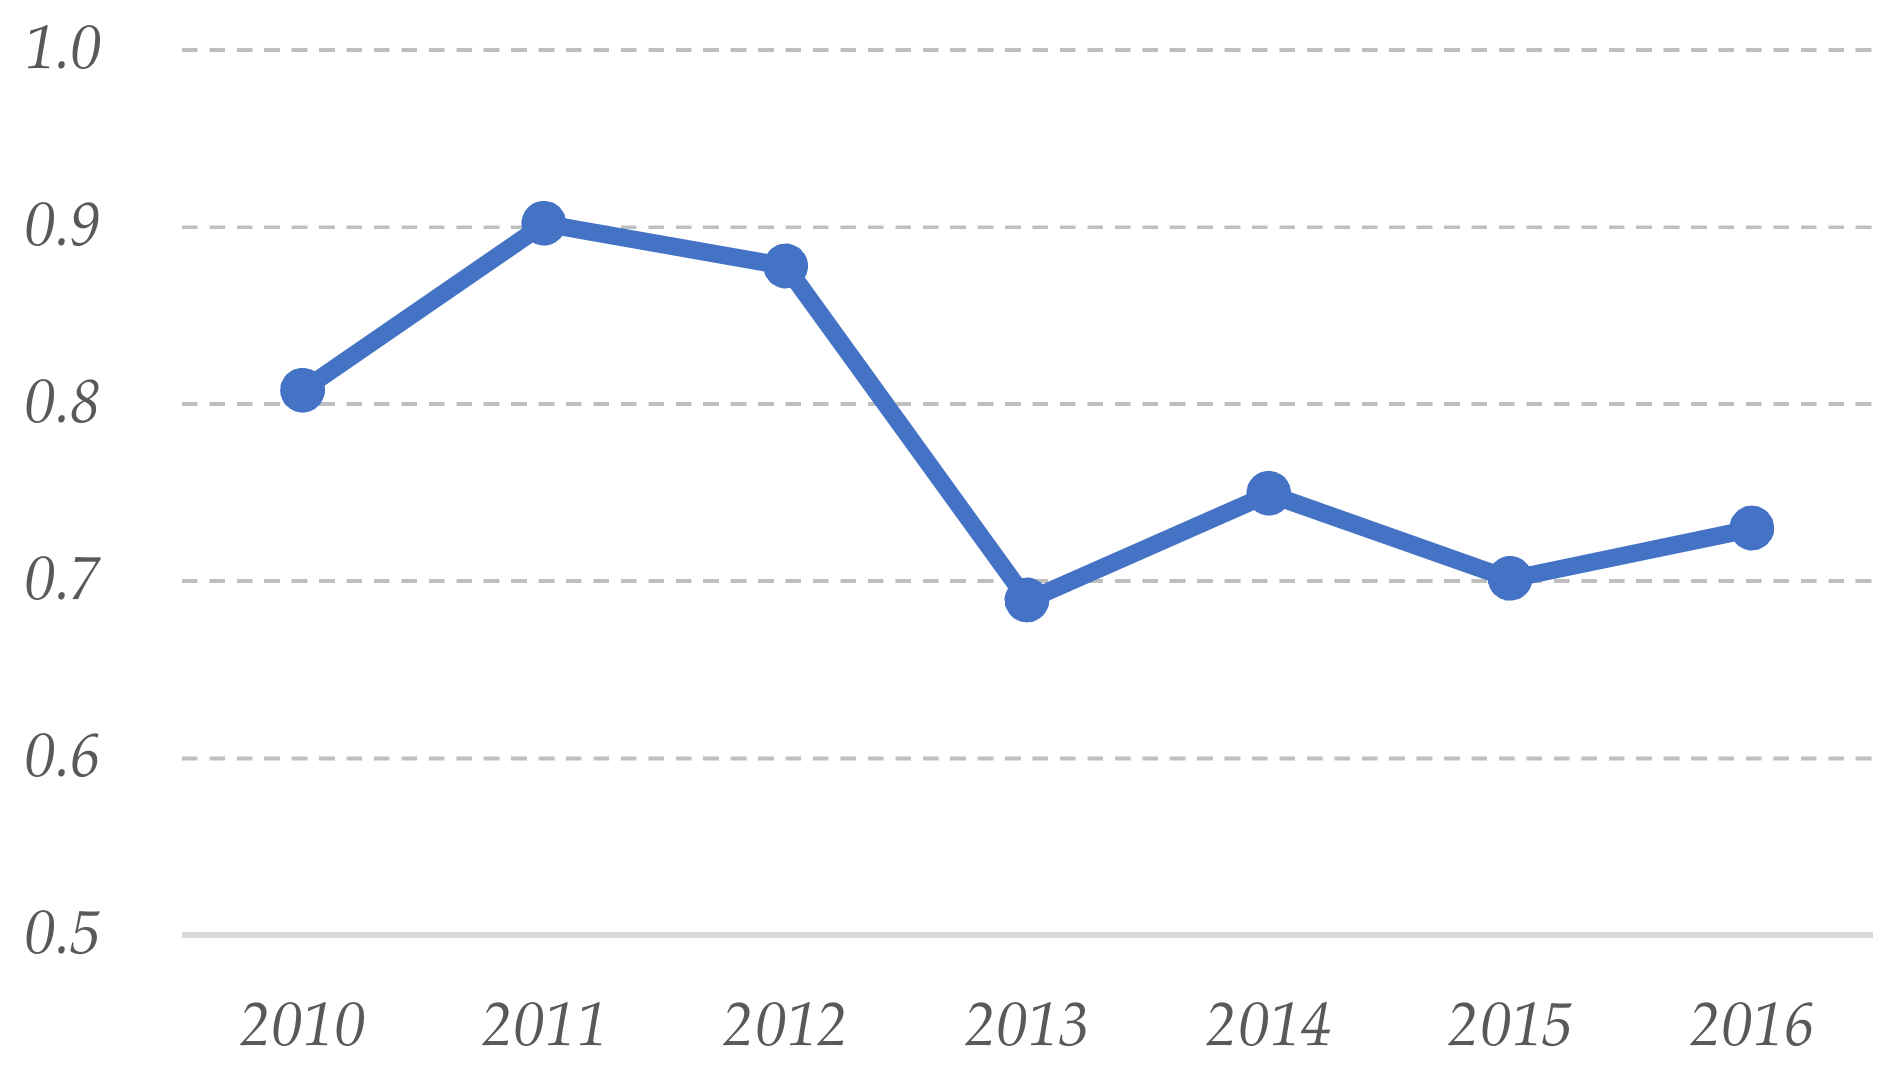
4.1.1. The Temporal and Spatial Distributions of CTI Efficiency

From 2010 to 2016, the technical efficiency of the CTI dropped slightly during fluctuations between high and moderate levels, but this drop is acceptable, especially because the fluctuation range gradually reduced over time as shown in Figure 3. During this time, 2011 and 2014 were years of efficiency growth, probably related to the lagging effect of the Chinese government’s policies and events. During this period, the Chinese Ministry of Culture and the National Tourism Administration jointly issued “Guidance on Promoting the Integration of Culture and Tourism.” [72]. Meanwhile, 2010 was the “Chinese Culture Tourism Year,” with the theme of “Cultural Tourism, Harmony, and Win–Win.” [73]. In addition, the China Tourism Law was promulgated at the end of 2013, which further promoted the integration of CTI. However, as the growth of the world economy weakened considerably in 2012 [74], the sensitive tourism industry was clearly negatively affected, as noted in in Figure 3.
We selected three years for comparison, and the change in technical efficiency values across the regions can be clearly observed in Figure 4a–c. In 2010, the technical efficiency of 7 regions in China was 1, 10 regions were between 0.8 and 1, 11 regions were between 0.6 and 0.8, and other areas were below 0.6. In 2013, the number of regions with a technical efficiency value of 1 decreased to five. Meanwhile, 45.2% of the regions downgraded their efficiency levels, while an equal ratio (45.2%) maintained their ratings, which resulted in a decline in efficiency in this year. Compared with 2013, the number of regions with a technical efficiency value of 1 increased to eight in 2016. Meanwhile, the number of regions with improved efficiency levels was equal to that of regions that had maintained their efficiency ratings (38.7%), causing a small efficiency rebound in 2016.
In terms of the mean regional technical efficiency of CTI, the efficiency distribution was not completely consistent with the three economic zones of China, as shown in Figure 4d. Beijing, Shanghai, and Tibet have the highest efficiency and have always been at the efficiency frontier. In addition, the efficiency values of 11 regions reached at least 0.8 (Qinghai, Tianjin, Jiangsu, Shanxi, Fujian, Guizhou, Gansu, Guangdong, Hunan, Chongqing, and Guangxi). The efficiency in other regions was moderate or low. When classified according to China’s three economic zones, the efficiency means of eastern, central, and western China were 0.808, 0.748, and 0.763, respectively. Although the economically developed eastern region still has obvious advantages, the economically underdeveloped western region surpassed the efficiency of the central region. In line with research findings on the catch-up effect of tourism in economically underdeveloped regions [75], the data suggest that these regions still have the opportunity to make full use of cultural and tourism resources to achieve better efficiency.

4.1.2. The Role of Cultural Industries in CTI Efficiency

The involvement of the cultural industry has positively improved the efficiency-related indicators of the tourism industry. Comparing the geometric means of efficiency values of the tourism industry with those of CTI in Table 2, the CTI efficiency in the past seven years was 0.776, which was 0.286 higher than that of tourism industry. The involvement of the cultural industry effectively reduces the redundancy rate of one of the inputs and the deficiency rate of the output. Specifically, the redundancy rate of tourism human resources decreased by 12.5%, and the deficiency rate of tourism revenue decreased by 60.7%. There was no significant change in the redundancy rate of tourism investment. The deficiency rate of tourism revenue is much higher than other indicators, which indicates that the tourism industry still has great efficiency growth potential in the integration process of CTI.
From a regional perspective, the involvement of the cultural industry has had some negative impacts on efficiency-related indicators in a few provinces and regions. It has increased the redundancy rate of tourism investment in Hebei, Hainan, Sichuan, and Ningxia. Meanwhile, it has also increased the redundancy rate of tourism human resources in Shandong, Guangdong, and Hainan. This performance in terms of efficiency has confirmed that the process of integrating culture and tourism may have a negative synergy effect on local social culture, as observed in some studies [76]. Therefore, simply increasing the corresponding cultural and tourism inputs in these regions is no longer the key to their effective integration and development.

4.2. Evaluation of the Sustainable Growth of Productivity: The Malmquist Index and its Decomposition

As a benchmark for measuring sustainable productivity growth, the Malmquist index during the study period was 1.021, which indicates that the TFP was in the positive process of growth, with an average annual growth rate of 2.1%. Although the index fluctuated between years as shown in Figure 5, its value was basically above 1, indicating that the overall productivity growth of CTI was good and sustainability was achieved.
The decomposition of the Malmquist index confirmed that TC is the key contributor to the progress above. The value of TC for the past seven years was 1.038, with an annual growth rate of 3.8%, which is higher than the Malmquist index. The data suggest that the technology used in the CTI in China has been continuously improved. Conversely, the value of PEC from 2010 to 2016 was 0.987, with a decrease of 1.3%, and the value of SEC was 0.996, with a decrease of 0.4%. Both the PEC and SEC saw a slight reduction during the study period and are the main factors restricting TFP improvement of CTI in China. The positive effects of TC offset the negative effects of PEC and SEC, forming an overall trend of TFP growth. Data on the decomposition of the Malmquist index suggest that encouraging sustainable technological advancement and innovation through policy-making is an effective means for achieving sustainable productivity growth.
Regarding the provinces and regions, the Malmquist index of a majority of the regions performed well, especially in western China. As shown in Figure 6, 71% of the regions had Malmquist index values greater than 1, which implies that productivity has grown continuously. Moreover, 50% of the abovementioned provinces with increased productivity are from the western region, and 36.4% are from the eastern region. The eastern, central, and western regions each account for one-third of the regions where the Malmquist index regressed. According to China’s three economic zones, the western region had the highest productivity growth rate of 3.6%, while the growth rates in the eastern and central regions were 1.5% and −0.4%, respectively. In its decomposition, we found that TC was the common factor driving the growth of the Malmquist index for the three economic zones, with the growth in the western region still being highest. In addition, only the SEC in the central region was greater than 1, and other decompositions of the Malmquist index were all less than 1. These data suggest that factors such as new technologies and management innovations provide strong support for sustainable productivity growth in the western part of China. It is worth mentioning that the Malmquist index in the province of Tibet was significantly higher than that in other provinces. Even if we refer to the relevant literature to exclude possible outliers such as Tibet [77], the mean value of the Malmquist index of the remainder of western regions was still higher than that of the eastern regions.

4.3. Evaluation of Coordination: The Coupling Coordination Degree of CTI

4.3.1. General Characteristics of the Coupling Coordination Degree

The general coupling coordination degree of the CTI was around 0.4 from 2010 to 2016, near the boundary of moderate and low coupling. For comparison, we further calculated the coupling coordination degree according to the input and output separately; the results were basically consistent with the combined general trend, which is shown in Figure 7. The coupling coordination degree of the input hovered between 0.4 and 0.5, which is a moderate level. The results of the output hovered between 0.3 and 0.4, which is a low level. The obvious resonance relationship of the various trend lines indicates that overall coordinated development of the CTI can only be achieved through the coordinated development of the inputs.
From the regional perspective, the coupling coordination degree of CTI was spatially higher in the eastern regions than in the central and western regions, as shown in Figure 8. The provinces with moderate and low coupling coordination degree accounted for 19.4% and 38.7% of all Chinese provinces, respectively, which indicates that China’s overall level is not high. According to the classification criteria, 31 regions in China can be classified into four categories. The regions with superior coupling coordination degree include four economically developed eastern provinces and regions: Guangdong, Zhejiang, Jiangsu and Beijing. Of the nine high coupling coordination areas, 44% are in the east, 33% in the center, and the rest in the west; these regions are Shanghai, Shandong, Sichuan, Fujian, Henan, Hunan, Hebei, Hubei, and Shaanxi. There were six regions with moderate coupling coordination, of which 83.3% are from central and western China; these are Yunnan, Anhui, Liaoning, Shanxi, Chongqing, and Guangxi. The remaining 12 were low coupling coordination areas, 75% of which are distributed in relatively underdeveloped western China.

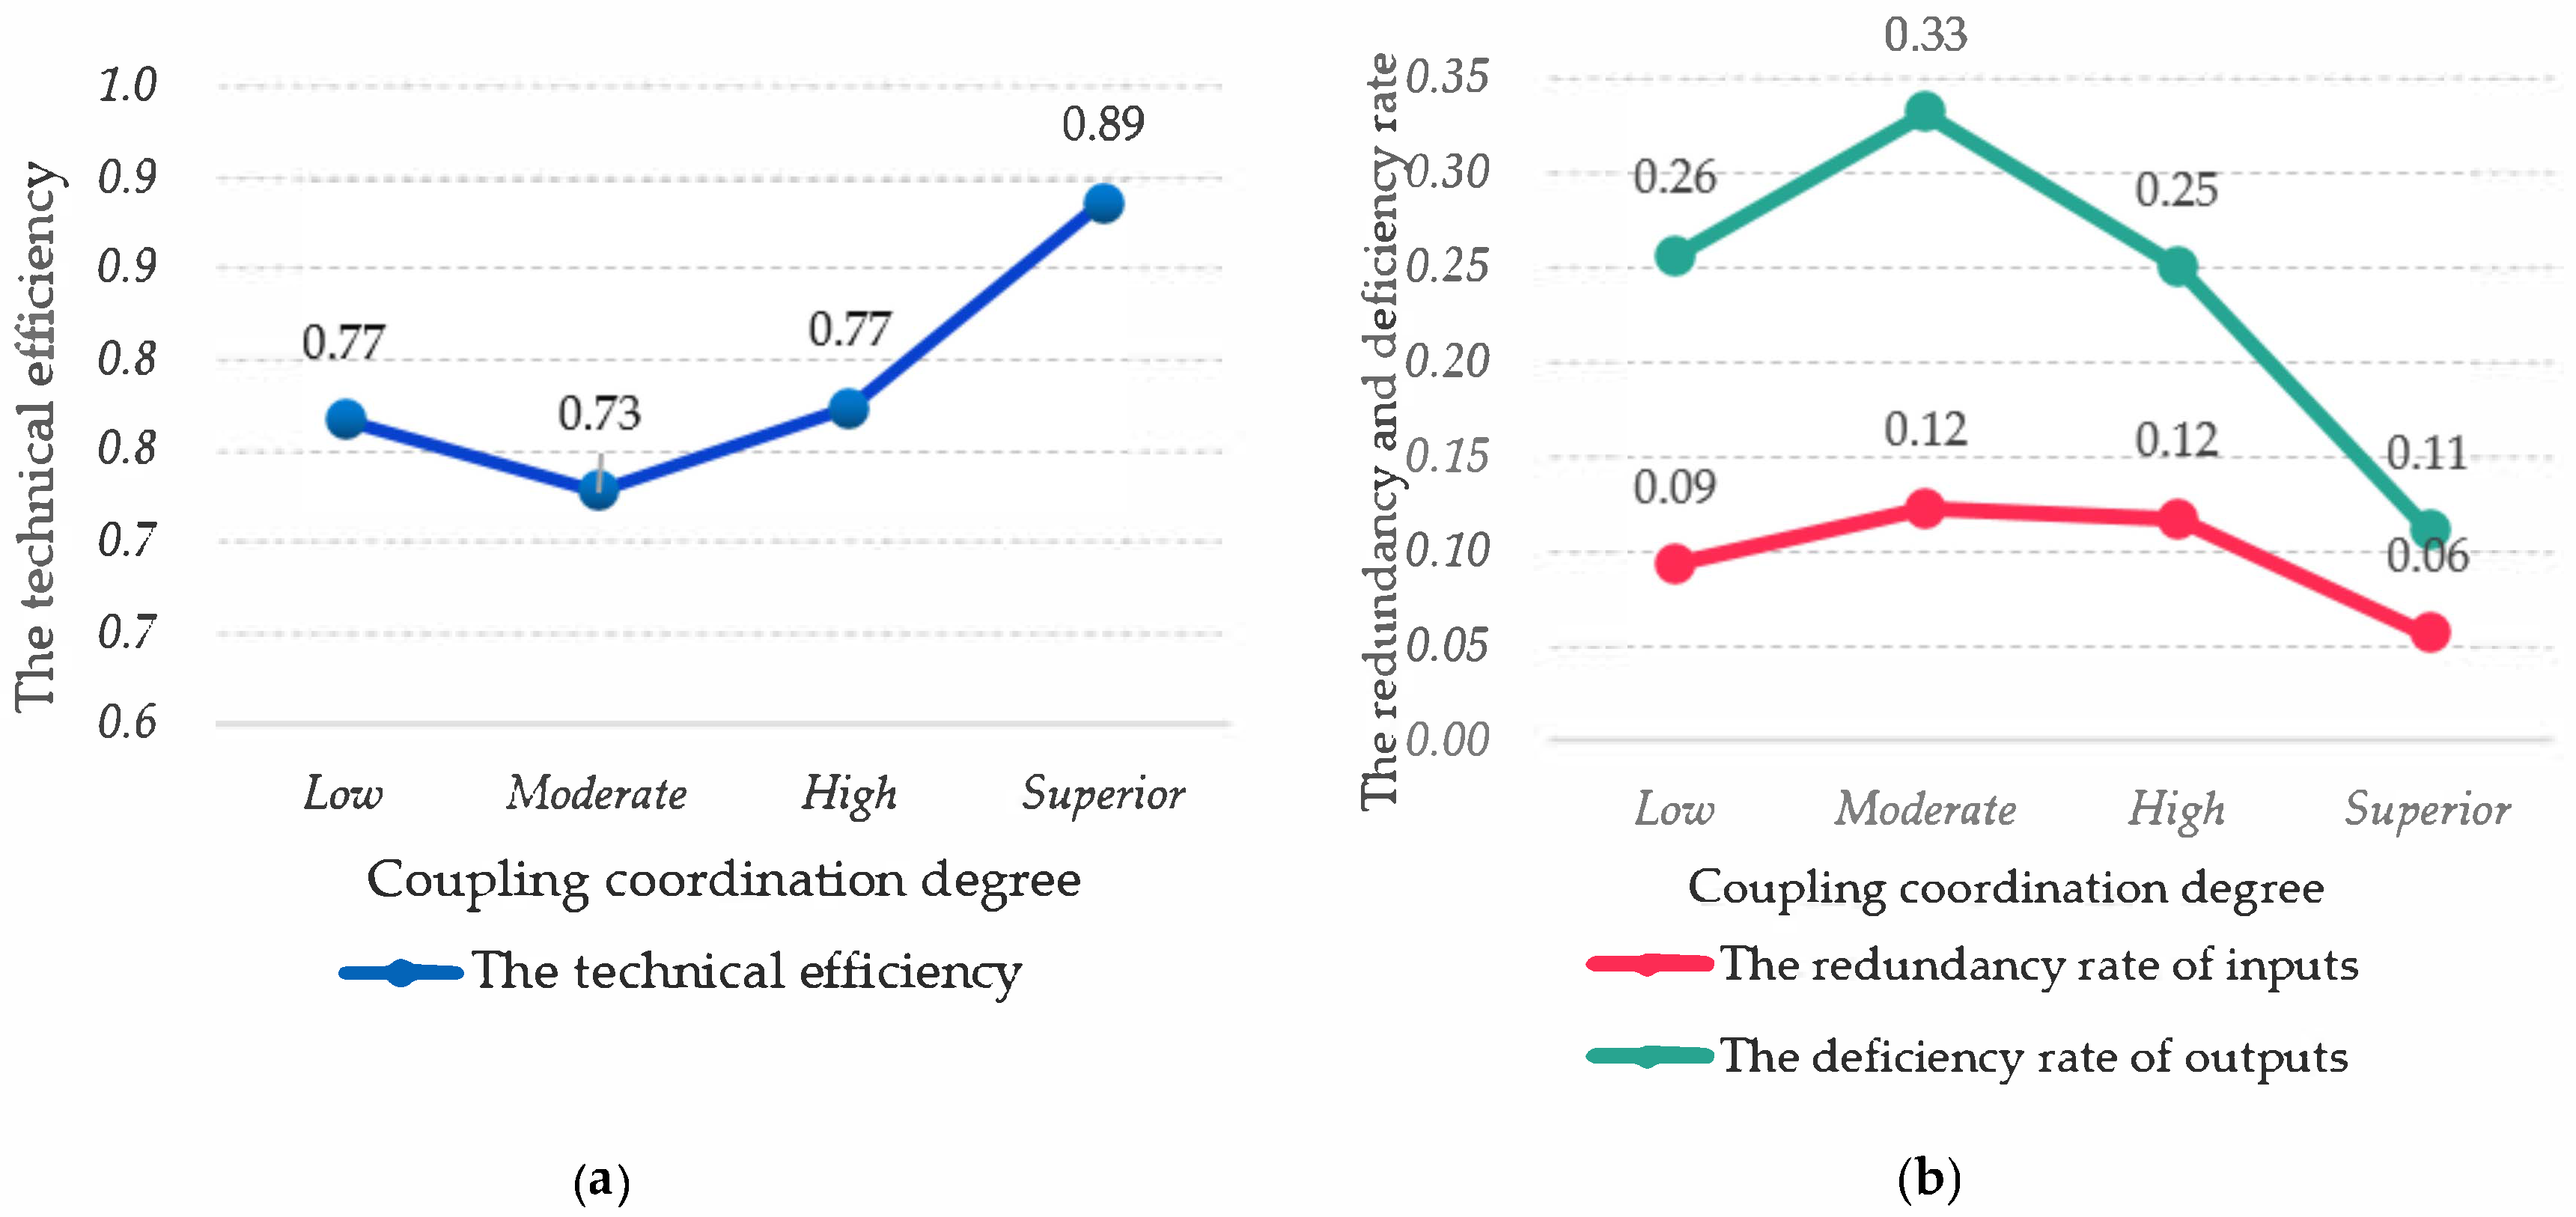
4.3.2. Comparison of the Coupling Coordination Degree and CTI Efficiency

To explore the relationship between CTI coordination and efficiency, we further compared the relationships between efficiency-related indices and groups classified by the coupling coordination degree. According to the classification criteria of the coupling coordination degree in this research, the 31 provinces and regions in China were classified into four groups. A U-shaped curve was found in the coordinate system composed of the groups of coupling coordination degree and technical efficiency, as shown in Figure 9a. Furthermore, inverted U-shaped curves were found in the coordinate system composed of the groups of the coupling coordination degree and the redundancy rate of input or the deficiency rate of output, as shown in Figure 9b. The emergence of these curves suggests that a running-in effect exists in the integration and coordination process, which can be roughly divided into two stages. In the first stage, as the coupling coordination degree increases, there is an increase in the input redundancy rate and the output deficiency rate, as well as a decline in technical efficiency. This indicates that blindness and inefficiency of investment may be an inevitable stage leading to negative synergies at the beginning of an increase in CTI input. In the second stage, as the coupling coordination degree further increases, there is a decrease in the input redundancy rate and the output deficiency rate, as well as an increase in technical efficiency. Thus, regional CTI forms a benign comprehensive development trend and achieves positive synergy in integration and innovation. As a trend consistent with that found in certain previous studies [78,79], efficiency, or the synergistic running-in phenomenon revealed by the U-shaped curve, is of great significance to better understanding the process of integrating CTI and to formulating corresponding policies.

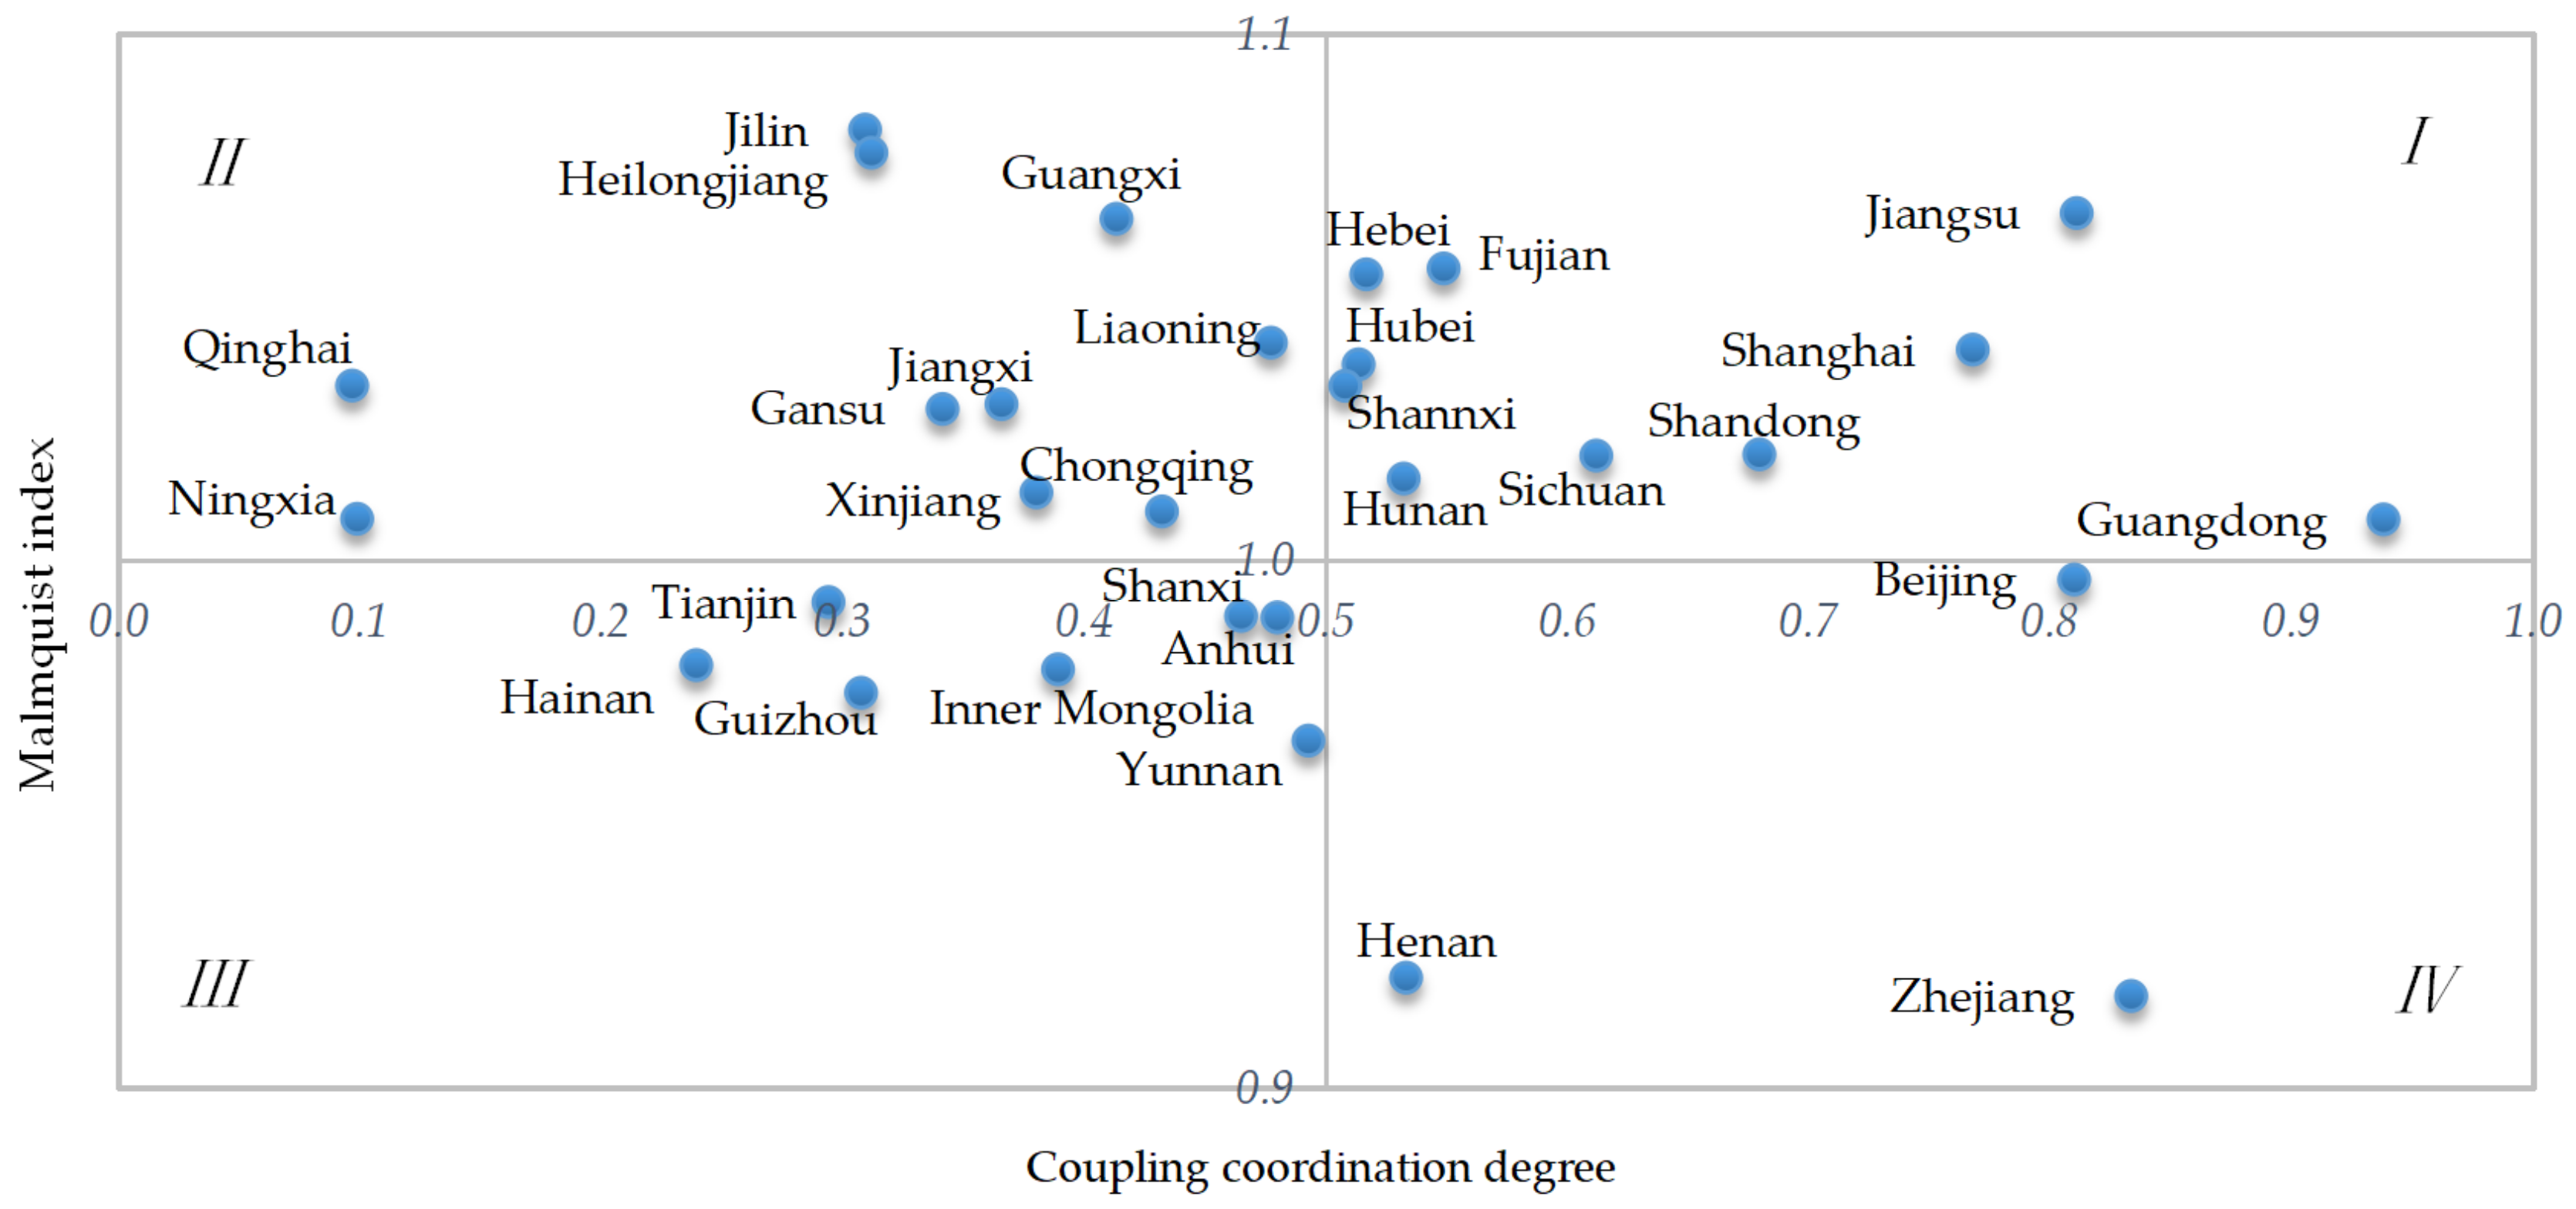
4.3.3. Comparison of the Coupling Coordination Degree and Malmquist Index

In order to explore the relationship between coordination and sustainable productivity growth, we used a scatterplot matrix of the coupling coordination degree and the Malmquist index, as shown in Figure 10. The matrix was divided into four quadrants by D 0.5 < D , M 1 < M . Quadrant I is an area with strong coupling coordination degree and sustainable productivity growth in both industries, accounting for 32.3% of all regions, which includes 60% of the eastern regions, 20% of the central regions, and 20% of the western regions. This distribution indicates that regional economic development has an obvious influence on the two indices, such as in the case of Guangdong and Jiangsu, which had the best coupling coordination degree and Malmquist index, respectively. However, the less-developed areas, such as Sichuan and Shannxi, still have the opportunity to enter Quadrant I through a high level of coordinated input and innovation. Quadrant II represents areas with a weak industrial coupling coordination degree but strong sustainable productivity growth, accounting for 35.5% of all regions, which includes 82% of the western regions. Quadrant III is an area with poor performance in both indicators, accounting for 22.6% of all regions, which includes 43% of the western regions, 28.5% of the eastern regions, and 28.5% of the central regions. We believe there are various reasons for the distinctive difference between Quadrants II and III. Given the phenomenon revealed in Section 4.3.2, the emergence of U-shaped curves indicates that the two industries usually need to go through the running-in period to achieve better efficiency, which may lead to differentiation in productivity growth. Additionally, other factors such as innovation [80] and life cycle [81] may also impact productivity growth performance. Quadrant IV is an area with strong industrial coupling coordination degree but weak sustainable productivity growth, accounting for 9.7% of all regions, including Beijing, Zhejiang, and Henan. This situation probably indicates that regional culture and tourism development have entered a more mature stage in their life cycle, and productivity growth will face greater downward pressure without innovation.

5. Conclusions and Implications

In this study, an efficiency evaluation was introduced to establish an analytical framework for exploring the existence of sustainable CTI synergies. We regarded the two industries as a black box and applied the SBM model, the Malmquist index, and the coupling coordination degree to evaluate the technical efficiency, sustainable growth of productivity, and coordination level from an economic perspective. Referring to the Cobb–Douglas production function model, we selected human resources and CTI investment as input indicators, selected revenue as an output indicator, and used China as a case study. Panel data for 31 provinces and regions from 2010 to 2016 were used, which was consistent with the period during which China promoted CTI integration and coordination and issued relevant policies. The main conclusions of this research are below.
(1) The mean value of CTI efficiency after involving the cultural industry was significantly higher than the efficiency value of the tourism industry alone, indicating that achieving synergy is beneficial to the tourism industry. To compare efficiency differences, we controlled the indicators and further calculated the redundancy rate of input and the deficiency rate of output. The results suggest that CTI synergies not only improve tourism industry efficiency by 0.286 but also reduce the redundancy rate of tourism human resources and the deficiency rate of tourism revenue. Therefore, we believe that integrating culture generally achieves synergy with the tourism industry. This result is consistent with the phenomena disclosed in the previous literature. Tourists regularly show great interest in the arts, dance, legends, and other distinctive cultural symbols, which are gradually forgotten by the younger generation in the destination. The re-emergence and re-presentation of these symbols reflect their symbiotic relationship [8]. In addition, we noticed that CTI integration had no positive synergy with input redundancy rate and output deficiency rate in some regions, instead exhibiting the opposite effect, which is in line with certain empirical studies regarding the negative impact of tourism on culture [76,82]. The coexistence of positive and negative synergies revealed in the efficiency evaluation provides us with a new perspective on the complexity of the sustainability of the CTI integration process.
(2) Some economically underdeveloped regions have opportunities to catch up with developed regions and even perform better in terms of technical efficiency and productivity growth. In this study, the SBM model of DEA was used as a tool to evaluate the CTI, which were considered black boxes. We found that the curve of technical efficiency was generally good and acceptable from the time perspective, but it decreased slightly during great fluctuations, the causes of which can be found in positive macro policies and the negative external economic environment. The technical efficiency values of Beijing, Shanghai, and Tibet reached 1, achieving superior efficiency. In line with China’s three economic zones for regional division, we noticed that the technical efficiency of the underdeveloped western region surpassed that of the central region, second only to the developed eastern region. In addition, the Malmquist index and panel data were applied to evaluate the TFP over the period. The data suggest that the western region has surpassed the eastern and central regions in terms of productivity growth sustainability. Although there is controversy over the impact of the tourism industry on the balanced development of the region [83], the data in this research indicate that the economically underdeveloped regions have an opportunity to perform better. This implies that encouraging coordinated input in CTI in underdeveloped regions will not always lead to efficiency loss as a traditional mindset might imply [84].
(3) The U-shaped and inverted U-shaped curves between the groups of coupling coordination degree and the efficiency-related index revealed the running-in effect in the process of integrating CTI. The general results of the coupling coordination degree follow the trend that the economically developed regions are better than the economically underdeveloped regions. However, we further analyzed the relationship between the groups of coupling coordination degree based on technical efficiency, redundancy rate of input, and deficiency rate of output, respectively. The U-shaped and inverted U-shaped curves imply that a temporary uncoordinated and inefficient phase, called the running-in effect, is inevitable. This effect is largely because there are too many comprehensive factors behind innovation success [85]. The future of CTI integration lies in the adoption of new technologies and the use of creativity and innovation to build new cultural tourism attractions [48]. Meanwhile, the decomposition of the Malmquist index in this study confirmed that technological advancement is the key to driving the progress of TFP. Therefore, policy-making can benefit from the running-in effect. From a macro perspective, policies that encourage technological advancement and shorten the period of the running-in effect should be targeted.
Some issues still require further study. First, the exploration and measurement of sustainable synergies between the CTI requires more variety in the data and methods used, as sustainability is a combination of multiple aspects. Owing to data limitations, in this study we only conducted research from the perspective of economic and efficiency evaluation. Although it implies achieving sustainability to some extent, the process remains a black box. Second, the specific impact mechanism of the life cycle or other theories on CTI synergies needs further explanation. In the comparison matrix of the coupling coordination degree and Malmquist index, many western economically underdeveloped regions in China showed strong sustainable productivity performance growth with a low coupling coordination degree, while some traditional economically developed regions were the opposite. Finally, it is of great significance to further evaluate and explain the negative synergy that exists in certain areas, which can provide a reference for local governments regarding when to intervene in the cultural tourism market.

Author Contributions

Writing—original draft, Z.S.; Writing—review and editing, J.R.A., W.C.M.; Data curation, D.D.L.

Funding

This research was jointly supported by National Natural Science Foundation of China (71764003), The MOE (Ministry of Education in China) Project of Humanities and Social Sciences (17YJCZH150), China Postdoctoral Science Foundation (2016M590847), China Scholarship Council (201806665008), and Guangxi Postdoctoral Special Funding Project (160553).

Conflicts of Interest

The authors declare no conflict of interest.

References

  1. Petroman, I. Types of cultural tourism. Sci. Pap. Anim. Sci. Biotechnol. 2013, 46, 385–388. [Google Scholar]
  2. Bonet, L. Cultural tourism. In A Handbook of Cultural Economics; Towse, R., Ed.; Edward Elgar: Cheltenham, UK, 2003; pp. 187–193. [Google Scholar]
  3. Zhuang, X.; Yao, Y.; Li, J.J. Sociocultural Impacts of Tourism on Residents of World Cultural Heritage Sites in China. Sustainability 2019, 11, 840. [Google Scholar] [CrossRef]
  4. Gjorgievski, M.; Melles Trpkova, S. Movie induced tourism: A new tourism phenomenon. UTMS J. Econ. 2012, 3, 97–104. [Google Scholar]
  5. Craik, J. Fashion, Tourism and Global Culture. In The Handbook of Fashion Studies; Black, S., Haye, A.D.L., Entwistle, J., Rocamora, A., Root, R.A., Thomas, H., Eds.; Bloomsbury Academic: Oxford, UK, 2013; pp. 364–380. [Google Scholar]
  6. Picard, M. ‘Cultural tourism’ in Bali: National integration and regional differentiation. In Tourism in South-East Asia; Hitchcock, M., King, V.T., Parnwell, J.G., Eds.; Routledge: London, UK, 1993; pp. 71–98. [Google Scholar]
  7. Loulanski, T.; Loulanski, V. The sustainable integration of cultural heritage and tourism: A meta-study. J. Sustain. Tour 2011, 19, 837–862. [Google Scholar] [CrossRef]
  8. United Nations World Tourism Organization (UNWTO). Report on Tourism and Culture Synergies; UNWTO: Madrid, Spain, 2018; p. 20. [Google Scholar]
  9. Borowiecki, K.J.; Castiglione, C. Cultural participation and tourism flows: An empirical investigation of Italian provinces. Tour. Econ. 2014, 20, 241–262. [Google Scholar] [CrossRef]
  10. Jiménez-Beltrán, F.; López-Guzmán, T.; González Santa Cruz, F. Analysis of the relationship between tourism and food culture. Sustainability 2016, 8, 418. [Google Scholar] [CrossRef]
  11. Barbieri, C.; Mahoney, E. Cultural tourism behaviour and preferences among the live-performing arts audience: An application of the univorous–omnivorous framework. Int. J. Tour. Res. 2010, 12, 481–496. [Google Scholar] [CrossRef]
  12. Fuchs, M. Strategy development in tourism destinations: A DEA approach. Pozn. Univ. Econ. Rev. 2004, 4, 52–73. [Google Scholar]
  13. Bosetti, V.; Cassinelli, M.; Lanza, A. Benchmarking in tourism destinations; keeping in mind the sustainable paradigm. In Advances in Modern Tourism Research; Matias, A., Nijkamp, P., Neto, P., Eds.; Physica-Verlag of Springer: Heidelberg, Germany, 2007; pp. 165–180. [Google Scholar]
  14. Zhang, Y.; Zhu, H. Empirical Research on Coupling Coordination of Cultural Industry and Tourism Industry in Southwest China. Areal Res. Dev. 2013, 2, 16–21. (In Chinese) [Google Scholar]
  15. Yang, C.H.; Lin, H.L.; Han, C.C. Analysis of international tourist arrivals in China: The role of World Heritage Sites. Tour. Manag. 2010, 31, 827–837. [Google Scholar] [CrossRef]
  16. WTCF Report on World Tourism Economy Trends of 2019. Available online: https://cn.wtcf.org.cn/xsyj/lhhbg/201901153839829.html (accessed on 1 October 2019).
  17. UNESCO World Heritage List. Available online: http://whc.unesco.org/en/list/ (accessed on 1 October 2019).
  18. Yang, J.T. Legislative Situation and Construction of Legal System in the Development of Culture Industry. J. Beijing Union Univ. (Humanit. Soc. Sci.) 2012, 10, 88–94. (In Chinese) [Google Scholar]
  19. Cheng, J.; Lu, L.; Zhu, F.B. On the Study Progress of Tourism Industrial Merging and Its Enlightenment. Tour. Trib. 2011, 26, 13–19. (In Chinese) [Google Scholar]
  20. China has selected 134 historical and cultural cities and 528 historical and cultural towns and villages. (In Chinese). Available online: http://www.ce.cn/xwzx/gnsz/gdxw/201812/25/t20181225_31112932.shtml (accessed on 19 October 2019).
  21. China Excellent Tourism City Directory. (In Chinese). Available online: https://web.archive.org/web/20130115122030/http://cnta.gov.cn/html/2010-5/2010-5-5-15-23-87301.html (accessed on 19 October 2019).
  22. The added value of national tourism and related industries accounted for 4.53% of GDP in 2017. (In Chinese). Available online: http://www.stats.gov.cn/tjsj/zxfb/201901/t20190118_1645545.html (accessed on 19 October 2019).
  23. The added value of China’s culture and related industries accounted for 4.2% of GDP in 2017. (In Chinese). Available online: http://www.stats.gov.cn/tjsj/zxfb/201810/t20181010_1626867.html (accessed on 19 October 2019).
  24. Adorno, T.W.; Rabinbach, A.G. Culture industry reconsidered. New Ger. Crit. 1975, 6, 12–19. [Google Scholar] [CrossRef]
  25. Adorno, T.W. The Culture Industry: Selected Essays on Mass Culture; Routledge: London, UK, 1991; pp. 1–27. [Google Scholar]
  26. Adorno, T.W.; Horkheimer, M. The culture industry: Enlightenment as mass deception. In Stardom and Celebrity: A Reader; Redmond, S., Holmes, S., Eds.; SAGE: London, UK, 2007; pp. 34–43. [Google Scholar]
  27. Alsos, G.A.; Eide, D.; Madsen, E.L. Introduction: Innovation in tourism industries. In Handbook of Research on Innovation in Tourism Industries; Alsos, G.A., Eide, D., Madsen, E.L., Eds.; Edward Elgar: Cheltenham, UK, 2014; pp. 1–24. [Google Scholar]
  28. Craik, J. The culture of tourism. In Touring Cultures; Rojek, C., Urry, J., Eds.; Routledge: London, UK, 2002; pp. 123–146. [Google Scholar]
  29. Throsby, D. Cultural capital. J. Cult. Econ. 1999, 23, 3–12. [Google Scholar] [CrossRef]
  30. Herrero-Prieto, L.C.; Gómez-Vega, M. Cultural resources as a factor in cultural tourism attraction:Technical efficiency estimation of regional destinations in Spain. Tour. Econ. 2017, 23, 260–280. [Google Scholar] [CrossRef]
  31. Richards, G. Production and consumption of European cultural tourism. Ann. Tour. Res. 1996, 23, 261–283. [Google Scholar] [CrossRef]
  32. Hughes, H. Arts, Entertainment and Tourism; Butterworth-Heinemann: Oxford, UK, 2000; pp. 61–63. [Google Scholar]
  33. Hughes, H.L. Culture and tourism: A framework for further analysis. Manag. Leis. 2002, 7, 164–175. [Google Scholar] [CrossRef]
  34. Smith, M.K. Issues in Cultural Tourism Studies; Routledge: London, UK, 2003; pp. 4–7. [Google Scholar]
  35. Andreasen, A.R.; Belk, R.W. Predictors of attendance at the performing arts. J. Consum. Res. 1980, 7, 112–120. [Google Scholar] [CrossRef]
  36. Kirchberg, V. Museum visitors and non-visitors in Germany: A representative survey. Poetics 1996, 24, 239–258. [Google Scholar] [CrossRef]
  37. Herbert, D. Literary places, tourism and the heritage experience. Ann. Tour. Res. 2001, 28, 312–333. [Google Scholar] [CrossRef]
  38. Artal-Tur, A.; Briones-Peñalver, A.J.; Villena-Navarro, M. Tourism, cultural activities and sustainability in the Spanish Mediterranean regions: A probit approach. Tour. Manag. Stud. 2018, 14, 7–18. [Google Scholar] [CrossRef]
  39. Dolnicar, S. Activity-Based Market Sub-Segmentation of Cultural Tourists. J. Hosp. Tour. Manag. 2002, 9, 94–105. [Google Scholar]
  40. Zeppel, H.; Hall, C.M. Arts and heritage tourism. In Special Interest Tourism; Weiler, B., Hall, C.M., Eds.; Belhaven Press: London, UK, 1992; pp. 47–68. [Google Scholar]
  41. Medina, L.K. Commoditizing culture: Tourism and Maya identity. Ann. Tour. Res. 2003, 30, 353–368. [Google Scholar] [CrossRef]
  42. Richards, G. Tourism Trends: The Convergence of Culture and Tourism; Working Paper, Academy for Leisure; NHTV University of Applied Sciences: Brenda, The Netherlands, 2014. [Google Scholar]
  43. Zhang, H.; Wang, Z. Research on Industrial Convergence Development of Tourism Industry and Cultural Industry. Resour. Develpment Mark. 2010, 26, 322–326. (In Chinese) [Google Scholar]
  44. Pope, J.; Annandale, D.; Morrison-Saunders, A. Conceptualising sustainability assessment. Environ. Impact Assess. Rev. 2004, 24, 595–616. [Google Scholar] [CrossRef]
  45. Girard, L.F.; Nijkamp, P. Cultural Tourism and Sustainable Local Development; Ashgate: Surrey, UK, 2009; pp. 13, 22, 52. [Google Scholar]
  46. Berry, S.; Shephard, G. Cultural Heritage Sites and Their Visitors: Too Many for Too few. In Cultural Attractions and European Tourism; Richards, G., Ed.; CABI: Oxon, UK, 2001; pp. 159–172. [Google Scholar]
  47. Russo, A.P. The “vicious circle” of tourism development in heritage cities. Ann. Tour. Res. 2002, 29, 165–182. [Google Scholar] [CrossRef]
  48. Richards, G. Cultural tourism: A review of recent research and trends. J. Hosp. Tour. Manag. 2018, 36, 12–21. [Google Scholar] [CrossRef]
  49. Noonan, D.S.; Rizzo, I. Economics of cultural tourism: Issues and perspectives. J. Cult. Econ. 2017, 41, 95–107. [Google Scholar] [CrossRef]
  50. Srakar, A.; Vecco, M. Ex-ante versus ex-post: Comparison of the effects of the European Capital of Culture Maribor 2012 on tourism and employment. J. Cult. Econ. 2017, 41, 197–214. [Google Scholar] [CrossRef]
  51. Cracolici, M.F.; Nijkamp, P.; Rietveld, P. Assessment of Tourism Competitiveness by Analysing Destination Efficiency. Tour. Econ. 2008, 14, 325–342. [Google Scholar] [CrossRef]
  52. Barros, C.P.; Botti, L.; Peypoch, N.; Robinot, E.; Solonandrasana, B.A.; George, A. Performance of French destinations: Tourism attraction perspectives. Tour. Manag. 2011, 32, 141–146. [Google Scholar] [CrossRef]
  53. Benito, B.; Solana, J.; López, P. Determinants of Spanish Regions’ Tourism Performance: A Two-Stage, Double-Bootstrap Data Envelopment Analysis. Tour. Econ. 2014, 20, 987–1012. [Google Scholar] [CrossRef]
  54. Cuccia, T.; Guccio, C.; Rizzo, I. The effects of UNESCO World Heritage List inscription on tourism destinations performance in Italian regions. Econ. Model. 2016, 53, 494–508. [Google Scholar] [CrossRef]
  55. Cuccia, T.; Guccio, C.; Rizzo, I. UNESCO sites and performance trend of Italian regional tourism destinations: A two-stage DEA window analysis with spatial interaction. Tour. Econ. 2017, 23, 316–342. [Google Scholar] [CrossRef]
  56. Assaf, A.G.; Josiassen, A. Identifying and Ranking the Determinants of Tourism Performance: A Global Investigation. J. Travel Res. 2011, 51, 388–399. [Google Scholar] [CrossRef]
  57. Assaf, A.G.; Tsionas, M. The estimation and decomposition of tourism productivity. Tour. Manag. 2018, 65, 131–142. [Google Scholar] [CrossRef]
  58. Basso, A.; Funari, S. A quantitative approach to evaluate the relative efficiency of museums. J. Cult. Econ. 2004, 28, 195–216. [Google Scholar] [CrossRef]
  59. Bishop, P.; Brand, S. The efficiency of museums: A stochastic frontier production function approach. Appl. Econ. 2003, 35, 1853–1858. [Google Scholar] [CrossRef]
  60. Liu, G.; Yang, W. DEA-based investment efficiency model and a positive analysis of the cultural tourism industry. Tour. Trib. 2013, 28, 77–84. (In Chinese) [Google Scholar]
  61. Rawley, E. Diversification, coordination costs, and organizational rigidity: Evidence from microdata. Strateg. Manag. J. 2010, 31, 873–891. [Google Scholar] [CrossRef] [Green Version]
  62. Zellner, A.; Kmenta, J.; Dreze, J. Specification and estimation of Cobb-Douglas production function models. Econom. J. Econom. Soc. 1966, 34, 784–795. [Google Scholar] [CrossRef]
  63. Charnes, A.; Cooper, W.W.; Rhodes, E. Measuring the efficiency of decision making units. Eur. J. Oper. Res. 1978, 2, 429–444. [Google Scholar] [CrossRef]
  64. Tone, K. Slacks-based measure of efficiency. In Handbook on Data Envelopment Analysis; Cooper, W.W., Seiford, L.M., Zhu, J., Eds.; Springer: Boston, MA, USA, 2011; pp. 195–209. [Google Scholar]
  65. Xu, D.; Huang, Z.F.; Hu, X.H.; Lv, L.; Cao, F.D. The Spatial Pattern Evolution and Its Influencing Factors of County-Scale Tourism Efficiency in Zhejiang Province. Econ. Geogr. 2018, 38, 197–207. (In Chinese) [Google Scholar]
  66. Malmquist, S. Index numbers and indifference surfaces. Trab. De Estad. Y De Investig. Oper. 1953, 4, 209–242. [Google Scholar] [CrossRef]
  67. Färe, R.; Grosskopf, S.; Lindgren, B.; Roos, P. Productivity changes in Swedish pharamacies 1980–1989: A non-parametric Malmquist approach. J. Product. Anal. 1992, 3, 85–101. [Google Scholar] [CrossRef]
  68. Pastor, J.T.; Lovell, C.K. A global Malmquist productivity index. Econ. Lett. 2005, 88, 266–271. [Google Scholar] [CrossRef]
  69. Färe, R.; Grosskopf, S.; Norris, M.; Zhang, Z. Productivity growth, technical progress, and efficiency change in industrialized countries. Am. Econ. Rev. 1994, 84, 66–83. [Google Scholar]
  70. Zhang, Y.; Su, Z.; Li, G.; Zhuo, Y.; Xu, Z. Spatial-Temporal Evolution of Sustainable Urbanization Development: A Perspective of the Coupling Coordination Development Based on Population, Industry, and Built-Up Land Spatial Agglomeration. Sustainability 2018, 10, 1766. [Google Scholar] [CrossRef] [Green Version]
  71. Liu, Y.; Li, R.; Song, X. Analysis of Coupling Degrees of Urbanization and Ecological Environment in China. J. Nat. Resour. 2005, 20, 105–112. [Google Scholar]
  72. Guidance on Promoting the Integration of Culture and Tourism. (In Chinese). Available online: http://www.gov.cn/zwgk/2009-09/15/content_1418269.htm (accessed on 19 September 2019).
  73. The Press Conference Was Held on “Guidance on Promoting the Integration of Culture and Tourism”. (In Chinese). Available online: http://www.gov.cn/gzdt/2009-09/24/content_1425087.htm (accessed on 19 September 2019).
  74. United Nations Department of Economic and Social Affairs (UN/DESA). World Economic Situation and Prospects 2013; United Nations: New York, NY, USA, 2013. [Google Scholar]
  75. Li, S.; Xing, F.; Zhang, L. The influence of tourism industrial agglomeration on the regional tourism industry efficiency: A panel data analysis of provinces in China. World Reg. Stud. 2017, 26, 134–146. (In Chinese) [Google Scholar]
  76. Archer, B.; Cooper, C.; Ruhanen, L. The positive and negative impacts of tourism. In Global Tourism, 3rd ed.; Theobald, W.F., Ed.; Elsevier: Burlington, VT, USA, 2005; pp. 79–102. [Google Scholar]
  77. Li, Z.; Yang, W.; Wang, C.; Zhang, Y.; Yuan, X. Guided High-Quality Development, Resources, and Environmental Forcing in China’s Green Development. Sustainability 2019, 11, 1936. [Google Scholar] [CrossRef] [Green Version]
  78. Cole, S. Synergy and congestion in the tourist destination life cycle. Tour. Manag. 2012, 33, 1128–1140. [Google Scholar] [CrossRef]
  79. Su, Y.-W.; Lin, H.-L. Analysis of international tourist arrivals worldwide: The role of world heritage sites. Tour. Manag. 2014, 40, 46–58. [Google Scholar] [CrossRef]
  80. Lin, Y.; Deng, N.; Gao, H. Research on Technological Innovation Efficiency of Tourist Equipment Manufacturing Enterprises. Sustainability 2018, 10, 4826. [Google Scholar] [CrossRef] [Green Version]
  81. Song, M.; Zheng, W.; Wang, S. Measuring green technology progress in large-scale thermoelectric enterprises based on Malmquist–Luenberger life cycle assessment. Resour. Conserv. Recycl. 2017, 122, 261–269. [Google Scholar] [CrossRef]
  82. Andriotis, K. Community groups’ perceptions of and preferences for tourism development: Evidence from Crete. J. Hosp. Tour. Res. 2005, 29, 67–90. [Google Scholar] [CrossRef]
  83. Tosun, C.; Timothy, D.J.; Öztürk, Y. Tourism growth, national development and regional inequality in Turkey. J. Sustain. Tour 2003, 11, 133–161. [Google Scholar] [CrossRef]
  84. Fuest, C.; Huber, B. Can regional policy in a federation improve economic efficiency? J. Public Econ. 2006, 90, 499–511. [Google Scholar] [CrossRef]
  85. Alegre, I.; Berbegal-Mirabent, J. Social innovation success factors: Hospitality and tourism social enterprises. Int J. Contemp Hosp. M 2016, 28, 1155–1176. [Google Scholar] [CrossRef]
Figure 1. Conceptual model of sustainable cultural and tourism industries (CTI).
Sustainability 11 06607 g001
Figure 2. An analytical framework of CTI based on the efficiency evaluation.
Sustainability 11 06607 g002
Figure 3. Technical efficiency trend of CTI in China (2010–2016).
Sustainability 11 06607 g003
Figure 4. Regional CTI efficiency in China: (a) 2010; (b) 2013; (c) 2016; (d) Efficiency means for 2010–2016.
Sustainability 11 06607 g004
Figure 5. The trend of the Malmquist index and its decomposition in China. Note: TC, technical change; PEC, pure technical efficiency change; SEC, scale effect change.
Sustainability 11 06607 g005
Figure 6. The Malmquist index and its decomposition in 31 regions of China.
Sustainability 11 06607 g006
Figure 7. The coupling coordination degree of CTI in China (2000–2016).
Sustainability 11 06607 g007
Figure 8. Regional coupling coordination degrees of CTI in China (2000–2016).
Sustainability 11 06607 g008
Figure 9. The relationships of the groups of coupling coordination degree and efficiency-related indices: (a) The groups of coupling coordination degree and technical efficiency; (b) The groups of coupling coordination degree and redundancy rate of inputs or deficiency rate of outputs.
Sustainability 11 06607 g009
Figure 10. Scatterplot matrix of the coupling coordination degree and Malmquist index in 31 regions of China. (* Quadrant II includes Tibet, but it is beyond the scale of this chart.)
Sustainability 11 06607 g010
Table 1. Differences in indicators between the tourism industry and cultural and tourism industries (CTI) in the efficiency evaluation.
Efficiency NameTypeIndicatorUnit
CTI EfficiencyInputTourism Investment10,000 CNY
Tourism Human ResourcesPerson
Cultural Investment10,000 CNY
Cultural Human ResourcesPerson
OutputTourism Revenue10,000 CNY
Cultural Revenue 1000 CNY
Tourism Industry EfficiencyInputTourism Investment 10,000 CNY
Tourism Human ResourcesPerson
OutputTourism Revenue10,000 CNY
Table 2. A comparison of input and output optimization of CTI and the tourism industry in China 1.
Provinces and RegionsThe Redundancy Rate of Input (%)
Tourism Industry/CTI
The Deficiency Rate of Output (%)
Tourism Industry/CTI
Efficiency of the Tourism Industry/ Efficiency of CTI
Cultural InvestmentCultural Human ResourcesTourism InvestmentTourism Human ResourcesTourism RevenueCultural Revenue
Beijing-/0.0-/0.0−7.1/0.00.0/0.034.0/0.0-/0.00.746/1.000
Tianjin-/−15.0-/−1.90.0/0.0−23.1/−2.859.2/9.1-/0.00.628/0.953
Hebei-/−0.1-/−53.7−18.5/−21.2−15.6/−8.9250.3/141.0-/0.00.286/0.573
Shanxi-/−2.7-/−33.30.0/0.0−31.8/−10.5 141.0/61.9-/0.00.415/0.756
Inner Mongolia-/−22.2-/−23.00.0/0.0−22.5/−2.3213.2/121.3-/6.10.319/0.598
Liaoning-/−0.5-/−33.10.0/0.0−16.5/−9.3108.4/78.5-/31.70.480/0.623
Jilin-/−22.8-/−24.10.0/0.0−23.1/−2.7218.9/134.6-/3.20.314/0.591
Heilongjiang-/−23.8-/−41.30.0/0.0−24.2/−2.7123.7/72.7−/10.60.447/0.703
Shanghai-/0.0-/0.000.0/0.00.0/0.00.0/0.0-/0.01.000/1.000
Jiangsu-/0.0-/−4.30.0/0.0−15.1/−9.351.5/5.4-/5.70.660/0.946
Zhejiang-/−2.8-/−29.70.0/0.0−17.0/−8.966.7/40.8−/14.40.600/0.753
Anhui-/−1.1-/−65.30.0/0.0−27.7/−18.295.4/56.5-/19.60.512/0.707
Fujian-/0.0-/−27.10.0/0.0−38.8/−25.216.4/6.5-/5.80.859/0.940
Jiangxi-/−1.4-/−36.70.0/0.0−38.3/−17.475.3/29.2-/19.40.570/0.789
Shandong-/0.0-/−37.60.0/0.0−23.5/−28.2111.2/76.2-/26.60.473/0.649
Henan-/−0.5-/−56.50.0/0.0−32.7/−14.4144.3/79.9-/6.60.409/0.688
Hubei-/−4.7-/−27.30.0/0.0−23.7/−11.984.2/53.0-/23.40.543/0.699
Hunan-/−2.4-/−34.70.0/0.0−33.1/−24.337.8/18.0-/11.70.726/0.861
Guangdong-/0.0-/−2.90.0/0.0−22.2/−28.126.9/14.9-/12.90.788/0.871
Guangxi-/−6.9-/−2.00.0/0.0−43.0/−29.580.0/37.5-/5.90.556/0.819
Hainan-/0.0-/−24.00.0/−12.0−13.0/−25.0108.8/38.1-/24.40.479/0.749
Chongqing-/−1.2-/−17.60.0/0.0−25.7/−12.434.8/12.7-/21.70.742/0.841
Sichuan-/−6.8-/−17.5−2.1/−2.5−10.5/0.0139.3/69.8-/0.80.418/0.728
Guizhou-/−8.3-/−11.70.0/0.0−43.0/−11.298.3/12.2-/0.50.504/0.937
Yunnan-/−0.3-/−29.80.0/0.0−23.6/−18.798.9/69.8-/28.50.503/0.646
Tibet-/0.0-/0.00−4.7/0.0−6.3/0.0324.6/0.0-/0.00.236/1.000
Shannxi-/−1.1-/−3.50.0/0.0−33.2/−3.898.7/9.5-/2.60.503/0.942
Gansu-/−1.9-/−19.60.0/0.0−33.7/−10.5195.8/26.2-/0.00.338/0.873
Qinghai-/−9.0-/0.000.0/0.0−30.7/−1.0182.3/8.4-/0.00.354/0.955
Ningxia-/−7.8-/−11.3−0.5/−2.2−15.3/−6.2200.6/108.8-/0.70.333/0.637
Xinjiang-/−8.9-/−16.00.0/0.0−21.3/−5.9182.7/128.8-/2.60.354/0.597
1 Some cells are null because of no data or result in calculation.

