Article

Sustainable Diets and Meat Consumption Reduction in Emerging Economies: Evidence from Colombia

by
Laura Blanco-Murcia
* and
Mónica Ramos-Mejía
Department of Business Administration, Pontificia Universidad Javeriana, Bogotá 110231, Colombia
*
Author to whom correspondence should be addressed.
Sustainability 2019, 11(23), 6595; https://doi.org/10.3390/su11236595
Submission received: 26 September 2019 / Revised: 11 November 2019 / Accepted: 11 November 2019 / Published: 22 November 2019

Abstract

:
The growing demand for meat and animal products in emerging economies has become a concern given its environmental and health impacts. The sustainable diets approach has emerged to address the multidimensional challenge of reaching a context-based diet that minimizes negative environmental impacts, provides health and nutrition to all segments of the population, and is affordable and coherent with the local culture and traditions. The aim of this study was to explore the prospects for meat consumption reduction and challenges encompassing the environmental, and health spheres. In order to do so, we analyzed: (1) The current carbon and water per capita footprints for two animal-based options and two plant-based options; and (2) the contribution of each food alternative to the local dietary reference intakes based on average per capita daily consumption and significant differences among the nutrient values for each food alternative through a two proportion Z-test. Our results show that the annual per capita carbon and water footprints for beef were higher compared to other alternatives, despite a higher per capita consumption of chicken. Also, our findings reveal that the average consumption of beef and chicken contributes 39% of the maximum recommended daily intake for cholesterol and 61% of the Recommended Dietary Allowance for protein in the country. Finally, relevant promoting forces and barriers related to meat consumption reduction were identified based on the two dimensions evaluated. This study calls for a joint effort to make changes in public policy, food systems, and consumer education.

1. Introduction

Despite increasing information about human-induced climate change and the nutritional challenges that impact human health, most consumers are not aware of the environmental and health impacts of their everyday food choices [1,2,3], and even if they are, there are several barriers that might route their consumption decisions toward less sustainable options [1,4]. It is estimated that by 2050, the world’s population will reach 9.6 billion, and some argue that farmers around the world will have to double the current agricultural production in order to produce enough food to keep up with the trend toward a meat-centric diet [5]. Meat consumption has tripled in the past 50 years, and although it is no longer increasing in well-established economies, meat demand is still growing in emerging economies [6].
This trend has become a concern due to its negative environmental impacts [7,8] and is also considered controversial from a health perspective [9]. However, at the socio-economic level, meat consumption is generally perceived in a positive way and has become an encouraged habit in some emerging economies in order to guarantee the appropriate intake of some macro and micronutrients in the population [10,11]. The sustainable diets approach has emerged to address the multidimensional challenge of reaching a context-based diet that minimizes negative environmental impacts, provides health and nutrition to all segments of the population, and is affordable and coherent with the local culture and traditions [12,13].
In emerging economies, the environmental impacts and nutritional value of food are a matter of concern, and meat production exemplifies this complex issue [6,10,14]. The main environmental impacts include greenhouse gas emissions, climate change, habitat change, land degradation, water withdrawal, water pollution, and biodiversity loss [8,15,16,17,18]. Despite the above, the impacts of meat consumption on human health remain controversial. On the one hand, lean cuts of meat are a good protein source and provide micronutrients [19,20]. On the other hand, a diet high in animal protein and fat has been linked to cardiovascular diseases, diabetes mellitus, and some types of cancer [9,21]. Nevertheless, meat production and consumption in emerging economies tend to increase when economic conditions improve [9,14,22]. Meat consumption has become a status symbol in emerging economies, where being able to afford meat (also including ready-made meals and eating out alternatives) with a higher frequency is socially recognized as a sign of being well off [10,23]. Meat is also considered by consumers as an essential component of a healthy diet, based on perceptions that encompass a high nutritional value and its high protein content [24].
This complexity is well illustrated by the case of Colombia. Here, environmental challenges clash with the health and nutritional needs of the population. From the consumer perspective, a proper nutrition includes meat and animal products as the main source of protein in the diet [25]. The growing middle class [26], together with public programs promoting the consumption of meat due to its high protein and iron content [11,27], has increased the average intake of animal protein by more than 60% in a span of 20 years [28,29]. Overweight and obesity rates have reached 57% of the population, becoming a major public health concern [30]. There is also evidence identifying cattle grazing as a significant cause of the Colombian Amazon rainforest deforestation [10].
Even though in contexts, such as Colombia, a plant-based diet with low meat consumption could lessen negative environmental impacts, meat consumption reduction becomes a challenge when considering its nutritional benefits.
We studied the main animal-based and plant-based sources of protein consumed in the country comparing their environmental, health, and nutritional impacts, as well as exploring the implications of reduction and replacement. Data and analysis presented in this study demonstrate the multidimensional challenges of meat consumption reduction in an emerging economy, as well as the need for an enormous institutional effort and changes in public policy to address those challenges. The combination of the environmental and health/nutritional analyses aimed to demonstrate the complexity of this issue by showing the barriers and promoting forces that could emerge in a meat consumption reduction scenario. Thus, the combination of these two perspectives allows an integral approach to this issue and contributes to the debate on the transition towards sustainable diets. This paper informs policy in terms of the implications of meat consumption reduction, and the need for reassessing dietary guidelines that acknowledge the three sustainability dimensions.
This paper is structured as follows. Section 2 describes the methodology used. Section 3 presents our results in detail. In Section 4 and Section 5, we provide a discussion of the results obtained, the conclusions of the study, its limitations, and suggestions for future research.

2. Materials and Methods

This study aimed to contribute to the debate on sustainable diets, by integrating the environmental (water and carbon footprint) and health (nutritional comparison) dimensions of meat consumption in Colombia. Specifically, the aim of this study was to explore the impacts and implications of meat consumption in Colombia, to identify the prospects and multidimensional challenges of meat consumption reduction, and to analyze the existing opportunities for shifting towards more sustainable diets.
In order to undertake an integrative analysis, we used the nutrition ecology framework [31]. This framework allows the assessment of complex nutrition problems from a multidimensional perspective, increasing the level of integration in research and providing the basis for scientific policy advice. Through this framework, it is possible to analyze the interrelatedness of nutritional issues by encompassing dimensions, such as health, environment, society, and economy, simultaneously. Thus, by analyzing multiple dimensions, it is possible to get a wider perspective of the problem and acknowledge the emerging tensions [31]. Given the scope of this study, we focused our analysis on the health/nutrition and environmental dimensions, opening the possibility of further research on the social and economy dimensions.
In this study, we assessed the environmental and health/nutrition dimensions of the consumption of two animal-based protein sources and two plant-based protein sources. Beef and poultry were chosen since these two types of meat account for almost 75% of the meat consumption in the country [28]. Since red beans and lentils are the most consumed legumes in Colombia [32], these foods were also included to provide a contrast with animal-based options.
This study was based on desk research. The desk research consisted of calculating the nutritional and environmental impacts of the four options. In order to do this, several estimations were made. Given the fact that this is an under-researched area, we used official documents when available, research results from similar contexts such as Brazil, and reports from producers’ organizations. Below, we explain in detail the procedures by which we calculated each dimension.

2.1. Methods for the Environmental Dimension

First, environmental impacts were calculated based on the following data: (1) The annual average consumption per capita of beef, chicken, red beans, and lentils in Colombia [28]; (2) the water footprint calculated by Hoekstra and Mekonnen [33] for specific production systems and locations; and (3) the carbon footprint related to the production systems and locations [34,35,36,37].
Calculations of the carbon footprint of beef, poultry, red beans, and lentils included carbon emissions per kg of product in the production phase and post-farm gate phase, as well as the average per capita consumption of each product in Colombia. Considering the lack of information about local production systems and post-farm gate conditions, the calculations for this study were based on data available about similar conditions in other countries, and estimations of individual footprints included data of the average local consumption. Thus, beef production emissions were based on information available from grazing systems in Brazil [36], chicken production emissions were based on industrial systems in Canada (given the similarities in the slaughter weight and diet), and the red bean and lentil production emissions and the post-farm gate carbon emissions for the four products were based on data from the U.S. and Canada [34,35].
Since beef imports in Colombia only represent 0.06% of the total national production [38], and chicken imports only represent 2.2% [39], it was assumed in the calculations of the environmental impacts that all the beef and poultry consumed was locally produced. It was also assumed that all the beef consumed was produced under a grazing production system, and that poultry was produced under an industrial system. Additionally, given that almost 80% of the red beans consumed in 2018 in the country were locally produced, and 80% of lentils were imported from Canada [40], this project’s calculations assumed that all the red beans were produced in Colombia, and all the lentils were imported from Canada (via international water shipping containers). The limitations related to these estimations and assumptions are discussed in Section 5.

2.2. Methods for the Health/Nutrition Dimension

Second, the nutritional value per 100 g of the food products mentioned above (beef, poultry, red beans, and lentils) provided by the ICBF Colombian Food Composition Tables [41] (ICBF is the acronym for the Colombian Family Welfare Institute), the Energy and Nutrient Recommendations of the Ministry of Health [42], and the average per capita consumption of these four products in the country were analyzed with the purpose of identifying key nutritional factors per alternative. Since loin is the most popular beef cut among consumers in Colombia [43,44], chicken breasts are the most popular poultry cut [45], and red beans and lentils are the most consumed legumes in the country [32], the nutritional analysis presented in this project corresponds to the information provided by the ICBF Colombian Food Composition Tables [41] for: Chicken breast, skinless, cooked, no salt added; beef, loin, cooked, no salt added; red beans, cooked no salt added; and lentils, cooked, no salt added.

Statistical Analysis

We analyzed significant differences among the proportion of nutrients per 100 g of each product through a two proportion Z-test (R Studio Version 1.0.136). Based on the information available in the Colombian Food Composition Tables [41], the proportions of the macro and micronutrients of beef, chicken, red beans, and lentils were compared. The null hypothesis in each test assumed that the proportions were the same. The alternative hypothesis was that the proportions were different (two-sided test). We used a confidence level of 95% and a confidence interval clipped to [−1,1]. We obtained the Z statistic by taking the squared root of the Chi-squared statistic that comes by default in the function. The p-values obtained are specified in Table 1.

3. Results

3.1. Environmental Dimension

In 2018, in Colombia, per capita annual consumption of the protein types studied were: 18.2 kg of beef, 33.8 kg of chicken [28], 3.2 kg of red beans, and 1.5 kg of lentils [40].

3.1.1. Water Footprint

According to the data provided by Hoekstra and Mekonnen [33], the water footprint of beef produced in Colombia under a grazing system corresponds to 7545 m3/ton [33]; poultry produced under an industrial system in Colombia corresponds to 3246 m3/ton of water [33]; red beans produced in Colombia equals 2671 m3/ton of water [46]; and the global average water footprint for lentils is 5874 m3/ton [46]. Thus, taking into account the average per capita consumption of these products in Colombia, as well as the estimated water footprint presented above, beef had the highest water footprint among the four food types (137,319 lt per person per year), although per capita chicken consumption was higher in the country. The annual water footprint per capita per product is described in Figure 1.

3.1.2. Carbon Footprint

The calculations of the carbon footprint of beef, poultry, red beans, and lentils included carbon emissions per kg of product in the production phase and post-farm gate phase. Production emissions comprised all the “emissions before the product leaves the farm” [35] (p. 23). Post-farm gate emissions encompassed the estimated data per product of processing, domestic transport, refrigeration, home cooking, and disposal [35]. Since there is not enough data available about specific carbon emissions related to these processes in Colombia, the calculations for this study were based on data available about the production emissions in Brazil [36], and the post-farm gate carbon emissions from the U.S. and Canada [34,35].
Given the similarities between Colombia and Brazil regarding beef production, the carbon footprint used was 28 kg of CO2eq emissions per kg of carcass weight at the production phase (in a scenario that does not include land use change), and 44 kg of CO2eq per kg of carcass weight (in a scenario that includes Land Use Change) [36]. Post-farm gate CO2eq emissions for beef corresponded to 3.7 kg of CO2 per kg of consumed beef [35]. Thus, the total carbon footprint of beef, not including LUC, was 31.7 kg of CO2eq per kg of carcass weight, and including LUC was 47.7 kg CO2eq per kg of carcass weight. Beef had the highest carbon footprint of the food types compared in this study.
The Environmental Working Group [35] estimated that poultry production under an industrial system emits 3.6 kg CO2eq per kg of edible chicken. This production system was assumed to be the same in Colombia and Canada, considering the similarities in the slaughter weight (2300–2750 g), and a similar diet of corn and soy-based concentrate [35,47]. Post-farm gate emissions corresponded to 3.3 kg CO2eq per kg of consumed chicken. The total carbon footprint of poultry in Colombia, including production and post-farm gate emissions, was estimated to be 6.9 kg of CO2eq per kg of product [35].
In contrast, vegetable protein alternatives, such as red beans and lentils, had a lower carbon footprint. According to the Environmental Working Group [34], the CO2 emissions of these food types are mainly linked to the energy required to cook them. It was estimated that the emissions from the production of red beans corresponded to 1.3 kg of CO2eq per kg of product, and the post-farm gate emissions corresponded to 0.7 kg of CO2eq per kg of product, for a total carbon footprint of 2 kg of CO2eq per kg of product [34]. In the case of lentils, the production phase represented 0.37 kg of CO2eq per kg of product. Since lentils are imported from Canada, the shipping-related emissions were calculated based on the estimates of Weber and Matthews [37], and added to the post-farm gate value, which then led to a calculated result for this phase of 0.63 kg of CO2eq per kg of product. Thus, the total calculated carbon footprint for lentils was 1 kg of CO2eq per kg of product. The estimations of water and carbon footprints are presented in Table 2.
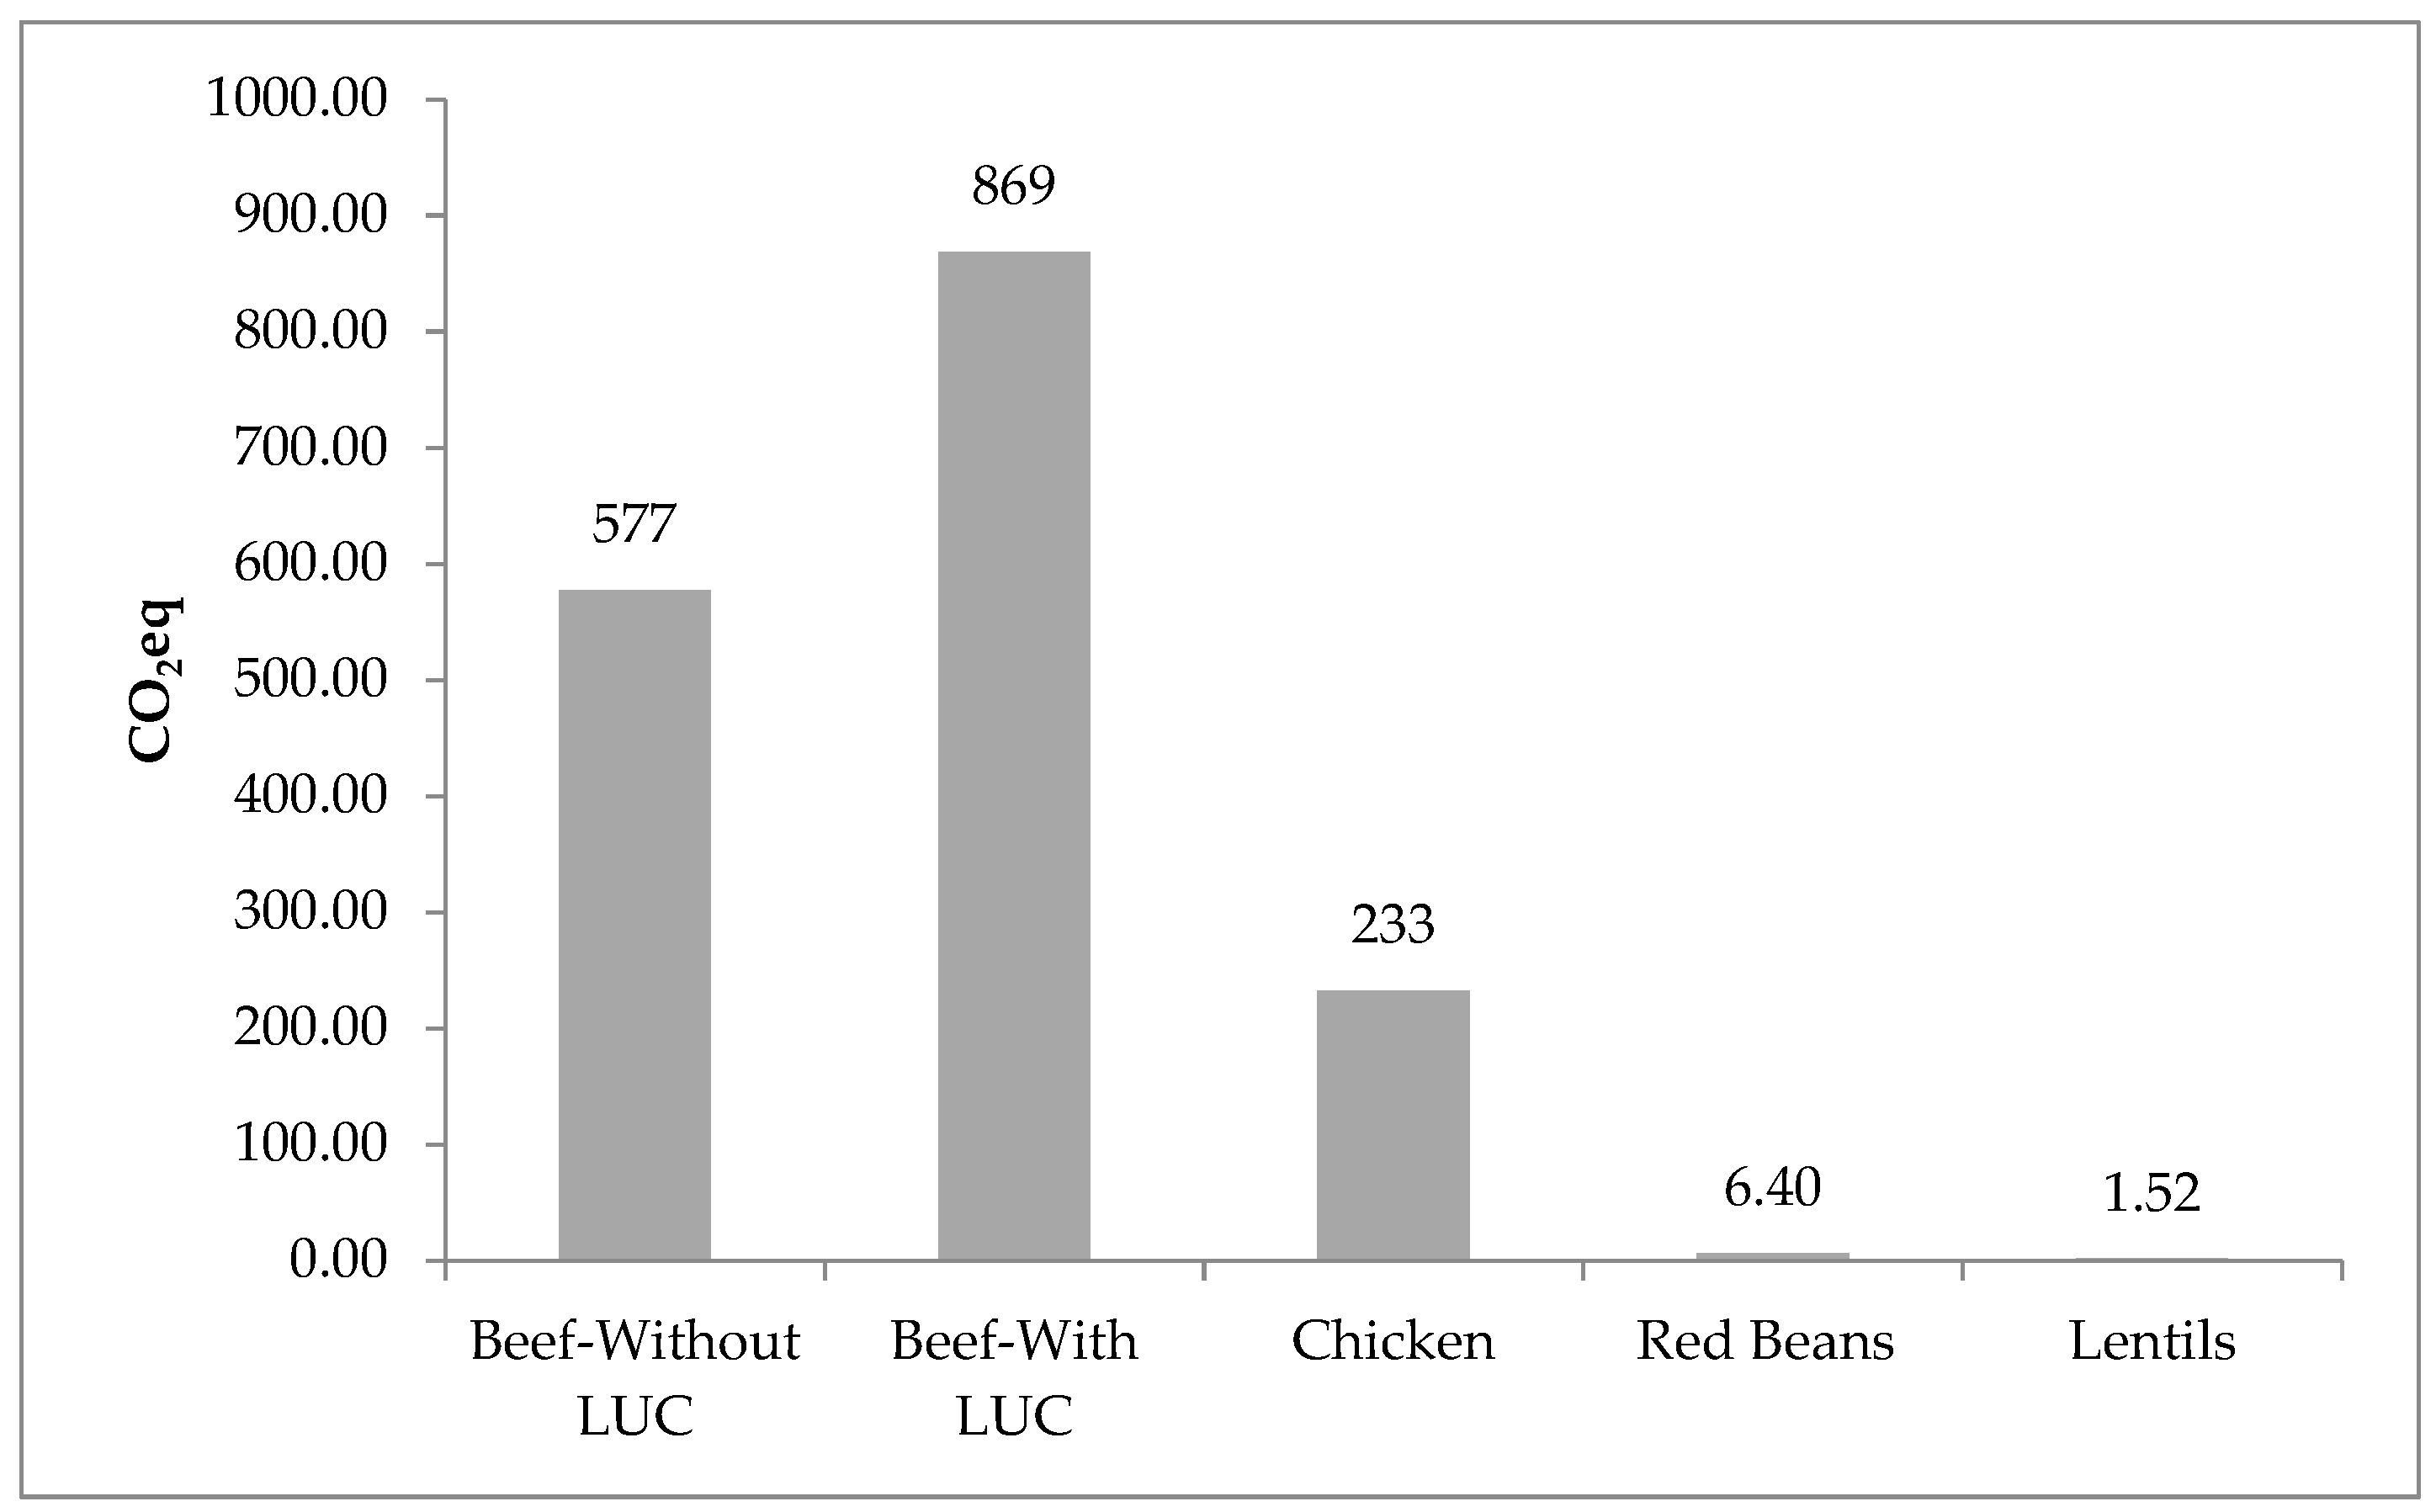
Based on the data presented above and taking into account the average per capita consumption in 2018 in Colombia, beef had the highest carbon footprint with 577.3 kg of CO2eq per person per year not including LUC, and 868.5 kg of CO2eq per person per year when including LUC, which is summarized in Figure 2.

3.2. Health/Nutrition Dimension

Calculations for the health dimension allowed a comparison among the nutritional contributions of the four protein alternatives analyzed, considering the average annual per capita consumption [28,40]. Table 3 summarizes the nutritional values of each alternative based on the Colombian Food Composition Table [41] and the Energy and Nutrient Recommendations of the Ministry of Health for Colombian men and women with an average weight of 60 to 70 kg, between 18 and 59 years old, and with a low/moderate level of physical activity [42]. Table 1 presents the statistical analysis of the nutrient values for each product.
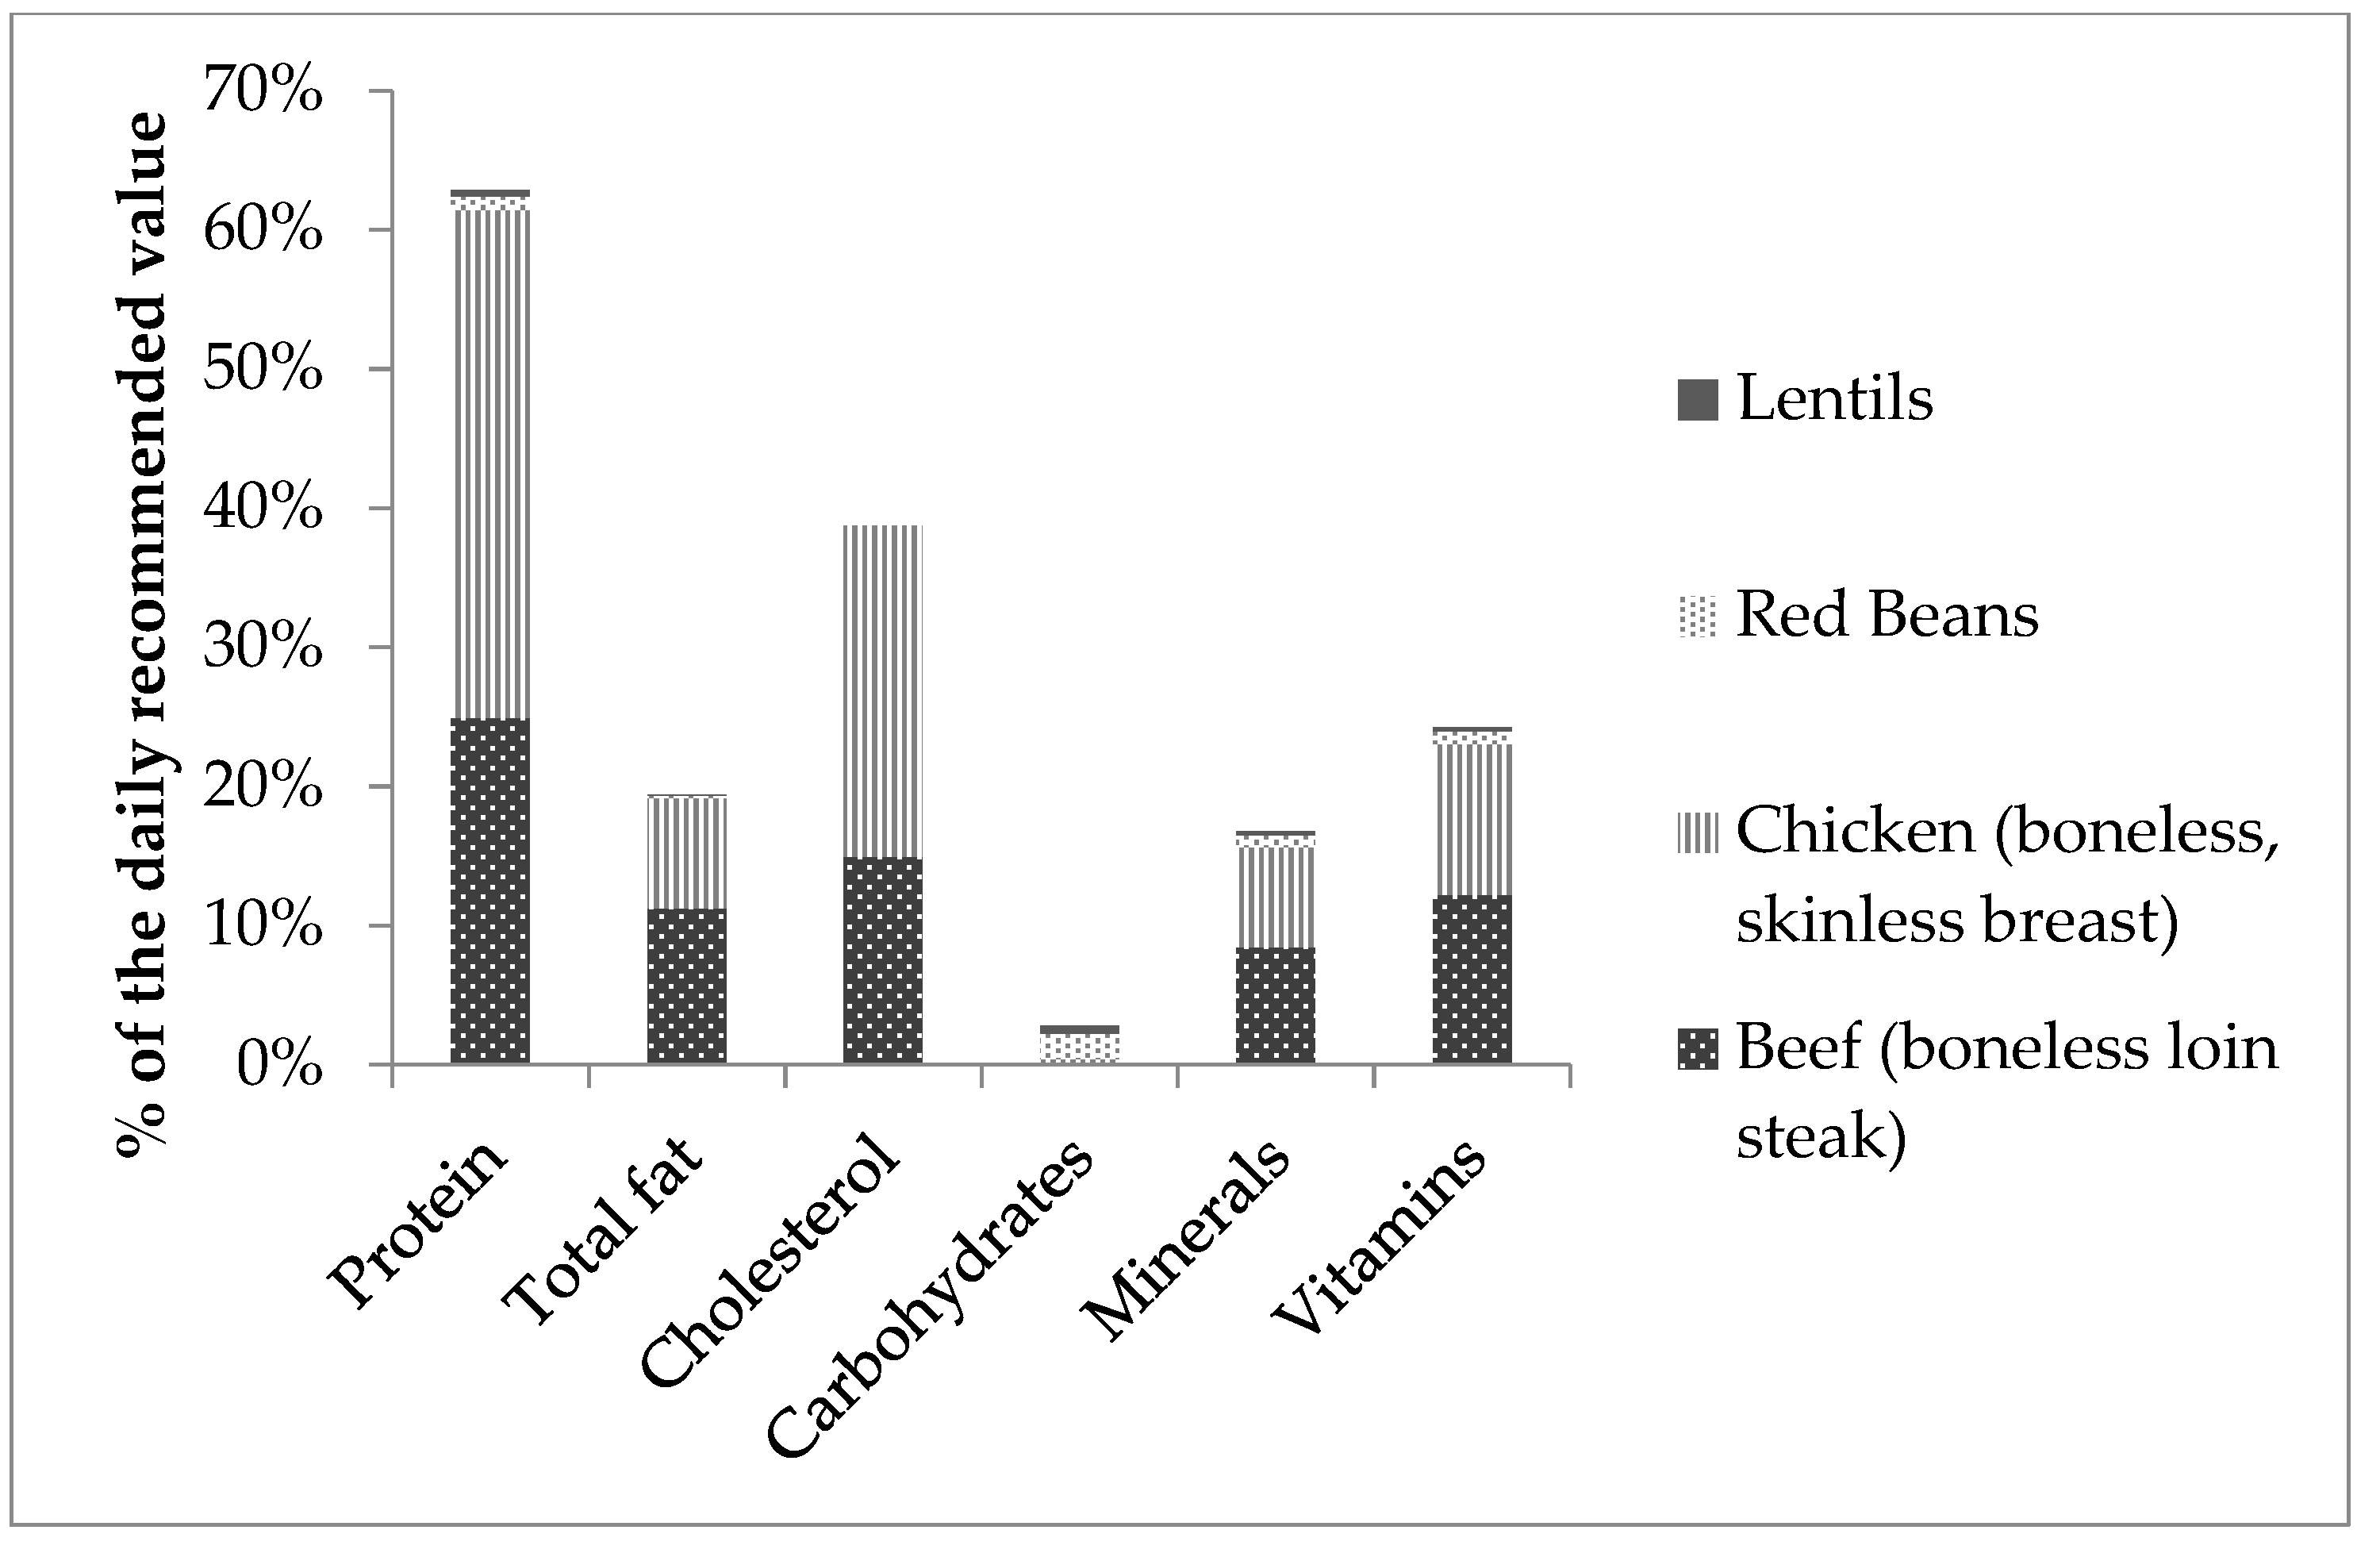
Our findings show that, due to a low per capita consumption of the plant-based options studied, the nutritional contributions of red beans and lentils to the average diet in Colombia are currently small, representing approximately 1.4% of the recommended daily allowance (RDA) of protein that is suggested by Colombia’s Ministry of Health as part of a healthy diet [42]. Animal food alternatives, such as beef and chicken, have a significantly higher (p < 0.05) content of protein compared to red beans and lentils, and are consumed in higher amounts by the population, representing 61% of the RDA.
Regarding total fat, beef has a significantly higher value (p < 0.05) compared with the two plant-based options analyzed, and no significant differences (p < 0.05) with chicken. The total fat value per 100 g of chicken had no significant differences (p < 0.05) with red beans or lentils. The average per capita consumption of chicken and beef provides 19% of the maximum recommended daily intake of total fat while the average per capita consumption of red beans and lentils represents less than 0.3%. The average per capita consumption of the animal-based proteins analyzed also provides 24% of the maximum recommended daily intake of saturated fats, and 75% of the recommended intake of polyunsaturated fatty acids. Additionally, we found that the value for cholesterol is significantly higher (p < 0.05) in the animal-based foods analyzed. According to our calculations, the average per capita consumption of chicken and beef provides approximately 39% of the maximum recommended daily intake of cholesterol. The value of cholesterol, saturated, monounsaturated, and polyunsaturated fatty acids for red beans and lentils was not available in local sources, however, other sources [48,49] report that 100 g of red beans and lentils have less than 1% of the maximum recommended daily intake of saturated fats, and no cholesterol content.
The value of carbohydrates and dietary fiber per 100 g of the two plant-based alternatives was significantly higher (p < 0.05) than the value of these nutrients per 100 g of beef and chicken. The average per capita consumption of red beans and lentils accounts for 2.4% of the RDA for carbohydrates and 3% of the adequate intake (AI) of dietary fiber. Meanwhile, since the content of carbohydrates and fiber of the two animal-based alternatives evaluated is minimal, the average consumption of these two products does not contribute significantly to this macronutrient.
Regarding minerals, when comparing 100 g of each product, our results show a higher content of magnesium, calcium, and potassium in red beans versus the other three alternatives (p < 0.05). Also, we found a higher content of phosphorus in beef compared with the plant-based options analyzed and a lower content of phosphorus when comparing lentils with the other three alternatives (p < 0.05). We found a significantly higher content of sodium in 100 g of the animal-based alternatives versus the content of sodium in 100 g of the plant-based options (p < 0.05). No statistically significant differences were found in the values per 100 g of iron and zinc among the four products; however, the value of zinc per 100 g of beef is closer to the RDA [42]. The average per capita consumption of beef and chicken in Colombia provides 12% of the RDA for iron, 10% of the RDA for magnesium, 36% of the RDA for phosphorus, 8% of the RDA for potassium, 5% of the RDA for sodium, and 37% of the RDA for zinc. Meanwhile, given a lower per capita consumption of red beans and lentils, the contributions of these foods to the RDA for each of the above-mentioned minerals is less than 3%. In the case of iron, the average availability in the country has reached 93%, thanks to the increased availability of meat and animal products [33]. Zinc deficiency is one of the most common micronutrient deficiencies in children in Colombia, with a prevalence in 43% of the population between 1 and 4 years of age [11]. Data regarding nutritional contributions based on food availability [29] suggest that local per capita consumption of phosphorus exceeds daily recommendations in the country, making it relevant to reduce phosphorus consumption due to its association with increased all-cause mortality [50].
As for vitamins, our results show a significantly higher content of niacin per 100 g of chicken when compared to 100 g of the plant-based options evaluated, but no significant differences with the content of niacin in 100 g of beef loin (p < 0.05). We found a significantly higher content of folate in 100 g of the plant-based alternatives versus the content of folate in 100 g of the animal-based options, with red beans having a higher content of this nutrient when comparing it to the other three alternatives (p < 0.05). Regarding vitamin A, our results show that 100 g of chicken have a higher content of this nutrient when compared with beef or red beans but not with lentils (p < 0.05). No statistically significant differences were found in the values per 100 g of vitamin C, thiamin, riboflavin, and vitamin B12 (p < 0.05). Notwithstanding, it is relevant to consider that 100 g of beef loin provides a quantity of vitamin B12 that exceeds the RDA. The average per capita consumption of the two animal-based alternatives provides 7% of the RDA for thiamin, 19% of the RDA for riboflavin, 67% of the RDA for niacin, 2% of the RDA for folate, 66% of the RDA for vitamin B12, and less than 1% of the RDA for vitamin A. The average per capita consumption of the two plant-based alternatives evaluated provides 3% of the RDA for thiamin, 1% of the RDA for riboflavin, 1% of the RDA for niacin, 4% of the RDA for folate, and has no contributions to the RDA for vitamin B12 and vitamin A. In Colombia, 18.1% of the population between 5 and 12 years old is at risk of vitamin B12 deficiency, and 13.2% of women between 13 and 49 years old present with vitamin B12 deficiency [11]. Figure 3 shows the contributions of each food alternative to the recommended daily value for nutrients.

4. Discussion

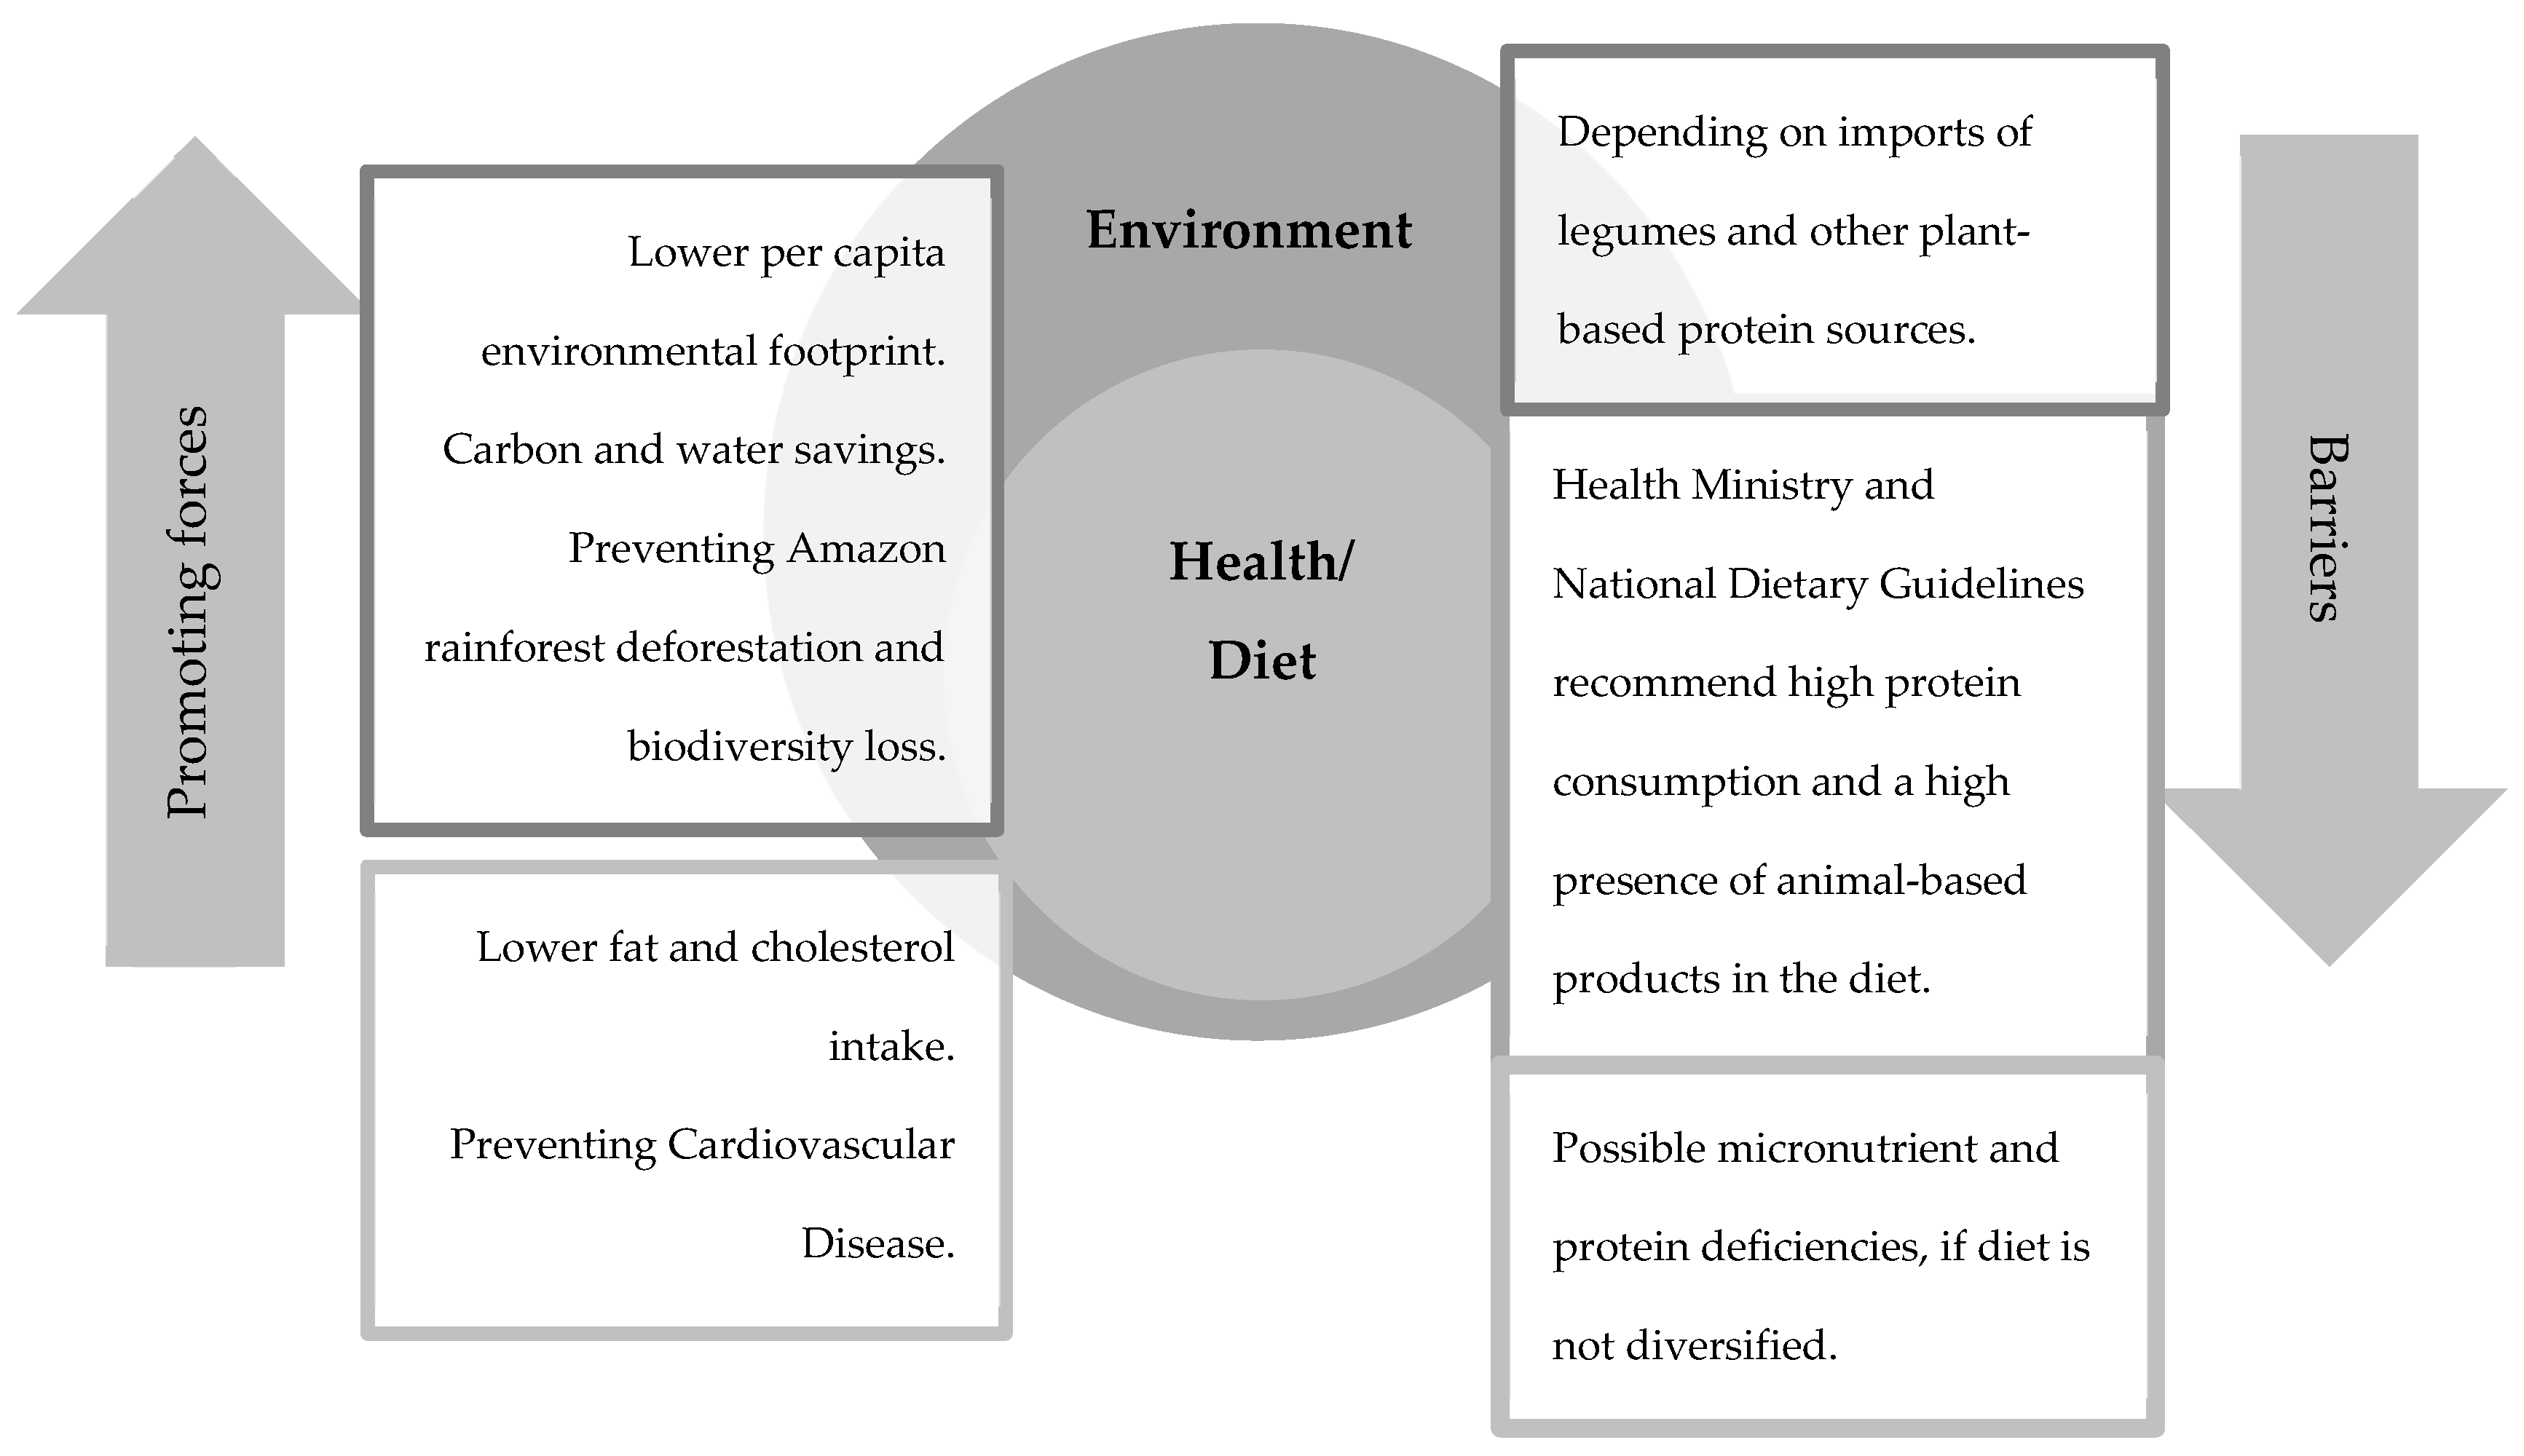
This study adds to the discussion on sustainable diets by exploring the environmental and health/nutrition dimensions of meat consumption reduction in an emerging economy. Through the nutrition ecology framework, it was possible to address this complex issue in an integrative manner [31]. To the best of the author’s knowledge, this is the first time this has been explored in an emerging economy, characterized by a growing middle class that consumes increasing amounts of animal protein, at the same time that key ecosystems are put at risk. An increased consumption of animal food products and the transition towards a diet high in animal fats and low in fruits and vegetables in the country calls for the promotion of sustainable food choices and diets. This, according to the literature, should focus on the reduction in meat consumption [7,10,51,52,53]. The nutrition ecology framework [31] allowed an integrative approach to the possible impacts of a reduction in meat consumption in the country, and permitted joining the discussion about sustainable diets and consumption choices [54] (see Figure 4). In this section, we analyze the promoting forces and barriers of beef consumption reduction in the country.
On the one hand, our results show that reducing per capita beef consumption in 33%—approximately one portion less of beef per week—and replacing it with any of the plant–based alternatives studied (red beans or lentils) could reduce environmental impacts and represent health benefits. Given that beef had the highest carbon and water footprints [55,56], replacing one portion per week of meat with a portion of chicken, red beans, or lentils could represent a reduction in the annual per capita water footprint of Colombians between 9682 and 29,113 lt, as well as a reduction in the annual per capita carbon footprint between 245 and 281 kg of CO2eq (with LUC) (see Table 4). These figures are equivalent to the amount of water used by an average family in Colombia between 23 and 68 days [57] or taking a car off the road for 976 to 1118 km [58].
Additionally, our results show that replacing one portion of beef per week (approximately 6.1 kg per person per year) with the plant-based alternatives studied (red beans and lentils) could represent a lower intake of total fat and cholesterol (see Figure 5). Infarction—or cardiac ischemia—and cerebrovascular disease are two leading causes of death in Colombia, and both diseases are linked to unhealthy lifestyles and high levels of blood cholesterol [59]. Research shows that a reduction in the consumption of animal meat and other animal products, along with an increase in the consumption of plant-based foods, have important health benefits, such as lowering the rate of cardiac events and even reversing Cardio Vascular Disease [60], as well as reducing the risk of having ischemic heart disease [61]. Also, our results show that a higher consumption of plant-based alternatives, such as red beans, could increase the intake of nutrients, such as dietary fiber, potassium, and folate.
On the other hand, some barriers to meat consumption reduction were also identified. Even though there is clear evidence of the environmental footprint and health impacts of animal-based diets [7,62] in Colombia, reducing meat consumption could face other obstacles that should be taken into account, such as the availability of the products that could substitute meat. While Colombia is self-sufficient in terms of fruits, roots, tubers, sugar, meat, and animal products, the country depends on the imports of legumes, such as lentils and chickpeas [29].
It is also important to consider that lean meat cuts, such as the ones evaluated in this study, provide important nutrients, such as protein, zinc, and vitamin B12, to the Colombian population given their availability [29]. Beef consumption reduction could represent a risk of deficiencies in these nutrients if a variety of plant-based foods are not taken, other animal products are not consumed, or other foods are not fortified, as suggested by Esselstyn et al. [60]. Particularly, in the case of protein, the scenario proposed in this study—a 33% beef consumption reduction and replacement with plant-based protein—could lower the RDA for protein by 11% if no other changes are made to the diet (see Figure 5).
However, it is worth noting that the local Nutrient Recommendations of the Ministry of Health [42] state that the RDA for protein should be 1.1 g of protein per kg of weight per day, which is surprisingly higher than the RDA for protein in the United States [63], Canada [64], and Brazil [65]. In these countries, this value corresponds to 0.8 g of protein per kg of weight per day. The nutritional value per 100 g of beef loin provided by the ICBF Colombian Food Composition Tables [44] corresponds to 36.1, which is also higher than the values in the United States (28.57 g) [48], Canada (28.79 g) [66], and Brazil (31.9 g) [67]. Moreover, the National Nutritional Guidelines [68] explicitly recommend that the population between 18 and 59 years of age should consume 99.5 g of protein per day for men, and 78.7 g for women, and suggest that approximately one third of a healthy meal should consist of animal products [68]. Thus, in order to meet a higher RDA, meat consumption is validated and promoted through official documents. Nonetheless, in order to improve citizens’ and the planet’s health, it has been argued that it is relevant to promote sustainable diets through national guidelines, which would require changes in policy frameworks regarding food production and consumption [13]. This study suggests that Colombia’s current nutritional guidelines [68] are unsustainable given that they ignore the environmental dimension of food consumption, making it important to include this key component of a sustainable diet [12].
How to achieve a reduction in meat consumption and replacement with plant-based alternatives in the country is yet to be discussed. The findings of de Boer et al. [52] uncover a positive attitude towards the “meatless days” in the Netherlands, especially when consumers have clear plant-based alternatives. This could be the case for some Colombian consumers, particularly if plant-based alternatives are available and coherent with the traditions and habits of the population. Nevertheless, for this to be achieved, a significant effort is required at the level of public policy, institutions, food systems, and consumer education.
In order to achieve the positive outcomes of meat consumption reduction, an enormous institutional effort must be made, focused on: Enabling a more varied, locally available, and nutritionally rich plant-based diet and guaranteeing access to it; consumer education regarding the nutritional value of plant-based foods; and a reassessment of the national dietary guidelines in order to acknowledge the three sustainability dimensions.
The present study had clear limitations; however, the findings show clear patterns and challenges that hinder Colombians from adopting sustainable diets. In the analysis performed for the environmental dimension, Colombia’s available information was limited; hence, it was necessary to use data available for Brazil, the U.S, and Canada. The data used was based on the averages provided by different sources; thus, the estimations included in this study were subject to uncertainties, which are difficult or impossible to quantify. Emissions from food loss and wastage were not included, and other environmental impacts, such as water pollution and biodiversity loss, were not calculated due to the lack of local information. In the health and nutrition dimension, only the most popular cuts and preparations of beef and poultry were considered. The exact relationship between meat consumption and chronic diseases in the country is not yet established. Additionally, social, economic, and animal welfare issues were not included in this project but could be explored in further research.
The findings of this study, as well as the framework used [31], open the path towards the exploration of socio-individual perceptions related to meat consumption reduction and replacement with plant-based alternatives. A further analysis of the social, health, economic, and environmental perceptions of consumers regarding the animal-based and plant-based options evaluated in the present study could provide a more integral approach to this issue.

5. Conclusions

This study explored the possibility of shifting towards a more sustainable diet by reducing meat consumption in an emerging economy, and sought to scientifically inform policy about the emerging challenges of meat consumption reduction, when considering the environmental and health spheres of this complex issue. By using a multidimensional approach, it was possible to uncover the local carbon and water impact, health, and nutritional implications of meat consumption, as well as the promoting forces and barriers for meat consumption reduction. Our findings show that reducing per capita beef consumption could reduce environmental impacts and represent health benefits. However, we identified some relevant barriers preventing this change, regarding the availability of plant-based protein sources in the country, the emergence of possible protein and nutrient deficiencies, and the recommendations by official documents and government entities about high animal-based protein consumption.

Author Contributions

Conceptualization, L.B.-M.; Methodology, L.B.-M.; Formal Analysis, L.B.-M.; Investigation, L.B.-M.; Writing—Original Draft Preparation, L.B.-M.; Writing—Review and Editing, L.B.-M., M.R.-M.; Supervision, M.R.-M.

Funding

This research received no external funding.

Acknowledgments

Part of this research was conducted in partial fulfillment of the Master in Liberal Arts degree of Laura Blanco-Murcia, through the Graduate Program in Sustainability at Harvard Extension School, Harvard University.

Conflicts of Interest

The authors declare no conflict of interest.

References

  1. Dixon, J.; Isaacs, B. Why Sustainable and “Nutritionally Correct” food is not on the agenda: Western Sydney, the Moral Arts of Everyday Life and Public Policy. Food Policy 2013, 43, 67–76. [Google Scholar] [CrossRef]
  2. Wyne, S.; Nicholas, K.A. The climate mitigation gap: Education and government recommendations miss the most effective individual actions. Environ. Res. Lett. 2017, 12, 1–7. [Google Scholar] [CrossRef]
  3. Vermeir, I.; Verbeke, W. Sustainable Food Consumption: Exploring the Consumer “Attitude—Behavioral Intention” Gap. J. Agric. Environ. Ethics 2006, 19, 169–194. [Google Scholar] [CrossRef]
  4. Mäkiniemi, J.P.; Vainio, A. Barriers to climate-friendly food choices among young adults in Finland. Appetite 2014, 74, 12–19. [Google Scholar] [CrossRef]
  5. Myers, S.; Bernstein, A. The coming health crisis: Indirect health effects of global climate change. F1000 Rep. Biol. 2011, 3, 1–5. [Google Scholar] [CrossRef]
  6. Paarlberg, R. Food Politics: What Everyone Needs to Know, 2nd ed.; Oxford University Press: New York, NY, USA, 2013; pp. 137–142. [Google Scholar]
  7. Godfray, C.J.; Aveyard, P.; Garnett, T.; Hall, J.W.; Key, T.J.; Lorimer, J.; Pierrehumbert, R.T.; Scarborough, P.; Springmann, M.; Jebb, S.A. Meat consumption, health, and the environment. Science 2018, 361, 1–10. [Google Scholar] [CrossRef]
  8. FAO. Livestock’s Long Shadow. Environmental Issues and Options. Available online: http://www.fao.org/3/a-a0701e.pdf (accessed on 16 September 2016).
  9. Clonan, A.; Roberts, K.; Holdsworth, M. Socioeconomic and demographic drivers of red and processed meat consumption: Implications for health and environmental sustainability. Proc. Nutr. Soc. 2016, 75, 367–373. [Google Scholar] [CrossRef]
  10. McAlpine, C.; Etter, A.; Fearnside, P.; Seabrook, L.; Laurance, W. Increasing world consumption of beef as a driver of regional and global change: A call policy action based on evidence from Queensland (Australia), Colombia and Brazil. Glob. Environ. Chang. 2009, 19, 21–33. [Google Scholar] [CrossRef]
  11. MinSalud. Estrategia Nacional Para La Prevención Y Control De Las Deficiencias De Micronutrientes En Colombia 2014–2021. Available online: https://www.minsalud.gov.co/sites/rid/Lists/BibliotecaDigital/RIDE/VS/PP/SNA/Estrategia-nacional-prevencion-control-deficiencia-micronutrientes.pdf (accessed on 28 November 2016).
  12. Johnston, J.; Fanzo, J.; Cogill, B. Understanding Sustainable Diets: A Descriptive Analysis of the Determinants and Processes That Influence Diets and Their Impact on Health, Food Security, and Environmental Sustainability. Adv. Nutr. 2014, 5, 418–429. [Google Scholar] [CrossRef]
  13. Lang, T. Sustainable Diets: Another hurdle or a better food future? Development 2015, 57, 240–256. [Google Scholar] [CrossRef]
  14. Paarlberg, R. Governing the dietary transition: Linking agriculture, nutrition and health. In Proceedings of the Leveraging Agriculture for Improving Nutrition and Health, New Dheli, India, 10–12 February 2011. [Google Scholar]
  15. UNEP. The Critical Role of Global Food Consumption Patterns in Achieving Sustainable Food Systems and Food for All. A UNEP Discussion Paper. Available online: http://www.unep.org/resourceefficiency/Portals/24147/scp/agri-food/pdf/Role_of_Global_Food_Consumption_Patterns_A_UNEP_Discussion_Paper.pdf. (accessed on 28 November 2016).
  16. IPCC. IPCC Fourth Assessment Report. Food, Fiber and Forest Products. Available online: http://www.ipcc.ch/pdf/assessment-report/ar4/wg2/ar4-wg2-chapter5.pdf. (accessed on 28 November 2016).
  17. World Watch Institute. Meat. Now It’s not Personal! World Watch: Washington, DC, USA, 2004; pp. 12–20. [Google Scholar]
  18. Machovina, B.; Feeley, K.; Ripple, W. Biodiversity conservation: The key is reducing meat consumption. Sci. Total Environ. 2015, 536, 419–431. [Google Scholar] [CrossRef] [PubMed]
  19. Micha, R.; Wallace, S.; Mozaffarian, D. Red and Processed Meat Consumption and Risk of Incident Coronary Heart Disease, Stroke, and Diabetes Mellitus. Circulation 2010, 121, 2271–2283. [Google Scholar] [CrossRef] [PubMed]
  20. Rohrmann, S.; Overvad, K.; Bueno-de-Mesquita, H.; Jakobsen, M.; Tjønneland, A.; Nailler, L.; Boutron-Ruault, M.C.; Clavel-Chapelon, F.; Krogh, V.; Palli, D.; et al. Meat consumption and mortality—results from the European Prospective Investigation into Cancer and Nutrition. BMC Med. 2013, 11, 1–12. [Google Scholar] [CrossRef] [PubMed]
  21. IARC. Q&A on the Carcinogenicity of the Consumption of Red Meat and Processed Meat. Available online: http://www.iarc.fr/en/media-centre/iarcnews/pdf/Monographs-Q&A_Vol114.pdf (accessed on 28 November 2016).
  22. Nestle, M. Animal v. Plant food in human diets and health: Is the historical record unequivocal? Proc. Nutr. Soc. 1999, 58, 211–218. [Google Scholar] [CrossRef]
  23. Grunert, K. Future trends and consumer lifestyles with regard to meat consumption. Meat Sci. 2006, 74, 149–160. [Google Scholar] [CrossRef] [PubMed]
  24. Van Wezemael, L.; Verbeke, W.; De Barcellos, M.; Scholderer, J.; Perez-Cueto, F. Consumer perceptions of beef healthiness: Results from a qualitative study in four European countries. BMC Public Health 2010, 10, 1–10. [Google Scholar] [CrossRef] [PubMed]
  25. Jimenez, C. Exploración Cualitativa de las Percepciones de Familias de estrato 5 de la Localidad de Chapinero—Bogota Frente a los Hábitos Alimentarios y Atributos de la Alimentación Saludable. Bachelor’s Thesis, Pontificia Universidad Javeriana, Bogotá, Colombia, 2008. [Google Scholar]
  26. DNP. La Clase Media Superó a los Pobres: DNP. Available online: https://www.dnp.gov.co/Paginas/La-clase-media-superó-a-los-pobres-DNP.aspx (accessed on 18 March 2018).
  27. MinSalud. Riesgo de Cáncer por Consumo de Carnes es Bajo en Colombia. Available online: https://www.minsalud.gov.co/Paginas/Riesgo-de-cáncer-por-consumo-de-carnes-es-bajo-en-Colombia.aspx (accessed on 28 November 2016).
  28. FEDEGAN. Estadísticas. Consumo. Consumo Aparente Per Cápita Anual. Available online: https://www.fedegan.org.co/estadisticas/consumo-0 (accessed on 2 August 2019).
  29. ICBF. Hoja de Balance de Alimentos Colombiana. Quatrenio 2009–2012. Available online: http://www.icbf.gov.co/portal/page/portal/PortalICBF/bienestar/nutricion/hoja-balance-alimentos/HOJA-BALANCE-ALIMENTOS-COLOMBIANA_2009-2012.pdf (accessed on 28 November 2016).
  30. ICBF. Encuesta Nacional de la Situación Nutricional en Colombia-ENSIN 2015. Available online: http://www.prosperidadsocial.gov.co/temporales/Encuesta%20Nacional%20de%20la%20Situacio%CC%81n%20Nutricional%20-%20ENSIN%202015.pdf (accessed on 26 July 2019).
  31. Schneider, K.; Hoffman, I. Nutrition Ecology- A Concept for Systemic Nutrition Research and Integrative Problem Solving. Ecol. Food Nutr. 2011, 50, 1–17. [Google Scholar] [CrossRef]
  32. ICBF. Encuesta Nacional de la Situación Nutricional en Colombia-ENSIN 2005. Available online: https://www.minsalud.gov.co/sites/rid/Lists/BibliotecaDigital/RIDE/VS/ED/GCFI/Ensin%202005.pdf (accessed on 28 November 2016).
  33. Hoekstra, A.; Mekonnen, M. A global assessment of the water footprint of farm animal products. Ecosystems 2012, 15, 401–415. [Google Scholar]
  34. EWG. Meat Eater’s Guide to Climate Change + Health. Report. Available online: http://static.ewg.org/reports/2011/meateaters/pdf/report_ewg_meat_eaters_guide_to_health_and_climate_2011.pdf?_ga=1.140185715.1739016234.1432737200 (accessed on 20 September 2016).
  35. EWG. Meat Eater’s Guide to Clomate Change + Health. Lifecycle Assesments: Methodology & Results. Available online: http://static.ewg.org/reports/2011/meateaters/pdf/methodology_ewg_meat_eaters_guide_to_health_and_climate_2011.pdf?_ga=1.25263101.1739016234.1432737200 (accessed on 20 September 2016).
  36. Cederberg, C.; Persson, U.; Neovius, K.; Molander, S.; Clift, R. Including Carbon Emissions from Deforestation in the Carbon Footprint of Brazilian Beef. Environ. Sci. Technol. 2011, 45, 1773–1779. [Google Scholar] [CrossRef]
  37. Weber, C.; Matthews, S. Food-Miles and the Relative Climate Impacts of Food Choices in the United States. Environ. Sci. Technol. 2008, 42, 3508–3513. [Google Scholar] [CrossRef]
  38. Contexto Ganadero. Colombia: Aumenta Importación de carne Bovina y Disminuye la de Lácteos. Available online: http://www.contextoganadero.com/internacional/colombia-aumenta-importacion-de-carne-bovina-y-disminuye-la-de-lacteos (accessed on 22 August 2016).
  39. FENAVI. Pollo en Cifras. En el 2017 Alcanzó una tasa de Crecimiento de 5,7%. Available online: https://fenavi.org/centro-de-noticias/noticia-destacada-del-centro-de-noticias/pollo-en-cifras/ (accessed on 1 August 2019).
  40. FENALCE. Indicadores Cerealistas 2018. Available online: https://www.fenalce.org/archivos/indicerealista2018.pdf (accessed on 24 July 2019).
  41. ICBF. Tabla de Composición de Alimentos Colombianos 2018. Available online: https://www.icbf.gov.co/sites/default/files/tcac_web.pdf (accessed on 24 July 2019).
  42. MinSalud. Resolución Número 003803 De 2016 por la cual se establecen las Recomendaciones de Ingesta de Energía y Nutrientes—RIEN para la Población Colombiana y se Dictan Otras Disposiciones. Available online: https://www.minsalud.gov.co/Normatividad_Nuevo/Resoluci%C3%B3n%203803%20de%202016.pdf (accessed on 26 August 2019).
  43. Contexto Ganadero. Los Cortes de Carne que Prefieren comer los Colombianos. Available online: http://contextoganadero.com/ganaderia-sostenible/los-cortes-de-carne-que-prefieren-comer-los-colombianos (accessed on 14 October 2016).
  44. DANE. La estruCtura de Producción de Carne Bovina en Colombia. Available online: https://www.dane.gov.co/files/investigaciones/agropecuario/sipsa/insumos_factores_de_produccion_octubre_2012.pdf (accessed on 14 October 2016).
  45. FENAVI. Estadísticas del Sector. Producción. Available online: https://fenavi.org/estadisticas/informacion-estadistica-publica/#1538603199806-853cda82-87c8 (accessed on 24 July 2019).
  46. Hoekstra, A.; Mekonnen, M. The green, blue and grey water footprint of crops and derived crop products. Hydrol. Earth Syst. Sci. 2011, 15, 1577–1600. [Google Scholar]
  47. Banco De La República. Determinantes del Desarrollo en la Avicultura en Colombia: Instituciones, Organizaciones y Tecnología. Available online: https://www.banrep.gov.co/es/dtser-214 (accessed on 20 October 2016).
  48. USDA. USDA Food Composition Databases. 2016. Available online: https://ndb.nal.usda.gov/ndb/search/list (accessed on 28 November 2016).
  49. National Academies of Medicine. Dietary Reference Intakes for Energy, Carbohydrate, Fiber, Fat, Fatty Acids, Cholesterol, Protein, and Amino Acids (Macronutrients). Available online: http://nationalacademies.org/hmd/~/media/Files/Activity%20Files/Nutrition/DRI-Tables/8_Macronutrient%20Summary.pdf?la=en (accessed on 2 September 2019).
  50. Chang, A.; Lazo, M.; Appel, L.; Gutiérrez, O.; Grams, M. High dietary phosphorus intake is associated with all-cause mortality: Results from NHANES III. Am. J. Clin. Nutr. 2014, 99, 320–327. [Google Scholar] [CrossRef] [PubMed]
  51. Tobler, C.; Visschers, V.; Siegrist, M. Eating Green. Consumers’ Willingness to Adopt Ecological Food Consumption Behaviors. Appetite 2011, 57, 674–682. [Google Scholar] [CrossRef] [PubMed]
  52. De Boer, J.; Schösler, H.; Aiking, H. ‘‘Meatless days’’ or ‘‘less but better’’? Exploring strategies to adapt Western meat consumption to health and sustainability challenges. Appetite 2014, 76, 120–128. [Google Scholar] [CrossRef] [PubMed]
  53. Springmann, M.; Wiebe, K.; Mason-D’Croz, D.; Sulser, T.; Rayner, M.; Scarborough, P. Health and nutritional aspects of sustainable diet strategies and their association with environmental impacts: A global modelling analysis with country-level detail. Lancet Planet Health 2018, 2, 451–461. [Google Scholar] [CrossRef]
  54. Auestad, N.; Fulgoni, V. What Current Literature Tells Us about Sustainable Diets: Emerging Research Linking Dietary Patterns, Environmental Sustainability, and Economics. Adv. Nutr. 2015, 6, 19–36. [Google Scholar] [CrossRef]
  55. Jungbluth, N.; Tietje, O.; Scholz, R. Food purchases: Impacts from the consumers’ point of view investigated with a modular LCA. Int. J. Life Cycle Assess. 2000, 5, 134–142. [Google Scholar] [CrossRef]
  56. Smil, V. Worldwide transformation of diets, burdens of meat production and opportunities for novel food proteins. Enzym. Microb. Technol. 2002, 30, 305–311. [Google Scholar] [CrossRef]
  57. CRA. Rango de Consumo Básico. Available online: http://www.cra.gov.co/documents/Documento_de_Trabajo_y_Participacion_Ciudadana_750.pdf (accessed on 28 November 2016).
  58. EPA. Greenhouse Gas Emissions from a Typical Passenger Vehicle. Available online: https://www.epa.gov/greenvehicles/greenhouse-gas-emissions-typical-passenger-vehicle (accessed on 28 November 2016).
  59. MinSalud. Enfermedades cardiovasculares. Principales Causas de Mortalidad en Colombia. Available online: https://www.minsalud.gov.co/salud/Paginas/Enfermedades-cardiovasculares.aspx (accessed on 28 November 2016).
  60. Esselstyn, C.; Gendy, G.; Doyle, J.; Golubic, M.; Roizen, M. A way to reverse CAD? J. Fam. Pract. 2014, 63, 356–364. [Google Scholar]
  61. Crowe, F.; Appleby, P.; Travis, R.; Key, T. Risk of hospitalization or death from ischemic heart disease among British vegetarians and non-vegetarians: Results from the EPIC-Oxford cohort study. Am. J. Clin. Nutr. 2013, 97, 597–603. [Google Scholar] [CrossRef]
  62. Clonan, A.; Wilson, P.; Swift, J.A.; Leibovici, D.G. Red and processed meat consumption and purchasing behaviours and attitudes: Impacts for human health, animal welfare and environmental sustainability. Public Health Nutr. 2015, 18, 2446–2456. [Google Scholar] [CrossRef] [PubMed] [Green Version]
  63. Institute of Medicine of the National Academies. Dietary Referece Intakes. The Essential Guide to Nutrient Requirements. Available online: https://www.nal.usda.gov/sites/default/files/fnic_uploads/DRIEssentialGuideNutReq.pdf (accessed on 2 September 2019).
  64. Government of Canada. Dietary Reference Intakes Tables 2010. Available online: https://www.canada.ca/en/health-canada/services/food-nutrition/healthy-eating/dietary-reference-intakes/tables.html (accessed on 2 September 2019).
  65. ANVISA. Regulamento Técnico Sobre a Ingestão Diária Recomendada (idr) de Proteína, Vitaminas e mineRais. Available online: http://portal.anvisa.gov.br/documents/33916/394219/RDC_269_2005.pdf/2e95553c-a482-45c3-bdd1-f96162d607b3 (accessed on 2 September 2019).
  66. Government of Canada. Canadian Nutrient File (CNF)—Search by Food 2018. Available online: https://food-nutrition.canada.ca/cnf-fce/newSearch-nouvelleRecherche.do?action=new_nouveau (accessed on 2 September 2019).
  67. NEPA & UNICAMP. Tabela Brasileira de Composição de Alimentos—TACO. Available online: http://www.cfn.org.br/wp-content/uploads/2017/03/taco_4_edicao_ampliada_e_revisada.pdf (accessed on 2 September 2019).
  68. ICBF & FAO. Guías Alimentarias Basadas en Alimentos Para la Población Colombiana Mayor de 2 años. Available online: https://www.minsalud.gov.co/sites/rid/Lists/BibliotecaDigital/RIDE/VS/PP/SNA/guias-alimentarias-basadas-en-alimentos.pdf (accessed on 26 August 2019).
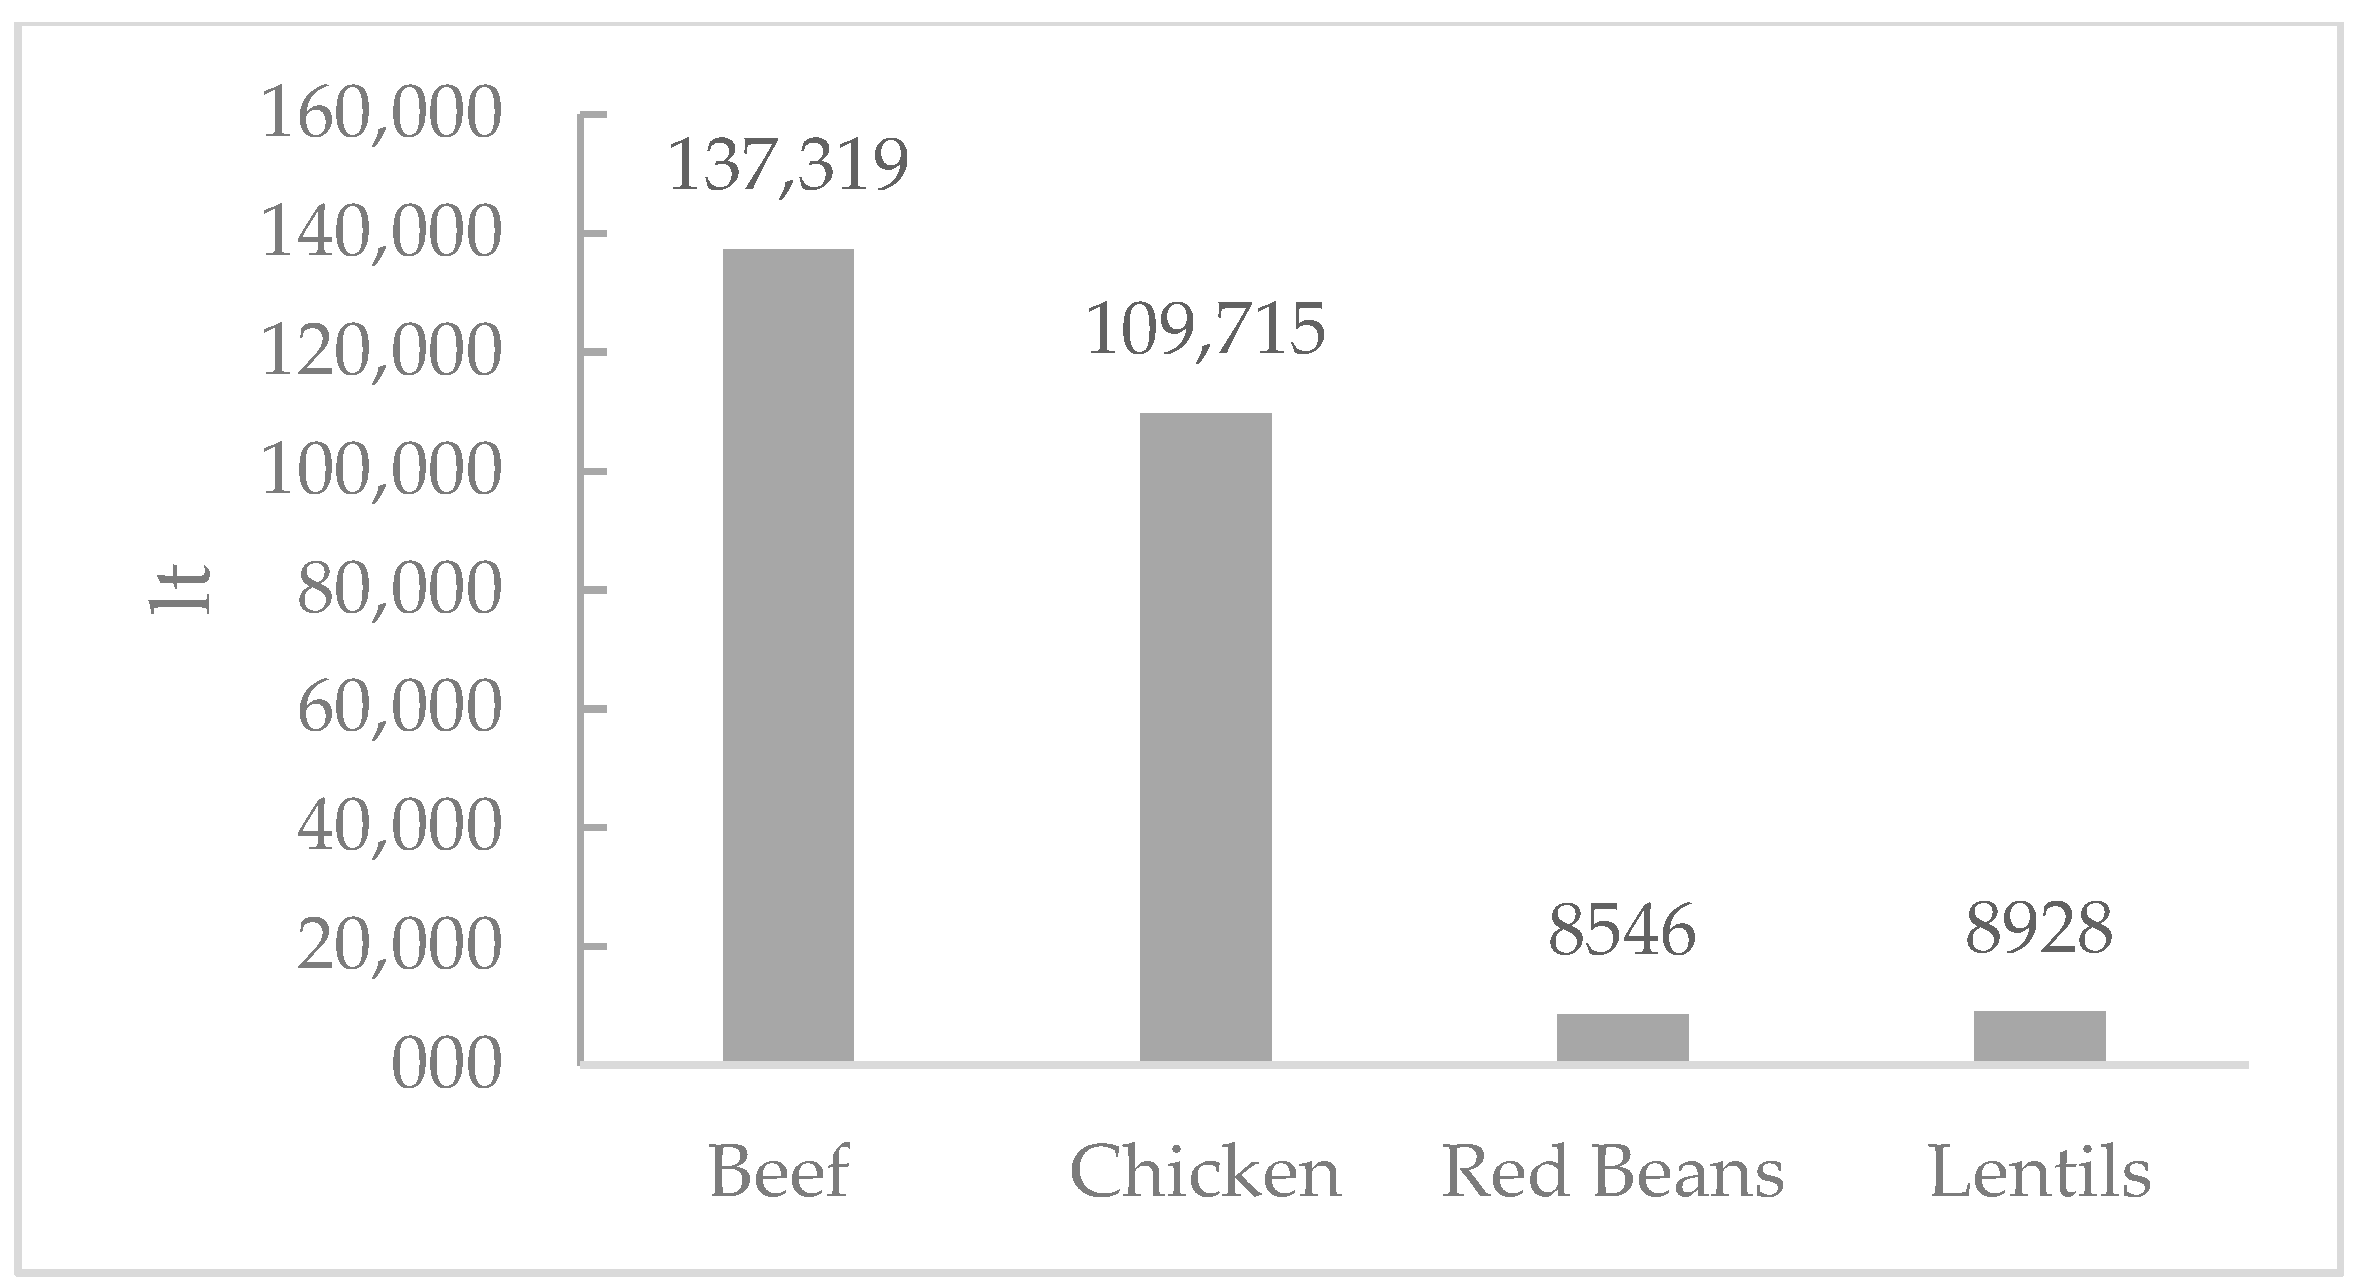
Figure 1. Approximate annual water footprint per capita per product in Colombia (lt).
Sustainability 11 06595 g001
Figure 2. Approximate annual carbon footprint per capita per product in Colombia (kg of CO2eq).
Sustainability 11 06595 g002
Figure 3. Percent of the dietary reference intakes based on the average per capita daily consumption per product.
Sustainability 11 06595 g003
Figure 4. Promoting forces and barriers for meat consumption reduction in Colombia.
Sustainability 11 06595 g004
Figure 5. Percent of the dietary reference intakes based on a 33% meat consumption reduction and replacement with plant-based alternatives.
Sustainability 11 06595 g005
Table 1. Significant differences among the values per nutrient.
Nutrient.UnitFood TypeNutritional Value per 100g (ICBF, 2018)p-Value*
BeefChickenRed BeansLentils
ProteingBeef36.1
Chicken28.40.3108
Red beans8.10.0041980.0004106
Lentils7.70.0028030.00029241
Total fatgBeef7.9
Chicken30.2244
Red beans0.60.027220.4565
Lentils0.50.024060.41861
CholesterolmgBeef90
Chicken770.3529
Red beans00.00000.0000
Lentils00.00000.0000NA
CarbohydratesgBeef0.5
Chicken0.31
Red beans26.90.00017570.0001286
Lentils18.50.041380.030780.2116
Dietary fibergBeef0
Chicken0NA
Red beans7.60.014650.01465
Lentils6.50.028290.028290.978
CalciummgBeef5
Chicken130.09894
Red beans460.000021210.03091
Lentils140.0664410.06263
IronmgBeef3.1
Chicken0.90.5485
Red beans2.110.9081
Lentils1.70.855111
MagnesiummgBeef26
Chicken251
Red beans520.0046370.003041
Lentils210.55950.65820.000445
PhosphorusmgBeef202
Chicken1650.05998
Red beans1390.00077840.1513
Lentils980.0000026620.046530.009327
PotassiummgBeef334
Chicken2200.001528
Red beans4420.00011880.0000
Lentils2040.000025610.46590.0000
SodiummgBeef48
Chicken630.1838
Red beans10.000000049570.00000000002417
Lentils60.000024030.000000015540.1306
ZincmgBeef6.2
Chicken10.1175
Red beans10.11751
Lentils1.10.129111
Vitamin CmgBeef0
Chicken0NA
Red beans111
Lentils30.24820.24820.6171
Thiamin (Vitamin B1)mgBeef0.07
Chicken0.051
Red beans0.2111
Lentils0.28111
Riboflavin (Vitamin B2)mgBeef0.24
Chicken0.121
Red beans0.0611
Lentils0.07111
Niacin (Vitamin B3)mgBeef4.3
Chicken8.50.3711
Red beans0.40.1810.01731
Lentils10.31780.034951
Folate (Vitamin B9)μgBeef9
Chicken30.1489
Red beans1720.00000.0000
Lentils330.00038670.0013420.0000
Vitamin B12μgBeef2.74
Chicken0.230.3809
Red beans00.29321
Lentils00.29321NA
Vitamin A RAEμgBeef0
Chicken60.04123
Red beans0NA0.04123
Lentils50.0736410.07364
*p-values were analyzed using a two proportion Z-test; 95% CI
Table 2. Local carbon and water per capita footprints for beef, poultry, red beans, and lentils.
Per Capita ConsumptionBeefChickenRed BeansLentils
Average per capita consumption in kg in 2018 (FEDEGAN. 2019; FENALCE. 2018)18.2033.803.201.52
Water FootprintBeefChickenRed BeansLentils
Water footprint of products (lt/kg) (Hoekstra & Mekonnen. 2011 & 2012)7545324626715874
Approx annual water footprint per capita per product - Colombia (lt)137,319109,71585468928
Carbon FootprintBeef-Without LUCBeef-With LUCChickenRed BeansLentils
Production emissions (kg CO2e per kg prod) (Cederberg. et al. 2011; EWG. 2011b)28443.580.700.37
Post-farmgate emissions (kg CO2e per kg prod) (EWG. 2011b)3.723.301.300.53
Additional post-farmgate emissions - Shipping Int.Water Container (kg CO2e per kg prod)(Weber & Mathews. 2008)00000.10
Total Carbon Footprint - production and post farmgate emissions (kg CO2e per kg prod)31.7247.726.8821
Approx annual carbon footprint per capita per product in Colombia (kg CO2 eq)577.30868.50232.546.401.52
Additional post-farmgate emissions - Shipping Int.Water Container
Product - Shipping routeShipping KmShipping emissions (t CO2e/t-km)(Weber & Mathews. 2008)Carbon Footprint (tons of CO2e per ton prod)Carbon Footprint (kg of CO2e per kg prod)
Lentils - Vancouver/Cartagena81020.0000140.1134280.113428
Lentils - Montreal/Cartagena55710.0000140.0779940.077994
Lentils - Vancouver/Buenaventura77510.0000140.1085140.108514
Average Carbon Footprint 0.10
Table 3. Comparison of the nutritional value of beef, poultry, red beans, and lentils.
Nutritional Value per 100g (ICBF, 2018)Dietary Reference Intakes (Ministry of Health, 2016)Percentage of the Dietary Reference Intakes (Ministry of Health, 2016) Based on the Average per Capita Daily Consumption in Colombia of Nutrients from Each Food Source
Energy & NutrientsUnitBeef (Boneless Loin Steak)Poultry (Boneless, Skinless Breast)Red BeansLentilsBeef (Boneless Loin Steak)Poultry (Boneless, Skinless Breast)Red BeansLentils
Energykcal21814116112225754%5%1%0%
Proteing36.128.48.17.772.1525%36%1%0.4%
Total fatg7.930.60.53511%8%0%0%
Saturated fatty acidsg3.40.8N/AN/A1017%7%
Monounsaturated fatty acidsg3.31N/AN/AN/A
Polyunsaturated fatty acidsg0.50.7N/AN/A1.221%54%
Cholesterolmg90770030015%24%0%0%
Carbohydrateg0.50.326.918.51300.19%0.21%1.8%0.6%
Dietary fiberg007.66.531.50%0%2.1%0.9%
Calciummg513461410000%1%0%0%
Ironmg3.10.92.11.7208%4%1%0%
Magnesiummg26255221362.54%6%1%0%
Phosphorusmg2021651399870014%22%1.8%0.6%
Potassiummg33422044220447004%4%1%0%
Sodiummg48631615002%4%0%0%
Zincmg6.2111.11128%8%1%0%
Vitamin Cmg001382.50%0%0%0%
Thiamin (Vitamin B1)mg0.070.050.210.281.153%4%2%1%
Riboflavin (Vitamin B2)mg0.240.120.060.071.210%9%0%0%
Niacin (Vitamin B3)mg4.38.50.411514%52%0%0%
Folate (Vitamin B9)μg93172334001%1%4%0%
Vitamin B12μg2.740.23002.457%9%0%0%
Vitamin A RAEμg06058000%0.7%0%0%
Table 4. Replacing 6.1 kg of beef per person per year (approximately one portion of beef per week for a year) with other alternatives.
ChickenRed BeansLentils
Net water savings per person per year (lt)25,62329,1139682
Net carbon savings (Not Including LUC) per person per year (kg CO2eq)149178184
Net carbon savings (Including LUC) per person per year (kg CO2eq)245274281