Article

Enhancing Rice Production by Potassium Management: Recommended Reasonable Fertilization Strategies in Different Inherent Soil Productivity Levels for a Sustainable Rice Production System

1
College of Life Science, Yan’an University, Yan’an, Shaanxi 716000, China
2
College of Land and Environmental, Shenyang Agriculture University, Shenyang 110866, China
*
Authors to whom correspondence should be addressed.
Sustainability 2019, 11(22), 6522; https://doi.org/10.3390/su11226522
Submission received: 7 October 2019 / Revised: 24 October 2019 / Accepted: 13 November 2019 / Published: 19 November 2019
(This article belongs to the Special Issue Suitable Agronomic Techniques for Sustainable Agriculture)

Abstract

:
Enhancing agricultural productivity with the minimum possible cost to the environment is crucial for sustainable agriculture development. The effective management of K fertilizer would reduce the pollution risk of fertilizer residue. The data from the 29 experimental sites for rice in Liaoning province were used to determine the effect of different K fertilizer management in increasing yield, K uptake, and potassium fertilizer contribution rates (FCRK) for rice. The relationship among rice yield, biomass accumulation and plant K uptake, and recommended reasonable K fertilizer application rates in different inherent soil productivity levels were evaluated. The four treatments comprised no K fertilizer (K0), K fertilizer application of 60 kg ha−1 (K60), 120 kg ha−1 (K120), and 180 kg ha−1 (K180). The K120 treatment showed a significant yield increase (16.59%) compared to the K0 treatment in this study. The average K uptake of grain in the K60, K120 and K180 treatments was 23.1, 24.8 and 24.9 kg ha−1, which was significantly higher by 12.67%, 20.77%, and 21.48% compared to the K0 treatment. The average K uptake of grain, straw and plant was highest in K180 (134.8 kg ha−1), followed by the K120 and K60. Additionally, the correlation between grain yield, biomass accumulation (y) and plant K uptake (x) showed a significant positive polynomial function. The equation was y = −0.406x2 + 110.43x + 639.3 and y = −0.237x2 + 135.3x + 3796.2, respectively. The FCRK followed the sequence as K180 < K60 < K120. Furthermore, the recommended K application rates in the 29 experimental sites were ranged from 92.8 to 134.5 kg ha−1, and the corresponding theoretical yield of recommended K rate were ranged from 7371.5 to 11144.5, and with an average of 9297.5 kg ha−1. Remarkably, the average recommended K rate in the four inherent soil productivity levels was 116.1, 111.2, 112.2 and 111.7 kg ha−1 and the corresponding average theoretical yield was 9966.1 kg ha−1, 10158.8 kg ha−1, 8373.2 kg ha−1 and 8881.9 kg ha−1. The results of this study suggest that different inherent soil productivity levels have different K application rates and yield performance. This result somewhat strengthens the finding of this study that moderate K application is conducive to effectively improving the yield and to the enhancement of agricultural productivity, which is conducive to the sustainable environment.

1. Introduction

Rice (Oryza sativa L.) is one of the most important staple food crops, providing more than approximately 21% of the calorific intake for the global population [1,2]. Particularly in China, rice is extensively cultivated and forms the primary food crop for more than 60% of the population [3,4]. To satisfy the demands on food due to both population growth and diet diversity, production improvement is an urgent issue. Rice yield is predicted to double by 2030 [5].
Maintaining yield has accordingly become one of the vital targets in many countries over the past several decades. However, it is difficult to extend the arable area conductive to rice production because appropriate planting land has already been occupied by urban construction [6,7]. Further improvements in rice production must be achieved by many factors, including rice management techniques, site-specific fertilizer application [8], irrigation [9], and varieties. Although some of these agronomic techniques, innovations, or genetic variety improvements achieved the above purposes, fertilizer inputs could even further significantly increase production [5]. Although rice yield in China has presented dramatic growth in the last fifty years, excessive or insufficient fertilizer input has been one of the key problems confronting rice production [10,11]. A particular example is imbalanced fertilization, which has caused low fertilizer use efficiency and negative environmental problems, such as soil acidification [12,13], water eutrophication [14], and greenhouse gas emissions [15]. To maintain yield while preventing environmental damage, it is necessary to ensure the application of balanced fertilizer.
Potassium, as one of the most major macronutrients, is involved in a series of plant physiological and biochemical processes, the driving of plant development, enhancement of defense, stomatal regulation and signal transduction, and is, therefore, vital for producing high-yield and high-quality rice [16,17]. Although the earth’s crust has enough potassium, it is extremely difficult to obtain adequate K immediately from the soil [18]. Therefore, K fertilizer is the primary way to solving K deficiency in plants or soil. However, nitrogen (N) and phosphorus (P) fertilizers have received more attention compared to K fertilizer [19], because farmers often deem that N and P fertilizer increase yield more rapidly, and they, therefore, tend to neglect the economic value of K fertilizers [20,21]. Numerous studies have demonstrated that negative soil K status is widespread across some crop-producing regions in China due to a lack of sufficient nutrient recycling [22].
In view of the current situation, better K fertilizer management is one of the crucial factors that could facilitate rice production toward sustainable agricultural development, such as with K fertilizer recommendation. To date, most recommendation dosages have been based on small-scale field experiments, and few studies have focused on how these fertilizer recommendations can guide large-scale regional rice planting, especially in the different inherent soil productivity levels. To the best of our knowledge, no one has reported on the quantitative effects of these fertilizer recommendations on rice yield or their use efficiency at the provincial level, especially in the Liaoning province of China. Therefore, the objectives of this work were to (i) quantify the regional levels effect of these K fertilizer application on increasing yield, plant K uptake, and potassium contribute rate (FCRK). (ii) Evaluate the correlation among grain yield, biomass accumulation and plant K uptake across 29 experiment sites; (iii) recommend K application rates in different inherent soil productivity levels.

2. Materials and Methods

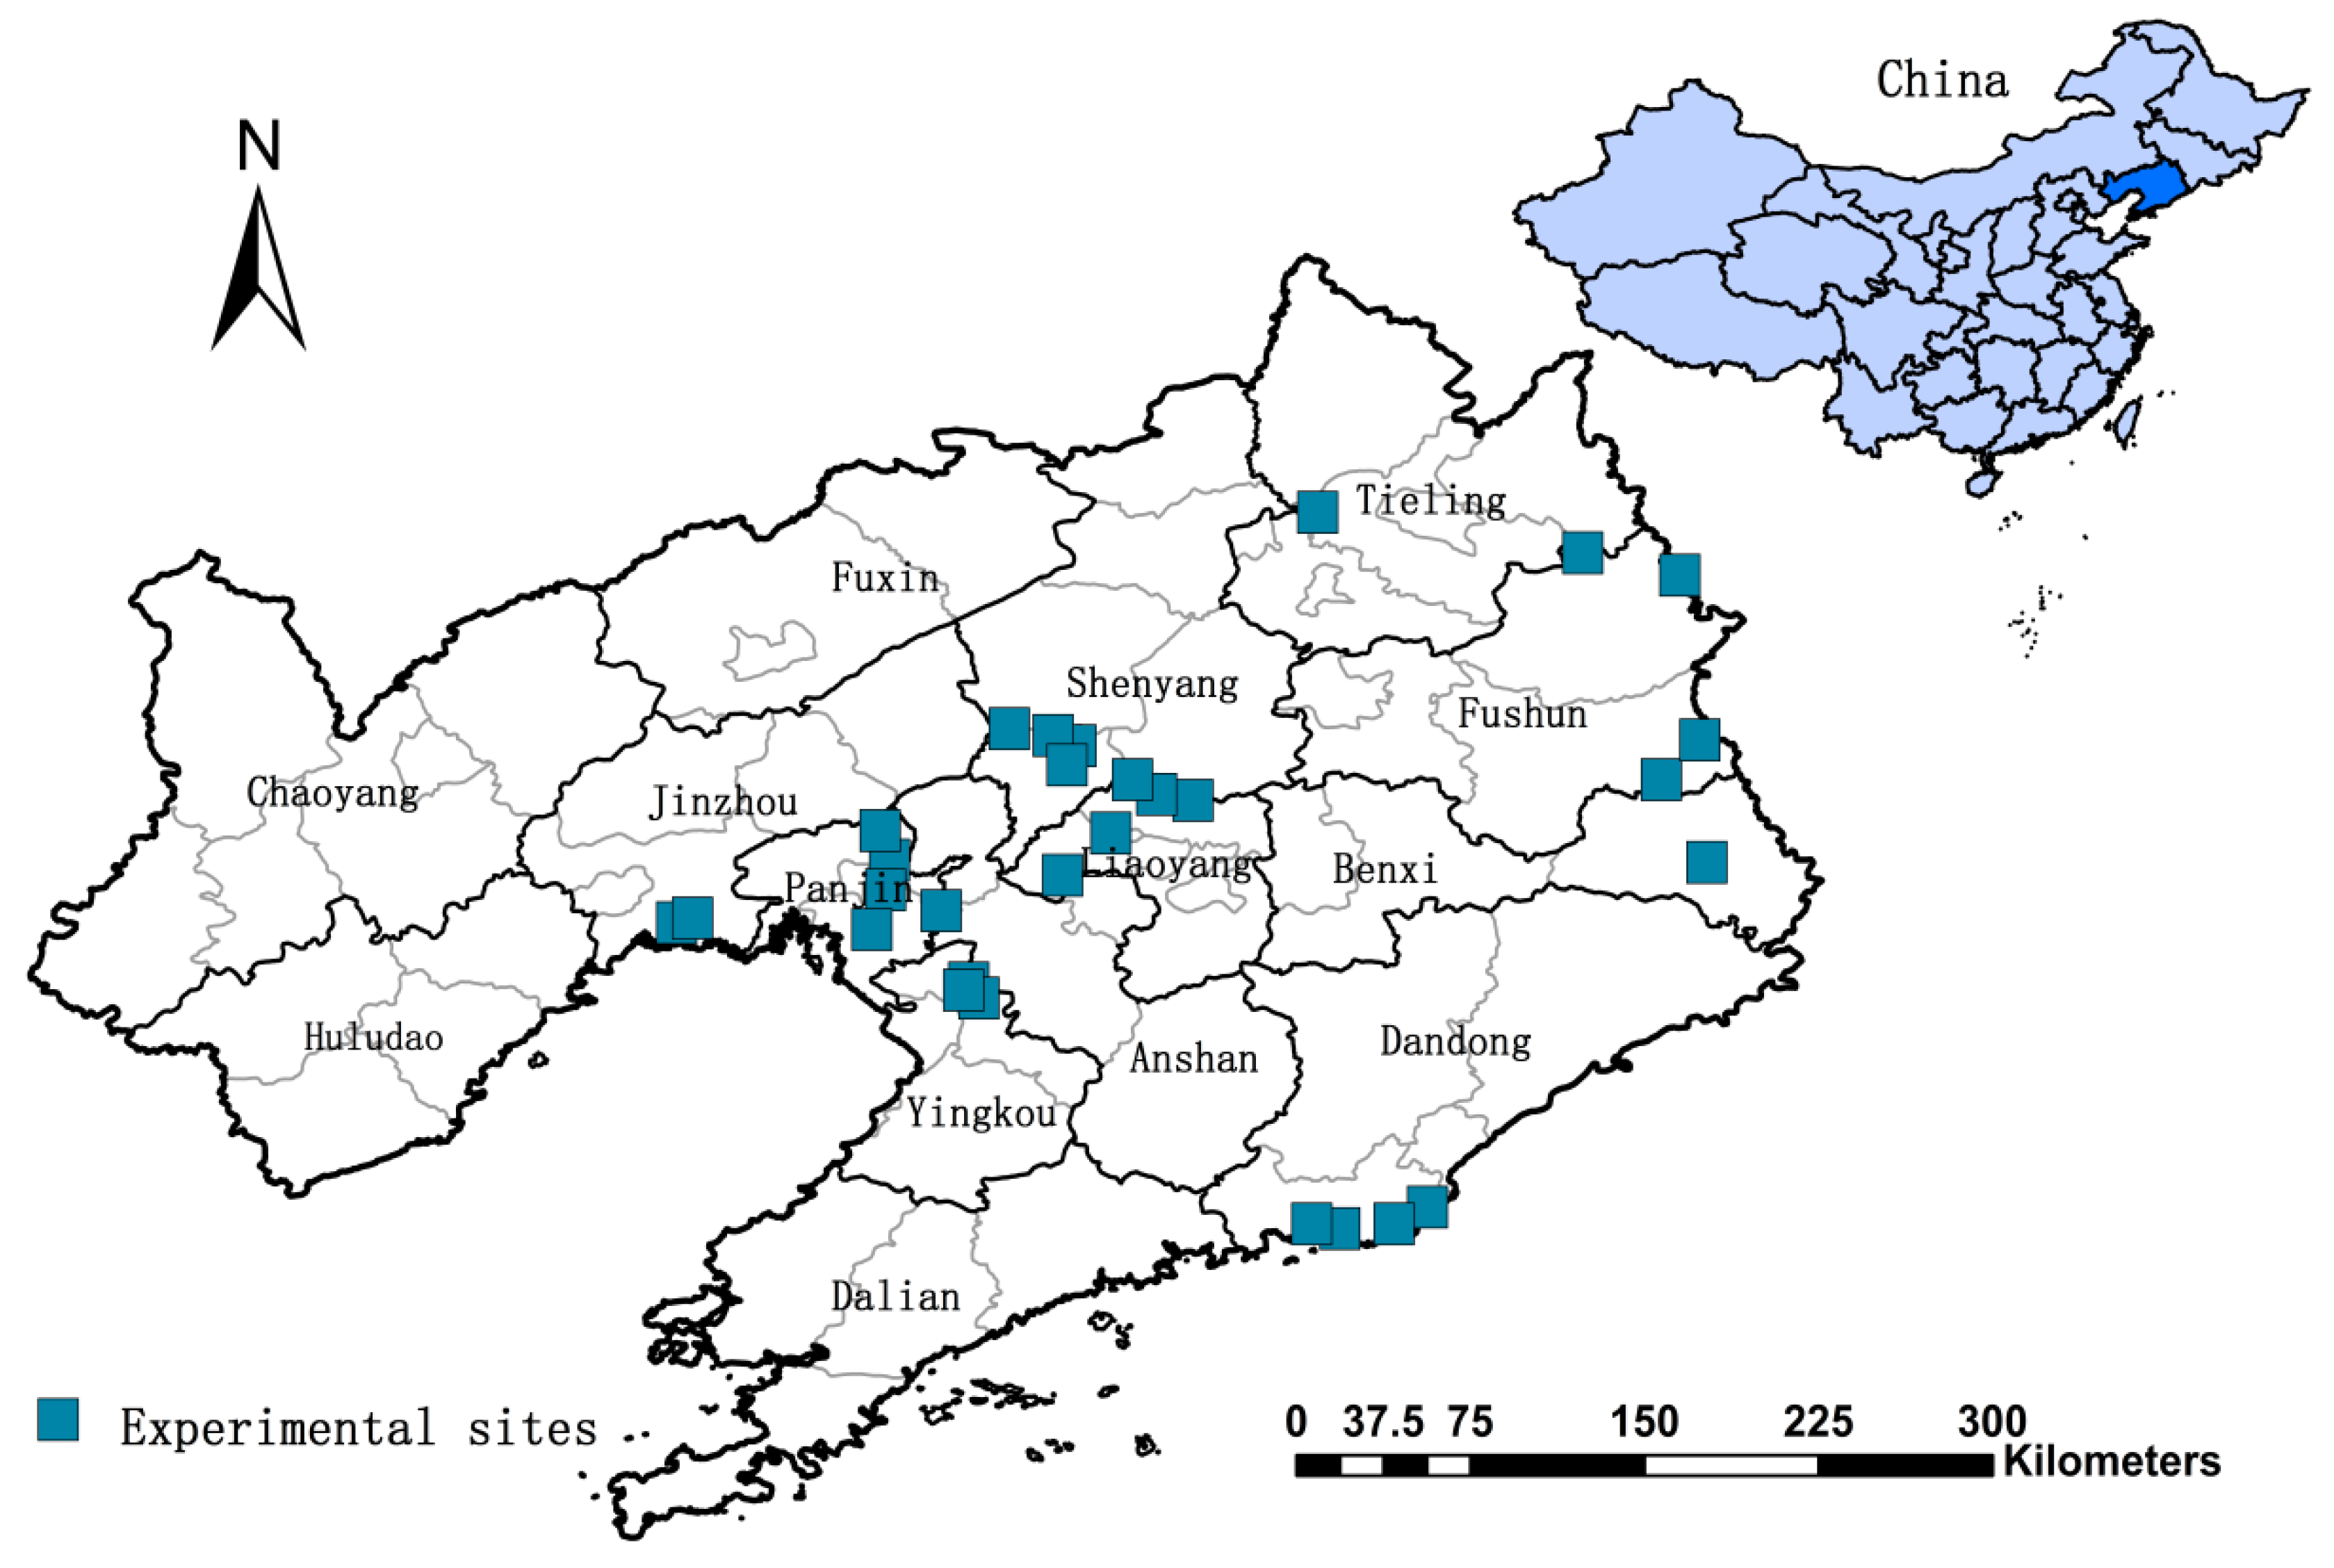
2.1. Data Source and Site Description

In this study, we focused on field experiments with multiple experimental sites because farming impacts on crop production were stable and credible only at 5 experimental sites. Thus, the data were obtained from the field experiments performed at 29 experimental sites in the main rice producing region of Liaoning province in during the period 2007–2012.
In Liaoning province, 29 field sites were located in the latitude range 38°43′N–43°26′N and the longitude range 118°53′E–125°46′E, China (Figure 1). Liaoning province has become one of the major rice-producing regions in China, with 2691,980 of hectares planted in 2017. The region is characterized by a temperature zone with a continental monsoon climate. In the rice growing season (early-June to mid-October), the average annual temperature of 21.3 ℃ means that there is monthly sunshine of 218 h, and the annual average precipitation is 546.1 mm.
The soil type at all of the experimental sites was classified as typic Hapli–Stagnic Anthrosols (USDA soil system). The soil samples from the plow layer (0–20 cm) prior to the experiment had the following characteristics: soil pH (using 1:2.5 soil: water suspension) 5.7 (5.2–6.7), soil organic carbon (SOC) 10.3 g kg−1 (5.9–16.8 g kg−1), total nitrogen (TN) 0.78 g kg−1 (0.54–1.34 g kg−1), alkaline hydrolyze nitrogen (AN) 103.14 mg kg−1 (48.17–192 mg kg−1); available phosphorus 12.85 mg kg−1 (5.56–31.82 mg kg−1) and available potassium 110.5 mg kg−1 (79.4–141.54 mg kg−1).

2.2. Experimental Design and Management

Data were obtained from the 29 field experiments conducted by the Project of Soil Testing and Fertilization Recommendation, and four treatments were chosen from a total of 14 fertilization treatments at each site. The four treatments comprised: no K fertilizer (K0), K fertilizer application of 60 kg ha−1 (K60), 120 kg ha−1 (K120), and 180 kg ha−1 (K180). The annual amount of N and P fertilizer application rates were kept identical for each treatment: 195 kg N ha−1 and 90 kg P ha−1. The experimental design was laid out in a completely randomized block with three replications. Nitrogen fertilizer was applied three times: approximately 50% nitrogen (as urea), all P (as calcium superphosphate) and K fertilizer (as potassium chloride). Before rice sowing, basal fertilizers and 25% nitrogen fertilizers were applied at the jointing stage, and the remaining 25% nitrogen fertilizer was applied at the booting stage. Plant density was according to the recommendation of a local agricultural extension agency. All sites were managed in accordance with local farming practices. The spraying of pesticides, fungicides, and herbicides was managed during the crop growing season by depending upon local traditional farming practices.

2.3. Measurements

The main recorded phenological stages were based on the plant growth characteristics for each field plot. The grain yield was harvested manually from a quadrat area of 1 × 1 m2 in the middle rows of each field during the harvest season. The collected aboveground plant materials were separated into grain and straw, before being dried, threshed, and oven-dried at 105 °C for 30 min and then at 75 °C until the constant weight was recorded with a uniform moisture content of 13.5%. The plant materials were ground to pass through a 0.5 mm mesh sieve and digested with H2SO4 and H2O2. The total K concentration of the digested samples was measured using the flame spectrophotometer method.

2.4. Caculation

Fertilizer contribution rates for K (FCRK) under the varying K fertilization treatment was calculated as follows:
F C R K = Grain   yield   with   K   fertilization Grain   yield   with   no   K   fertilization Grain   yield   with   K   fertilization  

2.5. Fertilizer Recommendation in Inherent Soil Productivity Levels

The flow diagram of this study (based on the quadratic model) is shown in Figure 2. The selected quadratic models were used for K fertilizer recommendation, particularly in the different inherent soil productivity levels (L1, L2, L3 and L4). The inherent soil productivity levels were in accordance with the relationship between rice yields in the case of no K application and rice yields in the case of K application at a rate of 120 kg ha−1, and divided into four inherent soil productivity levels.

Fertilizer Recommendation Used by the Quadratic Regression Model

In this study, the quadratic regression model was used to establish the relationship between grain yield (y) and fertilizer application rates (x), and also, to calculate the optimal fertilizer application rates.
Y = a + bx + cx2
where Y represents the grain yield (kg/ha), x represents the fertilizer application, a is the basis grain yield (kg/ha), b is the coefficient, and c is quadratic regression coefficient.

2.6. Statistical Analysis

The SPSS 16 (SPSS, Inc. Chicago, IL, USA) statistics software was used to perform descriptive statistical analysis. Descriptive statistical analyses were performed to evaluate the mean, variability and standard deviation (SD) of the parameters. The difference of increasing yield, K uptake, and potassium fertilizer contribution rates (FCRK) between all treatments was analyzed using analysis of variance (ANOVA) with the least significant difference (LSD) test at the 5% probability level (P ≤ 0.05). The figures were made using Origin pro 2018 software packages.

3. Results and Discussion

3.1. Increasing Yield to Applied K Levels

Across the 29 experimental sites, there was significant influence by K fertilization treatments on the rice grain yield (Figure 3). The average yield with K0 treatment was 7155.5 kg ha−1, and ranged from 4050 to 9111.3 kg ha−1, respectively (Figure 3). The highest yield consistently achieved in the K120 treatment during the experimental period (with an average of 8342.6 kg ha−1) ranged from 6305 to 10021.4 kg ha−1, which was 522–2303.8 kg ha−1 higher than that obtained with the K0 treatments. (Figure 3). In contrast, the lower yield increase in both years was markedly observed in the K60 and K180 treatment, which increased the grain yield by an average of 617.9 kg ha−1 and 557.2 kg ha−1, relative to K0, respectively (Figure 3). Overall, the average yield increase for rice of the K60, K120, and K180 treatments, in both years, was higher by 8.64%, 16.59% and 7.79% compared to the K0 treatment. This indicated that a balanced K application of 120 kg ha−1 (K120) was preponderant. The impact of K fertilizers on the increasing yield followed the sequence K120 > K60 > K180 > K0. Zhang et al. [23] also reported similar results, when they conducted a case study on rice in the Hubei province of China, and found that 21.91% of the highest increasing yield was attributed to 120 kg K2O ha−1, and followed by 60 and 180 kg K2O ha−1.
In our study, the average grain yield in all K application treatments was considerably higher than the average yield in worldwide (4294 kg ha−1) and China (6498 kg ha−1) during the period 2006–2011 [24]. The variation in grain increase observed in our research was large because of the differences in the effective use of K fertilizers. Furthermore, the average rice yield in the K120 treatment in our study was increased by 9.77% compared with that observed by Xu et al. [25] in Northeast China (7600 kg ha−1) during 2000–2011, which indicates that 120 kg ha−1 rate of K application could improve grain yield to a greater extent than both other rates of K application and farmers’ traditional fertilization practices.

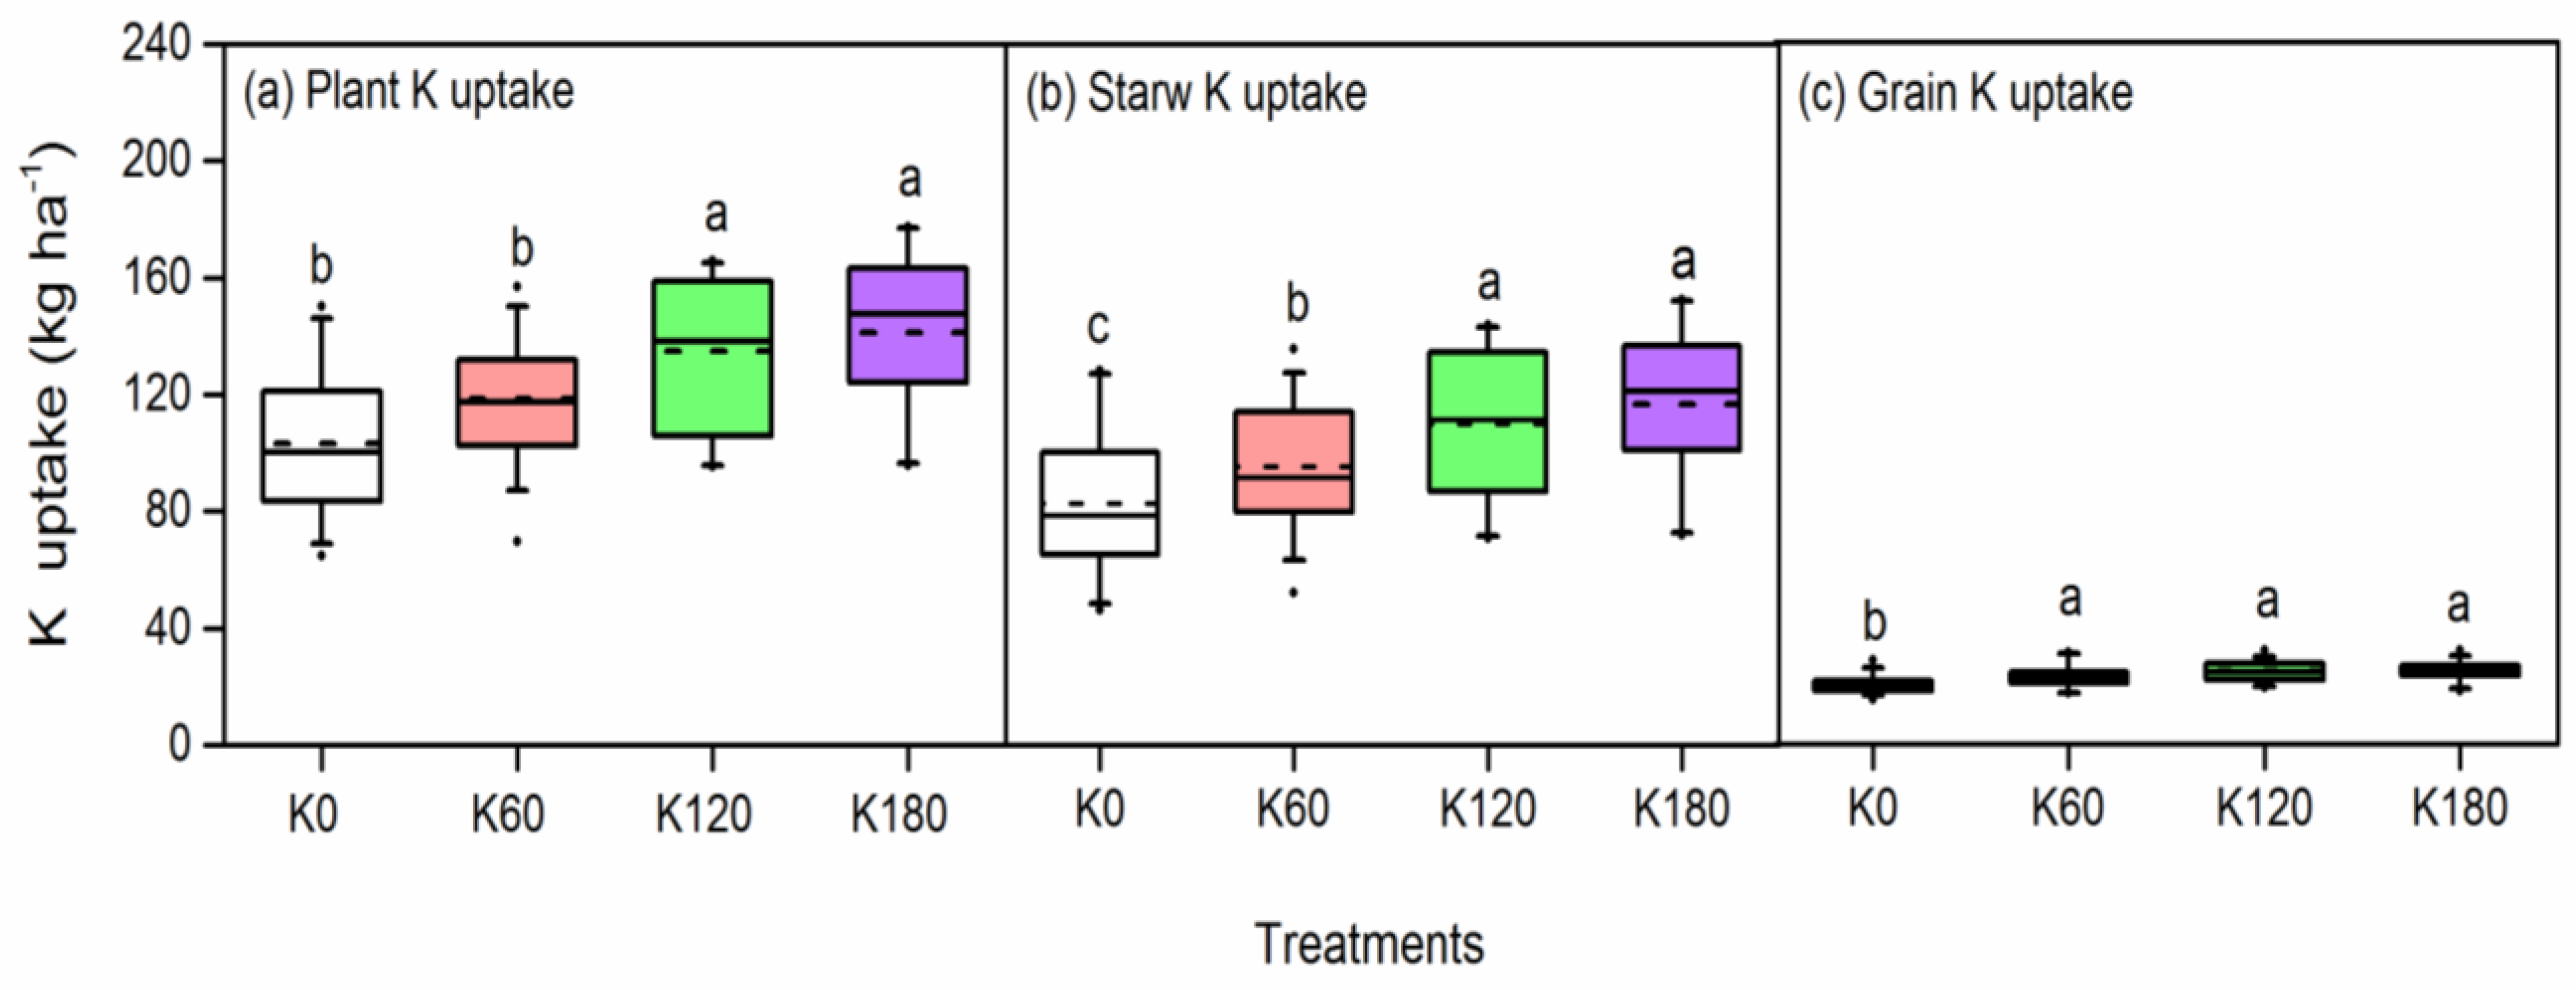
3.2. Potassium Uptake of the Plant, Straw and Grain in Different K Application Levels

The plant N uptake in different aerial parts of rice, was influenced by K fertilizer application (Figure 4). The average K uptake of grain in the K60, K120 and K180 treatments was 23.1, 24.8 and 24.9 kg ha−1, which was higher by 12.67%, 20.77% and 21.48% compared to K0 (Figure 4c). Moreover, the straw K uptake in the K180 treatment was still higher at 40.55%, 22.21% and 5.86%, which was higher than those in the K0, K60 and K120 treatments (Figure 4b).
The total plant K uptake of rice in all K fertilization treatments was significantly increased by 14.5%–36.7% compared with the K0 treatment (Figure 4a). The lowest plant K uptake during the experimental period was recorded for the K0 treatment, where total plant K uptake ranged from 59.1 to 165.5 kg ha−1, with an average of 105.3 kg ha−1. The average plant K uptake was 118.4 kg ha−1 in K60, 134.8 kg ha−1 in K120 and 141.4 kg ha−1 in K180 (Figure 4a). Therefore, the highest plant K uptake was observed in K180 treatment, followed by the K120 and K60. The same results were also observed in straw and grain K uptake. These results are in accordance with previous studies reported by Liao et al. [26] for rice, Qiu et al. [27] for maize, and Chen et al. [28] for cotton, who reported that plant K uptake increased with a rising K application rate.

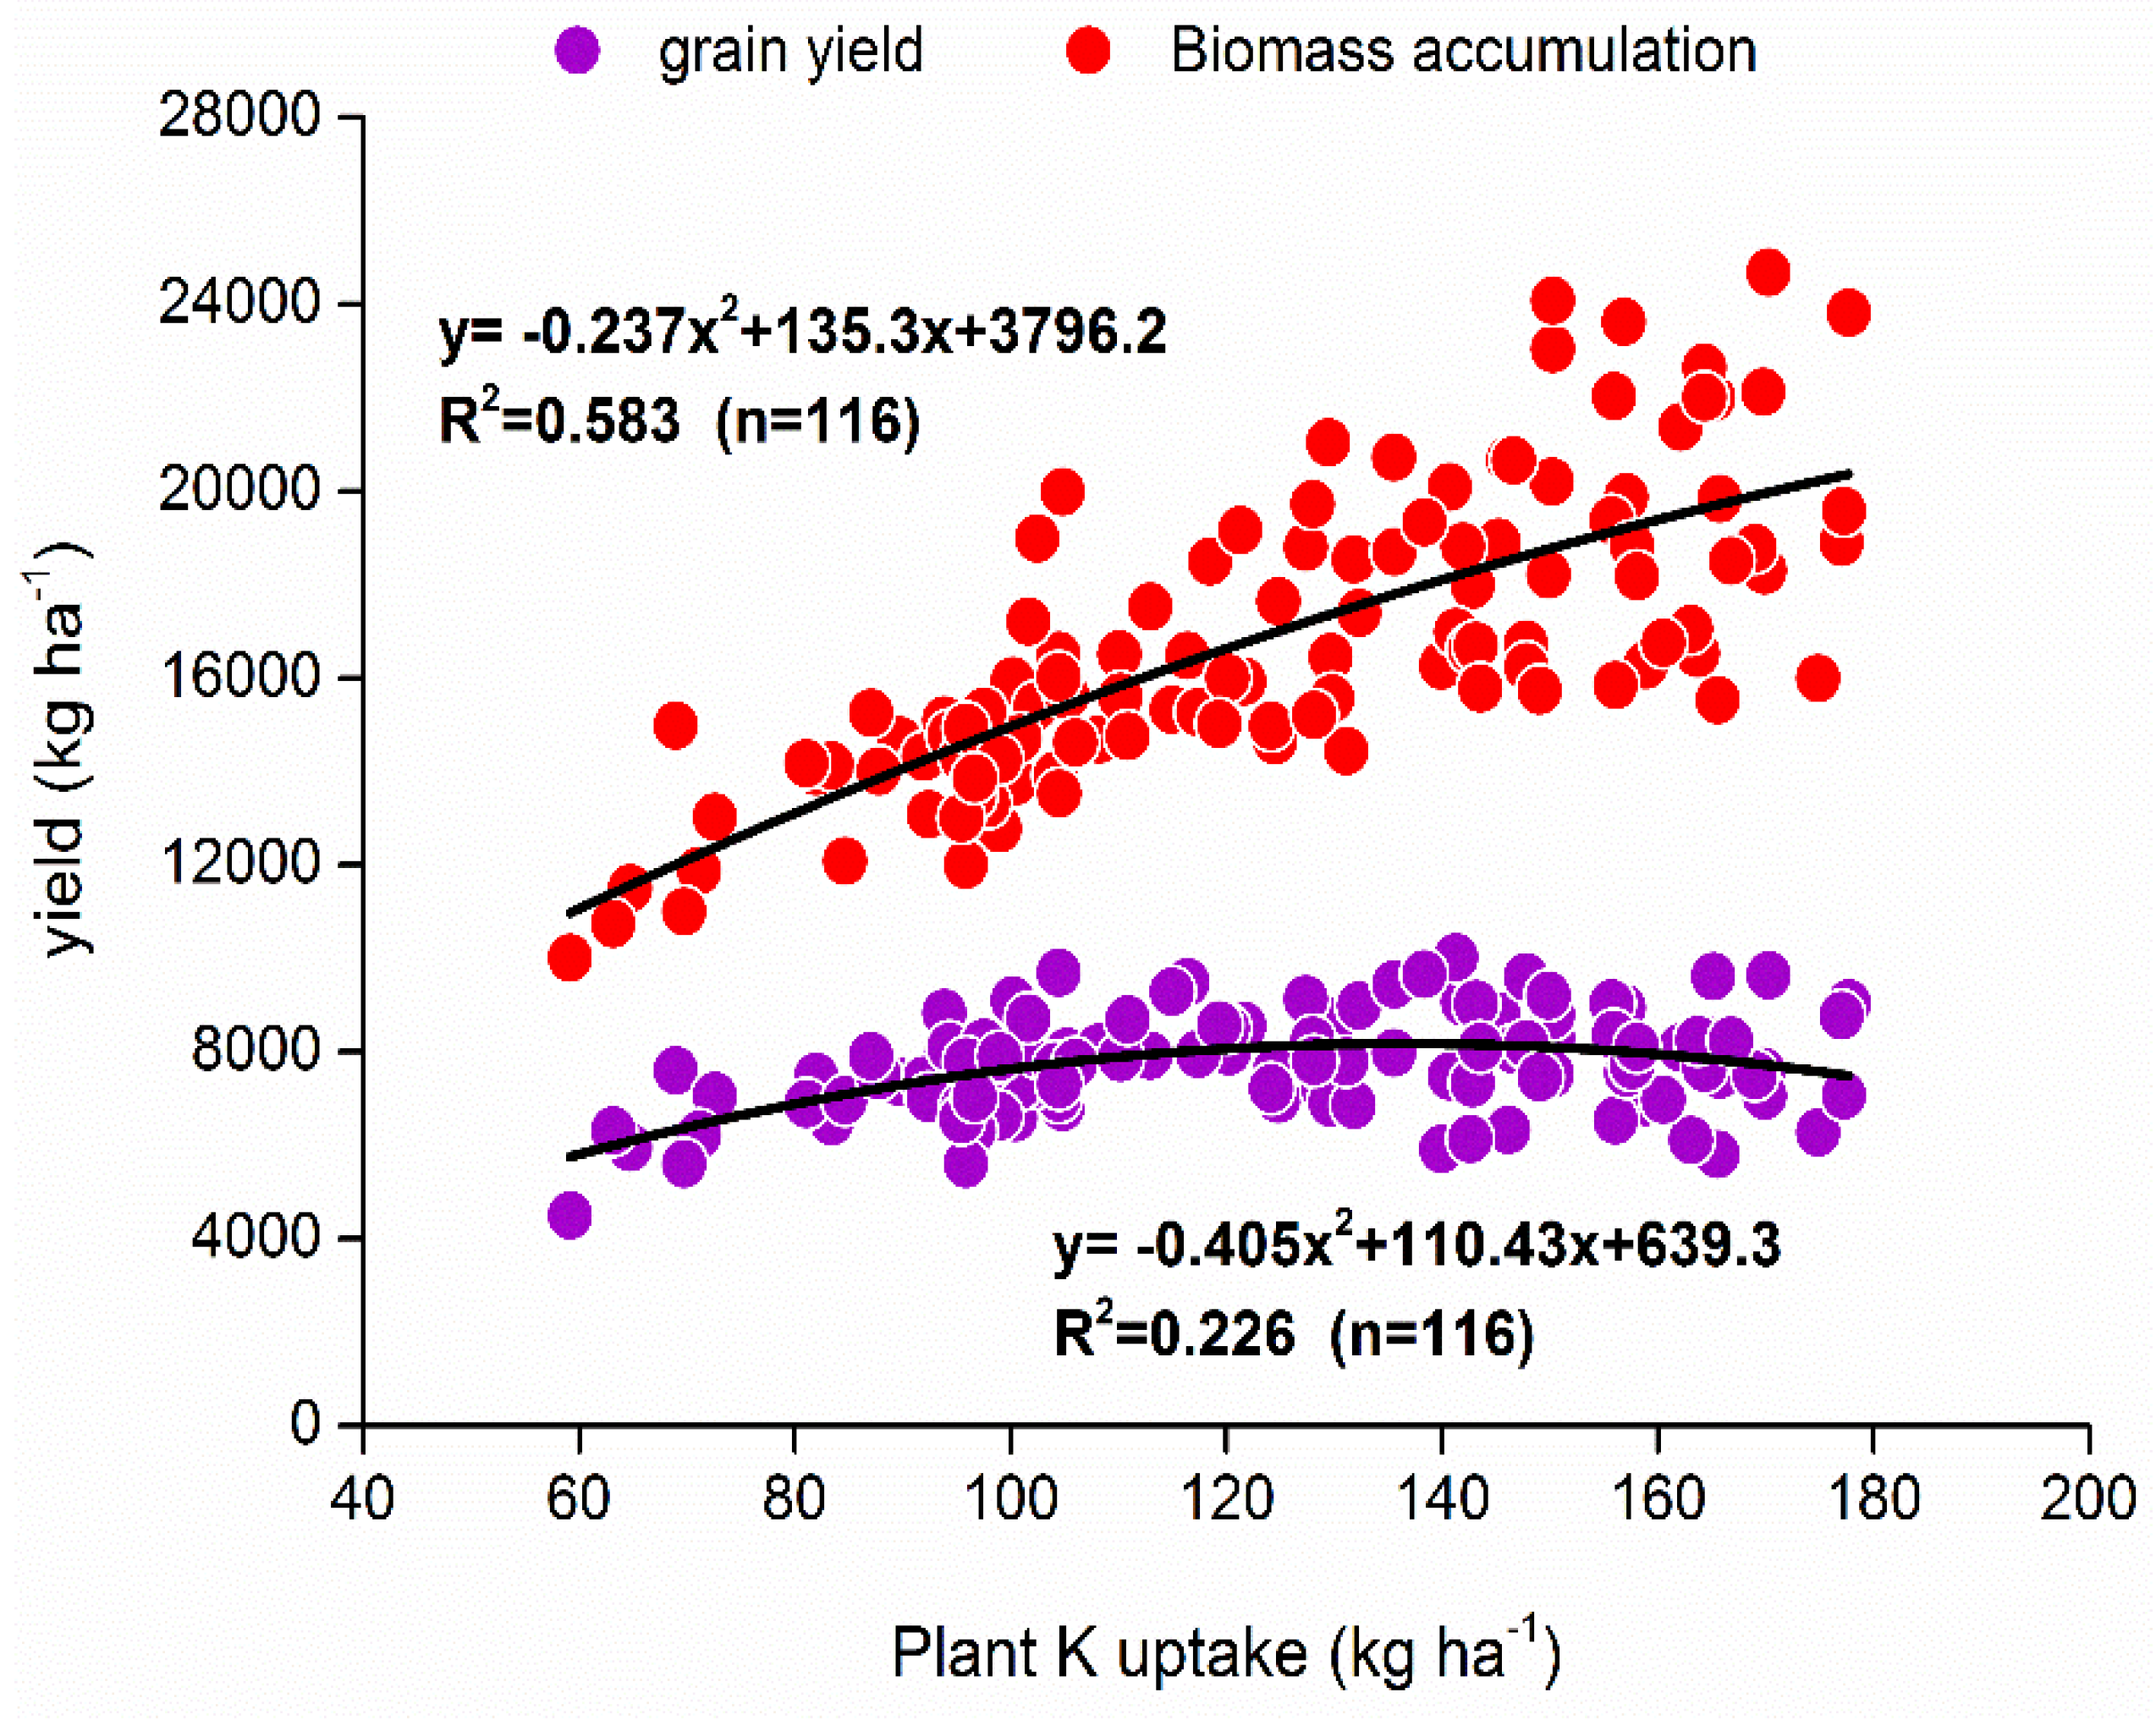
3.3. Correlation Among Biomass Accumulation, Grain Yield, and Plant K Uptake

The correlation between grain yield (y) and plant K uptake (x) showed a significant positive polynomial function (P < 0.05), the equation was y = −0.406x2 + 110.43x + 639.3, and R2 was 0.226 (Figure 5). The results show that the increased plant potassium absorption contributed to increased grain yield. About 22.6% of the variation in the aboveground K uptake is explained by grain yield (Figure 5). Similarly, there was found to be a remarkable correlation between biomass accumulation and plant K uptake, whereas the biomass accumulation showed significant polynomial function with K uptake, for which the equation is y = −0.237x2 + 135.3x + 3796.2. This indicates that about 58.3% of the variation in the aboveground K uptake is explained by the biomass accumulation (Figure 5). This result shows that the grain yield and biomass partly depended upon the amount of plant K uptake.

3.4. Potassium Contribution Rates (FCRK)

There were differences in the potassium fertilizer contribution rates among different K application levels. Table 1 shows the values for the parameters of FCRK. This is the amount FCRK increased as a function of the K level from K0 to K180. During the period 2007–2012, the average FCRK was 8.11% at K60, 14.29% at K120, and 7.30% at K180 (Table 1). The highest average FCRK in the four K application levels occurred in K120 treatment, followed by K60 and K180. Chuan et al. [29] also showed that the average K contribution rate for wheat was 11.3% during 2000–2011 in China. Therefore, these results show that K fertilization under the K120 treatment contributes more grain and nutrient for rice production.
In conclusion, scientific K management is crucial for improving rice productivity, K contribution rate, and environmental sustainability. This study reveals that rice yields were significantly higher in the 120 kg ha−1 K application rates. The lower contribution rate values indicate that reasonable K fertilizer application is needed to prevent environmental damage and improve potassium use efficiency.

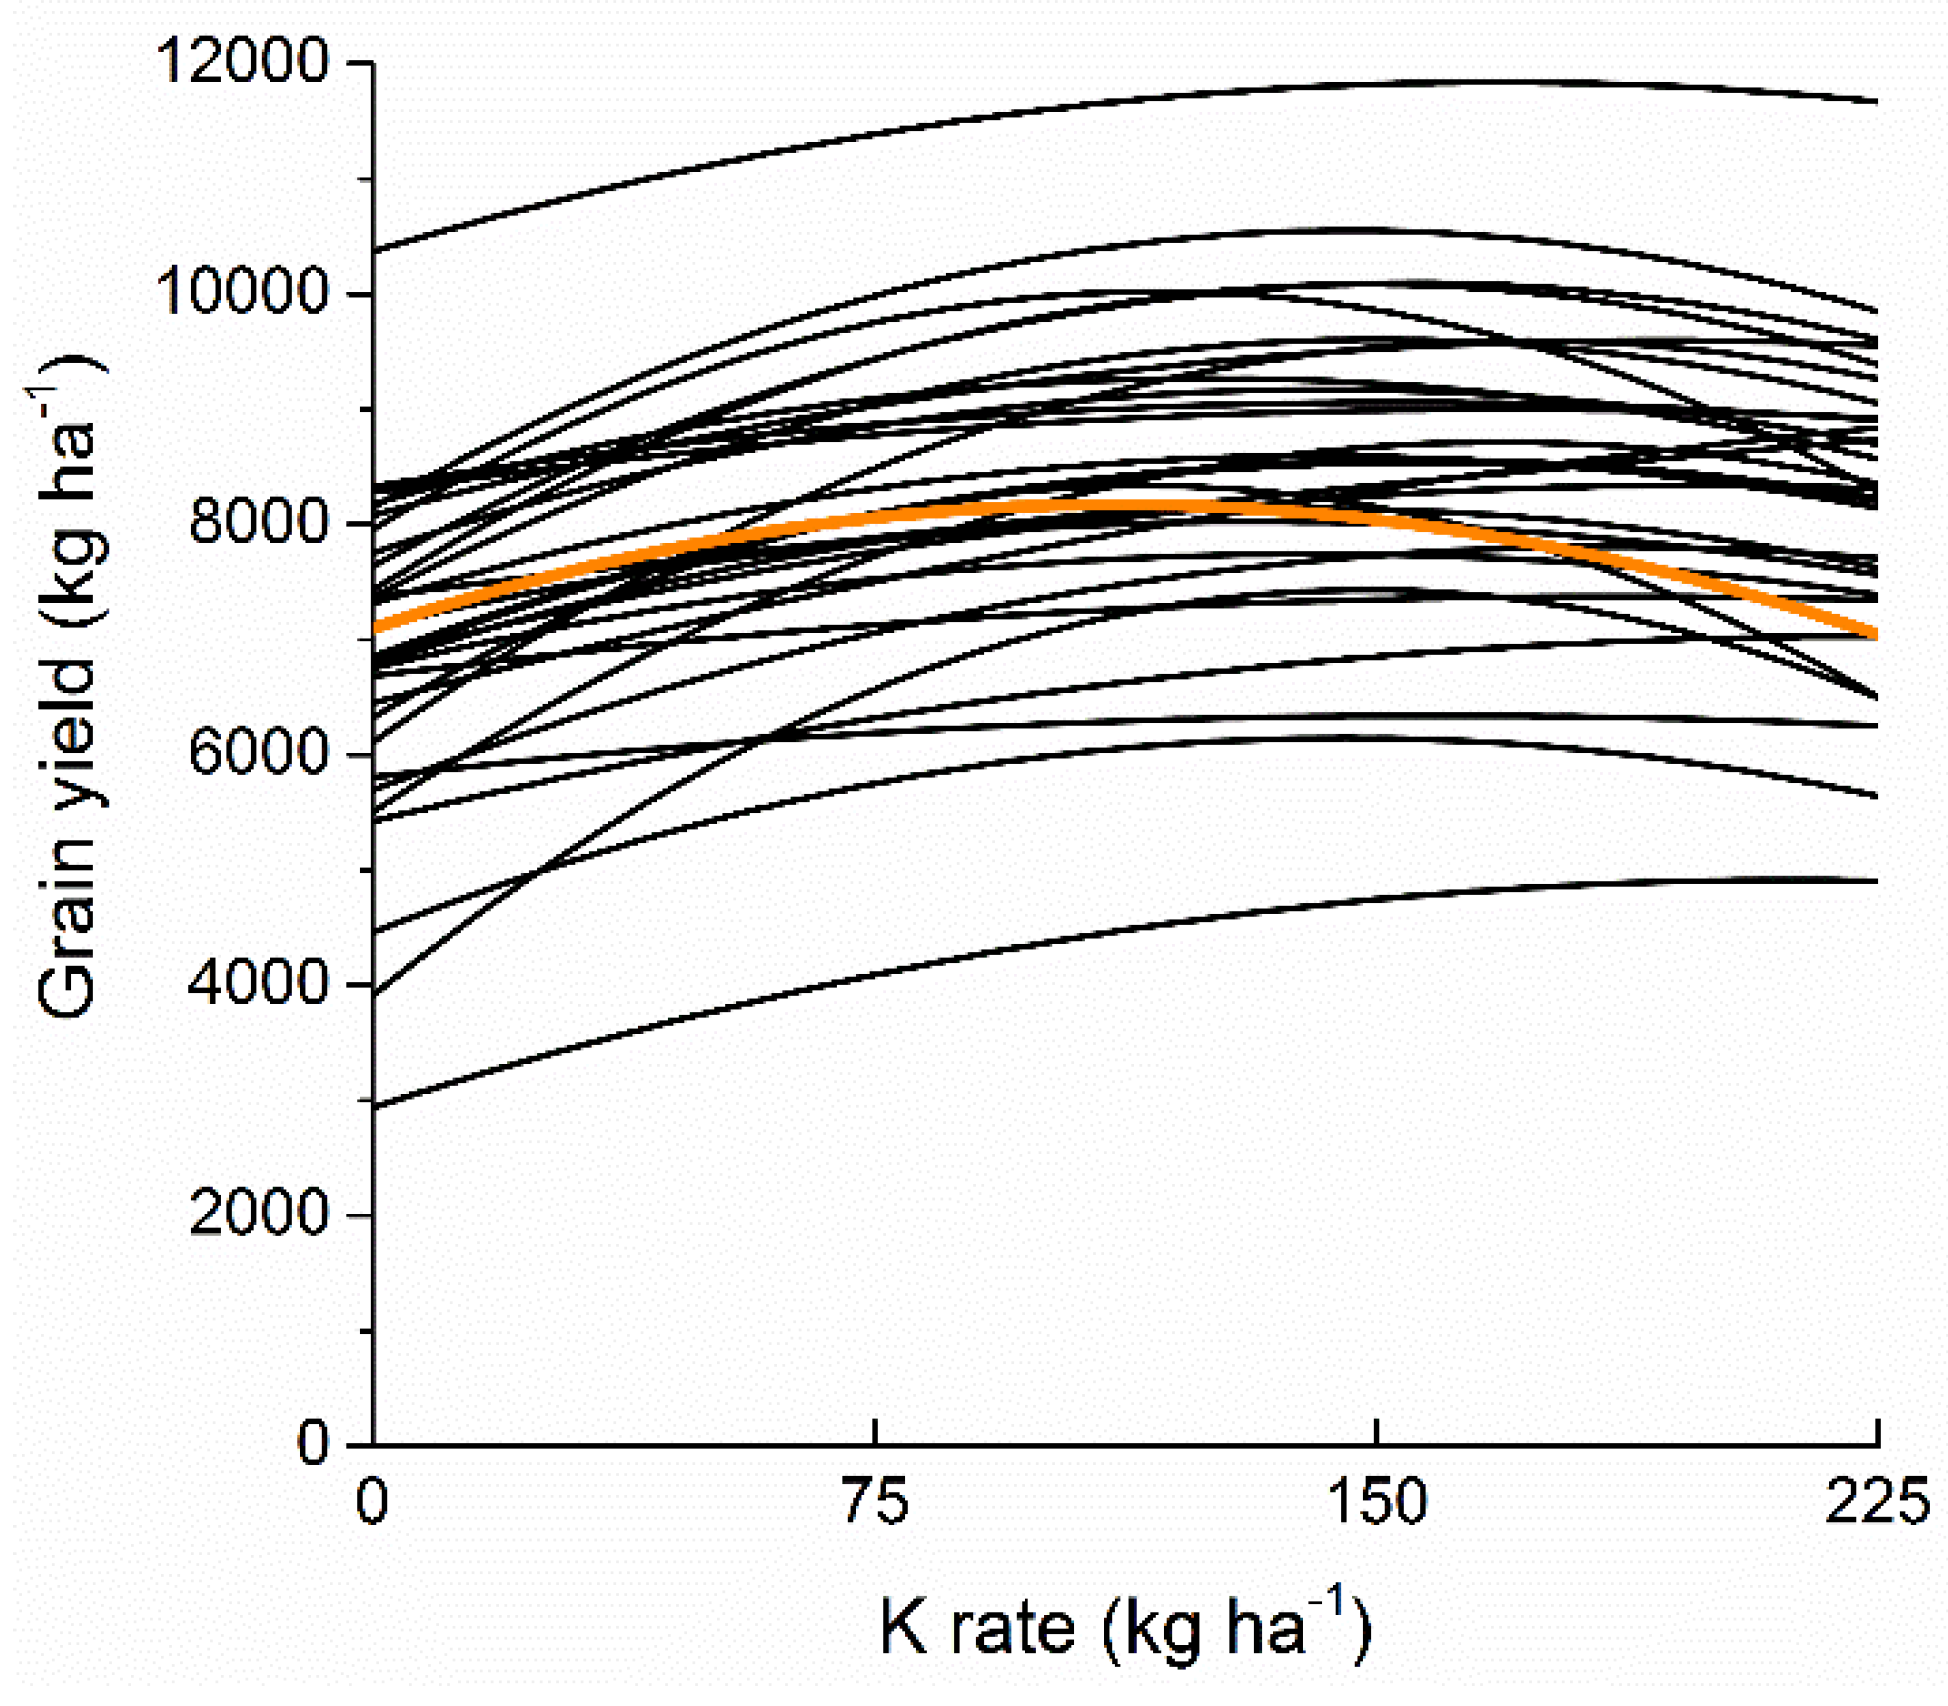
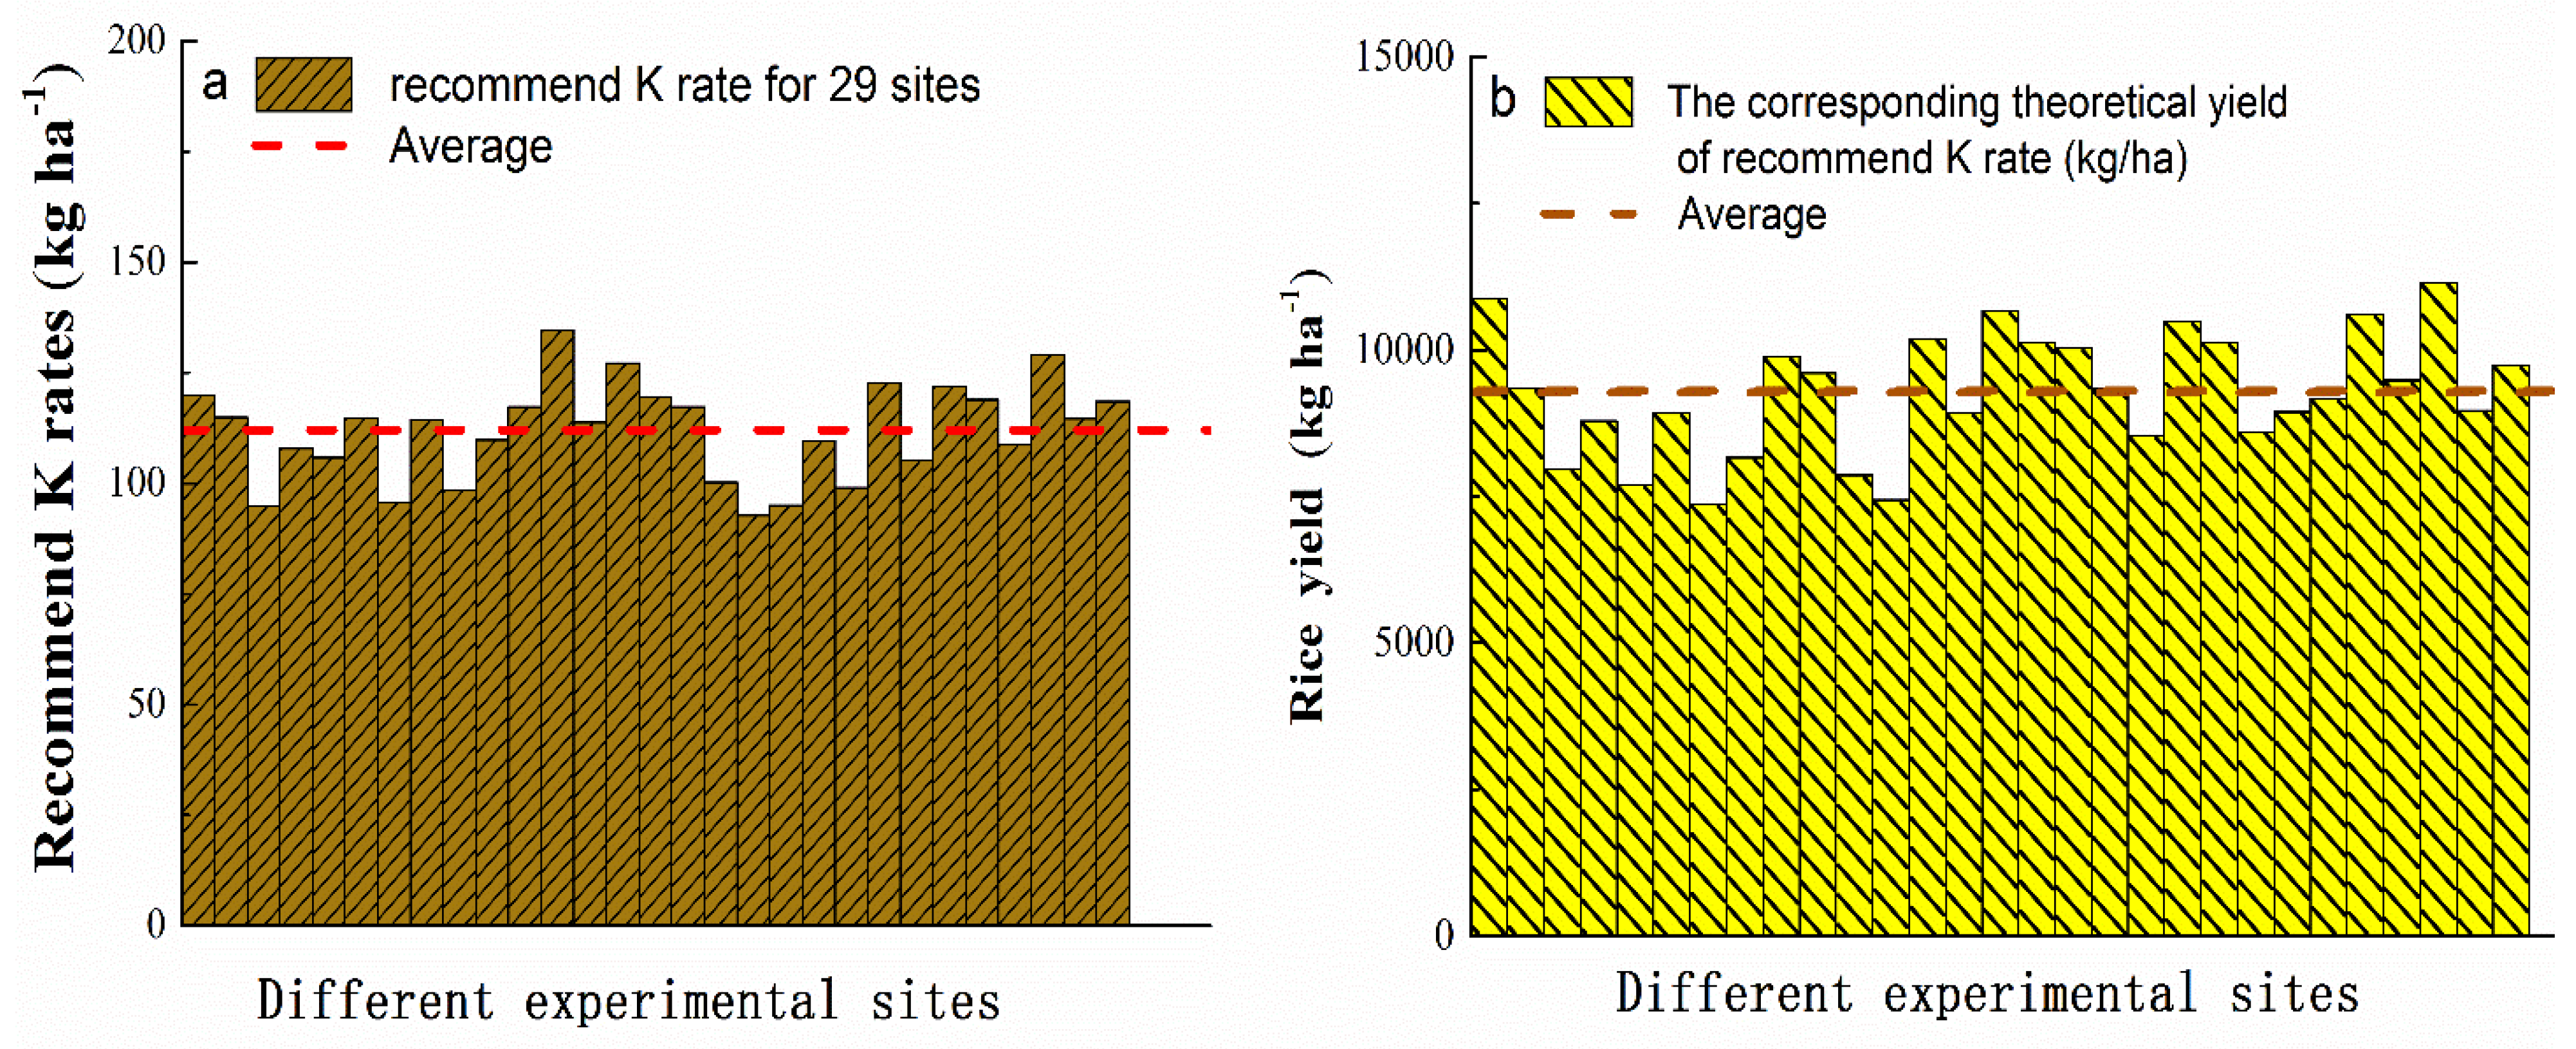
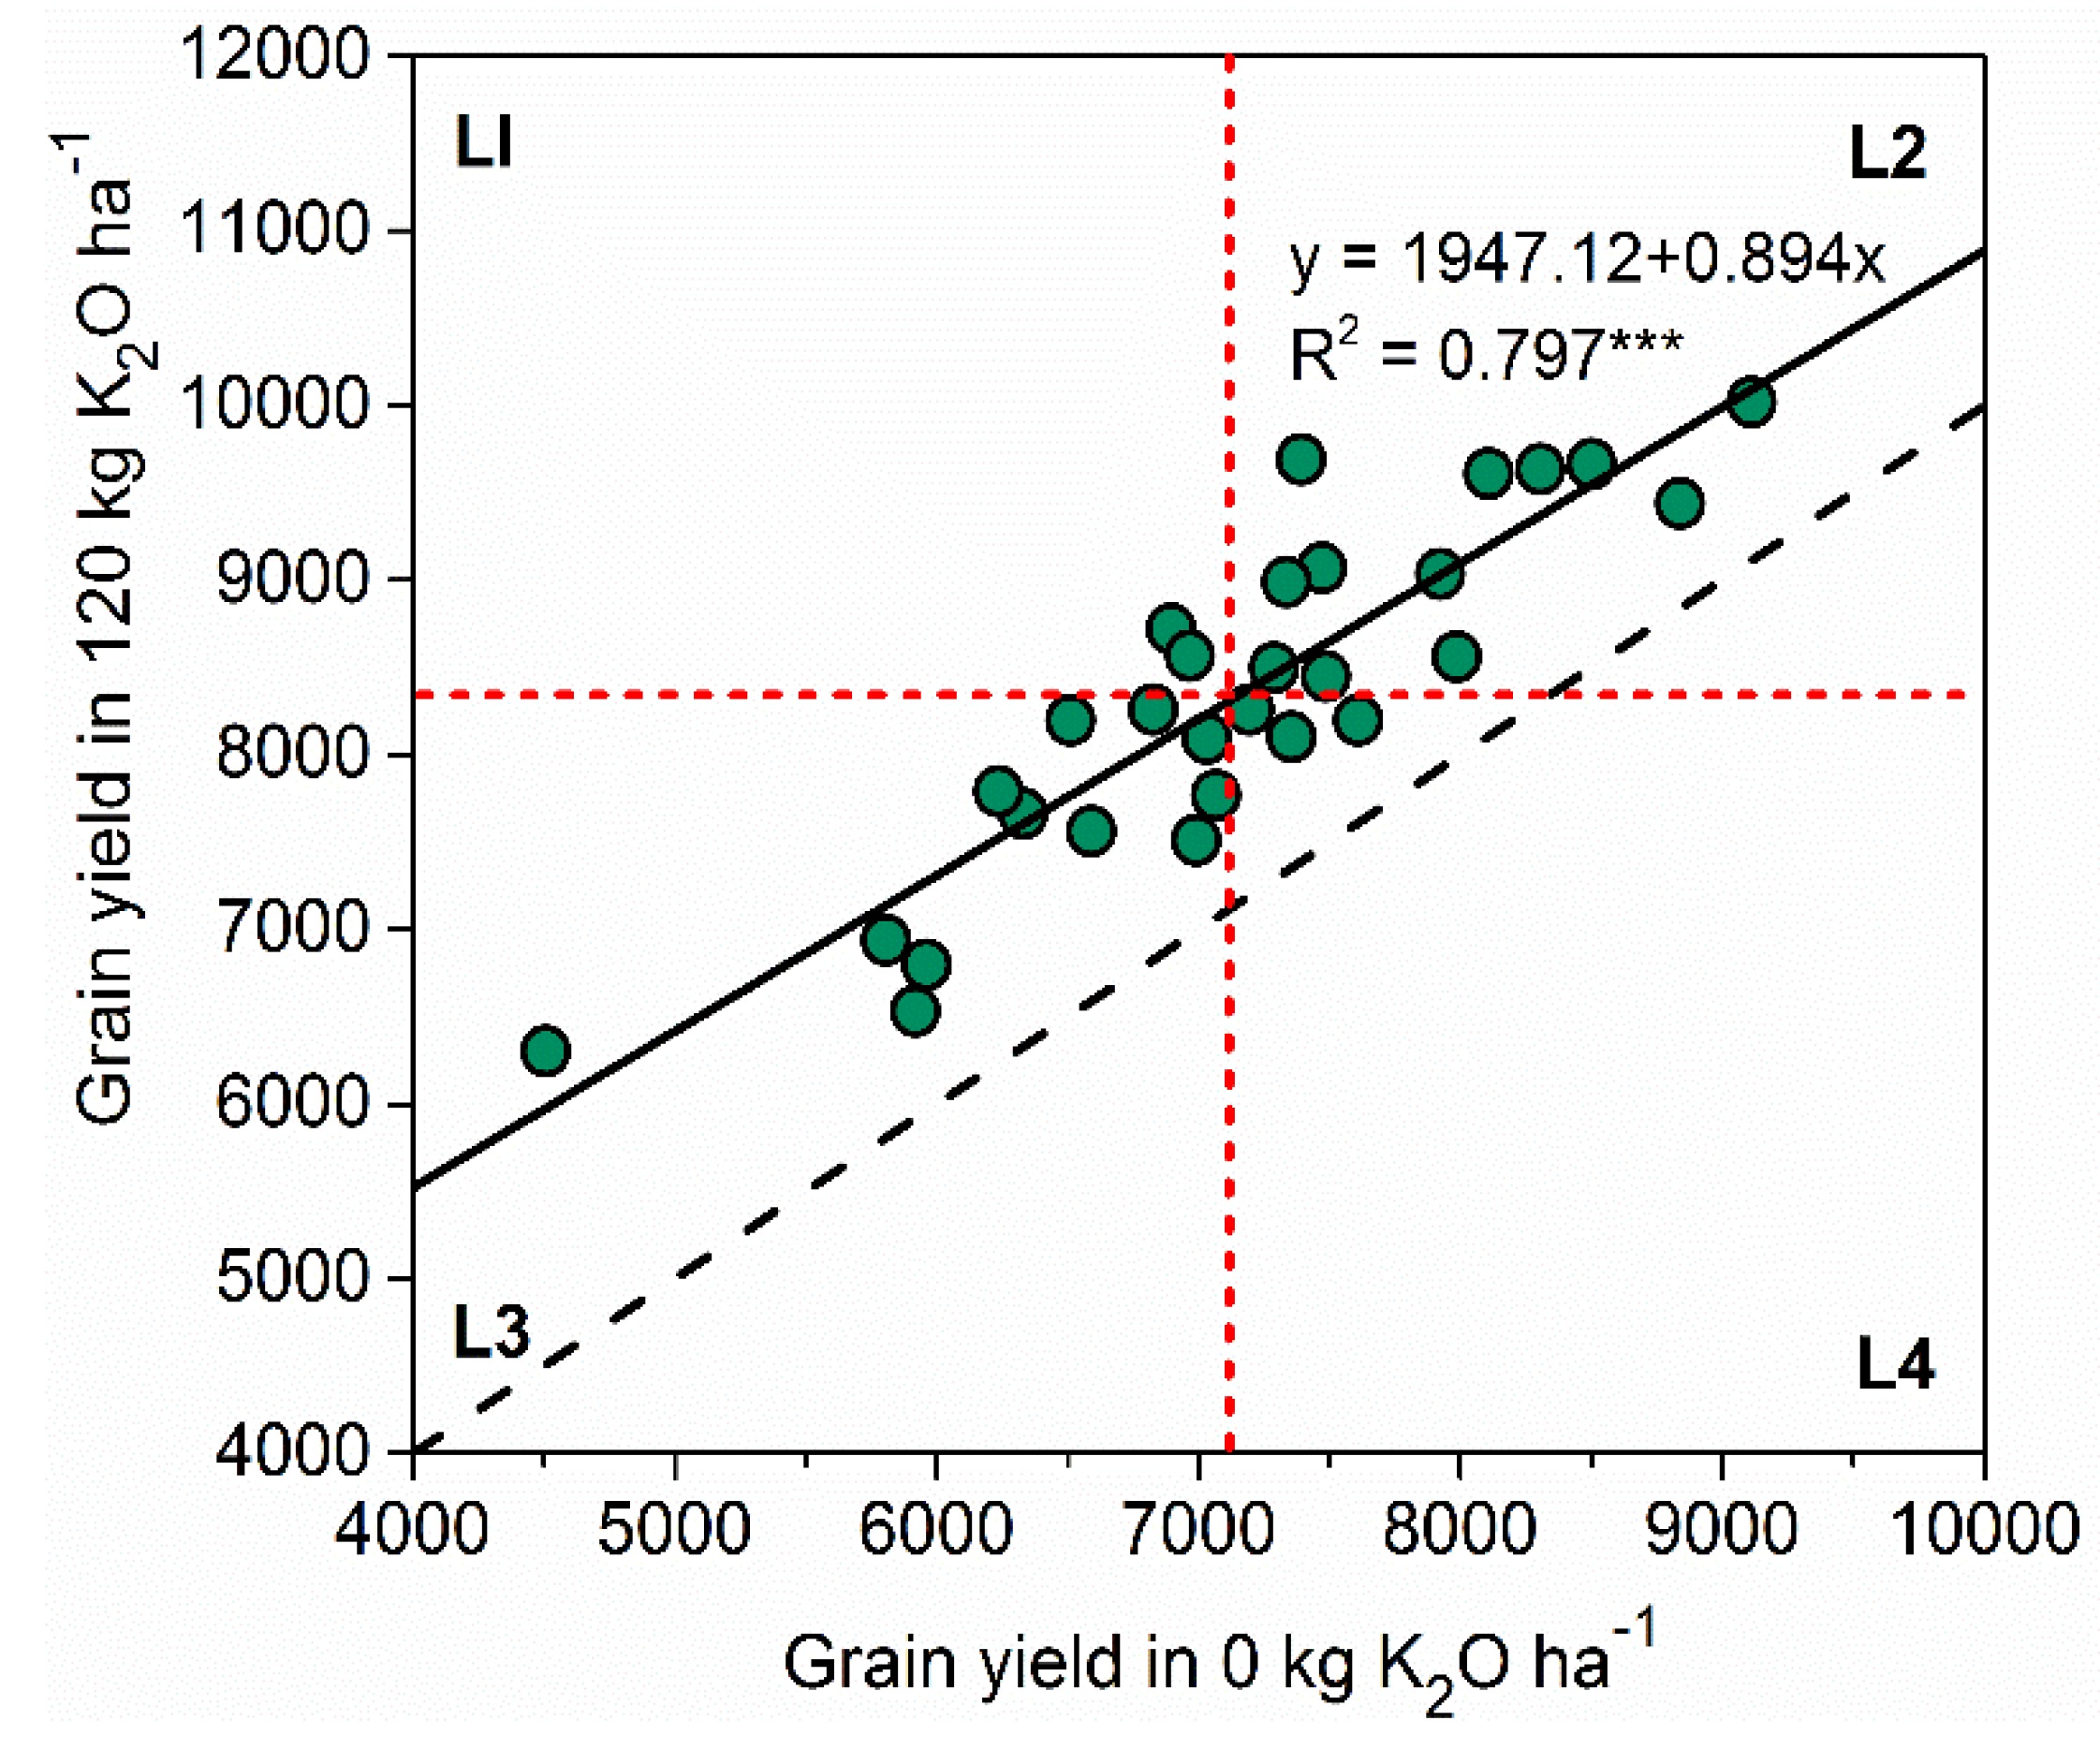
3.5. Fertilizer Recommendation of Rice for Sustainability Agriculture

Use of the quadratic regression model to fit the relationship between the grain yield and K fertilizer application rates for 29 experimental sites is shown in Figure 4. Additionally, the model equations for all sites were established (Table 2). Average regression coefficients aK, bK and cK were 7098, 19.33 and −0.087 (Figure 6), and ranged from 4454.5 to 9057.5, 10.38 to 30.45, and −0.134 to −0.042, respectively (Table 2). Thus, the average quadratic regression model Y = 7098 + 19.33K −0.087K2 was obtained (Figure 6). The fitting relation (R2) had a good correlation, and most of R2 was above 0.8, and ranged from 0.589 to 0.991 (Table 2). Therefore, the recommended K application rates ranged from 92.8 to 134.5 kg ha−1, with an average of 112 kg ha−1. Furthermore, the corresponding theoretical yields of the recommended K rate ranged from 7371.5 to 11144.5, with an average of 9297.5 kg ha−1 (Figure 7).

3.6. Recommended K Rates in Different Inherent Soil Productivity and Crop Management Styles

In accordance with previous studies, we established the relationship between the rice yield rate without K application and rice yields with a K application rate of 120 kg ha−1, and divided the data from the 29 experimental sites into four inherent soil productivity levels (Figure 8): L1, the group with low yield in a K application of 0 kg K2O ha−1 and high yield in 120 kg K2O ha−1; L2, high yield in both K applications of 0 and 120 kg K2O ha−1; L3, low yield in both K applications of 0 and 120 kg K2O ha−1; and L4, high yield in K applications of 0 kg K2O ha−1 and low yield in 120 kg K2O ha−1. Here, the 29 experimental sites were distributed in four inherent soil productivity levels: L1(n = 2), L2 (n = 12), L3 (n = 12), and L4 (n = 2) (Figure 8). The average recommended K application rates in levels of L1, L2, L3, and L4 were 116.1, 111.2, 112.2, and 111.7 kg ha−1, and ranged from 113.8 to 118.5 kg ha−1, 92.8 to 129.0 kg ha−1, 94.8 to 134.5 kg ha−1 and 105.1 to 115.4 kg ha−1 (Table 3). Therefore, the average corresponding theoretical yield was highest in L2 (10158.8 kg ha−1), followed by L1 (9966.1 kg ha−1), L4 (8881.9 kg ha−1) and L3 (8373.2 kg ha−1) (Table 3). We conclude that these results can be used to provide valuable data that has the potential to determine the K fertilizer rates in different inherent soil productivity level to reduce environmental risk and improve yield.
The red line in the figure represents the mean grain yield rate without K application (7155.5 kg ha−1) and mean rice yield in 120 kg K2O ha−1 (8342.6 kg ha−1). *** represents significance at the 0.01 level. The 29 experimental sites were divided into four inherent soil productivity levels: L1, low yield in 0 kg K2O ha−1 and high yield in 120 kg K2O ha−1; L2, high yield in both 0 and 120 kg K2O ha−1; L3, low yield in both 0 and 120 kg K2O ha−1; and L4, high yield in 0 kg K2O ha−1 and low yield in 120 kg K2O ha−1.

4. Conclusions

More efficient use of potassium (K) fertilizer application plays an important role in improving crop productivity. The highest yield consistently achieved in the K120 treatment during the experimental period (with an average of 8342.6 kg ha−1, ranged from 6305 to 10021.4 kg ha−1) and the grain yield followed the sequence K120 > K60 > K180 > K0. The highest plant K uptake was observed in the K180 treatment followed by the K120 and K60, and the same results were also observed in straw and grain K uptake. A remarkable correlation between biomass accumulation and plant K uptake was y = −0.237x2 + 135.3x + 3796.2, which has positive polynomial function. The average FCRK was 8.11%, 14.29%, and 7.30% in the K60, K120, and K180 treatments. Moreover, the average recommended K application rate for the 29 experimental sites was 112 kg ha−1, and the corresponding theoretical yields of recommended K rate ranged from 7371.5 to 11144.5, and with an average of 9297.5 kg ha−1. Remarkably, the average recommended K application rates in the four inherent soil productivity levels were 116.1, 111.2, 112.2 and 111.7 kg ha−1. These results could provide more reliable support for policy-makers to implement the development of strategies to guarantee sustainable rice production.

Author Contributions

Conceptualization, W.J. and X.W.; methodology, X.L. and X.W.; Data analysis, W.J., Y.X. and Z.C.; investigation, X.L. and L.Y.; Writing—Original Draft preparation, W.J.; Writing—Review and Editing, W.J.; funding acquisition, W.J. and X.L.

Funding

Supported by the Shaanxi Engineering and Technological Research Center for Conversation and Utilization of Regional Biological Resource [sxgczx-2019-08], and Specialized Research Fund for the Doctoral Program of Yan’an University [YDBK2018-51], and by the National Key Research and Development Program of China [2016YFD0200105].

Conflicts of Interest

The authors declare no conflict of interest.

References

  1. Li, P.; Lu, J.; Wang, Y.; Wang, S.; Hussain, S.; Ren, T.; Cong, R.; Li, X. Nitrogen losses, use efficiency, and productivity of early rice under controlled-release urea. Agric. Ecosyst. Environ. 2018, 251, 78–87. [Google Scholar] [CrossRef]
  2. Gu, J.; Jing, C.; Lu, C.; Wang, Z.; Hao, Z.; Yang, J. Grain quality changes and responses to nitrogen fertilizer of japonica rice cultivars released in the Yangtze River Basin from the 1950s to 2000s. Crop J. 2015, 3, 285–297. [Google Scholar] [CrossRef]
  3. Charles, H.; Godfray, J.; Beddington, J.R.; Crute, I.R.; Haddad, L.; Lawrence, D.; Muir, J.F.; Robinson, S.; Thomas, S.M. Food Security: The challenge of feeding 9 billion people. Science 2010, 327, 812–818. [Google Scholar]
  4. Zhang, H.; Xu, M.; Shi, X.; Li, Z.; Huang, Q.; Wang, X. Rice yield, potassium uptake and apparent balance under long-term fertilization in rice-based cropping systems in southern China. Nutr. Cycl. Agroecosyst. 2010, 88, 341–349. [Google Scholar] [CrossRef]
  5. Zhang, H.; Liu, H.; Hou, D.; Zhou, Y.; Liu, M.; Wang, Z.; Liu, L.; Gu, J.; Yang, J. The effect of integrative crop management on root growth and methane emission of paddy rice. Crop J. 2019, 7, 444–457. [Google Scholar] [CrossRef]
  6. Sinebo, W. Yield Relationships of barleys grown in a tropical highland environment. Crop Sci. 2002, 42, 428–437. [Google Scholar] [CrossRef]
  7. Li, G.; Zhang, J.; Yang, C.; Song, Y.; Zheng, C.; Wang, S.; Liu, Z. Optimal yield-related attributes of irrigated rice for high yield potential based on path analysis and stability analysis. Crop J. 2014, 2, 235–243. [Google Scholar] [CrossRef]
  8. Xue, Y.; Hua, D.; Liu, L.; Wang, Z.; Yang, J.; Zhang, J. An Improved Crop Management Increases Grain Yield and Nitrogen and Water Use Efficiency in Rice. Crop Sci. 2013, 53, 271–284. [Google Scholar] [CrossRef]
  9. Zhang, H.; Yu, C.; Kong, X.; Hou, D.; Gu, J.; Liu, L.; Wang, Z.; Yang, J. Progressive integrative crop managements increase grain yield, nitrogen use efficiency and irrigation water productivity in rice. Field Crop. Res. 2018, 215, 1–11. [Google Scholar] [CrossRef]
  10. Fan, M.; Shen, J.; Yuan, L.; Jiang, R.; Chen, X.; Davies, W.J.; Zhang, F. Improving crop productivity and resource use efficiency to ensure food security and environmental quality in China. J. Exp. Bot. 2012, 63, 13–24. [Google Scholar] [CrossRef]
  11. Min, H.; Zhou, X.; Zou, Y. Improving nitrogen management for zero-tillage rice in China. Crop J. 2018, 6, 406–412. [Google Scholar]
  12. Galloway, J.N.; Townsend, A.R.; Erisman, J.W.; Bekunda, M.; Cai, Z.C.; Freney, J.R.; Martinelli, L.A.; Seitzinger, S.P.; Sutton, M.A. Transformation of the nitrogen cycle: Recent trends, questions, and potential solutions. Science 2008, 320, 889–892. [Google Scholar] [CrossRef] [PubMed]
  13. Jiang, W.T.; Liu, X.H.; Wang, Y.; Zhang, Y.; Qi, W. Responses to Potassium Application and Economic Optimum K Rate of Maize under Different Soil Indigenous K Supply. Sustainability 2018, 10, 2267. [Google Scholar] [CrossRef]
  14. Guo, J.H.; Liu, X.J.; Zhang, Y.; Shen, J.L.; Han, W.X.; Zhang, W.F.; Christie, P.; Goulding, K.W.; Vitousek, P.M.; Zhang, F.S. Significant acidification in major Chinese croplands. Science 2010, 327, 1008–1010. [Google Scholar] [CrossRef]
  15. Ma, Y.C.; Kong, X.W.; Yang, B.; Zhang, X.L.; Yan, X.Y.; Yang, J.C.; Xiong, Z.Q. Net global warming potential and greenhouse gas intensity of annual rice–wheat rotations with integrated soil–crop system management. Agric. Ecosyst. Environ. 2013, 164, 209–219. [Google Scholar] [CrossRef]
  16. Wang, M.; Zheng, Q.; Shen, Q.; Guo, S. The Critical Role of Potassium in Plant Stress Response. Int. J. Mol. Sci. 2013, 14, 7370–7390. [Google Scholar] [CrossRef]
  17. Zorb, C.; Senbayram, M.; Peiter, E. Potassium in agriculture-status and perspectives. J. Plant Physiol. 2014, 171, 656–669. [Google Scholar] [CrossRef]
  18. Trivedi, K.; Kubavat, D.; Ghara, K.K.; Kumar, R.; Trivedi, H.; Anand, K.G.V.; Maiti, P.; Ghosh, A. Evaluation of Fertilizer Potential of Different K Compounds Prepared Utilizing Sea Bittern as Feed Stock. Front. Plant Sci. 2017, 8, 1541–1553. [Google Scholar] [CrossRef]
  19. Cong, R.; Li, H.; Zhang, Z.; Ren, T.; Li, X.; Lu, J. Evaluate regional potassium fertilization strategy of winter oilseed rape under intensive cropping systems: Large-scale field experiment analysis. Field Crop. Res. 2016, 193, 34–42. [Google Scholar] [CrossRef]
  20. He, P.; Yang, L.; Xu, X.; Zhao, S.; Chen, F.; Li, S.; Tu, S.; Jin, J.; Johnston, A.M. Temporal and spatial variation of soil available potassium in China (1990–2012). Field Crop. Res. 2015, 173, 49–56. [Google Scholar] [CrossRef]
  21. Wang, X.K.; Fan, J.L.; Xing, Y.Y.; Xu, G.C.; Wang, H.D.; Deng, J.; Wang, Y.F.; Zhang, F.C.; Li, P.; Li, Z.B. The effects of mulch and nitrogen fertilizer on the soil environment of crop plants. Adv. Agron. 2019, 153, 121–173. [Google Scholar]
  22. Wu, L.; Ma, W.; Zhang, C.; Wu, L.; Zhang, W.; Jiang, R.; Zhang, F.; Cui, Z.; Chen, X. Current potassium management status and grain yield response of Chinese maize to potassium application. J. Plant Nutr. Soil Sci. 2013, 176, 441–449. [Google Scholar] [CrossRef]
  23. Zhang, R.X.; Liu, X.Z.; Wang, W.N.; Wang, Y.Z.; Li, H.; Zhang, Z.X.; Xu, Q. Study on the application effects of N,P, and K fertilizers on rice and the recommended fertilizer amount in eastern Huibei. J. Hubei Agric. Sci. 2009, 13, 35–38. (In Chinese) [Google Scholar]
  24. FAO (Food and Agriculture Organization of the United Nations). FAOSTAT Database—Agricultural Production; FAO: Rome, Italy, 2012. [Google Scholar]
  25. Xu, X.P.; Xie, J.G.; Hou, Y.P.; He, P.; Pampolino, M.F.; Zhao, S.C.; Zhou, W. Estimating nutrient uptake requirements for rice in China. Field Crop. Res. 2015, 180, 37–45. [Google Scholar] [CrossRef]
  26. Liao, Y.L.; Lu, Y.H.; Xie, J.; Nie, J.; Yang, Z.P.; Zhou, X. Effects of Long-term application of chemical potassium fertilizer and incorporation of rice straw on potassium supplying capacity of red soil in double cropping paddy field. Acta Pedol. Sin. 2017, 54, 456–466. (In Chinese) [Google Scholar]
  27. Qiu, S.; Xie, J.; Zhao, S.; Xu, X.; Hou, Y.; Wang, X.; Zhou, W.; He, P.; Johnston, A.M.; Christie, P. Long-term effects of potassium fertilization on yield, efficiency, and soil fertility status in a rain-fed maize system in northeast China. Field Crop. Res. 2014, 163, 1–9. [Google Scholar] [CrossRef]
  28. Chen, Y.; Li, Y.; Hu, D.; Zhang, X.; Wen, Y.; Chen, D. Spatial distribution of potassium uptake across the cotton plant affects fiber length. Field Crop. Res. 2016, 192, 126–133. [Google Scholar] [CrossRef]
  29. Chuan, L.; He, P.; Jin, J.; Li, S.; Grant, C.; Xu, X.; Qiu, S.; Zhao, S.; Zhou, W. Estimating nutrient uptake requirements for wheat in China. Field Crop. Res. 2013, 146, 96–104. [Google Scholar] [CrossRef]
Figure 1. Distribution of the 29 experimental sites for rice in Liaoning province, China.
Sustainability 11 06522 g001
Figure 2. The diagram of fertilizer recommendation in inherent soil productivity levels.
Sustainability 11 06522 g002
Figure 3. Grain yield and increasing yield in the applied four K levels across the 29 experiment sites. Solid and dotted lines indicate median and mean values, respectively; box boundaries indicate the upper and lower quartiles; whisker caps indicate 90th and 10th percentiles; different lowercase letters indicate a significant difference (p < 0.01) among different treatments.
Sustainability 11 06522 g003
Figure 4. Plant K uptake (a), straw K uptake (b), and grain K uptake (c) in four K fertilizer application levels across the 29 experiment sites.
Sustainability 11 06522 g004
Figure 5. The correlation between the grain yield (y), biomass accumulation and plant K uptake (x) across the 29 experiment sites.
Sustainability 11 06522 g005
Figure 6. The potassium response curves estimated for the quadratic equation model to fit the relationship between yield and K fertilizer application rates for rice for the 29 sites. The orange curve is the average quadratic regression model.
Sustainability 11 06522 g006
Figure 7. Recommended K application rates and the corresponding theoretical yield across the 29 experimental sites for rice. The dashed red and brown lines in the figure indicate mean values, respectively.
Sustainability 11 06522 g007
Figure 8. Relationship between rice yields without K application and with a 120 kg K2O ha−1 K application rate, in different inherent soil productivity levels.
Sustainability 11 06522 g008
Table 1. Effect of the K application treatment on the potassium fertilizer contribution rates (FCRK) in rice across the 29 experimental sites in Northeast China.
TreatmentsPotassium Fertilizer Contribution Rates (%)
MeanSDMin25%Qb75%QbMax
K608.11 3.29 4.07 5.48 9.50 19.55
K12014.29 5.46 6.40 9.33 18.04 28.55
K1807.30 4.48 0.48 3.70 10.38 19.70
a SD = standard deviation. b Q = quartile.
Table 2. The quadratic equation models describing the relationship between yield and fertilizer application for rice at different experimental sites.
Experimental SitesY = a + bx + cx2R2Experimental SitesY = a + bx + cx2R2
Site 1y = 8052.8 + 23.48x − 0.098x20.951 **Site 16y = 7228.8 + 24.62x − 0.105x20.839 **
Site 2y = 6757.7 + 22.51x − 0.0098x20.908 **Site 17y = 8824.5 + 12.02x − 0.06x20.984 **
Site 3y = 6966.5 + 10.62x − 0.056x20.938 **Site 18y = 8003.4 + 14.47x − 0.078x20.978 **
Site 4y = 7586.8 + 10.38x − 0.045x20.959 **Site 19y = 7059.6 + 15.58x − 0.082x20.998 **
Site 5y = 5752.8 + 18.61x − 0.088x20.794 **Site 20y = 8202.4 + 20.81x − 0.095x20.674 **
Site 6y = 7366.7 + 13.53x − 0.059x20.991 **Site 21y = 7896.2 + 22.56x − 0.114x20.983 **
Site 7y = 5941.4 + 14.93x − 0.078x20.746 **Site 22y = 6247 + 19.15x − 0.078x20.757 **
Site 8y = 6512.1 + 14.4x − 0.063x20.754 **Site 23y = 7468.4 + 13.89x − 0.057x20.988 **
Site 9y = 7287 + 26.37x − 0.134x20.603 **Site 24y = 8455.5 + 18.06x − 0.076x20.589 **
Site 10y = 6454.5 + 28.75x − 0.131x20.943 **Site 25y = 8455.5 + 18.06x − 0.076x20.943 **
Site 11y = 4454.5 + 29.07x − 0.124x20.969 **Site 26y = 7231.3 + 20.65x − 0.095x20.92 **
Site 12y = 5918 + 11.3x − 0.042x20.908 **Site 27y = 7214.6 + 30.44x − 0.118x20.786 **
Site 13y = 6823.1 + 29.59x − 0.13x20.939 **Site 28y = 6157.3 + 24.52 − 0.107x20.901 **
Site 14y = 6979.8 + 15.25x − 0.06x20.911 **Site 29y = 6874.6 + 24.16x − 0.102x20.874 **
Site 15y = 9057.4 + 13.38x − 0.056x20.862 **
The “y” is the grain yield, and the “x” means K application rate. ** indicates significance at P < 0.01.
Table 3. The optimal recommended K rate and the corresponding theoretical yield in the different inherent soil productivity levels.
Different Inherent Soil Productivity LevelsItemOptimal Recommended K RateThe Corresponding Theoretical Yield
L1Mean116.19966.1
Max113.89738.3
Min118.510193.8
L2Mean111.210158.8
Max92.89161.5
Min129.011144.5
L3Mean112.28373.2
Max94.87371.5
Min134.59604.0
L4Mean111.78881.9
Max105.18785.1
Min115.48940.0

