Article

Assessment of Ecosystem Service Values of Urban Parks in Improving Air Quality: A Case Study of Wuhan, China

1
School of Resources and Environmental Science, Hubei University, Wuhan 430062, China
2
Key Laboratory of Regional Development and Environmental Response, Wuhan 430062, China
3
Department of Transportation Engineering, University of Seoul, Seoul 04763, Korea
4
Department of Applied Mathematics, Hanyang University, Ansan 15588, Korea
*
Author to whom correspondence should be addressed.
Sustainability 2019, 11(22), 6519; https://doi.org/10.3390/su11226519
Submission received: 30 September 2019 / Revised: 6 November 2019 / Accepted: 8 November 2019 / Published: 19 November 2019

Abstract

:
Assessing ecosystem service values of urban parks can promote understanding of urban green space protection and management. In this study, ecosystem services of air quality purification from 40 sample parks with different areas and land cover compositions were assessed based on literature records and high-resolution images. Six typical ecological benefits of CO2 sequestration, O2 generation, air temperature amelioration, SO2 removal, NOx removal, and dust interception were estimated. The results showed similar proportions of different ecosystem service values to total. The ecological services of CO2 sequestration and O2 generation contributed the majority of total ecosystem service value, with percentages ranging from 69.34% to 73.76% and from 20.52% to 21.71%, respectively. There was very wide variation of ecosystem service values among urban parks. Multivariate regression between ecosystem service values and spatial characteristics of urban parks revealed that park areas of forest and water played a vital role in service value. For a given park, the total service value could be increased by up to 600% if the park was redesigned with consideration of land cover composition. This study provides sound scientific information for urban planners and greening designers to optimize urban park layout.

1. Introduction

As the only natural area in urbanized area, urban green spaces play an irreplaceable role in improving human habitat quality and maintaining healthy urban ecosystems [1,2]. In recent years, rapid urbanization has resulted in tremendous population growth and continuous expansion of built-up areas in cities. Consequently, increasing demands for buildings, roads, vehicles, and energy production increased pollutant emissions to the atmosphere [3,4,5,6]. Meanwhile, urban green spaces are gradually fragmented and often contain impervious surface areas, which seriously weaken the ecological service function of the urban green space system and reduce its ecosystem service values [7,8]. People usually pay attention to the aesthetic, social, and recreational contributions of urban parks [9,10], ignoring their ecological benefits. This misunderstanding of park services can lead to deviation in park design. Maximization of the ecological benefits of a park while retaining its recreational function is a challenge for park designers and managers [11,12]. Assessment of ecosystem service values of urban parks can promote understanding of urban green space protection and provide sound scientific evidence for urban park layout and management.
Most studies have been conducted at a local scale through field measurements to obtain pollutant data and model the relationship between urban vegetation and air pollution [11,13,14,15]. Air purification efficiency of urban green spaces depends on park components of trees, shrubs, and/or herbaceous vegetation [12,16,17]. However, previous studies focused on one or a few urban parks, and the limited samples cannot provide enough evidence to determine the specific influence of urban green spaces on the environment. More information is needed on the impacts of vegetation composition and structure on air purification and climate regulation services of urban green spaces [18,19,20]. Geographic information technology allows collection of adequate urban vegetation characteristics based on highspatial resolution images in bounded time.
This study combined field investigation with high-resolution image analysis to obtain the spatial characteristics of 40 sample parks. Based on literature records, the ecosystem service values of CO2 sequestration, O2 generation, air temperature amelioration, SO2 removal, NOx removal, and dust interception were assessed. The relationships between park characteristics and ecosystem service values were modeled to detect the mechanisms of influence of urban parks based on their ecological functions.

2. Materials and Methods
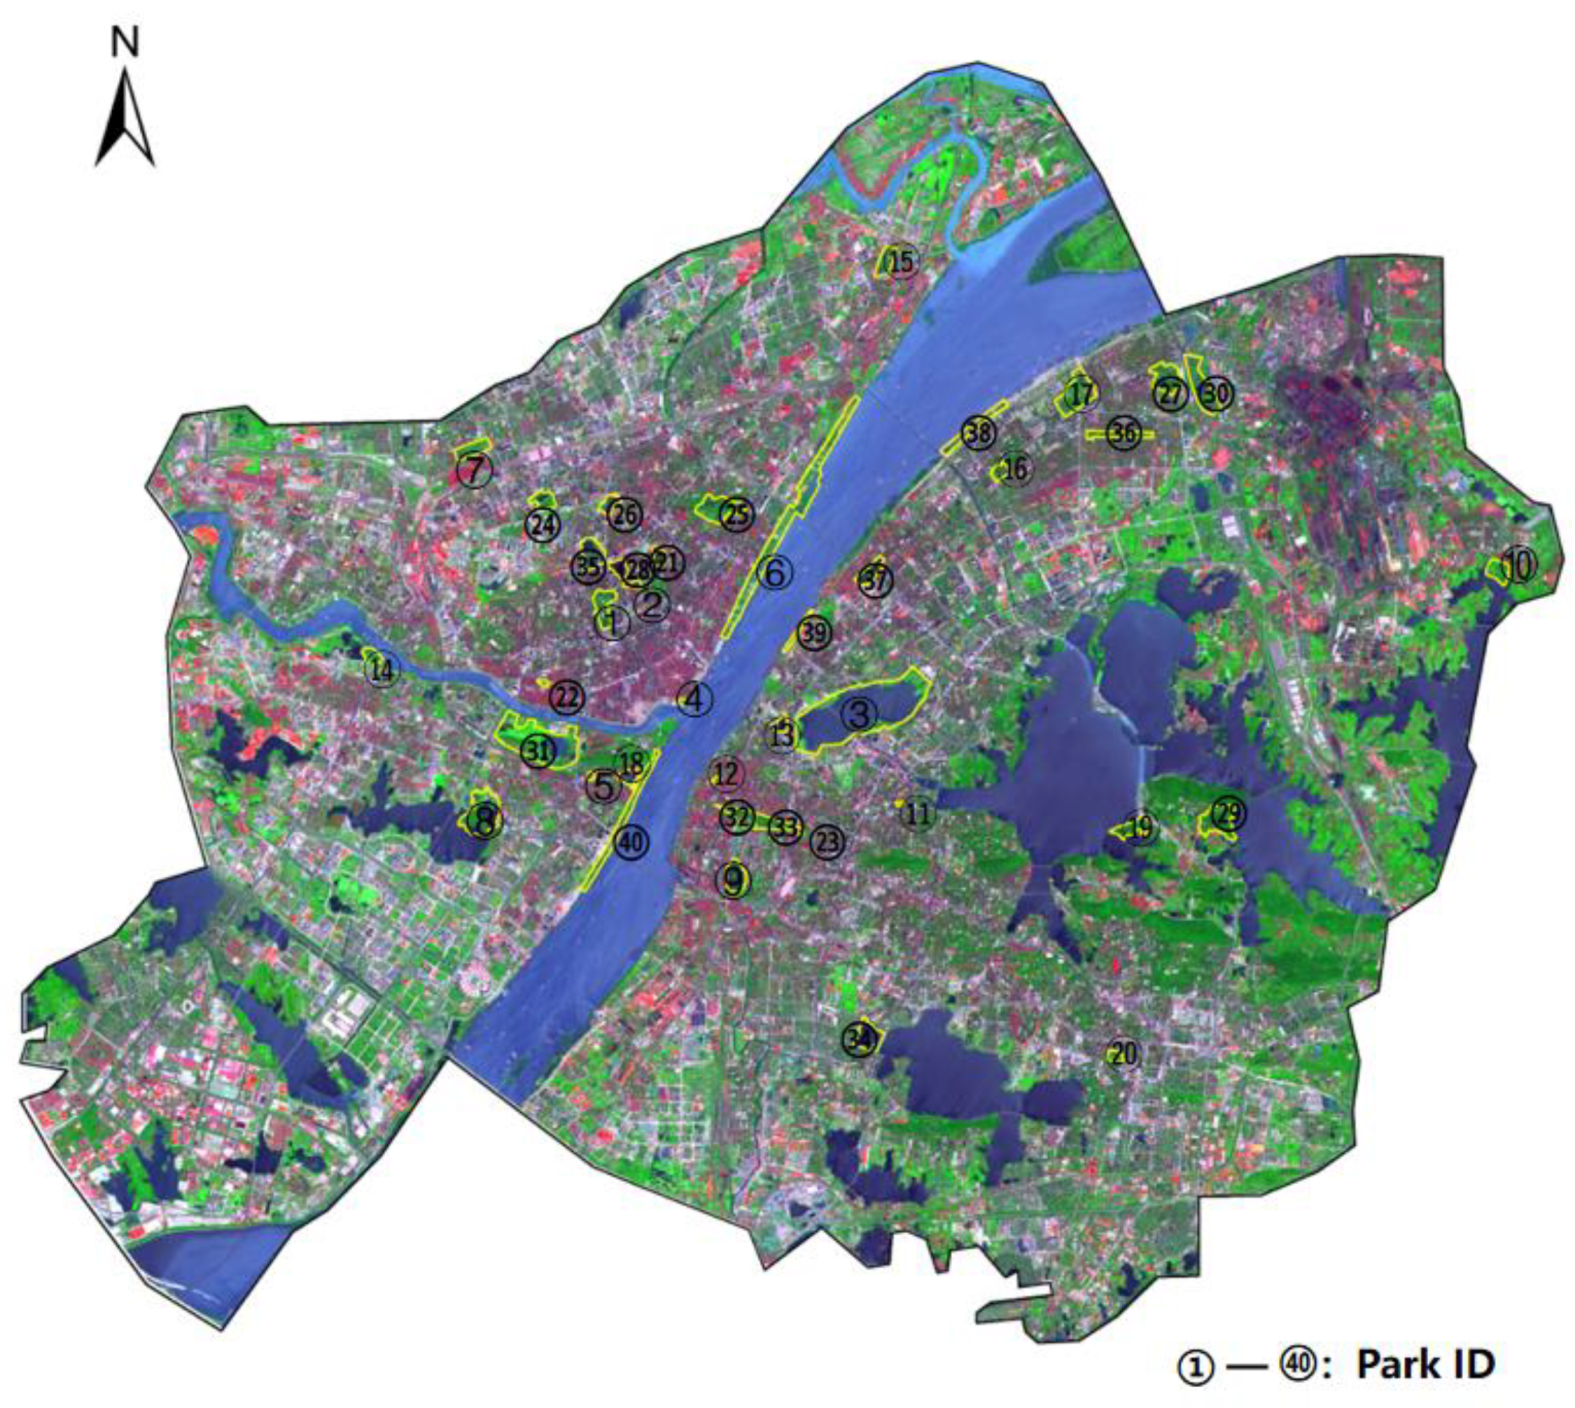
2.1. Study Area

This study was conducted in Wuhan (113°41′~115°05′ E, 29°58′~31°22′ N), the capital of Hubei province in China, and the largest city of Central China and the Yangtze River Economic Belt. In recent years, Wuhan has been experiencing rapid development and spatial expansion, which led to a series of environmental problems. To explore how urban parks produce ecological benefits, 40 sample urban parks with varied locations, sizes, and land cover compositions were considered, as shown in Figure 1. Detailed information of each park is listed in Table 1.

2.2. Land Cover Classification

For each park, the boundary was delineated based on a Google Earth image and field investigation. The land cover in each park was divided into four categories: ① Forest:greater than 90% canopy cover by arbors and shrubs; ② Lawn: vegetated area covered by grass with less than 90% coverage of arbor sand shrubs; ③ Water: all water bodies in a park, including natural lakes, rivers, ponds, and artificial fountains;④ Built-up: impervious surfaces including buildings, squares, roads, and parking lots. For each land cover type, about 30 samples wererandomly selected to verify the classification accuracy. The overall classification accuracy is over 95%, which meets the research requirements.

2.3. Ecological Service Value Calculation

In most cities, the major air pollutants can be identified as particulates, carbon, nitrogen oxides, sulfur oxides, hydrocarbons, photochemical smog, and inorganic compounds [21]. In this study, CO2 sequestration, O2 generation, air temperature amelioration, SO2 removal, NOx removal, and dust interception were selected as the indexes of ecological benefits in air quality. As a kind of nature-based solution, urban vegetation was efficient in improving air quality through green leaves and dense canopies. However, urban parks differ in vegetation coverage, canopy density, leaf amount, and area. Thus, it is necessary to calculate the ecological benefits of different park components. For each park, the overall ecological service value can be calculated as
E = i = 1 3 j = 1 7 A i × Q i j × K j
where E is the ecosystem service value in improving air quality, i denotes the land cover type (referring to Forest, Lawn, and Water), j denotes the ecological service type (referring to CO2 sequestration, O2 generation, air temperature amelioration, SO2 removal, NOx removal, and dust interception), A i is the area of land cover type i, Q i j is the per unit benefit of land cover type i for ecological service type j, and K j is the per unit economic value of ecological service type j. The related information for economic valuation of ecological services for urban parks in the Wuhan urbanized area is summarized in Table 2.

2.3.1. CO2 Sequestration

The carbon sequestration amount of each park was calculated based on the sum of trees, shrubs, and grass using literature values. According to studies conducted in Wuhan, mean carbon sequestration per unit of forest land and grassland are 149.23 tonne/hm2 and 63.55 tonne/hm2, respectively [22]. Mean carbon sequestration per unit of water is 0.22 tonne/hm2, which was calculated based on photosynthesis of aquatic plants [23]. A carbon tax of US$150/tonne (about 1012Chinese Yuan (RMB)/tonne) of carbon emission from the Swedish government was adopted for valuing the ecological service of CO2 sequestration.

2.3.2. O2 Generation

Urban vegetation can generate O2 through photosynthesis. The O2 amount produced from urban parks depends on mean net leaf photosynthetic rate of plants in a park, which varies depending on forest, lawn, and water areas. Previous studies show that the mean O2 generation per unit forest, lawn, and water areas is 109.53 tonne/hm2, 46.18 tonne/hm2, and 0.17 tonne/hm2, respectively [22,23]. The cost of producing O2 through industrial processes was used in this study to estimate the benefit of O2 generation [22] at a value of 400RMB/tonne.

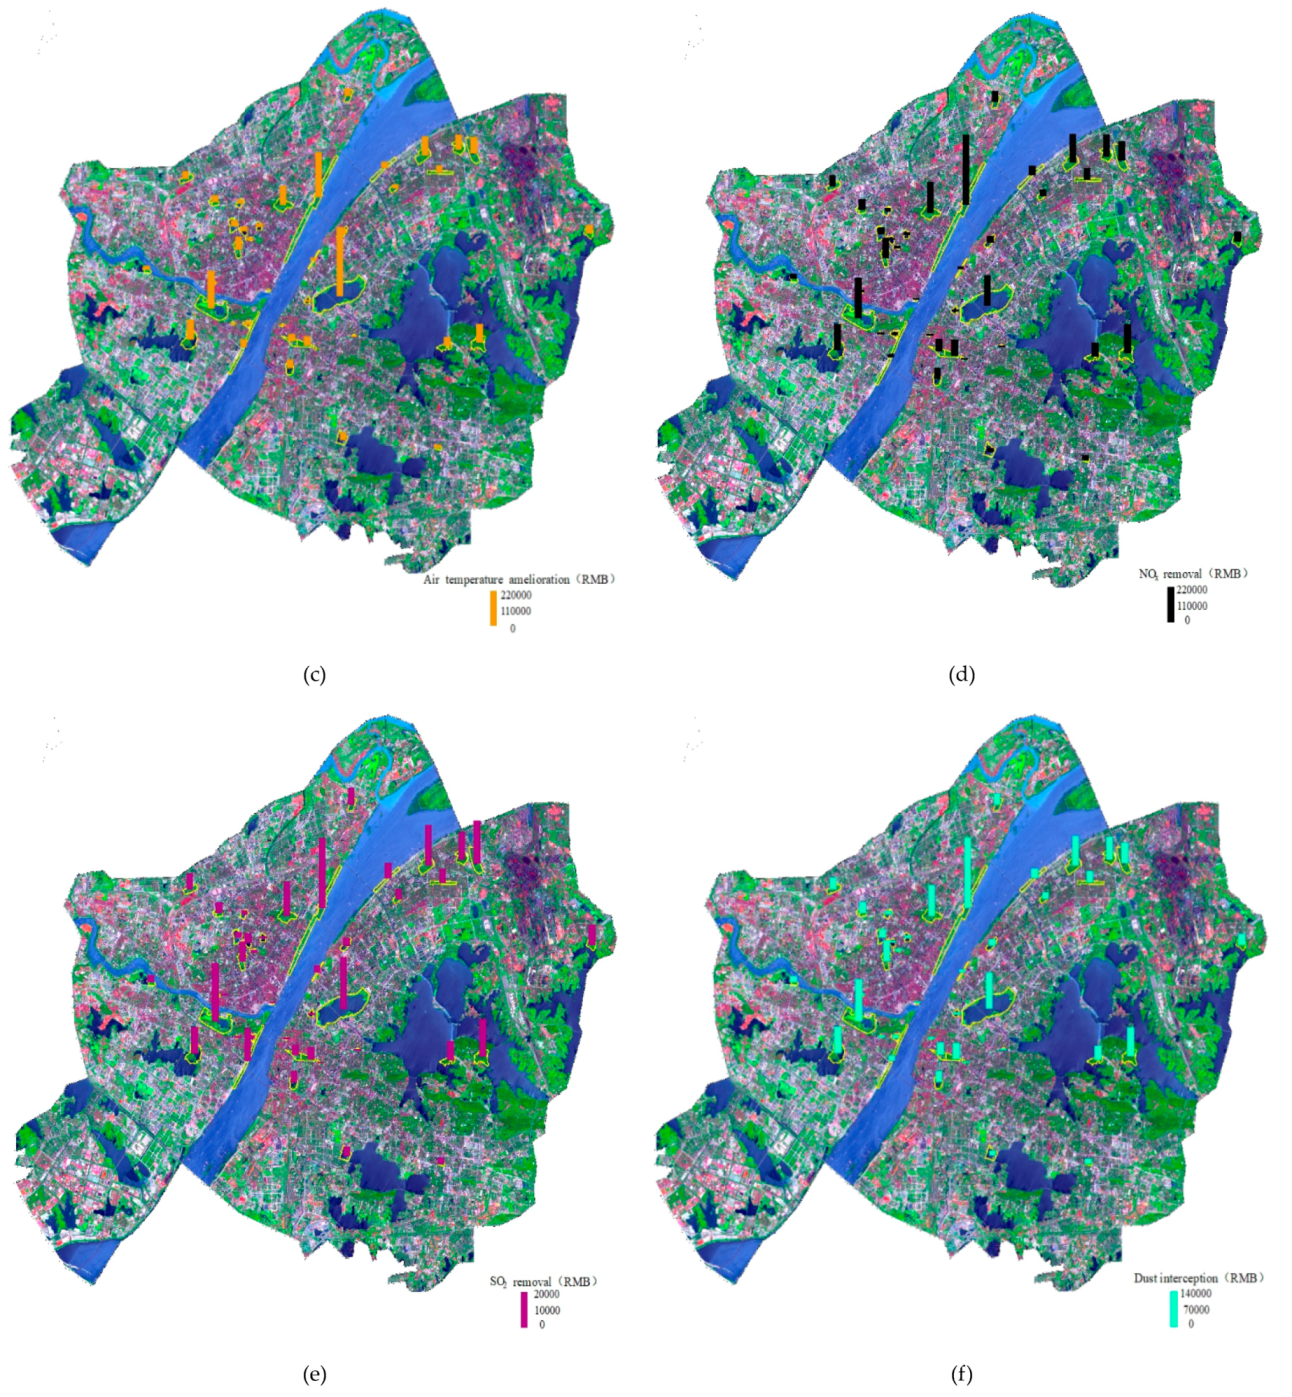
2.3.3. Air Temperature Amelioration

Urban parks provide the ecological service of air temperature amelioration through water vapor evaporation and plant transpiration. Average annual evaporation per unit water area in Wuhan is 927.1 mm. Based on the water area in parks, the overall evaporation of water bodies can be obtained. The ecological service value of evaporative cooling was calculated as 0.129RMB per unit [24]. For forest and grass areas, the transpiration amount is 22.61 × 10⁶KJ/hm2 and 11.75 × 10⁶KJ/hm2 per unit area [22], respectively. With the residential electricity price at 0.573RMB/kw·h [25], transpiration cooling can be valued.

2.3.4. SO2 Removal

The SO2 removal per unit forest area was based on the average amounts per broad-leaved and coniferous tree [26,27], with a value of 152.13kg/hm2. For the land cover type of lawn, the value is 279.03 kg/hm2 [27]. As aquatic plants absorb only a small amount of sulfur oxides from the atmosphere, the ecological service of SO2 removal by water was neglected in this study. According to the literature [28], the marginal cost of SO2 in China is 3RMB/kg, which can be used to determine the monetary value of the SO2 removal of each park.

2.3.5. NOx Removal

Previous studies have indicated that NOx removal per unit forest and unit grass land is 380 kg/hm2 and 6 kg/hm2, respectively [28,29]. The benefit of NOx removal in water bodies can be neglected. The vehicle exhaust denitrification treatment cost was used in calculating the ecological service value of NOx removal, with a value of 16,000RMB/tonne [30].

2.3.6. Dust Interception

The efficiency of urban plants in intercepting dust and particles is influenced by leaf characteristics, canopy structure, green space composition, rainfall, and precipitation density. Based on the literature, dust retention per unit area of trees and shrubs wasaveraged to estimate the unit dust interception forforest land cover. The dust amounts intercepted per forest, grass, and water area are 24.57 tonne/hm2, 2.6 tonne/hm2 [22], and 49.8 tonne/km2 [31], respectively. In China, the industrial dust control cost is about 170 RMB/tonne, which was adopted as the reference for calculating ecological service values in the present study.

3. Results

3.1. Park Composition

As introduced in the previous chapter, we considered four typical land cover compositions for each urban park: forest, lawn, water, and built-up. Table 1 shows the corresponding areas, with Sha Lake Park (Park ID: 3) having the largest total area of 324.62 hm2 and Shuiguo Lake Park (ParkID: 11) having the smallest total area of only 1.38 hm2. In terms of percentage of each land cover type, we focused on forest, lawn, and water since built-up was not taken into consideration in the subsequent ecological service value calculation. Table 1 shows that Spring Park (ParkID: 28) exhibited the maximum composition percentage for water at 82.92%, and the maximum composition percentage for forest was in Shouyi Park (ParkID: 33) with 72.49%, while the maximum value for lawn was 46.02% in Hanyang Beach Park (ParkID: 39). The various composition percentages of land types in the parks contributed to different ecological service functions and resulted in significant disparity in total ecological values.

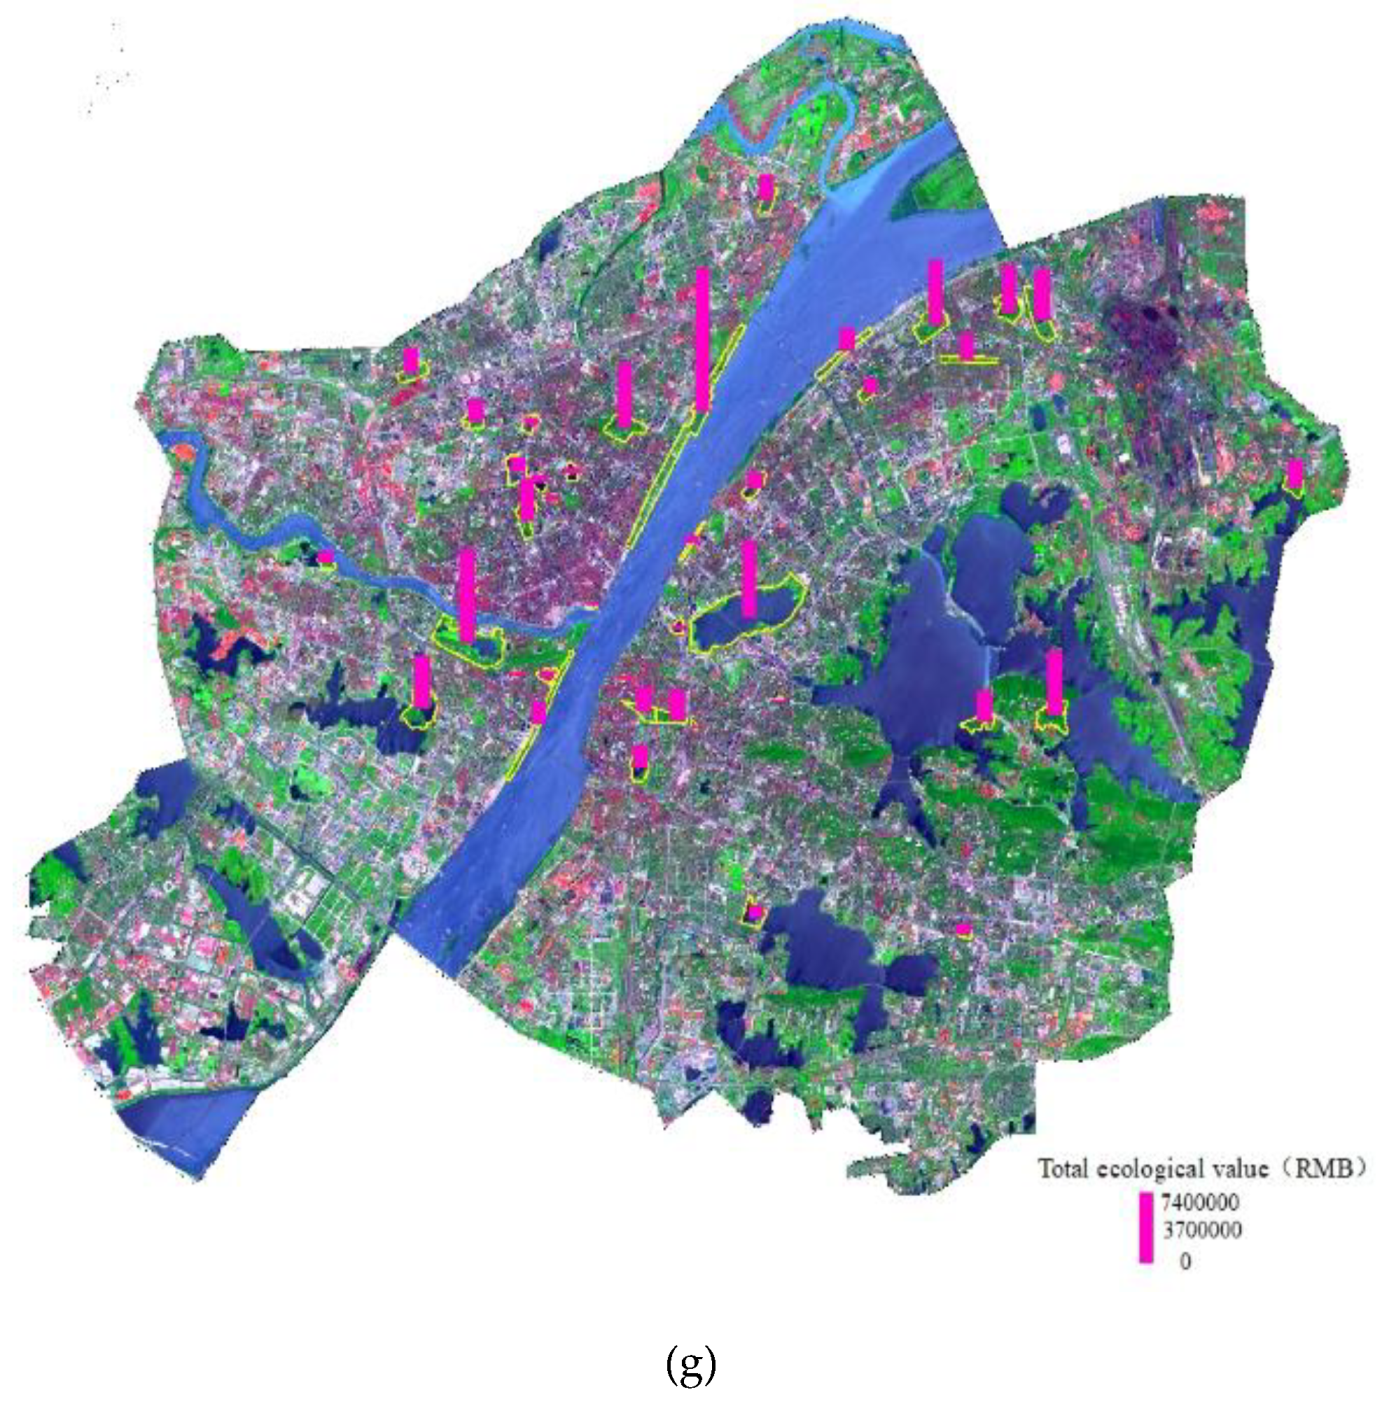
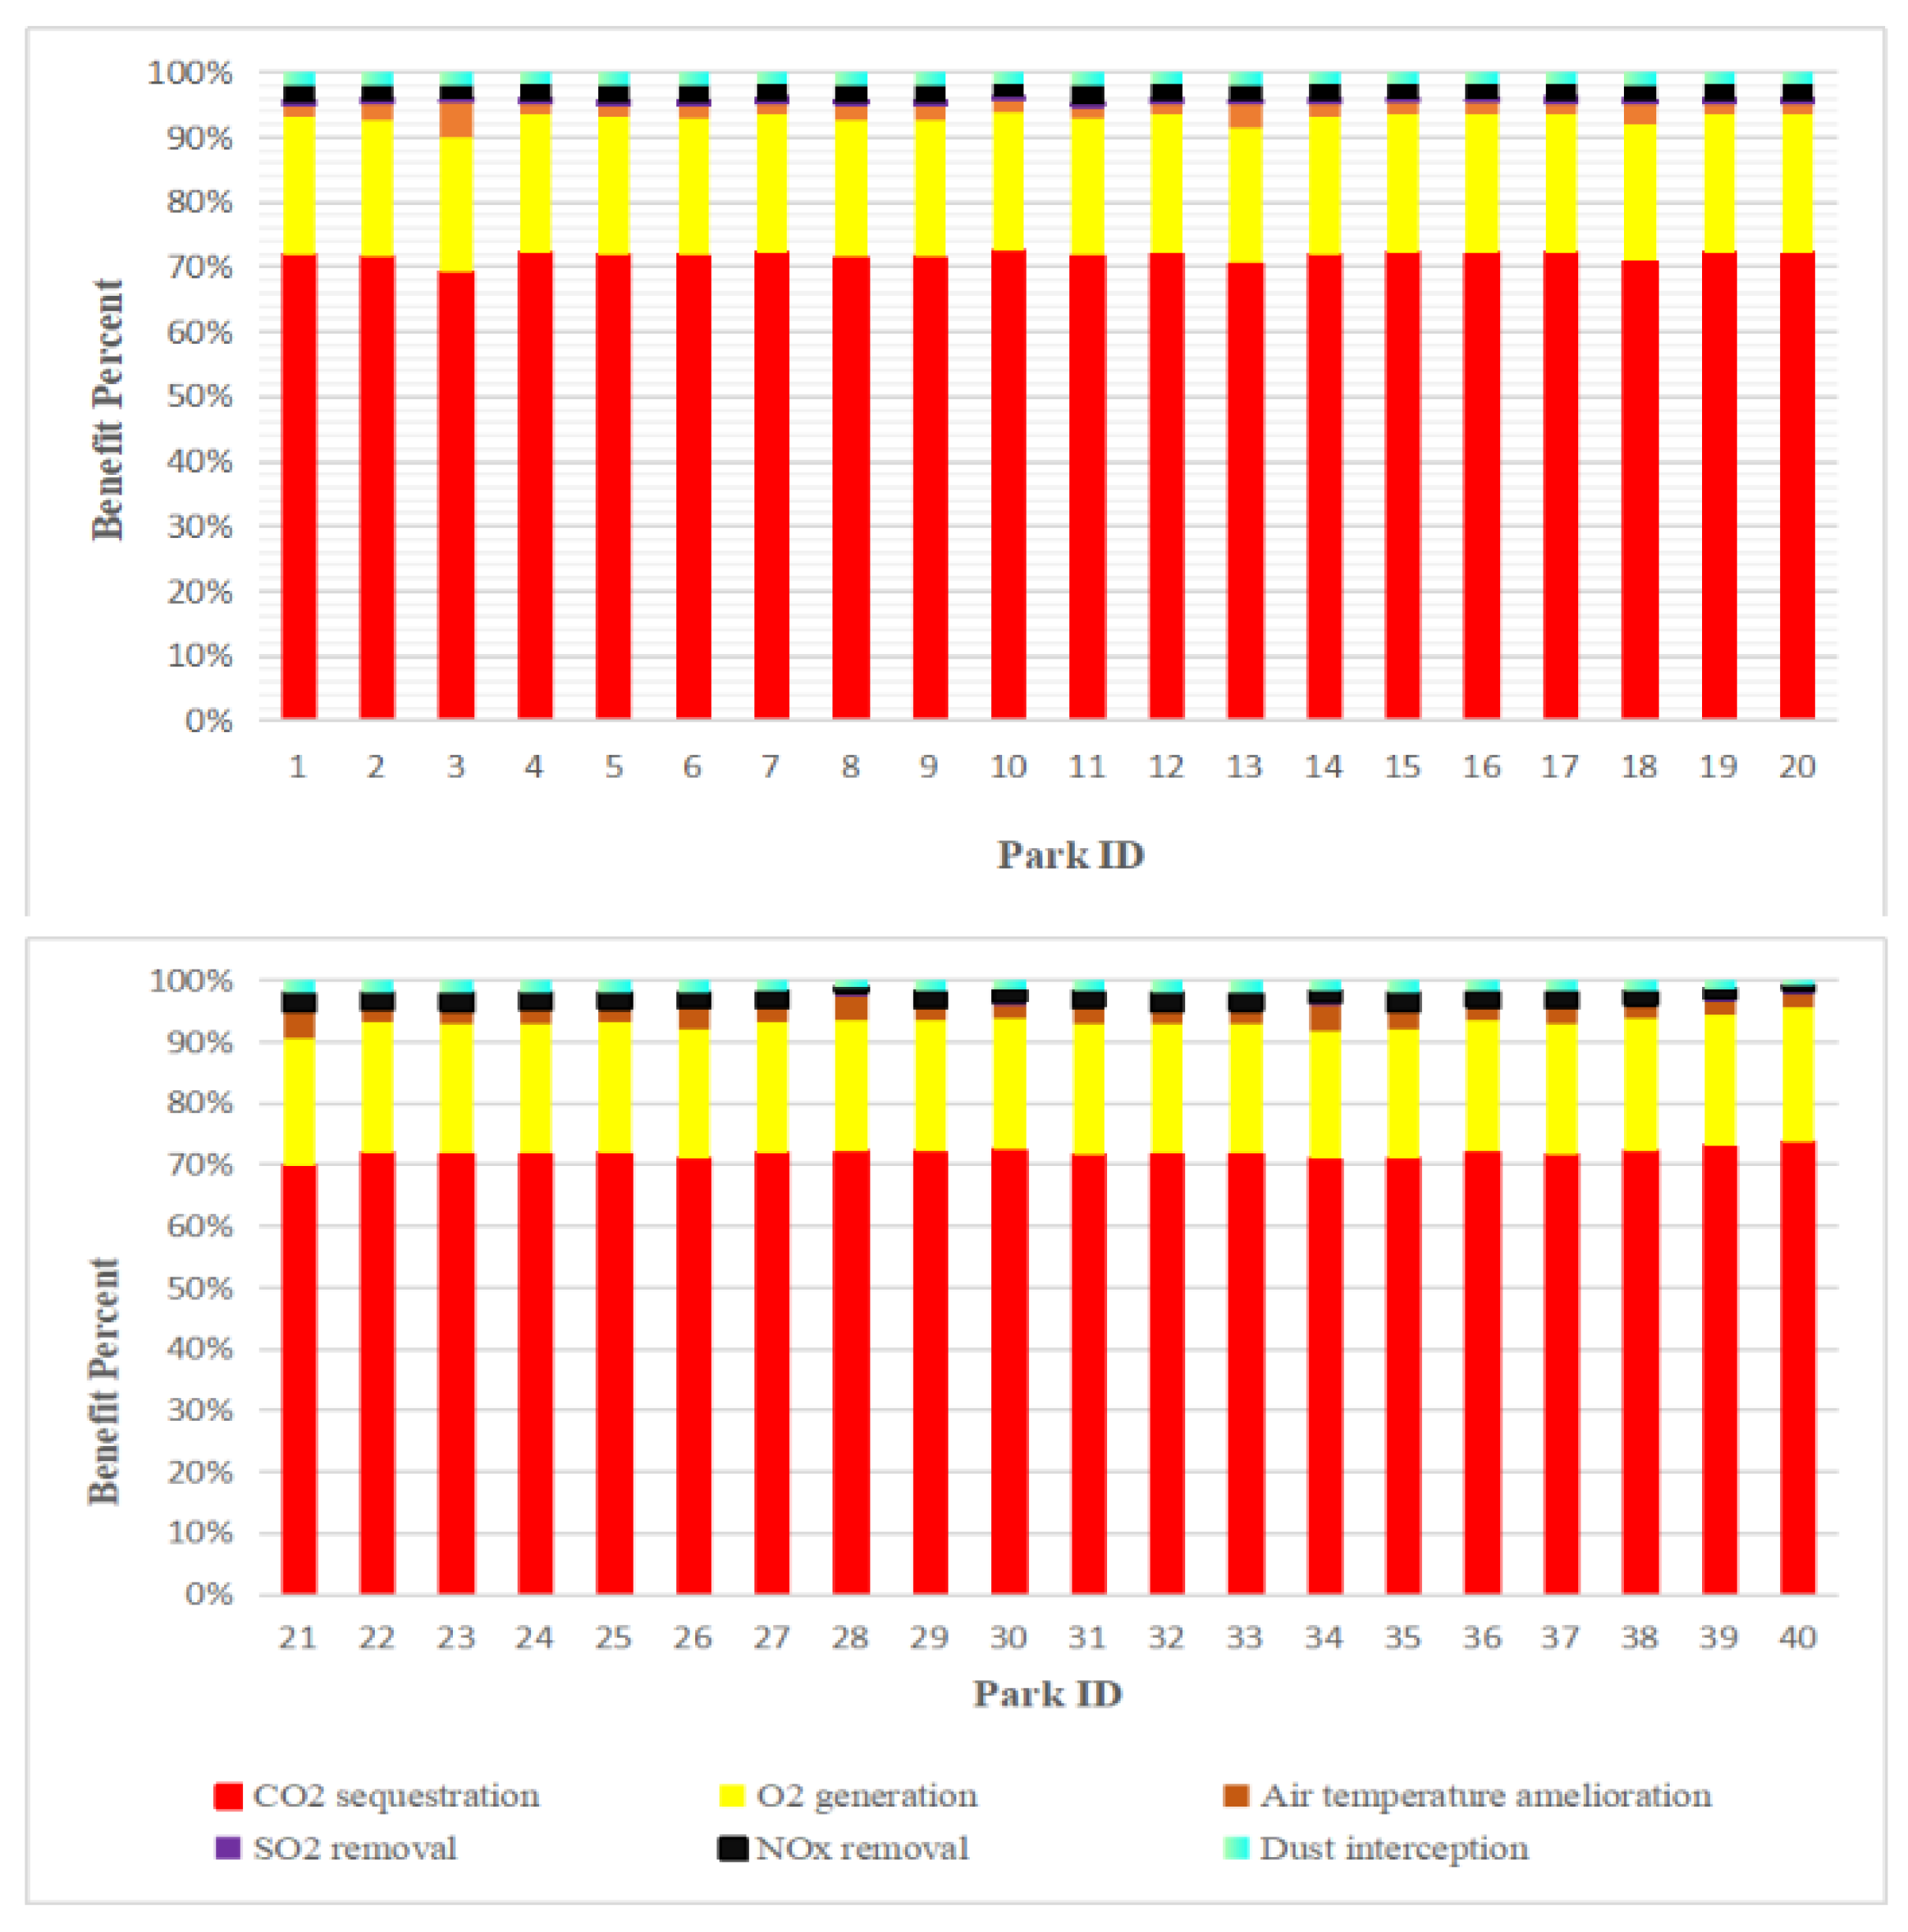
3.2. Ecological Service Values

To compare the service values of the previously mentioned ecological functions among urban parks, we calculated the ecological service values for CO2 sequestration, O2 generation, air temperature amelioration, SO2 removal, NOx removal, dust interception, and the total value for each park. These values were plotted as colored bars at the location of each park in the map, as shown in Figure 2, with bar length indicating the corresponding value of each ecological function. The figure shows that the parks generally showed consistent performance for the various ecological functions proportional to park area, i.e., the parks with larger area contributed larger amounts to the total ecological values, as shown in Figure 2g, and the parks showing larger/smaller values for one ecological function generally showed larger/smaller values for the other functions, as shown in Figure 2a–f. However, Jiefang Park (ParkID: 25) with a limited area of 46.78 hm2 was an exception, showing the largest ecological service values for CO2 sequestration, O2 generation, SO2 removal, NOx removal, dust interception, and total ecological value. These results were due to the rather large composition percentage (63.47%) of forest land type in Jiefang Park. Comparatively, Sha Lake Park (ParkID: 3) with the largest area (324.62 hm2) had a composition percentage of 8.69% for forest, with the largest composition percentage for water (79.87%).
As shown in Figure 2, urban parks play an important role in each ecological function. However, various service values must be considered to investigate the proportion of each function to the total ecological value; Figure 3 plots the benefit percentages of the six ecological functions for each urban park. Overall, the parks showed consistent order of the proportions of ecological function, in descending order of CO2 sequestration, O2 generation, air temperature amelioration, NOx removal, dust interception, and SO2 removal. The greatest ecological service contribution to CO2 sequestration produced a benefit percentage of 69.34% to 73.76%, while the smallest percentage forSO2 removal ranged from 0.21% to 0.81%.

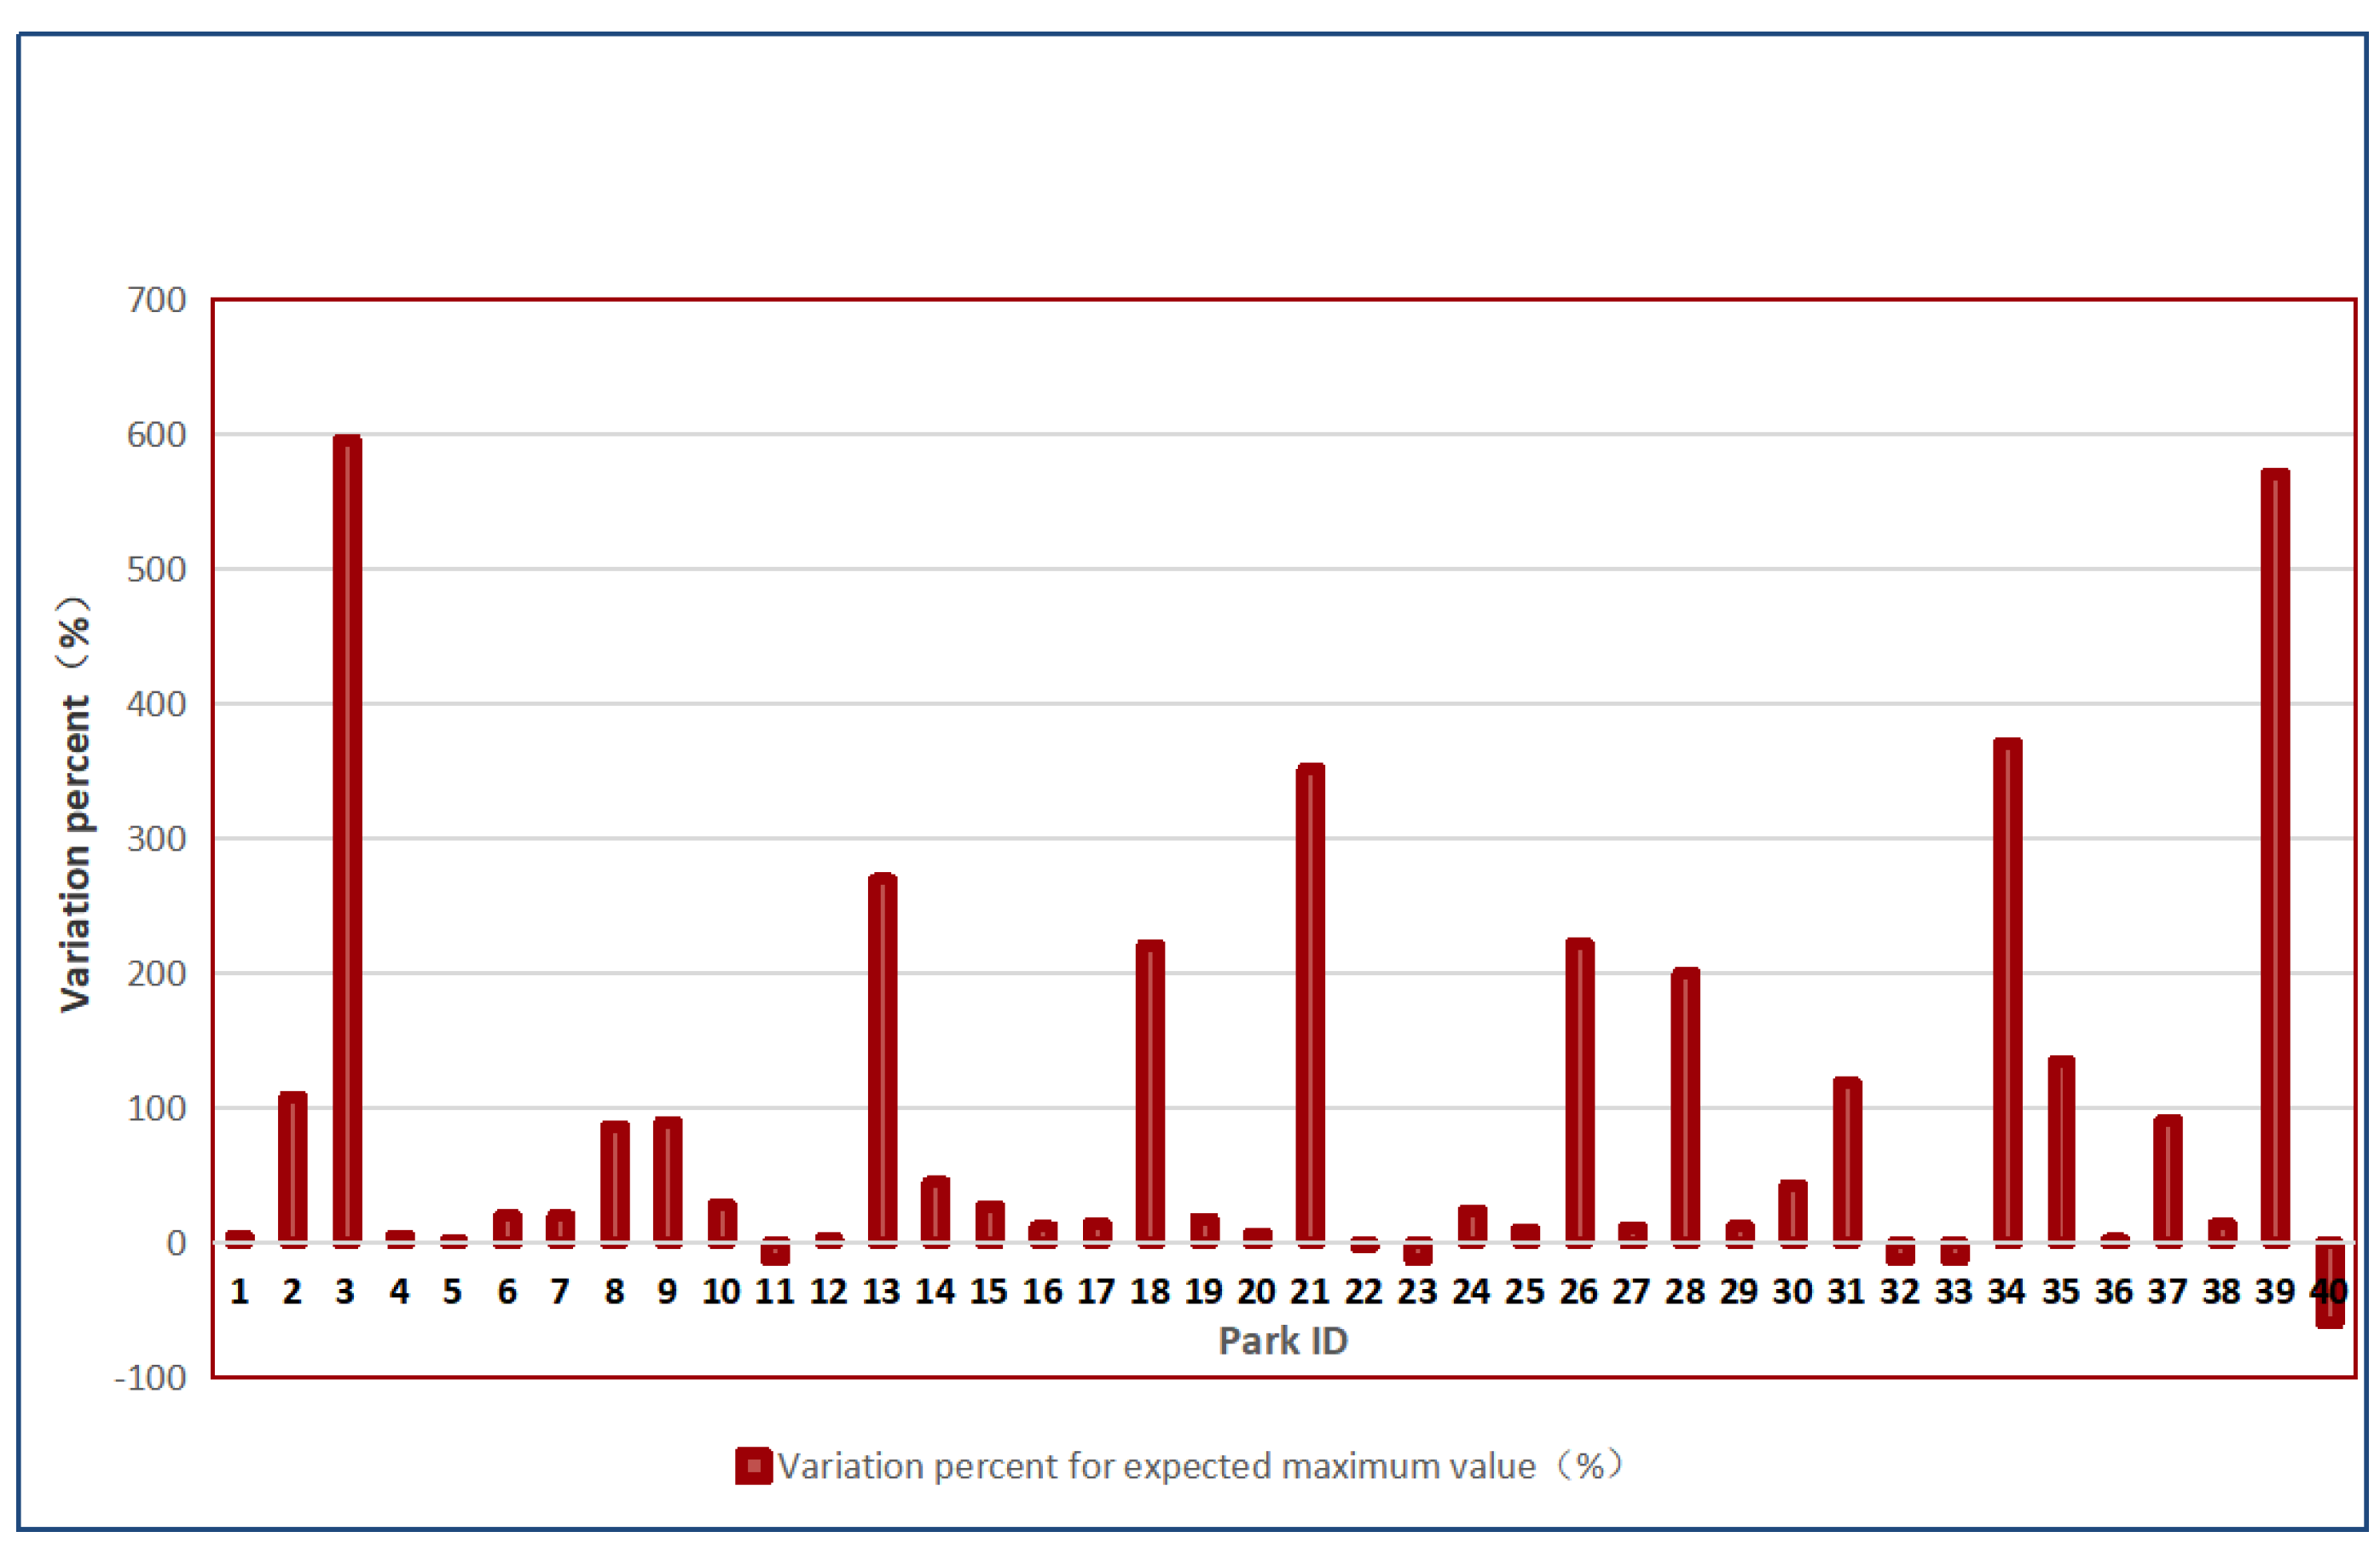
3.3. Response of Ecological Service Values to Park Composition

Land cover type had various effects on the service values of different ecological functions. To determine the dominant land cover type for each function and the total ecological value, multivariate regression analysis was performed between the dependent variables (i.e., six ecological functions and total values) and independent variables (i.e., forest, lawn, and water areas). The regression equations and corresponding R2 values are listed in Table 3. For all ecological functions except air temperature amelioration, area of forest played a vital role in service value; the larger the area of forest, the greater the value of CO2 sequestration, O2 generation, NOx removal, dust interception, and SO2 removal. However, for air temperature amelioration, water bodies in a park produced a larger cooling effect than the forest, and the lawn showed little impact. Thus, water and forest were significant drivers of air temperature amelioration. NOx removal was only affected by forest. When considering total ecological value, the largest effect was produced by forest.

4. Discussion

4.1. Necessity

Most previous studies confirmed that urban green spaces produce multiple ecological benefits in improving air quality [1,2,8]. Ecosystem service values can be estimated based on the area of green space and the ecological benefits per unit green area. The latter were usually obtained by field measurements on small scale [8,12,15,22], providing accurate and instantaneous data. On a larger scale, they werereferenced from empirical values from the literature [18,20,23,26], which variedwith the pollution concentration, amount of precipitation, and green biomass in green spaces. In a given city, the influence of pollution level and rainfall on the ecological capacity of urban green space in air purification is generally negligible [1,8]. However, green biomass of green space depends on vegetation coverage and leaf area index. Green spaces with different composition, structure, and plant species have a different capacity forremoving pollutants from the atmosphere [15,16]. It is necessary to consider the area proportion of different elements in green space, rather than only the area of green space when calculating the ecological service values.
Table 4 lists the maximum, minimum, and average ecological benefits per unit for CO2 sequestration, O2 generation, SO2 removal, NOx removal, and dust interception based on 40 tested parks. Wide variation of ecological benefit per unit among parks was found for all selected ecosystem service types with higher standard deviation values. The highest standard deviation value was presented for the per unit benefit of SO2 removal, with a value of 108.03 kg/hm2 while the average value wasonly 115.31 kg/hm2. The biggest difference among parks is the per unit benefit of CO2 sequestration, and the maximum value was nearly 20 times the minimum one. For each park, the per unit ecological benefit is the total ecological benefit divided by park area. If land cover composition in a park was not considered in estimating ecological services, the obtained unit ecological benefits in this study would be equal to the empirical values from the literature. However, the actual values from the present study not only differed from the reference values but also varied among the tested parks (shown in Table 4).

4.2. Application

Considering the effects of various land cover types on the total ecological value, a larger proportion of forest showed the highest ecological value. Urban planning should maximize ecosystem service value while ensuring recreational functions of urban parks. Thus, this study attempted to explore the variation of total ecological values with changes in land cover composition of parks while neglecting the built-up type to ensure basic recreational function. To indicate the discrepancy of ecological values caused by different land cover proportions (except built-up), we selected two typical urban parks, Jiefang Park (Park ID: 25) and Xingfuwan Park (Park ID: 34), which had land cover areas of forest, lawn, and water at 29.69 hm2, 7.22 hm2, and 4.47 hm2 and at 3.30 hm2, 4.35 hm2, 20.72 hm2, respectively. The corresponding composition percentages of forest, lawn, and water for these two parks were 81.70%, 12.85%, and 5.45% and 11.63%, 15.33%, and 73.04%, respectively. These values were selected as the expected maximum/minimum cases to update the corresponding area of each land cover area and to generate total ecological values for all urban parks. Results are shown in Figure 4, with positive/negative variation percentage indicating the expected increase/decrease in total ecological value for each park.
Based on the expected maximum case, with a reasonably large proportion of forest, most of the parks could achieve a significant increase in total ecological value; in particular, Sha Lake Park (Park ID: 3) could obtain an increase as large as 600%. However, based on the expected minimum case, all but two parks exhibited a serious decrease in total ecological value, varying from 4.13% to 91.49%. The overall results indicate that a reasonable proportion of land cover type can lead to significant variation in total ecological value, with a larger percentage of forest contributing to greater ecological values.

4.3. Limitation and Prospects

Ecosystem service values of urban parks in improving air quality were assessed based on the literature results. The empirical values mainly came from our study area, which reduces the impact of regional climate, pollution level, and plant species on benefit production of green space. The studies we referred to were conducted on sunny days in different seasons, with varied urban contexts taken into consideration. When calculating ecological service value, the benefit differences of forest, grassland, and water bodies within the parks were considered, which effectively improved the estimation accuracy. However, the exact information on vegetation structure, species composition, and canopy density of the urban parks was not clear, which could partly influence the research results. Understanding the subtle structural differences in green spaces demands a spatially explicit design, with high spatial resolution [12]. As in some previous studies [8,23,26], this study did not consider the impact of environmental pollution condition on park air purification capacity. In other words, our investigation assumed that there were no differences among the estimated parks in terms of air pollution concentration and deposition velocity. This may have a slight impact on the estimates. In addition, estimation of ecosystem services mainly involved the removal of pollutants from the atmosphere, excluding those from the soil. Material and energy exchange between the surface and the near surface is significantly affected by land surface characteristics [32,33], which have a high degree of spatial heterogeneity in urban areas. Exchange mechanism of soil and air pollutants at a local scale should be considered in related research and scaled up to that of city scale. Urban parks provide a lot of benefits of air purification for urban residents, especially for those living near the parks. Most of them are high-income people, who can share larger park areas and enjoy more health promotion and well-being than low-income ones [34,35]. Future work could pay more attention to the social equity of urban parks.

5. Conclusions

Combined with previous research results, high-resolution images were used to assess the ecosystem services of urban parks with different areas and land cover compositions. Six typical ecological service functions of CO2 sequestration, O2 generation, air temperature amelioration, SO2 removal, NOx removal, and dust interception were estimated. There was very wide variation of ecosystem service value among urban parks, with the maximum value of more than 14 million RMB being almost 1000 times larger than the minimum. However, all urban parks showed similar proportions of the different ecological benefits. The ecological services of CO2 sequestration and O2 generation contributed most to the total ecosystem service value, with percentages ranging from 69.35% to 73.77% and from 20.52% to 21.71%, respectively (see Table A1 in Appendix A). Urban parks were confirmed to be important natural carbon sinks and oxygen sources. Although the other four ecological services had relatively lower values and proportions, they are also of great significance for improving urban air quality.
Land cover composition for a given park significantly influences the ecosystem service values. The ecological service of air temperature amelioration from forest coverage was almost equal to that of water bodies, and forest area played a dominant role in ecological service assessment. If all sample parks in this study were redesigned with areasonable land cover composition, the total services values would be greatly increased, with the largest increase up to 600%. Through proper planning, design, and management of urban green spaces, ecological benefit can be maximized. The findings herein provide sound scientific information for urban planners and green designers to optimize urban park layout.

Author Contributions

Conceptualization, Q.X.; methodology, Y.Y.; software, Q.X. and Y.Y.; validation, S.W.K.; formal analysis, S.W.K.; investigation, Y.Y. and Q.S.; resources, Q.S.; data curation, Y.Y.; writing—original draft preparation, Q.X. and S.C.; writing—review and editing, S.-B.L. and S.W.K.; visualization, S.C.; supervision, S.C.; project administration, Q.X.; funding acquisition, Q.X. and S.C.

Funding

This research was sponsored by the National Natural Science Foundation of China (41401186), the Natural Science Foundation of Hubei Province of China (2019CFB538), and the Natural Science Foundation of Hubei Province of China (2019CFB188). Kim was partially supported by the Basic Science Research Program through the National Research Foundation of Korea (NRF) funded by the Ministry of Education (NRF-2018R1D1A1B07045804). Lee was supported by a 2017 sabbatical year research grant of University of Seoul.

Conflicts of Interest

The authors declare no conflict of interest.

Appendix A

Table A1. Ecological service values and the corresponding percentages of urban parks.
Park IDCO2 SequestrationO2 GenerationAir Temperature AmeliorationSO2 RemovalNOx RemovalDust InterceptionTotal Value
ValuePercentageValuePercentageValuePercentageValuePercentageValuePercentageValuePercentage
13,090,276 71.83 915,939 21.29 80,222 1.86 11,245 0.26 120,547 2.80 84,098 1.95 4,302,426
2304,437 71.51 90,176 21.18 10,665 2.51 1305 0.31 11,084 2.60 8046 1.89 425,812
35,482,957 69.35 1,622,348 20.52 448,910 5.68 29,483 0.37 173,920 2.20 148,875 1.88 7,906,591
4141,551 72.12 41,918 21.36 3555 1.81 642 0.33 5033 2.56 3577 1.82 196,375
5240,763 71.89 71,354 21.31 6067 1.81 899 0.27 9307 2.78 6493 1.94 334,981
610,694,486 71.80 3,169,452 21.28 289,220 1.94 40,053 0.27 412,660 2.77 289,385 1.94 14,895,354
71,882,886 72.12 557,436 21.35 49,746 1.91 9069 0.35 64,849 2.48 46,609 1.79 2,610,694
83,979,627 71.47 1,179,357 21.18 132,515 2.38 15,101 0.27 152,552 2.74 108,879 1.96 5,568,129
91,633,224 71.48 483,964 21.18 54,713 2.39 6335 0.28 62,068 2.72 44,413 1.94 2,284,816
101,897,092 72.43 561,025 21.42 50,282 1.92 11,276 0.43 57,052 2.18 42,451 1.62 2,619,275
11105,352 71.77 31,242 21.28 2566 1.75 325 0.22 4336 2.95 2979 2.03 146,899
12207,301 72.05 61,405 21.34 5178 1.80 885 0.31 7584 2.64 5353 1.86 287,803
13257,225 70.66 76,198 20.93 12,992 3.57 1080 0.30 9413 2.59 7104 1.95 364,110
14869,847 71.95 257,561 21.30 25,091 2.08 4053 0.34 30,469 2.52 21,958 1.82 1,209,078
151,782,214 72.21 527,434 21.37 47,846 1.94 9271 0.38 58,714 2.38 42,715 1.73 2,468,292
161,058,295 72.28 313,202 21.39 26,942 1.84 5482 0.37 34,970 2.39 25,319 1.73 1,464,308
174,833,109 72.16 1,430,848 21.36 124,964 1.87 23,328 0.35 166,300 2.48 119,361 1.78 6,698,008
18383,371 70.95 113,552 21.02 17,513 3.24 1659 0.31 13,859 2.56 10,364 1.92 540,417
192,302,328 72.10 681,685 21.35 60,536 1.90 10,842 0.34 80,259 2.51 57,497 1.80 3,193,245
20692,797 72.08 205,177 21.35 17,608 1.83 3087 0.32 24,835 2.58 17,632 1.83 961,236
21283,197 69.91 83,984 20.73 16,777 4.14 869 0.21 11,579 2.86 8657 2.14 405,161
22258,827 71.85 76,720 21.30 6520 1.81 923 0.26 10,173 2.82 7071 1.96 360,332
23116,353 71.77 34,505 21.28 2834 1.75 359 0.22 4788 2.95 3290 2.03 162,227
241,617,569 71.78 479,382 21.27 44,380 1.97 6079 0.27 62,329 2.77 43,768 1.94 2,253,605
254,841,938 71.94 1,434,550 21.31 125,702 1.87 19,598 0.29 181,212 2.69 127,586 1.90 6,730,684
26465,169 70.95 137,779 21.01 21,324 3.25 2017 0.31 16,796 2.56 12,570 1.92 655,754
273,551,305 72.01 1,051,809 21.33 93,640 1.90 15,611 0.32 128,102 2.60 91,056 1.85 4,931,622
28512,417 72.18 150,870 21.25 27,471 3.87 5351 0.75 6342 0.89 7491 1.06 710,041
294,763,146 72.09 1,410,503 21.35 123,067 1.86 21,715 0.33 168,835 2.56 120,324 1.82 6,607,687
303,875,449 72.48 1,145,616 21.43 107,043 2.00 24,649 0.46 110,257 2.06 83,590 1.56 5,346,702
316,899,971 71.63 2,042,699 21.21 245,946 2.55 33,450 0.35 236,183 2.45 174,461 1.81 9,632,807
321,682,112 71.77 498,835 21.28 40,975 1.75 5196 0.22 69,226 2.95 47,557 2.03 2,343,999
332,230,426 71.77 661,439 21.28 54,331 1.75 6890 0.22 91,791 2.95 63,059 2.03 3,108,034
34765,637 70.91 226,248 20.95 44,788 4.15 5146 0.48 20,478 1.90 17,458 1.62 1,079,853
351,010,351 71.02 299,624 21.06 38,657 2.72 3113 0.22 41,472 2.92 29,490 2.07 1,422,805
361,865,372 72.05 552,563 21.34 46,564 1.80 7904 0.31 68,462 2.64 48,285 1.86 2,589,248
37983,218 71.64 291,205 21.22 32,738 2.39 4322 0.31 35,399 2.58 25,650 1.87 1,372,631
381,583,252 72.32 468,489 21.40 40,440 1.85 8457 0.39 51,326 2.34 37,347 1.71 2,189,408
39469,788 72.98 138,649 21.54 12,659 1.97 3765 0.58 10,359 1.61 8470 1.32 643,789
401,731,614 73.77 509,513 21.71 49,466 2.11 19,216 0.82 17,473 0.74 20,117 0.86 2,347,498
Note: Value indicates the ecological service value foreach function, unit: RMB; total value indicates the total ecological service value by summing all functions, unit: RMB; percentage indicates the ratio of ecological service value foreach function and the total ecological service value, unit: %.

References

  1. Tzoulas, K.; Korpela, K.; Venn, S.; Yli-Pelkonen, V.; Kaz’miercak, A.; Niemela, J.; James, P. Promoting ecosystem and human health in urban areas using greens pace infrastructure: A literature review. Landsc. Urban Plan. 2007, 81, 167–178. [Google Scholar] [CrossRef]
  2. Zupancic, T.; Westmacott, C.; Bulthuis, M. The Impact of Green Space on Heat and Air Pollution in Urban Communities: A Meta-Narrative Systematic Review; David Suzuki Foundation: Vancouver, BC, Canada, 2015. [Google Scholar]
  3. Stone, B. Urban sprawl and air quality in large US cities. J. Environ. Manag. 2008, 86, 688–698. [Google Scholar] [CrossRef]
  4. Carpentieri, M.; Robins, A.G. Influence of urban morphology on air flow over building arrays. J. Wind. Eng. Ind. Aerodyn. 2015, 145, 61–74. [Google Scholar] [CrossRef]
  5. Huang, J.; Li, F.; Zeng, G.; Liu, W.; Huang, X.; Xiao, Z.; Wu, H.; Gu, Y.; Li, X.; He, X.; et al. Integrating hierarchical bioavailability and population distribution into potential eco-risk assessment of heavymetals in road dust: A case study in Xiandao District, Changsha city, China. Sci. Total Environ. 2016, 541, 969–976. [Google Scholar] [CrossRef]
  6. Zeng, J.; Liu, Y.; Feiock, R.; Li, F. The impacts of China’s provincial energy policies on major air pollutants: A spatial econometric analysis. Energy Policy 2019, 132, 392–403. [Google Scholar] [CrossRef]
  7. Ding, Y.; Li, G.C.; Lu, X.; Gao, M. Spatial Heterogeneity and Air Pollution Removal by Green Space in Greater Pearl River Delta. Prog. Geogr. 2011, 30, 1415–1421. [Google Scholar]
  8. Jayasooriya, V.; Ng, A.; Muthukumaran, S.; Perera, B. Green infrastructure practices for improvement of urban air quality. Urban For. Urban Green. 2017, 21, 34–47. [Google Scholar] [CrossRef]
  9. Liu, H.; Li, F.; Xu, L.; Han, B. The impact of socio-demographic, environmental, and individual factors on urban park visitation in Beijing, China. J. Clean. Prod. 2017, 163, S181–S188. [Google Scholar] [CrossRef]
  10. Pietrzyk-Kaszy´nska, N.; Czepkiewicz, M.; Kronenberg, J. Eliciting non-monetary values of formal and informal urban green spaces using public participation GIS. Landsc. Urban Plan. 2017, 160, 85–95. [Google Scholar] [CrossRef]
  11. Cohen, P.; Potchter, O.; Schnell, I. A methodological approach to the environmental quantitative assessment of urban parks. Appl. Geogr. 2014, 48, 87–101. [Google Scholar] [CrossRef]
  12. Vieira, J.; Matos, P.; Mexia, T.; Silva, P.; Lopes, N.; Freitas, C.; Correia, O.; Santos-Reis, M.; Branquinho, C.; Pinho, P. Green spaces are not all the same for the provision of air purification and climate regulation services: The case of urban parks. Environ. Res. 2018, 160, 306–313. [Google Scholar] [CrossRef] [PubMed]
  13. McDonald, A.; Bealey, W.; Fowler, D.; Dragosits, U.; Skiba, U.; Smith, R.; Donovan, R.; Brett, H.; Hewitt, C.N.; Nemitz, E. Quantifying the effect of urban tree planting on concentrations and depositions of PM10 in two UK conurbations. Atmos. Environ. 2007, 41, 8455–8467. [Google Scholar] [CrossRef]
  14. Cavanagh, J.A.E.; Zawar-Reza, P.; Wilson, J.G. Spatial attenuation of ambient particulate matters air pollution within an urbanized native forest patch. Urban For. Urban Green. 2009, 8, 21–30. [Google Scholar] [CrossRef]
  15. Yin, S.; Shen, Z.; Zhou, P.; Zou, X.; Che, S.; Wang, W. Quantifying air pollution attenuation within urban parks: An experimental approach in Shanghai, China. Environ. Pollut. 2011, 159, 2155–2163. [Google Scholar] [CrossRef] [PubMed]
  16. Xie, Q.; Zhou, Z.; Chen, F. Quantifying the Beneficial Effect of Different Plant Species in Improving Air Quality. Environ. Eng. Manag. J. 2011, 10, 959–963. [Google Scholar]
  17. Mexia, T.; Vieira, J.; Príncipe, A.; Anjos, A.; Silva, P.; Lopes, N.; Freitas, C.; Santos-Reis, M.; Correia, O.; Branquinho, C.; et al. Ecosystem services: Urban parks under a magnifying glass. Environ. Res. 2018, 160, 469–478. [Google Scholar] [CrossRef]
  18. Davies, Z.G.; Edmondson, J.L.; Heinemeyer, A.; Leake, J.R.; Gaston, K.J. Mapping an urban ecosystem service: Quantifying above-ground carbon storage at a city-wide scale. J. Appl. Ecol. 2011, 48, 1125–1134. [Google Scholar] [CrossRef]
  19. Senanayake, I.; Welivitiya, W.; Nadeeka, P. Urban green spaces analysis for development planning in Colombo, Sri Lanka, utilizing THEOS satellite imagery—A remote sensing and GIS approach. Urban For. Urban Green. 2013, 12, 307–314. [Google Scholar] [CrossRef]
  20. Karagulian, F.; Belis, C.A.; Dora, C.F.C.; Prüss-Ustün, A.M.; Bonjour, S.; Adair-Rohani, H.; Amann, M. Contributions to cities’ ambient particulate matter (PM): A systematic review of local source contributions at global level. Atmos. Environ. 2015, 120, 475–483. [Google Scholar] [CrossRef]
  21. Ileperuma, O.A. Environmental pollution in Sri Lanka: A review. J. Natl. Sci. Found. Sri Lanka. 2010, 28, 301–325. [Google Scholar] [CrossRef]
  22. Chen, F.; Zhou, Z.X.; Xiao, R.B.; Wang, P.C.; Li, H.F.; Guo, E.X. Estimation of ecosystem services of urban green-land in the workshop area of the Wuhan Iron and Steel Company. Acta Ecol. Sin. 2006, 26, 2229–2236. [Google Scholar]
  23. Wang, F.Z. Evaluation on the Ecosystem Services Values of Urban Lake Wetlands: A Case Study of Urban Lake in Wuhan City. Ph.D. Thesis, Huazhong Agriculture University, Wuhan, China, 2010. [Google Scholar]
  24. Kong, D.S.; Zhang, H. Economic value of wetland ecosystem services in the Heihe National Nature Reserve of Zhangye. Acta Ecol. Sin. 2015, 35, 972–983. [Google Scholar]
  25. Price Bureau. 2018. Available online: http://wh.bendibao.com/live/2019529/99151.shtm (accessed on 10 November 2019).
  26. Jin, F.; Lu, S.W.; Yu, X.X.; Rao, L.Y.; Niu, J.Z.; Xie, Y.Y.; Zhang, Z.M. Forest ecosystem service and its evaluation in China. Chin. J. Appl. Decol. 2005, 16, 1531–1536. [Google Scholar]
  27. Han, Y.; Zhou, Z. Evaluation on ecosystem services in haze absorption by urban green land and its spatial pattern analysis in Xi’an. Geogr. Res. 2015, 34, 1247–1258. [Google Scholar]
  28. Peng, J.; Wang, Y.L.; Chen, Y.F.; Li, W.F.; Jiang, Y.Y. Economic Value of Urban Ecosystem Services: A Case Study in S hen zhen. Acta Sci. Nat. Univ. Pekin. 2005, 41, 594–604. [Google Scholar]
  29. Duan, Y.B.; Lei, Y.K.; Wu, B.J.; Peng, D.D.; Tian, G.X. Evaluation and dynamic study on the ecological service value for urban green space system in Zhengzhou. Ecol. Sci. 2016, 35, 81–88. [Google Scholar]
  30. Zhang, X.L.; Xu, Z.J.; Zhang, Z.H.; Gu, D.Q.; Wang, L.H. Environment purification service value of urban green space ecosystem in Qingdao City. Acta Ecol. Sin. 2011, 31, 2576–2584. [Google Scholar]
  31. Xu, H.; Liu, X.Y.; An, Z.S.; Hou, Z.H.; Dong, J.B.; Liu, B. Spatial pattern of modern sedimentation rate of Qinghai lake and a preliminary estimate of the sediment flux. Chin. Sci. Bull. 2010, 55, 384–390. [Google Scholar] [CrossRef]
  32. Li, H.; Meier, F.; Lee, X.; Chakraborty, T.; Liu, J.; Schaap, M.; Sodoudi, S. Interaction between urban heat island and urban pollution island during summer in Berlin. Sci. Total Environ. 2018, 636, 818–828. [Google Scholar] [CrossRef]
  33. Zhou, C.S.; Li, S.J.; Wang, S.J. Examining the Impacts of Urban Form on Air Pollution in Developing Countries: A Case Study of China’s Megacities. Int. J. Environ. Res. Public Health 2018, 15, 1565. [Google Scholar] [CrossRef]
  34. Tan, P.Y.; Samsudin, R. Effects of spatial scale on assessment of spatial equity of urban park provision. Landsc. Urban Plan. 2017, 158, 139–154. [Google Scholar] [CrossRef]
  35. Rigolon, A.; Browning, M.; Jennings, V. Inequities in the quality of urban park systems: An environmental justice investigation of cities in the United States. Landsc. Urban Plan. 2018, 178, 156–169. [Google Scholar] [CrossRef]
Figure 1. Locations of selected urban parks.
Sustainability 11 06519 g001
Figure 2. Ecological service values for individual ecological functions and total ecological value for each urban park: (ag) represent CO2 sequestration, O2 generation, air temperature amelioration, SO2 removal, NOx removal, dust interception, and total ecological value, respectively.
Sustainability 11 06519 g002aSustainability 11 06519 g002bSustainability 11 06519 g002c
Figure 3. Percentages of ecological service values of each function in the total ecological value for selected urban parks.
Sustainability 11 06519 g003
Figure 4. Percentages of the expected maximum and minimum ecological service values for selected urban parks.
Sustainability 11 06519 g004aSustainability 11 06519 g004b
Table 1. Detailed information of the selected urban parks.
Park IDPark NameTotal Area (hm2)ForestLawnWaterBuilt-up
Area (hm2)PercentageArea (hm2)PercentageArea (hm2)PercentageArea (hm2)Percentage
1Zhongshan30.49 19.15 62.83%2.56 8.40%3.40 11.16%5.37 17.61%
2Xiaonanhu6.05 1.81 29.93%0.57 9.39%2.57 42.40%1.11 18.27%
3Sha Lake324.62 28.21 8.69%19.73 6.08%259.26 79.87%17.42 5.37%
4Longwangmiao1.92 0.83 43.31%0.32 16.74%0.00 0.00%0.77 39.96%
5Hanyang2.23 1.53 68.62%0.24 10.80%0.10 4.58%0.36 16.00%
6Hankou Beach147.13 67.70 46.01%10.94 7.43%21.01 14.28%47.48 32.27%
7Changqing23.86 10.59 44.37%5.06 21.22%1.82 7.64%6.39 26.77%
8Wuhan Zoo67.31 25.02 37.18%4.40 6.53%28.63 42.54%9.25 13.75%
9Ziyang27.97 10.18 36.39%2.02 7.22%12.00 42.92%3.77 13.47%
10Baiyu21.80 9.25 42.43%8.43 38.65%1.03 4.72%3.10 14.20%
11Shuiguo Lake1.38 0.71 51.60%0.00 0.00%0.00 0.00%0.67 48.40%
12Wuchang2.13 1.24 58.38%0.38 17.88%0.00 0.00%0.50 23.74%
13Neisha Lake8.88 1.54 17.35%0.45 5.07%5.52 62.16%1.37 15.43%
14Hanshui11.30 4.98 44.04%2.13 18.82%2.67 23.66%1.52 13.47%
15Dijiao20.92 9.56 45.71%5.86 28.01%2.06 9.85%3.44 16.43%
16Kepu11.63 5.70 49.00%3.44 29.61%0.00 0.00%2.49 21.39%
17Peace55.47 27.15 48.94%13.07 23.56%2.37 4.27%12.89 23.24%
18Lotus Lake13.06 2.27 17.37%0.75 5.71%6.66 50.97%3.39 25.96%
19East Lake24.71 13.11 53.05%5.80 23.49%2.09 8.48%3.70 14.98%
20Dutch8.37 4.06 48.55%1.47 17.62%0.20 2.35%2.63 31.48%
21Baodao11.29 1.90 16.87%0.00 0.00%8.30 73.52%1.08 9.60%
22Qiekou2.89 1.67 57.71%0.19 6.63%0.13 4.37%0.91 31.29%
23Changchun Temple2.56 0.79 30.74%0.00 0.00%0.00 0.00%1.77 69.26%
24Houxianghe17.74 10.22 57.63%1.69 9.51%3.70 20.87%2.13 12.00%
25Jiefang46.78 29.69 63.47%7.22 15.44%4.47 9.55%5.40 11.54%
26Lingjiao Lake13.45 2.75 20.43%0.91 6.78%8.13 60.47%1.66 12.33%
27Qingshan37.22 20.96 56.30%5.87 15.78%3.94 10.59%6.45 17.32%
28Spring13.17 0.95 7.21%0.00 0.00%10.92 82.92%1.30 9.87%
29Plant47.07 27.60 58.63%10.89 23.15%2.82 6.00%5.75 12.22%
30Daijia Lake51.91 17.82 34.34%19.73 38.01%5.02 9.67%9.33 17.98%
31Moon Lake143.47 38.55 26.87%18.94 13.20%60.03 41.84%25.95 18.08%
32Yellow Crane Tower22.51 11.39 50.58%0.00 0.00%0.00 0.00%11.12 49.42%
33Shouyi20.83 15.10 72.49%0.00 0.00%0.00 0.00%5.73 27.51%
34Xinfuwan31.23 3.30 10.57%4.35 13.93%20.72 66.36%2.86 9.15%
35Northwest Lake31.36 6.82 21.75%0.00 0.00%11.80 37.62%12.74 40.63%
36South Main Channel22.70 11.21 49.38%3.33 14.68%0.00 0.00%8.16 35.94%
37Simeitang19.93 5.79 29.06%2.01 10.07%6.81 34.18%5.32 26.70%
38Linjiang27.93 8.35 29.91%5.55 19.86%0.00 0.00%14.03 50.22%
39Hanyang Beach46.88 2.53 5.40%21.57 46.02%0.00 0.00%22.78 48.58%
40Wuchang Beach8.79 1.65 18.73%3.60 40.93%0.00 0.00%3.55 40.34%
Table 2. Economic valuation of ecological services for urban parks in the Wuhan urbanized area.
Ecosystem ServiceEstimated ContentCalculation MethodUnit Value
CO2 SequestrationCO2 stored through photosynthesisCarbon tax1012 RMB/tonne
O2 GenerationO2 produced through photosynthesisMarket value 400 RMB/tonne
Air Temperature Amelioration Plant transpiration and water evaporationMarket value0.573 RMB/kw·h
SO2 RemovalSO2 absorbed by plantsShadow project price3 RMB/kg
NOx RemovalNOx absorbed by plantsShadow project price1.6 × 104 RMB/tonne
Dust InterceptionDust absorbed and adsorbed by vegetationShadow project price170 RMB/tonne
Note: RMB indicates Chinese Yuan; tonne indicates metric tons (1000 kg).
Table 3. Regression analysis results for ecological service functions and land cover area.
Dependent VariableIndependent VariableRegression EquationR2
CO2 Sequestration (V1)Forest (X1), Lawn (X2)V1 = 38.646X1 + 4.580X2 + 1.0430.985
O2 Generation (V2)Forest (X1), Lawn (X2)V2 = 38.980X1 + 4.573X2 + 1.0430.986
Air Temperature Amelioration (V3)Forest (X1), Lawn (X2), Water (X3)V3 = 32.596X1 + 3.951X2 + 35.450X3 + 1.1670.992
SO2 Removal (V4)Forest (X1), Lawn (X2)V4 = 10.779X1 + 5.516X2 + 1.0680.890
NOx Removal (V5)Forest (X1)V5 = 318.444X1 + 0.7691.000
Dust Interception (V6)Forest (X1), Lawn (X2)V6 = 116.513X1 + 2.151X2 + 8.901X3 + 1.1560.998
Total Value (V7)Forest (X1), Lawn (X2), Water (X3)V7 = 37.046X1 + 3.858X2 + 35.652X3 + 1.1670.993
Table 4. Difference of ecological benefitper hm2.
Ecological ServiceOur ValuesLiterature Values [22,23,25,26,27,28,30,31]
MaximumMinimumAverage StdForestLawnWater
CO2 Sequestration (tonne/hm2)198.9010.1271.6134.83149.2363.550.22
O2 Generation (tonne/hm2)80.087.3952.4725.45109.53 46.180.17
SO2 Removal (kg/hm2) 158.2925.67115.31108.03152.13 279.03
NOx Removal (kg/hm2) 247.1313.81151.4468.573806
Dust Interception (tonne/hm2)17.811.0610.344.3824.572.60.498

