Article

Emergy-Based Sustainability Analysis of an Ecologically Integrated Model with Maize Planting for Silage and Pig-Raising in the North China Plain

1
Yucheng Comprehensive Experiment Station, Key Laboratory of Ecosystem Network Observation and Modeling, Institute of Geographic Sciences and Natural Resources Research, Chinese Academy of Sciences, Beijing 100101, China
2
University of Chinese Academy of Sciences, Beijing 100049, China
3
Key Laboratory of Cell Differentiation and Apoptosis of Chinese Ministry of Education, Department of Pathophysiology, Shanghai Jiao Tong University, School of Medicine, Shanghai 200240, China
4
CAS Engineering Laboratory for Yellow River Delta Modern Agriculture, Institute of Geographic Sciences and Natural Resources Research, CAS, Beijing 100101, China
*
Author to whom correspondence should be addressed.
Sustainability 2019, 11(22), 6485; https://doi.org/10.3390/su11226485
Submission received: 11 October 2019 / Revised: 13 November 2019 / Accepted: 15 November 2019 / Published: 18 November 2019
(This article belongs to the Special Issue Sustainable Livestock Production)

Abstract

:
The structure of the pig-raising sector in China is changing towards large-scale and intensive systems or ecological pig-raising systems (EPRSs). To choose the best EPRS with high economic benefits and with low environmental consequences, this study combined economic analysis and emergy analysis methods to evaluate several EPRSs. Having a large percentage of maize silage in the feed (max 40%) to replace some maize increased the economic benefit and sustainability of the EPRS and decreased the pressure on the environment. The raising system that consisted of Tuhe black pigs fed feed containing maize silage (EPRS C) performed especially well. The yield-based economic profit and area-based economic profit of EPRS C increased by 37%–54% and 3%–17%, respectively, compared to those of the three-breed crossbred pig-raising systems with or without maize silage added to the feed (EPRS A and EPRS B). Its unit emergy value and emergy loading ratio were 9–22% and 10–15% lower, respectively, than those of EPRS A and EPRS B. Furthermore, its emergy yield ratio and emergy sustainability index were about 2% and 14%–19% higher, respectively, than those of EPRS A and EPRS B. To some extent, the results from EPRS C give some guidelines on improving the performance of the ecological pig-raising sector in China. Moreover, using a high concentration of maize silage in the feed and an optimal local pig type may be beneficial for the sustainability of the ecological pig-raising sector in China.

1. Introduction

In 2016, the five-year average pork production reached 36.4% of the total meat production in the world, which is much higher than that of beef production (20.2%) and mutton production (4.5%) [1]. In China, the five-year average percentage of pork production of total meat production reached 64.1% [1]. This large supply for pork stimulates the growth of the pig-raising sector. Especially in China, to gain the most benefits from pig-raising, the conventional household pig-raising systems, which are thousands of years old, have changed to large-scale and intensive pig production [2,3]. In order to pursue fast-growing and high final weight, Chinese farmers tended to raise crossbred pigs instead of the local pig breed and to supply more concentrated and fine feed. This transformation of the pig-raising sector has caused a series of environmental problems. Improper treatment of waste has caused nutrient pollution in the soil and water bodies [4]. The gases released from pigpens, such as ammonia, hydrogen sulfide, and greenhouse gases, can be offensive and may cause air pollution [5]. In addition, the excessive use of antibiotics and heavy metal additives may harm the environment [6].
An ecological breeding system is a kind of system which is beneficial to the environment. Through modern science and technology and system engineering methods based on ecological and economic principles, such as the application of the biological agents instead of chemical agents to disinfect and control odor, the application of the slatted floor to reduce the water wasting, and no use of the heavy-metal or synthetic additives in the diets, ecological breeding systems could have economic benefits and protect natural resources [7]. Furthermore, there was a structural difference between ecological pig-raising systems (EPRSs) and intensive systems: The feed consumed in the intensive systems was all bought from the market instead of planting. So intensive systems just considered the accessibility of the feed purchased from the market and tried to feed more livestock in the limited areas instead of considering the planting structure or plant species to raise livestock [8]. EPRS would consider the reuse of the waste produced by livestock. However, intensive systems just discharge the waste into the septic-tank or wastewater treatment plant. Ecological pig-raising systems (EPRSs) aim to decrease the environmental impacts of pig-raising and increase the quality of pork products. However, EPRSs have two main disadvantages that have limited the improvements realized: a long fattening period and a high amount of required inputs [9]. The long fattening period of the EPRS is unavoidable. However, the EPRSs can use two methods to reduce inputs: reduce the cost of the feed (adding a large percentage of plant fiber or improving crop yields) and choosing suitable pig breeds. According to other research, pigs can extract some energy from cellulose with the aid of bacteria in their intestinal tract [10,11,12]. Moreover, the process of making silage can release cellular nutrient content thus increasing the concentration of available nutrients accessible to the animal [13]. Furthermore, the pigs could exploit about 50% forage-based protein [14] or extract up to 25% of the total energy from fermentation products [15]. Thus, it is very helpful to improve the environment-friendly performances when crude fiber or something similar added in the diet during the fattening period [16,17]. In theory, maize silage could replace a large part of the maize used as feed, as a more effective means of supplying nutrients to the animals. Another important factor in pig-raising is the pig breeds. Different pig breeds have different growth rates and different tolerances for roughage. In this study, we investigated the influence of maize silage added to the feed and the chosen pig breeds on the effectiveness of the raising systems based on an integrated analysis that combined emergy evaluation and economic analysis with an evaluation of livestock carrying capacity.
Many studies have performed joint economy and emergy analyses of livestock production systems [18,19]. However, studies also evaluating livestock carrying capacity are rare, as the latter requires a large amount of chemical analysis data. Most of such studies collected data through the survey questionnaire methods instead of collecting the data directly [20,21,22]. Meanwhile, most of these studies have focused on the economic benefits of large-scale and intensive livestock production systems [21,23]. Few studies have focused on the analysis of organic livestock production systems. However, these studies mainly focus on the compassion of different models without optimization methods of the existing systems. Furthermore, some studies have focused on the effects of feeding silage on pig activities, pork quality, and slaughter performance [24,25,26], while ignoring effects on the entire system. Consequently, this study set three mimic experiments to assess performances of different EPRSs on the environment, economy, and livestock carrying capacity using a comprehensive evaluation method.
The objectives of this study were to (1) assess overall differences in performance trends due to different feed ingredients and pig breeds and (2) offer suggestions for better management methods for EPRSs. Consequently, we chose two pig breeds: three-breed crossbred pigs, which are raised widely and grow quickly, and the Tuhe black pig (a local Chinese breed), which has a higher tolerance for roughage. In addition, we examined different maize silage concentrations added in the feed during the fattening period. Three different EPRSs were studied at one site. Besides, we evaluated environmental impact, emergy sustainability, economic benefit, and livestock carrying capacity of these three systems through an integrated analysis method to ensure that the results were comprehensive.

2. Materials and Methods

2.1. Study Site

We set up three EPRSs on Beiqiu Farm (37°00′ N, 116°34′ E) as described below, which is in Yucheng County, Shandong Province, China. Beiqiu Farm has a warm temperate semi-humid monsoon climate. Its mean annual frost-free period and temperature are 200 d year−1 and 13.1 °C, respectively. Its mean annual solar radiation, hours of sunshine and precipitation are 5225 MJ·m−2, 2640 h and 582 mm, respectively.
The scale and structure of Beiqiu Farm indicated that it was a typical family farm that combined crop planting and livestock breeding in the alluvial plain of the Yellow River [27]. The total area of this farm is approximately 15.3 ha with a winter wheat-summer maize double cropping area of 8 ha, an ecological livestock production area of 1.5 ha, a greenhouse planting area of 1 ha, agro-processing workshops, a waste treatment system, and a farmyard recreation area. The EPRS on this farm has existed since 2010. In the usual production mode used on this farm, pigs are fed a diet of only maize grain, soya bean meal, and wheat bran meal for approximately five months.

2.2. Experimental Design

The study involved 3 feeding groups with 2 sexes, and each group contained 8 pigs; the experiment started on 27 July 2017 and ended on 11 January 2018. 16 crossbred Duroc × (Landrace × Northeastern Indigenous) pigs and 8 Tuhe black pigs were fed in 20 m2 pens. Half of the pigs were barrows and half were gilts. Each pen contained 4 pigs (2 of each sex), and the pens had concrete slatted floors. When purchased as piglets, the 16 crossbred pigs had a mean (±1 standard deviation (SD)) weight of 26.21 ± 3.41 kg and were randomly distributed into 4 pens. The pigs in two of these pens were fed the farm’s standard diet (maize grain, soya bean meal, and wheat bran meal) (EPRS A) (Table 1). For the other two pens of crossbred pigs, sun-dried maize silage replaced some of the maize grain in the diet (EPRS B). When purchased as piglets, the 8 Tuhe black pigs had a mean (±1 SD) weight of 10.65 ± 1.23 kg and were randomly distributed into 2 pens. The Tuhe black pigs were fed with the feed containing the same sun-dried maize silage as EPRS C.
All pens were cleaned by a manure scraper under the floor without water flushing. In summer, the temperature was maintained below 30 °C via two axial flow fans and wet curtains. At temperatures below 0 °C, all windows and doors were closed, and no heating was applied. Each day, pens were disinfected by a spray solution containing 125 mL of a biological agent (ETS Gold Liquid Enzyme, ETS (Tianjin) Biotechnology Development Co. Ltd., Tianjin, China) in 20 L of water.
To create the diets of EPRS B and EPRS C, some of the maize grain of the EPRS A diet was replaced by sun-dried maize silage; the percentages of the other ingredients remained the same. The pig-raising experiment was divided into 4 phases: the adaptive phase (<30 kg), phase I (30–40 kg), phase II (40–50 kg), and phase III (>50 kg). In the adaptive phase which lasted for 3 weeks, the percentage of the sun-dried maize silage (by mass) increased by 10% each week until it reached 30%. The percentage of maize silage increased from 30% in phase I to 40% in phase III (Table 1). The feeds were mixed by a grinder with a 20 mesh sieve. All groups were offered sufficient feed twice a day and ad libitum water via nipple drinkers.

2.3. Data Collection

Pigs were weighed using an electronic cage scale (Lilang XK3190, Changzhouliliang electronics Co. Ltd., Changzhou, China) at the beginning and end of each phase. During the weighting process, we just let the pigs walk across the channel. Then this kind of electronic cage scale could weigh pigs one by one with little stress reaction to the pigs. The amount of water and electricity used during the entire raising period was recorded by meters. The amounts of feed consumed were recorded every day. The weights of manure and urine excreted during the entire period were calculated as:
Total weight ( kg ) = mean weight per excretion × frenquency per day × number of days
Since pigs discharged the waste in a special area, it was available to predict the discharge activities and to collect. Manure and urine samples were collected by a long-handled water ladle and then weighed on an electronic scale (Weiheng WH-A04, Shanghai Weiheng electronics Co. Ltd., Shanghai, China) twice every phase. In addition, the frequency of excretion was recorded by a video camera (Xiaofang iSC5, Xiaomi technology co. LTD, Beijing, China). Data on building materials and equipment were obtained from the farm’s account books.
Manure samples were stored at −20 °C. Before drying, samples were thawed until reaching room temperature. Then, samples were dried in the oven at 105 °C for 30 min and at 70 °C for 48 h. Before chemical analysis, samples were ground and passed through 0.25 mm sieves. Nitrogen and moisture contents were detected with NY/T 2017-2011 and NY/T 302-1995 methods, respectively.

2.4. Emergy Analysis

Emergy analysis shows internal relationships among parts of a system using energy systems language (ESL) [28]. This method uses solar energy (solar emjoules (seJ)) as the standard unit [29]. All-natural resources, economic inputs, materials, and energy can be transformed into the same unit by suitable formulas [29]; thus, different systems can be compared.
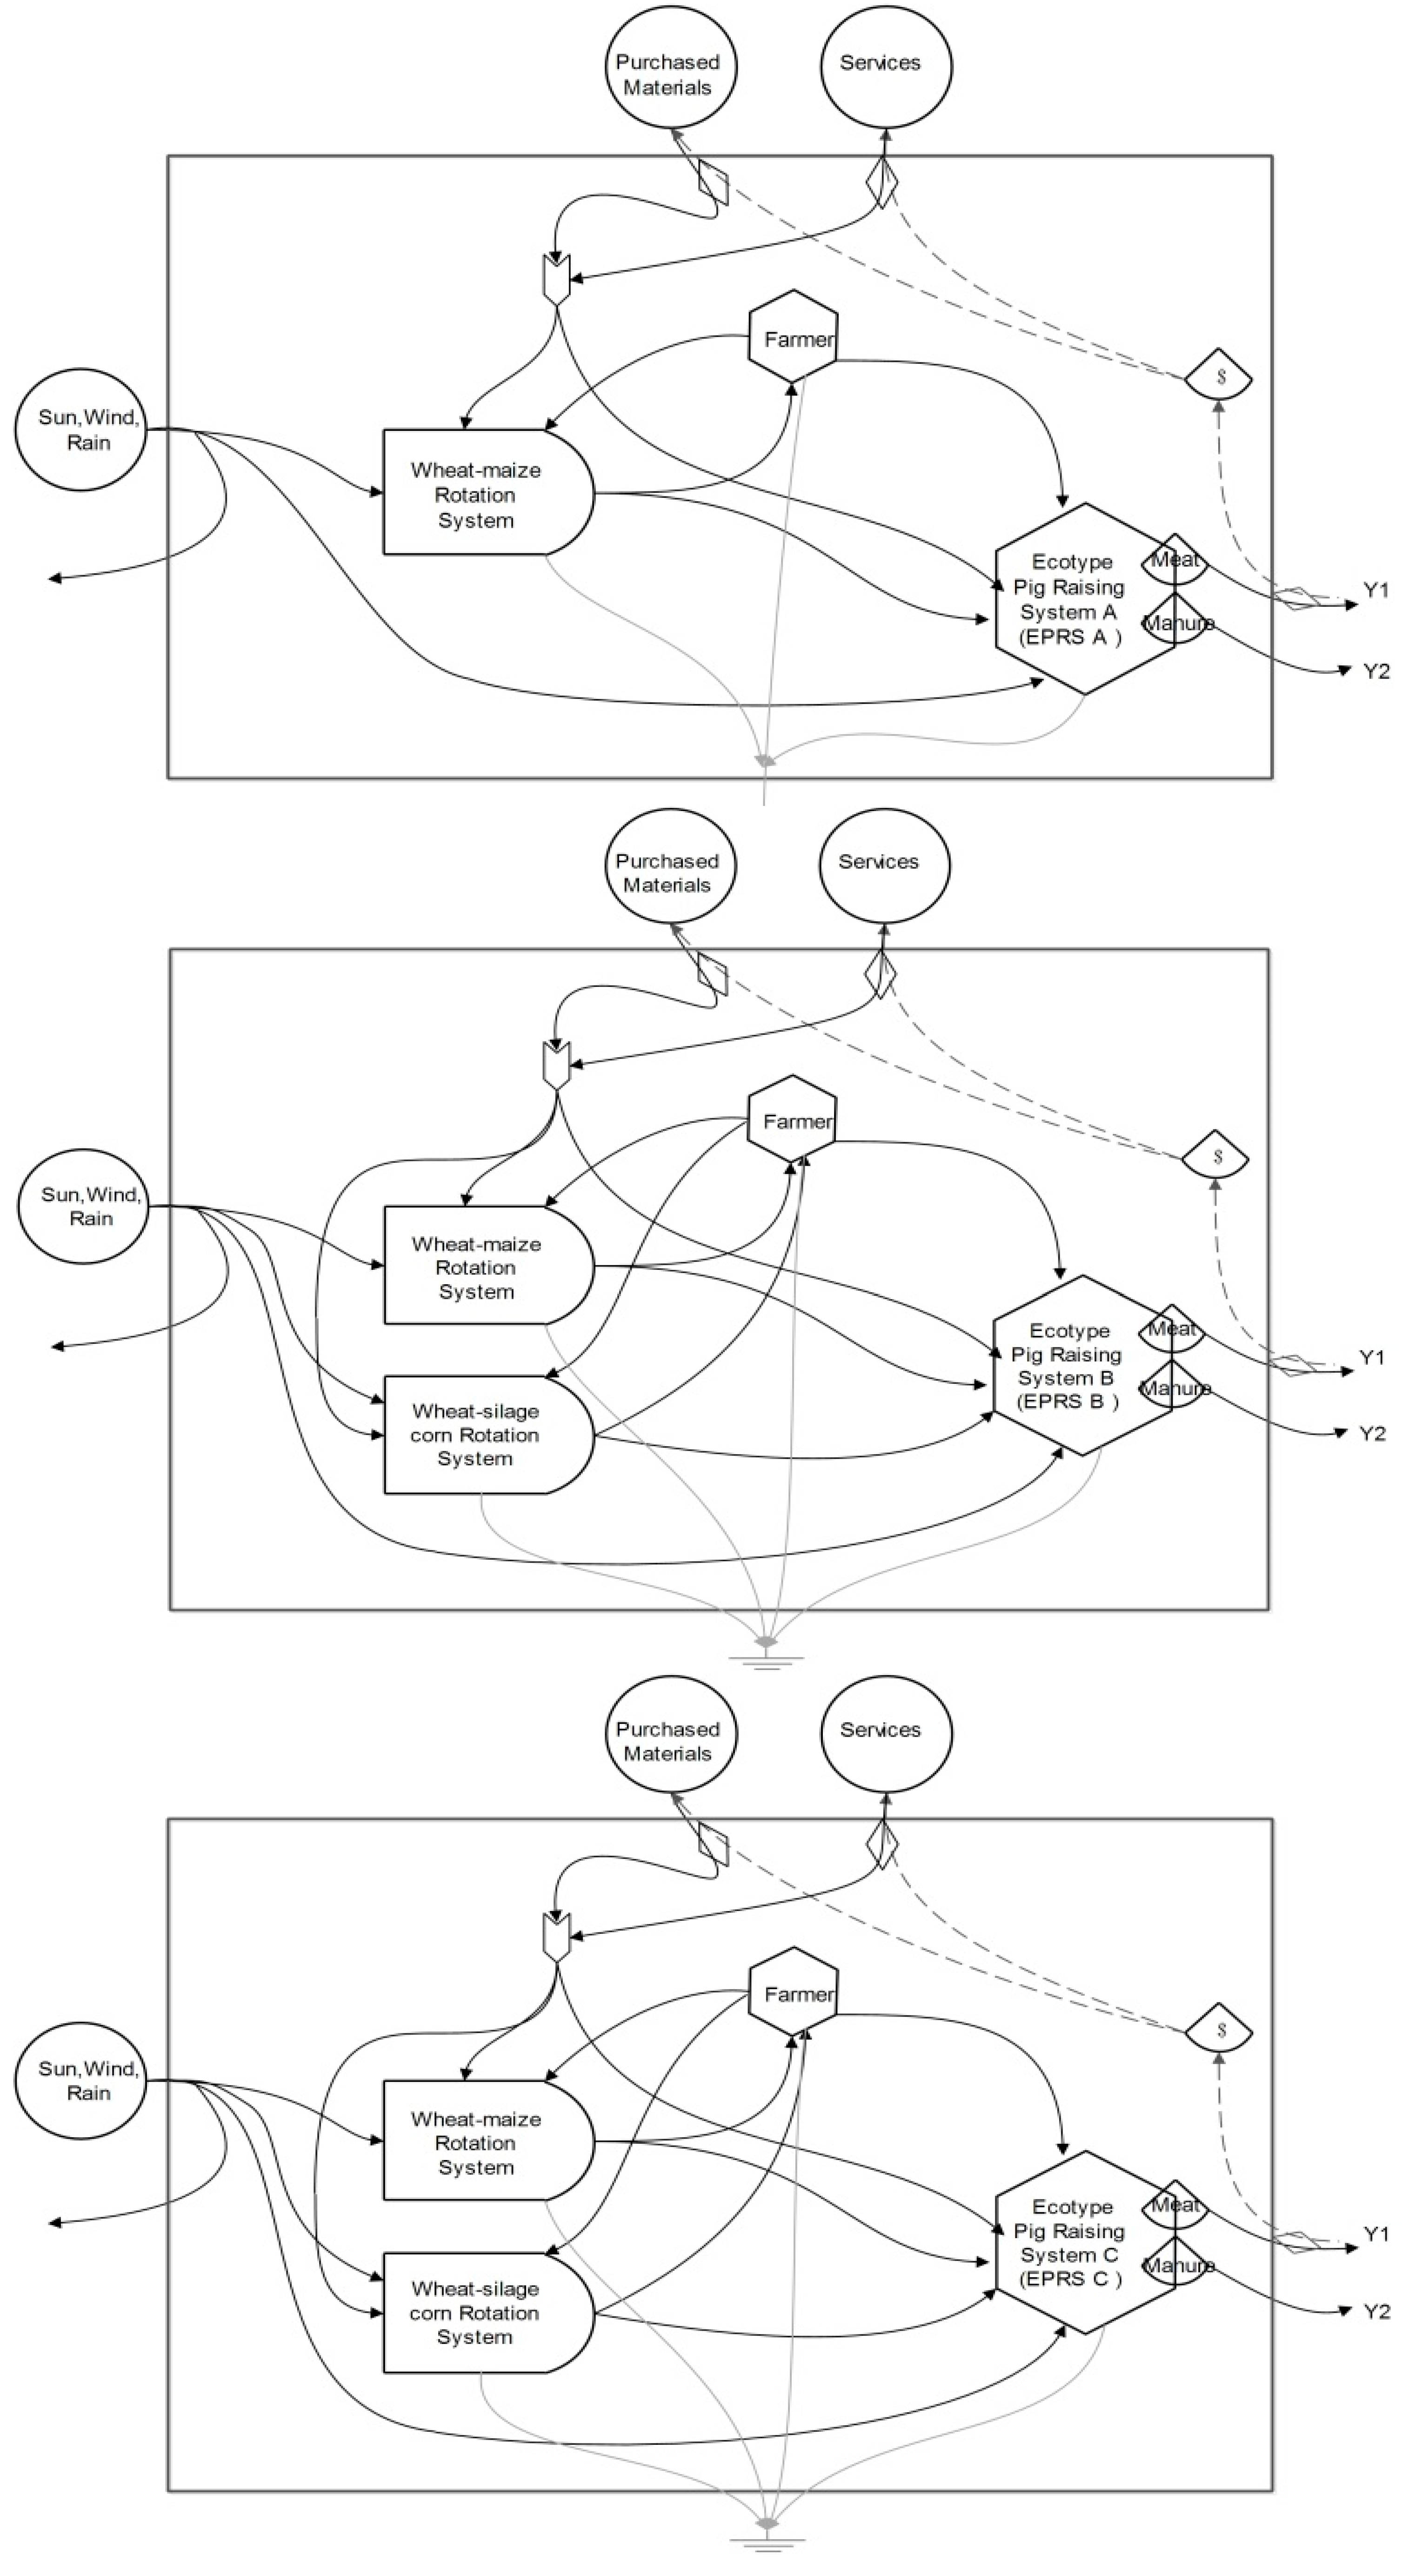
ESL diagrams show the main components of the three EPRS evaluations and the relationships among them (Figure 1). The inputs driving the EPRSs came mainly from the local environmental resources (EL) and economic inputs from markets (F). Based on aggregated system diagrams, all data should be collected and recorded in a table. These data were then transformed to the emergy values via multiplication by suitable unit emergy values (UEVs). All inputs were composed of a renewable fraction (R) and a nonrenewable fraction (N), and the value of each fraction is calculated using renewability factors (RNFs). The pig live weight produced by the EPRS (Y1) flowed out of the system into the market. Besides, the manure produced by the EPRS (Y2) also flowed out of the system as waste. To simplify the calculation, we treated Y2 as a by-product which contained 0 seJ. In general, the available energies of rain and wind are regarded as both being derived from solar energy. In this study, only the largest value of these three items will be considered in the emergy analysis. The emergy of topsoil loss was calculated using soil organic carbon (SOC) concentration [29]. Thus, the factor of topsoil loss from the EL was canceled out as the SOC concentration of the entire North China Plain increased over the past 30 years under conventional tillage methods [30]. Three years of local SOC data from the Yucheng Comprehensive Experiment Station also verified this trend (Supplementary Material D). The comparisons among the different systems mainly depended on the emergy index. In this case, we chose the units emergy value (UEV), emergy yield ratio (EYR), environmental loading ratio (ELR), and emergy sustainability index (ESI) as the index by which we characterized the system (Table 2) [31,32]. The UEV of Chinese Yuan (emergy/dollar ratio) was also called emdollar which reflected the purchased power of a local currency. Generally, the higher emdollar one area had, the less developed it was [33]. As the near-linear correlation between real GDP and total emergy inputs [34], the UEV of the Chinese Yuan (¥) in 2017 was 3.31 × 10¹¹ seJ/¥ under 12.0 × 1024 seJ/year baseline which was calculated based on the UEV (7.27 × 10¹¹ seJ/¥ with 9.26 × 1024 seJ/year baseline) calculated by Yang (2010) in 2005 and the GDP deflator of 2005 to 2017 (2.84) [33,35]. In this study, the global emergy baseline was 12.00 × 1024 seJ/year. All UEVs from other baselines were converted to the same baseline by multiplying by a coefficient [36].

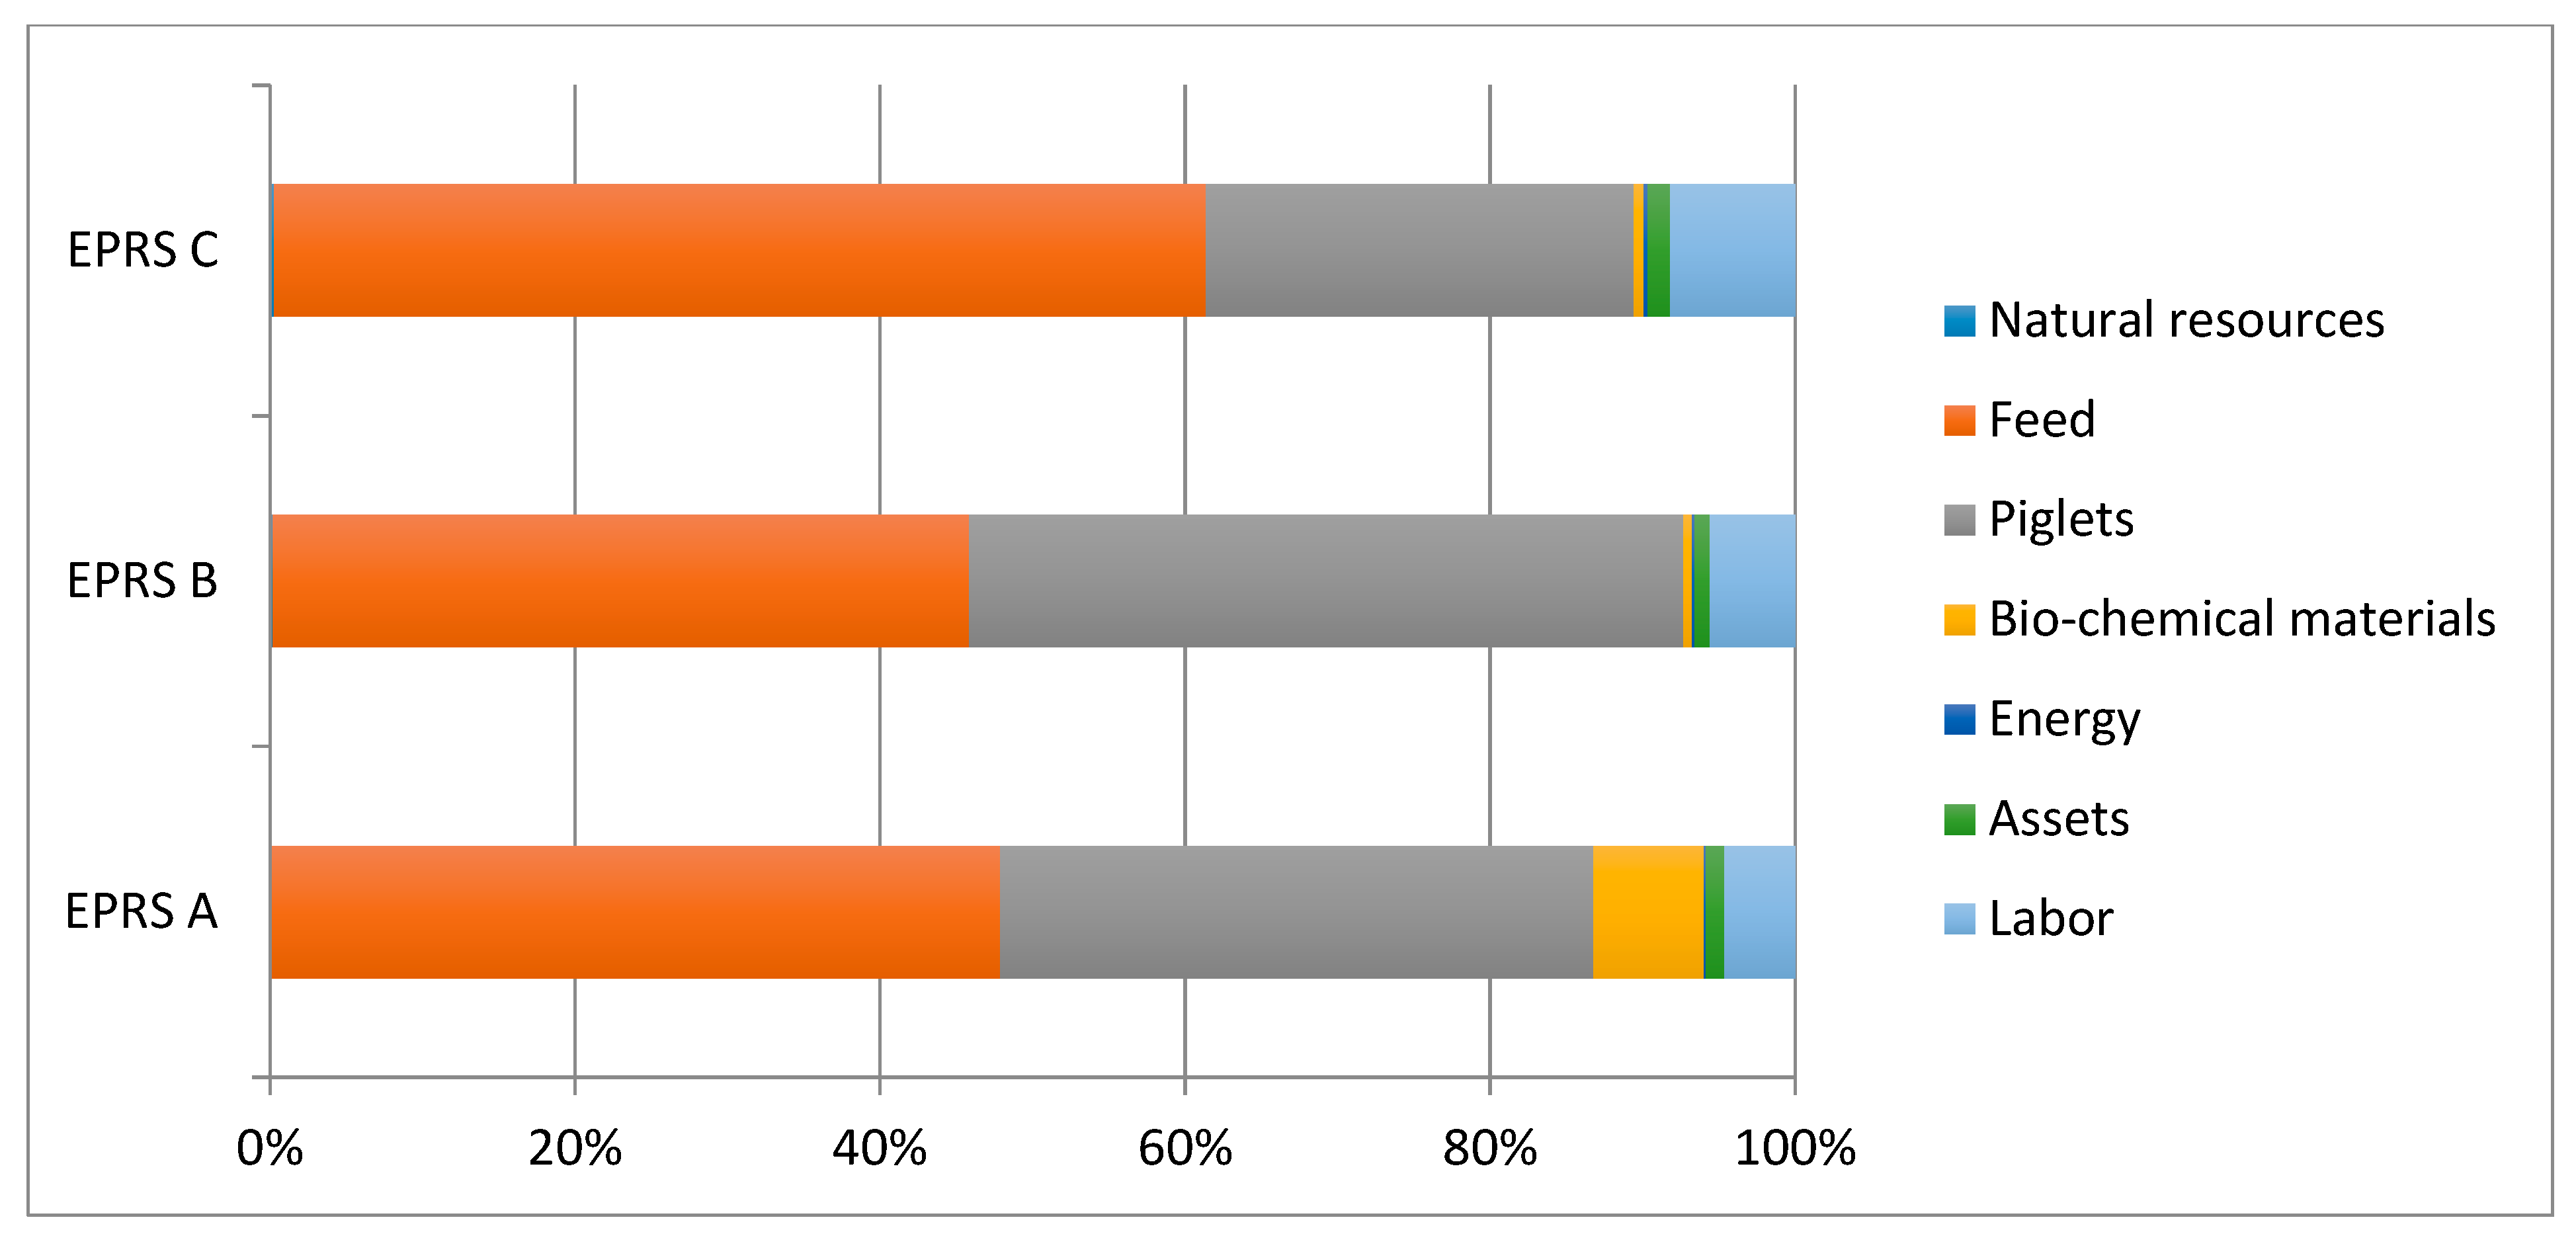
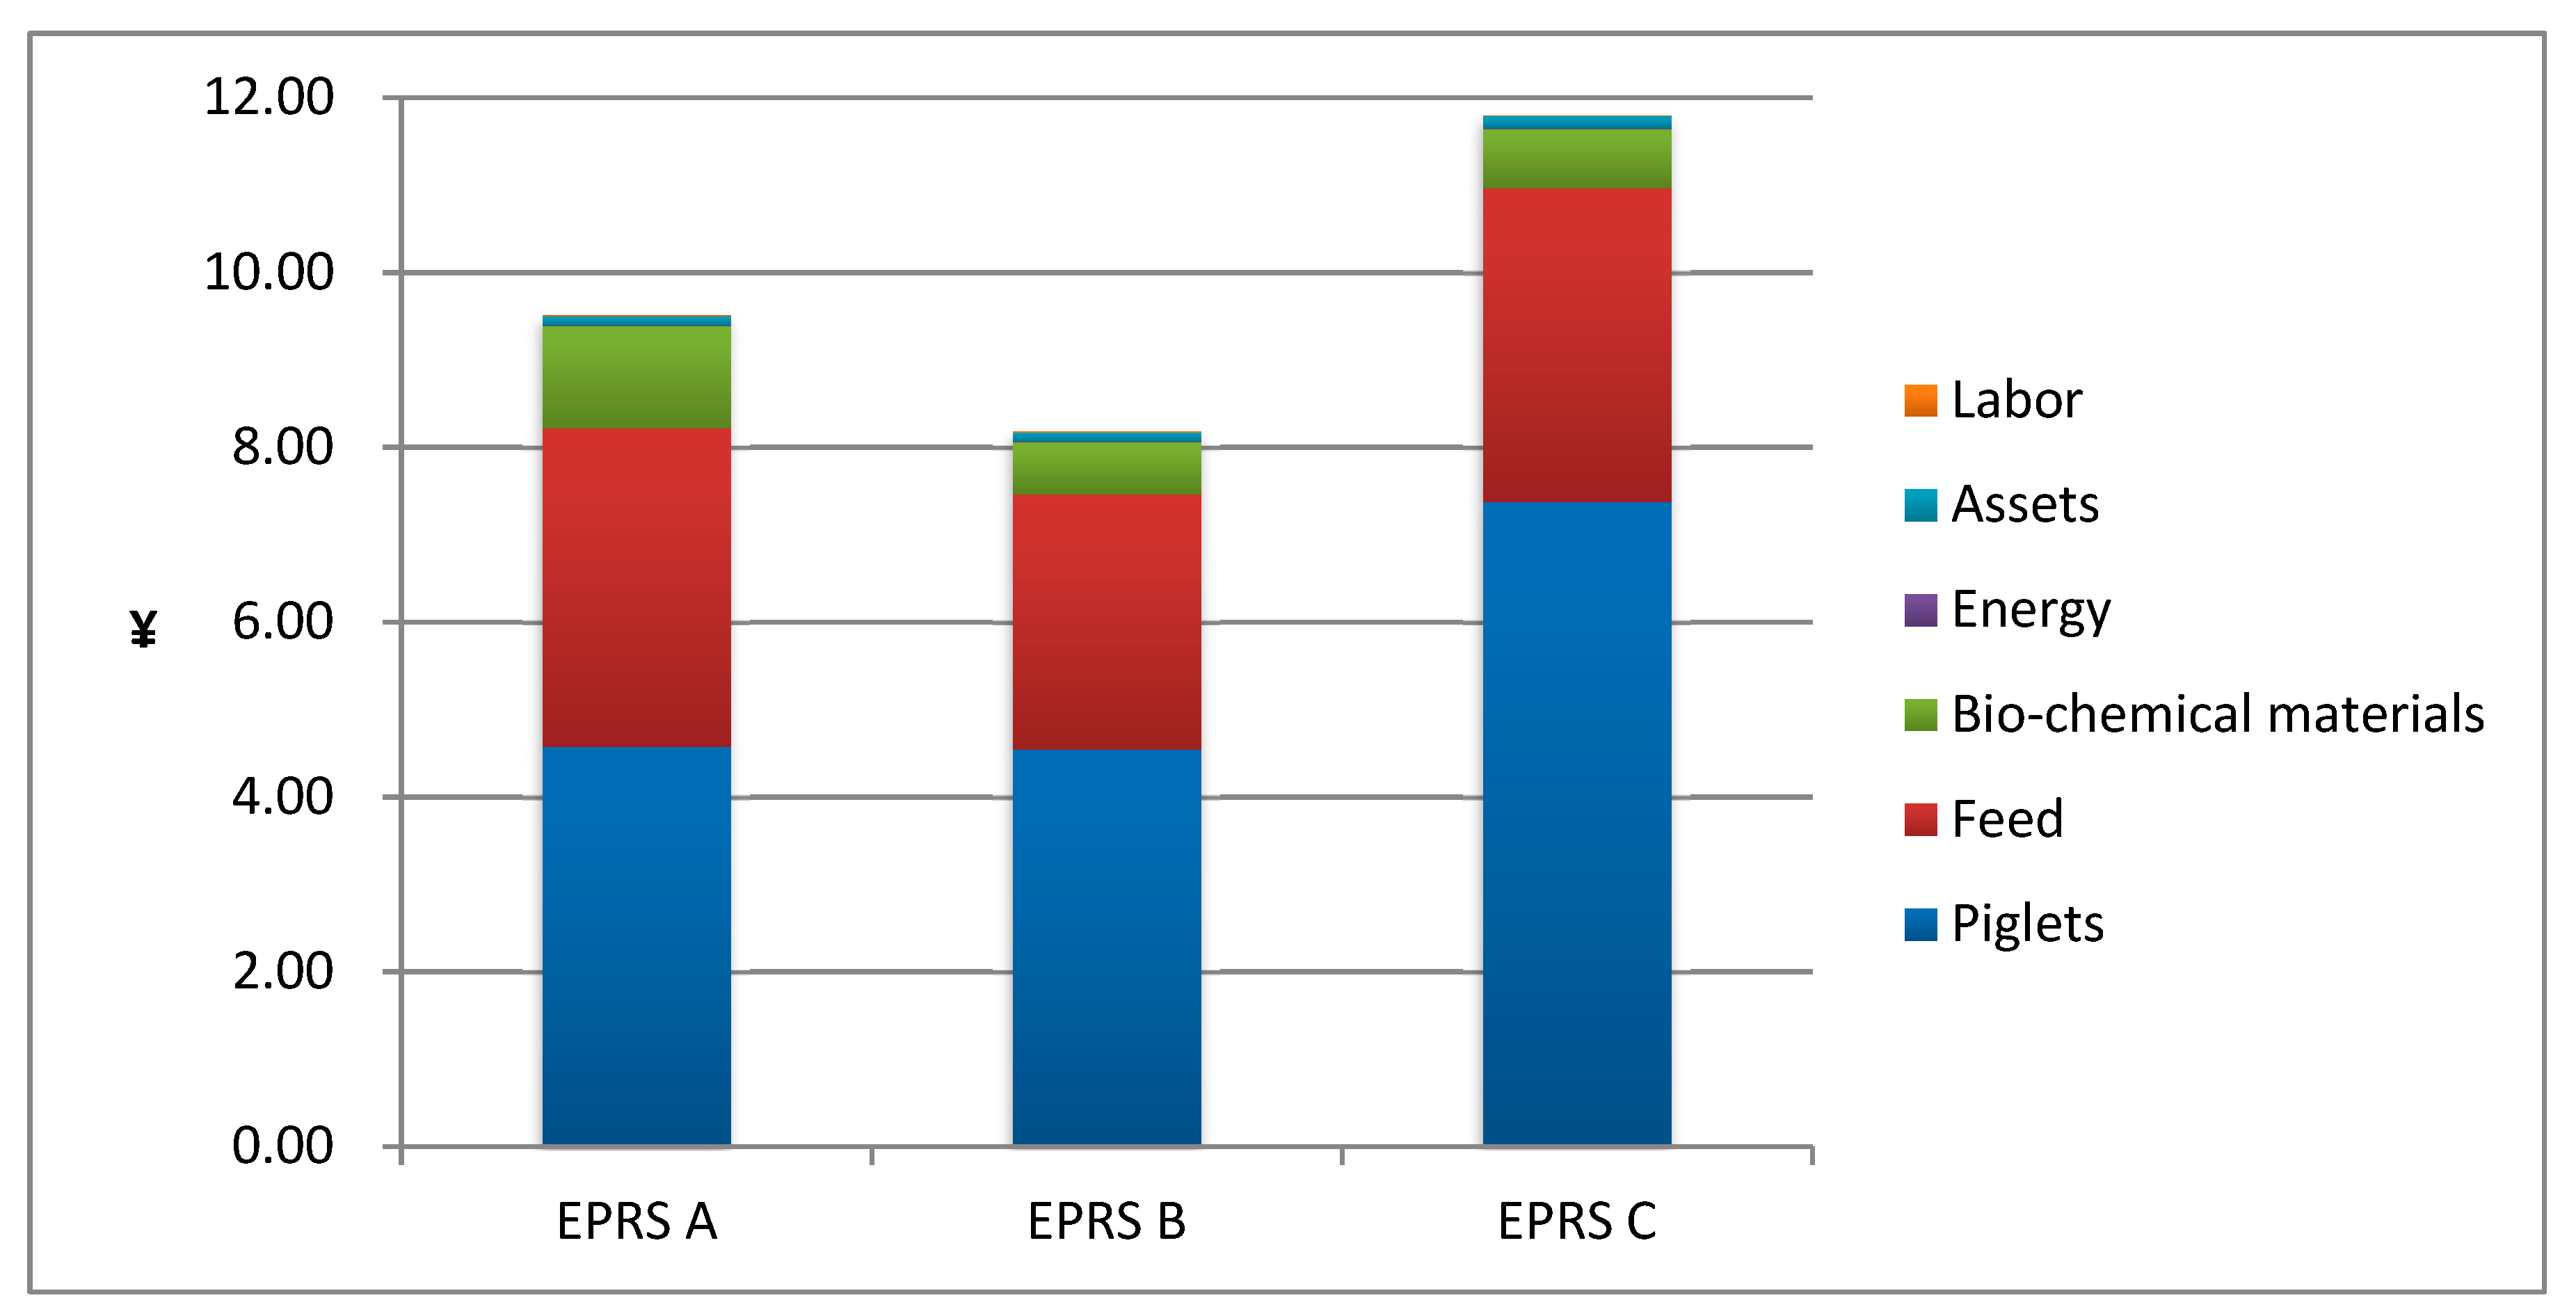
2.5. Economic Analysis

The economic analysis was based mainly on inputs and outputs of the EPRSs (Supplementary Material C), which were used to calculate 3 economy-based indices: yield-based economic profit (Py), area-based economic profit (Pa), and the ratio of income to cost (I:C) (Table 3). Py is a common index reflecting the earning ability per unit production. Pa calculates the area needed in the production process based on Py. I:C shows the rate of return during the production process. Prices of materials and products were obtained from the account books of Beiqiu Farm in 2017.

2.6. Livestock Carrying Capacity Evaluation

The evaluation of livestock carrying capacity estimated the maximum number of livestock that could be raised per unit area without degrading the land area used to produce feed [38]. Two indices were calculated. The first carrying capacity (L1) was calculated as the amount of feed this area could provide (Equation (2)), based on the diets consumed in the experiment [39,40]. Due to the main planting structure (winter wheat-summer maize cropping system) in North China plain, L1 was calculated by the yield of the wheat and maize. In 2017, the supplement of the soybean meal to the pig-raising sector is sufficient in Shandong Province without sharp price fluctuation. So, quantity of the soybean meal could be purchased in the market was assigned to market supply capacity which was not a limit factor for L1.
L 1 = min A i × Y i C i
where Ai (ha) is the planting area for crop i; Yi (kg/ha/year) is the yield of crop i; Ci (kg/year) is the mean amount of feed from crop i that livestock consumed per year.
The second carrying capacity (L2) was determined by the amount of nitrogen or phosphorus from the livestock that could be used to fertilize the land [41,42] (Equation (3)). L2 was calculated by the data of nitrogen or phosphorus that was dependent on the land tillage method. Generally, in China, the L2 of crop field was calculated by the amount of nitrogen. Meanwhile, L2 of the land planted vegetables was calculated from the amount of phosphorus [43]. In our experiment, the field was only planted grains; thus, we took the amount of nitrogen into calculation.
L 2 = K × γ N ε θ M
where K (%) is the fraction of the manure fertilizer applied per year; N (kg) is the amount of nitrogen consumed by the crops per year; M (kg) is the amount of nitrogen from livestock manure; γ (%) is the fraction of nitrogen from total fertilizer; ε (%) is the nitrogen retention rate of the manure fertilizer per year; θ (%) is the manure nitrogen utilization efficiency of the crop per year.
To compare the two breeds in more detail, we created additional indices: RL1 and RL2 (m2/kg) (the reciprocals of L1 and L2, respectively; they reflected the land area needed to produce 1 kg of final live weight) and RRL (Equation (4), the ratio RL2:RL1; it reflected the degree of nutrient element recycling. Performance increases as RRL increases).
RRL = RL 2 RL 1
In order to clarify the RRL, we divided L1 and L2 to negative and positive index, respectively. To some extent, the more organic fertilizer (especially from EPRSs) is applied instead of chemical fertilizer, the more beneficial it will be to the environment and sustainability [44,45]. That means the calculation of L1 was based on the outputs of the land. However, the calculation of L2 was based on inputs of the land which can be regarded as a feedback process. Consequently, we defined L1 as a negative index and L2 as a positive index.

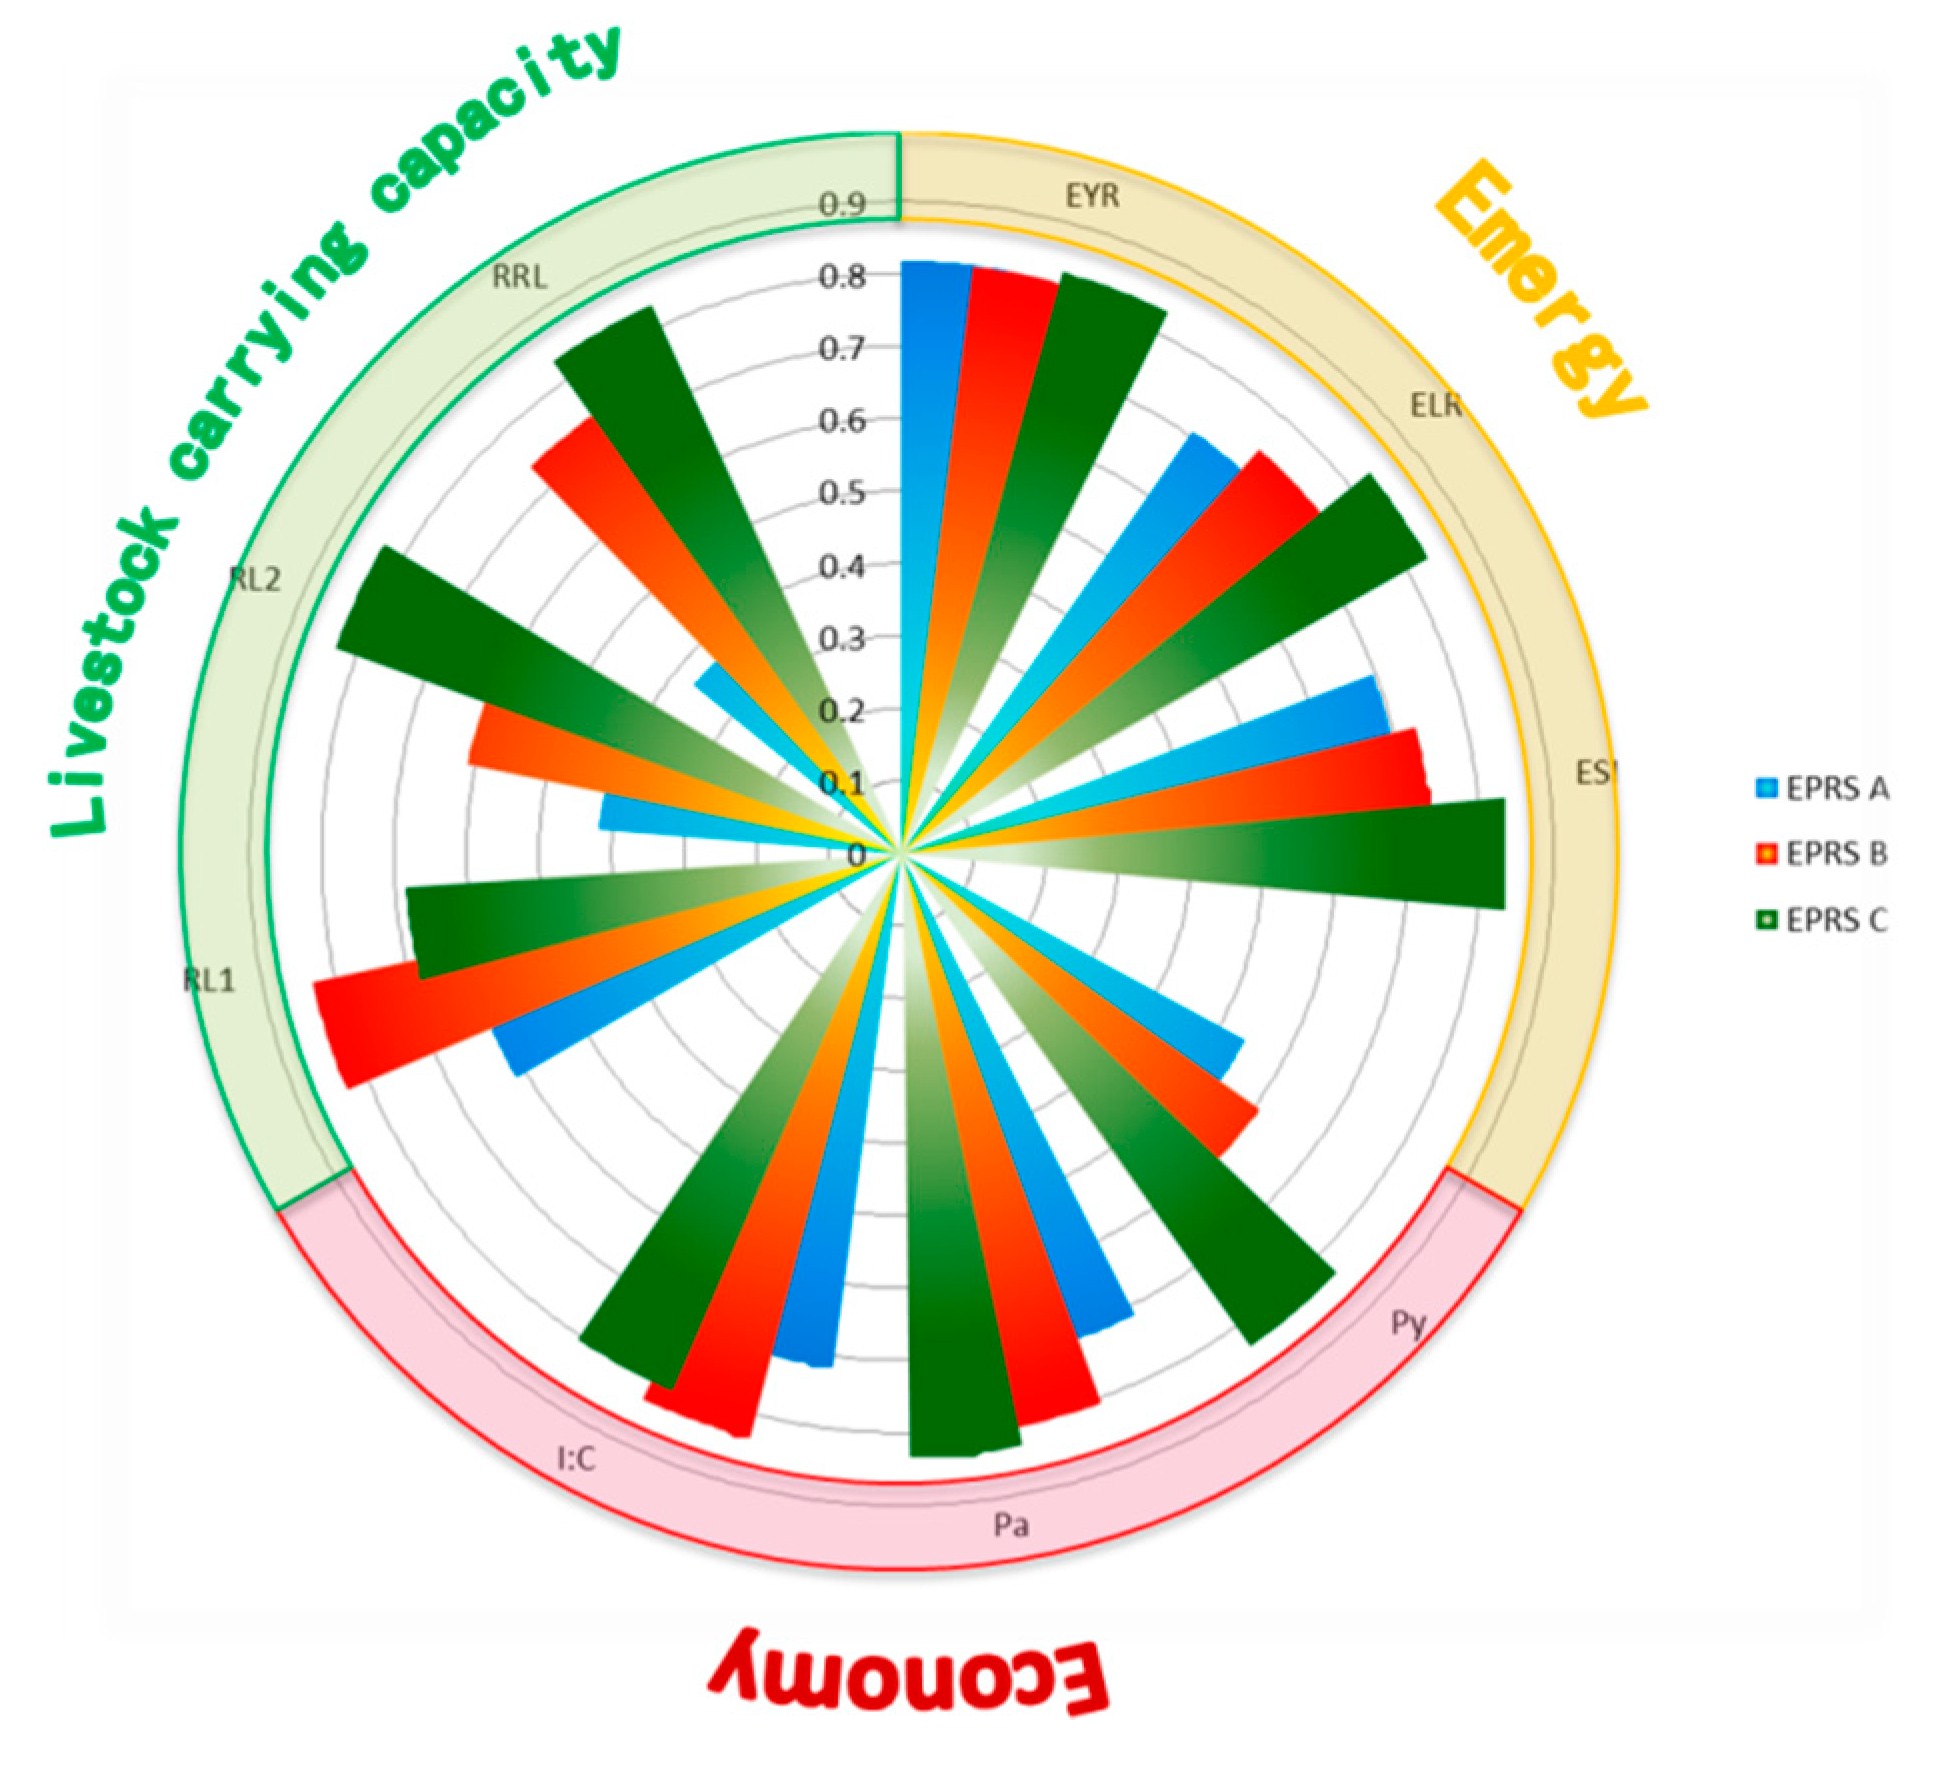
2.7. Integrated Analysis

To integrate the analyses, we displayed the main emergy, economic, and carrying capacity indices in a rose diagram to show the performance of each EPRS. Reciprocals of negatively correlated indices (the performance of negatively correlated indices are the less the better) were calculated. Each index’s upper limit was set as 1.2 times that of the maximum value, and then each index was shown as a percentage of the upper limit. The integrated performance was determined mainly by the area that each system covered in each of the three sectors.

3. Results

3.1. Emergy Analysis

Based on the emergy input and output details (Table 4), total mean emergy inputs of EPRS A, B, and C were 5.32 × 10¹² seJ/kg and 4.56 × 10¹² seJ/kg and 4.17 × 10¹² seJ/kg, respectively (Table 5). Thus, to produce one kg of final live weight, EPRS C needed the least emergy input (i.e., 78% of that needed in EPRS A and 91% of that needed in EPRS B). Emergy flows from economic systems in EPRS A, B, and C accounted for 93.9%, 94.2%, and 92.3%, respectively. The reliance of the systems on purchased materials gradually increased from EPRS C, A to B. At the same time, the renewable emergy flows in EPRS A, B, and C accounted for 25.2%, 26.2%, and 28.4%, respectively, of total emergy in flows, showing that efficiency of renewable material use gradually increased.
EPRS C had the lowest UEV, which meant that it could produce more product with fewer inputs (Table 6). EYRs of EPRS A and EPRS B were about 2% lower than that of EPRS C. This result meant that EPRS C had the best system efficiency. ELRs of EPRS A and EPRS B were 18% and 12% higher, respectively, than that of EPRS C. However, ESIs of EPRS A and EPRS B were 16% and 12% lower, respectively, than that of EPRS C.
Feed was a relatively large part of total emergy inputs to the EPRSs. The feed consumed represented 48%, 46%, and 61% of the emergy input to EPRS A, B, and C, respectively (Figure 2). Then the piglets bought from the market represented 38%, 45%, and 27% of the total emergy input to EPRS A, B, and C, respectively. The labor input of the total emergy of each system also represented an important role.

3.2. Economic Analysis

Crossbred pigs (EPRS A and EPRS B) were much heavier than Tuhe black pigs (EPRS C) due to the former’s faster growth rate (Table 7). Tuhe black pigs cost most per kg live weight, but had a selling price per kg of live weight 40% higher than that of crossbred pigs. The selling price per live Tuhe black pig (EPRS C) was 5.5% higher than that of EPRS B and 6.2% higher than that of EPRS A. The three items that cost the most were purchased piglets, feed, and bio-chemical materials (vaccines, disinfectants, and micro-biological additives) (Figure 3). The feed in EPRS A, EPRS B, and EPRS C accounted for 38%, 36%, and 30%, respectively, of the total cost of production.
Py was 35.2% and 27.1% lower in EPRS A and EPRS B, respectively, than that in EPRS C (16.21 ¥/kg) (Table 8). At the same time, Pa of EPRS C was 17.1% higher than that of EPRS A and 3.2% higher than that of EPRS B. Due to the lowest live weight of pigs, EPRS C had an I:C ratio lower than that of EPRS B and higher than that of EPRS A. In conclusion, although EPRS C had higher expenses, it made more profit than the other two systems.

3.3. Livestock Carrying Capacity Evaluation

The feed weights of the crossbred pigs (EPRS A and EPRS B) were slightly heavier than those of the Tuhe black pigs (EPRS C) (Table 9). The manure weights of systems with maize silage in the diet (EPRS B and EPRS C) were 174% and 189% heavier, respectively, than those of EPRS A (no maize silage). EPRS B had the largest urine volume. The urine nitrogen excretion of EPRS B was 153% and 102% higher, respectively, than that of EPRS A and EPRS C. The manure nitrogen excretion of EPRS A was only 72% and 65%, respectively, of EPRS B’s and EPRS C’s manure nitrogen excretion. Total nitrogen excretion of EPRS B and EPRS C was 48% and 51% higher, respectively, than that of EPRS A.
EPRS C had the highest L1 (16.3 pigs/ha), which was 48% and 35% higher than that of EPRS A and EPRS B, respectively (Table 10). However, EPRS A had the highest L2 (50.6 pigs/ha). The L2 values of EPRS B and EPRS C were very similar which were around 34 pigs/ha.
RL1 of EPRS A was the highest of all that meant to produce 1 kg live body weight; EPRS A needs 35% and 12% more land to plant than EPRS B and EPRS C, respectively (Figure 4). The highest RL2 was from EPRS C. Every kilogram live body production of EPRS C could fertilize 99% and 36% more land than EPRS A and EPRS B, respectively. EPRS C had the best RRL (0.45), which was 125% and 13% higher than those of EPRS A and EPRS B, respectively.

3.4. Integrated Performance of the EPRSs

By combining these three analysis results, the integrated performance of each system is shown clearly in Figure 5. EPRS A had the smallest area in the three sectors. Conversely, EPRS C covered the largest area. EPRS C only showed a little weaker than EPRS B in the RL1 area. With the same pig breed, the integrated performance of EPRS B improved a lot, except in the EYR area, when compared with EPRS A.

4. Discussion

4.1. Impact of the Feed on the EPRSs

Advantages of the Maize Silage

As silage maize has short growth and harvest periods, it needed less fertilizer applied and environmental emergy inputs than summer maize. Maize silage could be stored just after harvest, while maize grain had to be dried and cleaned before storage to prevent insect infestations. Therefore, total emergy inputs per ha of maize silage were only 81% of that for summer maize grain (Supplementary Material B). Silage maize had a much higher yield than conventional summer maize and thus could feed more pigs. The UEV of maize silage was only 28% of that of summer maize grain (Figure 6). The advantages of low UEV are the reduction in total emergy inputs and increase in the emergy sustainability of the system.
The feed represented a relatively large part of total emergy inputs to the EPRSs (Figure 2). Therefore, it was important to choose a suitable feed with less emergy. Many studies have verified that pigs can extract some energy from plant fiber and that their capacity for digestion increases with growth [11,52]. The crude protein and gross energy contents of maize silage harvested at the milk-ripe stage were only 32% and 2% lower, respectively, than those of maize grain (NY/T34-2004). Therefore, maize silage could be regarded as a good alternative ingredient to replace some maize grain. In this study, EPRS A and EPRS B differed in whether their feeds contained maize silage or not. By containing maize silage, EPRS B had total emergy inputs 18% lower than that of EPRS A. Therefore, adding maize silage to the feed was beneficial for the EPRSs by decreasing emergy inputs.

4.2. Impact of Pig Breed on the EPRSs

Three-breed crossbred pigs are known for their high growth rate and adaptability [53]. In this study, crossbred pigs reached a mean weight of 114.3 kg, while Tuhe black pigs reached a mean of only 86.6 kg, perhaps because crossbred piglets were heavier than Tuhe black piglets. However, the net growth of crossbred pigs (ca. 88 kg) was only slightly higher than that of Tuhe black pigs (76 kg). Thus, Tuhe black pigs had a ratio of net growth 2.12 times (net growth weight divided by the initial weight) as high as that of crossbred pigs, perhaps because the former adapted better to the feed with maize silage.
During the raising period, Tuhe black pigs (EPRS C) consumed 20% more feed per kg live weight than crossbred pigs (EPRS A and B). The higher feed input increased total emergy input; however, most feed ingredients from Beiqiu Farm had a high RNF, which increased the emergy sustainability of the system. Due to the low growth rate, Tuhe black piglets weighed only 41% of the weight of crossbred piglets. Because they were purchased from different places, all Tuhe black piglets were vaccinated before they were purchased. Meanwhile, the crossbred piglets, which had only basic vaccinations, developed foot-and-mouth disease and had to be injected with additional vaccines during the fattening period. These factors resulted in purchasing materials with a low RNF and high UEV, which may explain why EPRS C had slightly lower EYR than EPRS A and B. Economically, although EPRS C cost most due to the high price of piglets, Tuhe black pigs also had a higher selling price per kg live weight than crossbred pigs. As a result, EPRS C performed better economically than EPRS A and B.

4.3. Optimized Index of Livestock Carrying Capacity

The livestock carrying capacity values from L1 and L2 would show opposite results for the EPRSs if without defining negative and positive indices (Table 10). Pig breed and especially feed composition influenced carrying capacity. EPRS B and EPRS C had nearly the same RL1, which was about half that of EPRS A. As EPRS B and EPRS C had the same diet, the feed composition reflected the planting area that was required much more than the pig breed did. EPRS A had the lowest RL2. Generally, increased crude fiber decreases feed residence time in the gastrointestinal system [15,52]. Consequently, EPRS B and EPRS C produced more manure than EPRS A; however, more manure is useful for nutrient recycling in ecological raising systems. EPRS C had better RRL than EPRS A and EPRS B. EPRS A still had the lowest RRL. EPRS B and C had little difference in RL1 or RL2. Thus, the RRL indicated that EPRS C was better at recycling than EPRS A or B.
The results of livestock carrying capacity were very similar to the result from emergy evaluation. Since L2 and RL2 could reflect the recyclability of a system indirectly, L1 and RL1 could reflect a system’s ability to rely on the outside indirectly at the same time. The values of the indices above EPRS B and C were all better than EPRS A. As expected, the ESI, which is an index of emergy evaluation to reflect a system’s sustainability, also showed the same result. Such results showed the benefit of the maize silage added into the diet. More relationships between carrying capacity and emergy on the environmental impact will continue to be explored when our future series experiments gain the exact emission factors of the greenhouse gas during the production and manure management process.

4.4. Integrated Performance of the EPRSs

Overall, the Tuhe black pigs were a good choice for the EPRSs. The feed with maize silage could increase overall performance. With the help of the rose diagram, we could easily recognize that the performance of EPRS A was unsatisfactory (Figure 5), with fewer economic benefits and higher environmental pressure. In contrast, EPRS B had lower environmental performance and higher production capacity. The disadvantage of EPRS B was its lower profit, which was due to the pig breed. With the largest area in the three sectors of the diagram, EPRS C performed best, though there were still some disadvantages related to higher costs and lower final weight.

5. Conclusions

With the market demand increasing for pork produced with lower environmental impacts, many ecological pig-raising systems have been created in China. However, integrated analysis based on emergy evaluation, economic analysis, and livestock carrying capacity evaluation provided a comprehensive assessment of differences among the EPRSs.
In this study, having up to 40% sun-dried maize silage in feed did not affect the final weight of same breed pigs. However, the unit emergy value (UEV), environmental loading ratio (ELR), and emergy sustainability index (ESI) of such systems were much better than those of the system whose feed contained only traditional grain crops (maize, wheat, soya bean). In addition, the area planted to feed the pigs decreased and the area that could be fertilized increased when the feed contained maize silage. Pig breed was another important factor. The Tuhe black pig, as a traditional Chinese pig, had disadvantages of higher cost (especially for piglets) and lower yield. However, due to the flavor of its pork, the Tuhe black pig had a much higher price per kg live weight than the crossbred pig. Furthermore, the Tuhe black pig had greater ability to digest crude fiber. As expected, Tuhe black pig had better economic benefits, emergy performances, and livestock carrying capacity than the crossbred pig.
In conclusion, the ecological pig sector raised indoor on North China plain could try to choose local pig breeds and add non-food crops in the feed to increase economic benefits and improve environmental consequences.

Supplementary Materials

The following are available online at https://www.mdpi.com/2071-1050/11/22/6485/s1.

Author Contributions

Conceptualization, L.Y. and Z.O.; writing—original draft preparation, L.Y.; writing—review and editing, J.L., Z.S., H.G., P.C., R.L., S.H., and H.G.; supervision, J.L., Z.S., and R.H.; project administration, Z.O.

Funding

This study was supported by Chinese Academy of Sciences (Project numbers KFJ-STS-ZDTP-049; XDA23050103; KFJ-EW-STS-054).

Acknowledgments

We thank the reviewers and editors very much for the very useful suggestions and comments.

Conflicts of Interest

The authors declare no conflict of interest.

References

  1. FAO. Available online: http://www.fao.org/faostat/zh/#data/QL (accessed on 11 May 2018).
  2. De Vries, M.; de Boer, I.J.M. Comparing environmental impacts for livestock products: A review of life cycle assessments. Livest. Sci. 2010, 128, 1–11. [Google Scholar] [CrossRef]
  3. Qian, Y.; Song, K.; Hu, T.; Ying, T. Environmental status of livestock and poultry sectors in China under current transformation stage. Sci. Total Environ. 2018, 622, 702–709. [Google Scholar] [CrossRef] [PubMed]
  4. Nelson, N.O.; Mikkelsen, R.L.; Hesterberg, D.L. Struvite precipitation in anaerobic swine lagoon liquid: Effect of pH and Mg: P ratio and determination of rate constant. Bioresour. Technol. 2003, 89, 229–236. [Google Scholar] [CrossRef]
  5. Petersen, S.O.; Dorno, N.; Lindholst, S.; Feilberg, A.; Eriksen, J. Emissions of CH4, N2O, NH3 and odorants from pig slurry during winter and summer storage. Nutr. Cycl. Agroecosyst. 2013, 95, 103–113. [Google Scholar] [CrossRef]
  6. Zhu, Y.G.; Johnson, T.A.; Su, J.Q.; Qiao, M.; Guo, G.X.; Stedtfeld, R.D.; Hashsham, S.A.; Tiedje, J.M. Diverse and abundant antibiotic resistance genes in Chinese swine farms. Proc. Natl. Acad. Sci. USA 2013, 110, 3435–3440. [Google Scholar] [CrossRef] [PubMed]
  7. Li, C. Research on the Theory and Practice of Green Stockbreeding Industry; China Agriculture Press: Beijing, China, 2006; p. 261. [Google Scholar]
  8. Han, R.; Zhu, S.; Li, Z. Cointegration test and variance decomposition for the relationship between economy and environment based on material flow analysis in Tangshan City Hebei China. J. Appl. Ecol. 2015, 26, 3835–3842. [Google Scholar]
  9. Dinis, I.; Ortolani, L.; Bocci, R.; Brites, C. Organic agriculture values and practices in Portugal and Italy. Agric. Syst. 2015, 136, 39–45. [Google Scholar] [CrossRef]
  10. Vittoz, P.; Hainard, P. Impact of free-range pigs on mountain pastures in the Swiss Jura. Appl. Veg. Sci. 2002, 5, 247–254. [Google Scholar] [CrossRef]
  11. Wustholz, J.; Carrasco, S.; Berger, U.; Sundrum, A.; Bellof, G. Fattening and slaughtering performance of growing pigs consuming high levels of alfalfa silage (Medicago sativa) in organic pig production. Livest. Sci. 2017, 200, 46–52. [Google Scholar] [CrossRef]
  12. Wang, J.W.; Qin, C.F.; He, T.; Qiu, K.; Sun, W.J.; Zhang, X.; Jiao, N.; Zhu, W.Y.; Yin, J.D. Alfalfa-containing diets alter luminal microbiota structure and short chain fatty acid sensing in the caecal mucosa of pigs. J. Anim. Sci. Biotechnol. 2018, 9. [Google Scholar] [CrossRef]
  13. Muck, R.E.; Hintz, R.W. Effects of breeding for quality on alfalfa ensilability. Trans. ASAE 2003, 46, 1305–1309. [Google Scholar]
  14. Roinsard, A.; Gain, C.; Gidenne, T.; Martin, G.; Goby, J.P.; Maupertuis, F.; Ferchaud, S.; Renaudeau, D.; Brachet, M.; Germain, K.; et al. Exploiting grass to raise monogastric livestock on organic farms: Conclusions and future directions. Fourrages 2017, 231, 191–202. [Google Scholar]
  15. Kanengoni, A.T.; Chimonyo, M.; Ndimba, B.K.; Dzama, K. Potential of Using Maize Cobs in Pig Diets-A Review. Asian Australas. J. Anim. Sci. 2015, 28, 1669–1679. [Google Scholar] [CrossRef] [PubMed]
  16. Mackenzie, S.G.; Leinonen, I.; Ferguson, N.; Kyriazakis, I. Can the environmental impact of pig systems be reduced by utilising co-products as feed? J. Clean. Prod. 2016, 115, 172–181. [Google Scholar] [CrossRef]
  17. Tallentire, C.W.; Mackenzie, S.G.; Kyriazakis, I. Can novel ingredients replace soybeans and reduce the environmental burdens of European livestock systems in the future? J. Clean. Prod. 2018, 187, 338–347. [Google Scholar] [CrossRef]
  18. Castellini, C.; Bastianoni, S.; Granai, C.; Bosco, A.D.; Brunetti, M. Sustainability of poultry production using the emergy approach: Comparison of conventional and organic rearing systems. Agric. Ecosyst. Environ. 2006, 114, 343–350. [Google Scholar] [CrossRef]
  19. Yu, X.H. Meat consumption in China and its impact on international food security: Status quo, trends, and policies. J. Integr. Agric. 2015, 14, 989–994. [Google Scholar] [CrossRef]
  20. Xu, Q.; Wang, X.L.; Xiao, B.; Hu, K.L. Rice-crab coculture to sustain cleaner food production in Liaohe River Basin, China: An economic and environmental assessment. J. Clean. Prod. 2019, 208, 188–198. [Google Scholar] [CrossRef]
  21. Wang, X.; Chen, Y.; Sui, P.; Gao, W.; Qin, F.; Zhang, J.; Wu, X. Emergy analysis of grain production systems on large-scale farms in the North China Plain based on LCA. Agric. Syst. 2014, 128, 66–78. [Google Scholar] [CrossRef]
  22. Wang, X.; Chen, Y.; Sui, P.; Gao, W.; Qin, F.; Wu, X.; Xiong, J. Efficiency and sustainability analysis of biogas and electricity production from a large-scale biogas project in China: An emergy evaluation based on LCA. J. Clean. Prod. 2014, 65, 234–245. [Google Scholar] [CrossRef]
  23. Veysset, P.; Lherm, M.; Bebin, D. Energy consumption, greenhouse gas emissions and economic performance assessments in French Charolais suckler cattle farms: Model-based analysis and forecasts. Agric. Syst. 2010, 103, 41–50. [Google Scholar] [CrossRef]
  24. Johansson, L.; Lundstrom, K.; Jonsall, A. Effects of RN genotype and silage feed on fat content and fatty acid composition of fresh and cooked pork loin. Meat Sci. 2002, 60, 17–24. [Google Scholar] [CrossRef]
  25. Mason, F.; Pascotto, E.; Zanfi, C.; Spanghero, M. Effect of dietary inclusion of whole ear corn silage on stomach development and gastric mucosa integrity of heavy pigs at slaughter. Vet. J. 2013, 198, 717–719. [Google Scholar] [CrossRef] [PubMed]
  26. Presto, M.; Rundgren, M.; Wallenbeck, A. Inclusion of grass/clover silage in the diet of growing/finishing pigs - Influence on pig time budgets and social behaviour. Acta Agric. Scand. Sect. Anim. Sci. 2013, 63, 84–92. [Google Scholar] [CrossRef]
  27. Yuan, M.; Yi, X.; Chen, Y.; Zhao, K.; Wu, X.; Yang, X.; Liu, L.; Wang, Q. The current stitution, development problems and cultivating suggestion of family farms in china based on the ministry of agriculture special investigation of 343000 sample data. J. China Agric. Resour. Reg. Plan. 2017, 38, 184–188. [Google Scholar]
  28. Odum, H.T. Ecological Engineering-The Necessary Use of Ecological Self-Design. Ecol. Eng. 1994, 3, 115–118. [Google Scholar]
  29. Odum, H.T. Environmental Accounting: Emergy and Environmental Decision Making; Wiley: New York, NY, USA, 1996. [Google Scholar]
  30. Han, D.; Wiesmeier, M.; Conant, R.T.; Kuehnel, A.; Sun, Z.G.; Koegel-Knabner, I.; Hou, R.X.; Cong, P.F.; Liang, R.B.; Ouyang, Z. Large soil organic carbon increase due to improved agronomic management in the North China Plain from 1980s to 2010s. Glob. Chang. Biol. 2018, 24, 987–1000. [Google Scholar] [CrossRef]
  31. Brown, M.T.; Ulgiati, S. Emergy-based indices and ratios to evaluate sustainability: Monitoring economies and technology toward environmentally sound innovation. Ecol. Eng. 1997, 9, 51–69. [Google Scholar] [CrossRef]
  32. Wang, X.; Dadouma, A.; Chen, Y.; Sui, P.; Gao, W.; Jia, L. Sustainability evaluation of the large-scale pig farming system in North China: An emergy analysis based on life cycle assessment. J. Clean. Prod. 2015, 102, 144–164. [Google Scholar] [CrossRef]
  33. Yang, Z.F.; Jiang, M.M.; Chen, B.; Zhou, J.B.; Chen, G.Q.; Li, S.C. Solar emergy evaluation for Chinese economy. Energy Policy 2010, 38, 875–886. [Google Scholar] [CrossRef]
  34. Campbell, D.E.; Lu, H.; Walker, H.A. Relationships among the Energy, Emergy, and Money Flows of the United States from 1900 to 2011. Front. Energy Res. 2014, 2, 1–31. [Google Scholar] [CrossRef]
  35. National Bureau of Statistics of China. China Statistical Yearbook, 2018. Available online: http://www.stats.gov.cn/tjsj/ndsj/2018/indexch.htm (accessed on 15 September 2019).
  36. Odum, H.T.; Brown, M.T.; Brandt-Williams, S.L. Folio #1. Handbook of Emergy Evaluation; Center for Environmental Policy: Gainesville, FL, USA, 2000. [Google Scholar]
  37. Wang, X.; Wu, X.; Yan, P.; Gao, W.; Chen, Y.; Sui, P. Integrated analysis on economic and environmental consequences of livestock husbandry on different scale in China. J. Clean. Prod. 2016, 119, 1–12. [Google Scholar] [CrossRef]
  38. IUCN/UNEP/WWF. Caring for the Earth: A Strategy for Sustainable Living, Gland, Switzerland; IUCN: Gland, Switzerland, 1991. [Google Scholar]
  39. Lusiana, B.; van Noordwijk, M.; Cadisch, G. Land sparing or sharing? Exploring livestock fodder options in combination with land use zoning and consequences for livelihoods and net carbon stocks using the FALLOW model. Agric. Ecosyst. Environ. 2012, 159, 145–160. [Google Scholar] [CrossRef]
  40. Peters, C.J.; Picardy, J.; Darrouzet-Nardi, A.F.; Wilkins, J.L.; Griffin, T.S.; Fick, G.W. Carrying capacity of US agricultural land: Ten diet scenarios. Elem. Sci. Anthr. 2016, 4. [Google Scholar] [CrossRef]
  41. Thapa, G.B.; Paudel, G.S. Evaluation of the livestock carrying capacity of land resources in the Hills of Nepal based on total digestive nutrient analysis. Agric. Ecosyst. Environ. 2000, 78, 223–235. [Google Scholar] [CrossRef]
  42. Wen, H. Methods and Cases of Agricultural Development Planning; Chinese edition; China Agricultural Science and Technology Press: Beijing, China, 2009. [Google Scholar]
  43. MOA. Technical Guide of Livestock Carrying Capacity Based on Manure; Ministry of Agriculture and Rural Affairs: Beijing, China, 2018.
  44. Wei, W.; Yan, Y.; Cao, J.; Christie, P.; Zhang, F.; Fan, M. Effects of combined application of organic amendments and fertilizers on crop yield and soil organic matter: An integrated analysis of long-term experiments. Agric. Ecosyst. Environ. 2016, 225, 86–92. [Google Scholar] [CrossRef] [Green Version]
  45. Charuaud, L.; Jarde, E.; Jaffrezic, A.; Liotaud, M.; Goyat, Q.; Mercier, F.; Le Bot, B. Veterinary pharmaceutical residues in water resources and tap water in an intensive husbandry area in France. Sci. Total Environ. 2019, 664, 605–615. [Google Scholar] [CrossRef] [Green Version]
  46. Cavalett, O.; Ortega, E. Emergy, nutrients balance, and economic assessment of soybean production and industrialization in Brazil. J. Clean. Prod. 2009, 17, 762–771. [Google Scholar] [CrossRef]
  47. Cavalett, O.; De Queiroz, J.F.; Ortega, E. Emergy assessment of integrated production systems of grains, pig and fish in small farms in the South Brazil. Ecol. Model. 2006, 193, 205–224. [Google Scholar] [CrossRef] [Green Version]
  48. Yang, H.; Chen, L.; Yan, Z.; Wang, H. Emergy analysis of cassava-based fuel ethanol in China. Biomass Bioenergy 2011, 35, 581–589. [Google Scholar] [CrossRef]
  49. Brown, M.T.; Ulgiati, S. Emergy evaluations and environmental loading of electricity production systems. J. Clean. Prod. 2002, 10, 321–334. [Google Scholar] [CrossRef]
  50. Zhang, L.X.; Ulgiati, S.; Yang, Z.F.; Chen, B. Emergy evaluation and economic analysis of three wetland fish farming systems in Nansi Lake area, China. J. Environ. Manag. 2011, 92, 683–694. [Google Scholar] [CrossRef] [PubMed]
  51. Agostinho, F.; Diniz, G.; Siche, R.; Ortega, E. The use of emergy assessment and the Geographical Information System in the diagnosis of small family farms in Brazil. Ecol. Model. 2008, 210, 37–57. [Google Scholar] [CrossRef]
  52. Galassi, G.; Malagutti, L.; Rapetti, L.; Crovetto, G.M.; Zanfi, C.; Capraro, D.; Spanghero, M. Digestibility, metabolic utilisation and effects on growth and slaughter traits of diets containing whole plant maize silage in heavy pigs. Ital. J. Anim. Sci. 2017, 16, 122–131. [Google Scholar] [CrossRef] [Green Version]
  53. Jiang, Y.Z.; Zhu, L.; Tang, G.Q.; Li, M.Z.; Jiang, A.A.; Cen, W.M.; Xing, S.H.; Chen, J.N.; Wen, A.X.; He, T.; et al. Carcass and meat quality traits of four commercial pig crossbreeds in China. Genet. Mol. Res. 2012, 11, 4447–4455. [Google Scholar] [CrossRef] [PubMed]
Figure 1. Aggregated system diagrams of the different EPRSs.
Sustainability 11 06485 g001
Figure 2. Emergy profiles of the ecological pig-raising systems.
Sustainability 11 06485 g002
Figure 3. Contributions to the cost per kg pig live weight of the ecological pig-raising systems (EPRS).
Sustainability 11 06485 g003
Figure 4. Area consumed and ratio RL2:RL1 (RRLs) of the ecological pig-raising systems (EPRS).
Sustainability 11 06485 g004
Figure 5. Rose diagram of relative values of emergy, economy-based and livestock carrying-capacity indices of the ecological pig-raising systems (EPRS). Larger areas indicate better performance.
Sustainability 11 06485 g005
Figure 6. Emergy profiles of the maize grain and maize silage (per kg dry matter).
Sustainability 11 06485 g006
Table 1. Composition of the feed (by mass) during each phase of the three ecological pig-raising systems (EPRS).
ComponentPhase IPhase IIPhase III
EPRS AEPRS B and EPRS CEPRS AEPRS B and EPRS CEPRS AEPRS B and EPRS C
Sun-dried maize silage (%)030035040
Maize grain (%)653570357535
Wheat bran meal (%)101010101010
Soya bean meal (%)252520201515
Table 2. Formulas and descriptions of emergy-based index.
IndexFormula aDescriptionReference
Unit emergy value (UEV) U / E Emergy efficiency of the yield and key transformed parameter[29]
Emergy yield ratio (EYR) U / F Total emergy released per unit of emergy invested[29]
Environmental loading ratio (ELR) ( N + F ) / R Pressure of the entire system on the environment[31]
Emergy sustainability index (ESI) EYR / ELR Sustainability of a system[31]
a E: Energy yield from production; U: Total emergy inputs; F: Emergy flows from the market; N: Non-renewable emergy flows; R: Renewable emergy flows.
Table 3. Formulas and descriptions of the economy-based index.
Index aUnitsFormulationDescription
Yield-based economic profit (Py)¥/kg ( Price Cost ) / Weight Profit per kg live weight
Area-based economic profit (Pa)¥/m2 ( Price Cost ) / Area Profit per m2 of pen area
Ratio of incomes and costs (I:C)NA Price / Cost Return on investment from pig production
a reference source: Wang et al., 2016 [37].
Table 4. Emergy input and output details of the ecological pig-raising systems (EPRS) (per kg pig live weight).
No.ItemUnitRNF aUEV bEPRS AEPRS BEPRS C
seJ/unitRaw DataEmergyRaw DataEmergyRaw DataEmergy
Natural environmental inputs
1Sun J1.0001.00 × 10117.95 × 1077.95 × 1077.90 × 1077.90 × 1071.05 × 1081.05 × 108
2Wind J1.0001.86 × 1032.20 × 1044.08 × 1072 × 1044.05 × 1072.90 × 1045.37 × 107
3Rain J1.0002.35 × 1044.46 × 1041.05 × 1094.43 × 1041.04 × 1045.88 × 1041.38 × 109
4Ground waterJ0.0001.86 × 1053.92 × 1047.27 × 1093.89 × 1047.23 × 1095.17 × 1049.59 × 109
Local materials
5Maize silage (dry matter)g0.2411.62 × 1080.00 × 1000.00 × 1001.18 × 1031.92 × 10111.44 × 1032.33 × 1011
6Maize graing0.2385.79 × 1082.38 × 1031.38 × 10121.19 × 1036.89 × 10111.44 × 1038.33 × 1011
7Wheat brang0.4168.41 × 1083.33 × 1022.81 × 10113.29 × 1022.77 × 10113.99 × 1023.35 × 1011
Purchased materials
8Pigletkg0.2059.02 × 10122.29 × 10−12.07 × 10122.28 × 10−12.05 × 10121.23 × 10−11.11 × 10¹²
9Soya bean mealg0.3301.42 × 1096.17 × 1028.79 × 10115.90 × 1028.40 × 10117.15 × 1021.02 × 1012
10Vaccineg0.0001.89 × 10101.75 × 10−23.30 × 1088.70 × 10−31.64 × 1081.15 × 10−22.18 × 10⁸
11Disinfectantsg0.0001.27 × 1092.43 × 10−13.09 × 1082.42 × 10−13.07 × 1083.21 × 10−14.08 × 10⁸
12Micro-biological additivesc¥0.2003.31 × 10113.06 × 10−11.01 × 10113.04 × 10−11.01 × 10114.04 × 10−11.34 × 10¹¹
13ElectricityJ0.0902.17 × 1053.40 × 1047.40 × 1093.38 × 1047.35 × 1094.49 × 1049.76 × 109
14Steelg0.0003.52 × 1096.30 × 1002.22 × 10106.26 × 1002.21 × 10108.31 × 1002.93 × 1010
15Concreteg0.0004.42 × 1084.49 × 1011.98 × 10104.46 × 1011.97 × 10105.92 × 1012.62 × 1010
16Glassg0.0002.90 × 1072.30 × 10−16.67 × 1062.28 × 10−16.62 × 1063.03 × 10−18.79 × 10⁶
17Building¥0.0503.31 × 10111.09 × 10−23.62 × 1091.09 × 10−23.60 × 1091.44 × 10−24.78 × 10⁹
18Facilities¥0.0503.31 × 10115.46 × 10−21.81 × 10105.42 × 10−21.79 × 10107.20 × 10−22.38 × 10¹⁰
19Medicine¥0.0503.31 × 10118.58 × 10−12.84 × 10112.61 × 10−18.63 × 10102.31 × 10−17.64 × 10¹⁰
20LaborJ0.6005.73 × 1064.30 × 1042.46 × 10114.26 × 1042.44 × 10115.66 × 1043.24 × 1011
Outputs
Pigsg 1.00 × 10³ 1.00 × 10³ 1.00 × 10³
a RNF reference sources:1, 2, 3, 4 came from [29]; 5, 6, 7 calculated process can be found in the Supplementary Materials part; 8, 19 came from [32]; 9 came from [46]; 10, 11 came from [47]; 12 came from [48]; 13, 15, 16 came from [49]; 14, 17, 18 came from [50]; 20 came from [51].b UEV (baseline 12.00 × 1024 seJ/year) reference sources:1, 2, 3, 20 came from [29]; 5, 6, 7 calculated process can be found in the Supplementary Materials part; 8 came from [32]; 9 came from [46]; 10, 11 came from [47];12, 17, 18, 19 came from [33]; 13, 14, 15, 16 came from [49].
Table 5. Mean aggregated emergy flows of the ecological pig-raising systems (EPRS) (seJ/kg live pig).
Emergy FlowEPRS A%EPRS B%EPRS C%
Total emergy inputs (U)5.32 × 1012100.00%4.56 × 1012100.00%4.17 × 1012100.00%
Total nonrenewable emergy flows (N)3.98 × 101274.78%3.37 × 101273.82%2.99 × 101271.62%
Total renewable emergy flows (R)1.34 × 101225.22%1.19 × 101226.18%1.18 × 101228.38%
Local environmental inputs (En)8.32 × 1090.16%8.27 × 1090.18%1.10 × 10100.26%
Emergy flows from markets (F)5.00 × 101293.93%4.3 × 101294.20%3.85 × 101292.29%
Table 6. Mean emergy index of the EPRSs.
IndexUnitEPRS AEPRS BEPRS C
Unit emergy value (UEV)seJ/kg5.32 × 10124.56 × 10124.17 × 1012
Emergy yield ratio (EYR) 1.0651.0621.084
Environmental loading ratio (ELR) 2.9662.8192.524
Emergy sustainability index (ESI) 0.3590.3770.429
Table 7. Mean economic values of the ecological pig-raising systems (EPRS).
ItemUnitEPRS AEPRS BEPRS C
Weight per live pigkg114.25115.0086.63
Cost per live pig¥1085.71940.221021.67
Selling price per live pig¥2285.002300.002425.50
Cost per kg pig live weight¥/kg9.508.1811.79
Selling price per kg pig live weight¥/kg20.0020.0028.00
Table 8. Mean economic index of the ecological pig-raising systems (EPRS) (per kg live pig).
IndexUnitEPRS AEPRS BEPRS C
Yield-based economic profit (Py)¥10.5011.8216.21
Area-based economic profit (Pa)¥/m2479.72543.91561.53
Ratio of income to cost (I:C)NA2.102.452.37
Table 9. Mean characteristics (per live pig during the fattening period) used to calculate carrying capacity indices of the ecological pig-raising systems (EPRS).
ItemsUnitsEPRS AEPRS BEPRS C
Feedkg381.02378.57345.50
Manure weightkg48.7985.0392.22
Urine volumeL251.86373.15255.75
Manure nitrogeng1441.912006.402217.55
Urine nitrogeng1904.062929.202849.06
Total nitrogen excretiong3345.974935.605066.62
Table 10. Mean livestock carrying-capacity indices of the ecological pig-raising systems (EPRS).
IndexUnitEPRS AEPRS BEPRS C
L1pigs/ha11.0114.8616.28
L2 apigs /ha50.5934.3033.41
RL1 bm2/kg3.972.933.55
RL2 a,bm2/kg0.801.171.59
RRL(RL2:RL1)NA0.200.400.45
a We chose K = 0.5, γ = 0.45, ε = 0.65, θ = 0.3 based on level II land’s index in GB/T25246-2010. b The feed consumed L1 and L2 is mean feed weight consumed per day multiplied by 365 days a year. In order to reflect the raising mode, the feed consumed in RL1 and RL2 is total feed consumed per batch multiplied by 2 batches per year.

