Article

Fuzzy Linear Programming Models for a Green Logistics Center Location and Allocation Problem under Mixed Uncertainties Based on Different Carbon Dioxide Emission Reduction Methods

1
School of Management Science and Engineering, Shandong University of Finance and Economics, Jinan 250014, China
2
School of Traffic and Transportation, Beijing Jiaotong University, Beijing 100044, China
3
Unit of Logistics and Informatics, KTH Royal Institute of Technology, 14156 Huddinge, Sweden
*
Author to whom correspondence should be addressed.
Sustainability 2019, 11(22), 6448; https://doi.org/10.3390/su11226448
Submission received: 9 October 2019 / Revised: 12 November 2019 / Accepted: 14 November 2019 / Published: 15 November 2019

Abstract

:
This study explores a foundational logistics center location and allocation problem in a three-stage logistics network that consists of suppliers, logistics centers, and customers. In this study, the environmental sustainability of the logistics network is improved by optimizing the carbon dioxide emissions of the logistics network based on multi-objective optimization and carbon tax regulation. Mixed uncertainties in the planning stage, including the supply capacities of suppliers, operation capacities of logistics centers, and demands of customers, are modeled using triangular fuzzy numbers based on the fuzzy set theory to order to enhance the reliability of the logistics center location and allocation planning. To solve the green logistics center location and allocation problem under mixed uncertainties, we establish two fuzzy mixed integer linear programming models. The fuzzy credibilistic chance-constrained programming is then adopted to obtain the crisp and linear reformulations of the fuzzy programming models. A numerical case is given to verify the feasibility of the proposed methods, in which the performance of carbon tax regulation in reducing carbon dioxide emissions is then tested based on the benchmark provided by the multi-objective optimization. Lastly, sensitivity analysis and fuzzy simulation are utilized to reveal the effect of the mixed uncertainties on the logistics location and allocation planning and further determine the best confidence level in the fuzzy chance constraints to provide decision makers with a crisp plan.

1. Introduction

A logistics center is the place where various kinds of logistics activities (e.g., picking-up and delivery of goods, materials handling, warehousing, and inventory management) are carried out [1]. It plays an important and core role in not only the logistics network but also the entire supply chain [2]. The number of logistics centers and their locations, as well as the good flow assignment around them, have significant effects on the performance of the logistics network in cost efficiency and customer service level [3,4]. Logistics centers consume the majority of the capital of constructing and operating logistics networks. As a result, it is believed that opening or closing logistics centers to change the structure of the logistics network is highly expensive and time-consuming, and should be avoided in the practical operations and management of logistics networks [2,3]. Therefore, the logistics center location and allocation problem (also known as logistics network design problem) is a challenge faced by the decision makers in the planning stage, and is also a highlighted topic in the logistics planning field. Moreover, as shown in Figure 1, the three-stage logistics network that consists of suppliers, logistics centers, and customers is the most representative configuration of a logistics system. It can be flexibly modified to fit not only logistics systems [5,6] but also supply chain systems [7,8] and manufacturing systems [9,10]. Consequently, we explore the logistics center location and allocation problem in such a three-stage logistics network, and only consider the forward flows in such logistics network. However, besides forward flows, reverse flows are also important in the logistics activities, since more and more companies consider reverse logistics a profitable and sustainable business strategy and require logistics systems to provide them with recycling and reusing of used materials [11,12]. Therefore, although this study only formulates forward flows in the logistics center location and allocation problem, it should be clarified that reverse logistics is of significant importance in the logistics systems.
Presently, environmental sustainability has been a concern of both the government and the public, and the question of how to promote sustainable development of all kinds of industries has gained attention in recent years. Global warming caused by greenhouse gas emissions is considered the biggest environmental issue that threatens sustainable development in human society [13]. Greenhouse gases include carbon dioxide, methane, and nitrous oxide. Since carbon dioxide accounts for approximately 80% of the greenhouse gas [14], reducing carbon dioxide emissions is acknowledged to be an effective way to control greenhouse gas emissions and realize environmental sustainability. Although electricity and heat production are believed to be the main sources of carbon dioxide emissions, according to the International Energy Agency [15], the logistics industry also contributes significantly to the emissions, since associated activities consume a large amount of both liquid and fossil fuels, which emit a significant amount of carbon dioxide, as well as large numbers of other pollutants, into the environment. Therefore, the logistics industry should take responsibility for controlling carbon dioxide emissions together with electricity and heating industries. As a result, besides improving the logistics economy, logistics planning should consider reducing carbon dioxide emissions as its responsibility and as part of a public goal to achieve green logistics [16]. In this study, we extend the logistics center location and allocation problem into a green version by optimizing carbon dioxide emissions and improving the economy of the logistics network.
Furthermore, the logistics center location and allocation problem is a long-term plan [17]. Such planning should be designed in advance and then used to support the subsequent construction of logistics centers and operation of a logistics network. The parameters of the logistics network that determine the planning results cannot be held constant and usually change over time in the planning, construction, and operation stages [2]. In the logistics network, the supplies of suppliers and demands of customers are sensitive to the constantly changing market, and may change in response to the variation of the market environment, which results in the supply uncertainty and demand uncertainties. The construction of logistics centers cannot be accomplished in a short period. During the construction, the policies, investment, land requisition, and other issues will influence the construction scales of logistics centers, which, in turn, will decide their capacities. Moreover, during the operation of a logistics center, bad weather, accidents, technical errors, and other issues will reduce the capacity of the logistics center. However, updating and purchasing equipment and facilities, employing more staff, utilizing new techniques, and taking part in other improvements will help enhance the capacities of logistics centers. Therefore, the operation capacities of logistics centers are difficult to determine in the planning stage. Above all, uncertain parameters should include the supply capacities of suppliers, the operation capacities of logistics centers, and the demands of customers. It is necessary to formulate these as uncertain parameters when modelling instead of deterministic parameters, since deterministic estimations of uncertain parameters lead to the underestimation and overestimation that considerably reduces the quality of the plan [18]. Consequently, we consider mixed uncertainties when modeling and optimizing the logistics center location and allocation problem for improved reliability.
Above all, we discuss a green logistics location and allocation problem under mixed uncertainties. To solve the problem, we discuss the utilization of two carbon dioxide emission optimization methods, including multi-objective optimization and carbon tax regulation. We adopt fuzzy set theory to model the uncertain parameters, i.e., supply capacities of suppliers, operation capacities of logistics centers, and demands of customers, by triangular fuzzy numbers. Based on the carbon dioxide emission optimization methods, we provide two fuzzy linear programming models whose crisp reformulations can be obtained by a fuzzy credibility measure and fuzzy chance-constrained programming. We also design a numerical case, in which the comparison between the two carbon dioxide emission optimization methods will be conducted, and the effects of the fuzziness on the problem optimization are quantified.
The remaining sections of this study are organized as follows. In Section 2, a literature review is presented to indicate the research frontiers and research gaps of the logistics center location and allocation problem, so that our improvements on the problem can be clarified. In Section 3, two fuzzy linear programming models are established for the green logistics center location and allocation problem under mixed uncertainties. Then, in Section 4, based on the fuzzy credibility measure, fuzzy chance-constrained programming is adopted to carry out the defuzzification of the fuzzy models to generate their crisp and linear reformulations that can be effectively solved by an exact solution algorithm run by mathematical programming software. In Section 5, a numerical case is presented. The performance of carbon tax regulation in reducing carbon dioxide emissions of the logistics network is tested and the effect of the mixed uncertainties on the planning is quantified in this section. Lastly, the conclusions of this study and some managerial implications summarized from the case study are provided in Section 6.

2. Literature Review

The logistics center location and allocation problem (or logistics network design problem) has been a constantly highlighted topic in the logistics planning field, especially in relation to the rapid development of the logistics industry. Large numbers of articles on the relative topic can be found, which provide a solid foundation for us to carry out this study. In this section, we review the existing literature from the perspectives of how existing studies improve environmental sustainability and address uncertainties in the logistics center location and allocation problem.
In this study, we selected the articles to be reviewed by using the Google Scholar search engine that records significantly more articles globally when compared with other databases. When selecting articles on the topic of green logistics, we focused on keywords “green logistics network design,” “location and allocation,” “carbon dioxide emissions,” and “carbon emission regulations.” We used keywords “reliable logistics network design,” “location and allocation,” and “uncertainty” to identify articles that dealt with the logistics network design problem under an uncertain environment. Since there were large numbers of related articles, we further selected articles that fell into the topics that we were interested in based on the following rules. First of all, the articles were published in the last two decades. Second, the articles were published by journals indexed by Engineering Village Compendex Database or with impact factors released by journal citation reports or by famous conferences such as the IEEE conferences and Elsevier Procedia.
Based on the criteria, we select 22 articles [1,2,3,4,5,6,7,8,19,20,21,22,23,24,25,26,27,28,29,30,31,32] to undertake the literature review. There are two articles [2,32] published by Journal of Transportation Systems Engineering & Information Technology that is indexed by an Engineering Village Compendex Database. Three articles [1,23,28] published by conference proceedings can be found, including one published by the IEEE conference [23] and two published by Elsevier Procedia [1,28]. The rest of the articles were all published by journals with impact factors, in which Computer & Industry Engineering published three references [5,6,21] that have the largest number of selected articles. Applied Mathematical Modelling published two references [26,27].

2.1. Review of the Green Logistics Center Location and Allocation Problem

Carbon tax regulation is currently the most popular method used in the green logistics network or supply chain planning to reduce carbon dioxide emissions. For a detailed summarization, readers can refer to Xu et al.’s study [19]. Under carbon tax regulation, logistics activities are charged for each unit of carbon dioxide emission with a carbon tax [33]. The emission tax is then integrated into the cost objective of the logistics center location and allocation problem. By lowering the cost objective in the optimization of the problem, the carbon dioxide emissions, as part of the objective, can be reduced.
Carbon tax regulation is simple and is easy to model in the planning problems with environmental concerns [34]. However, it does not always work out for all cases. In the green multimodal routing problem, Sun et al. [13] and Zhang et al. [35] found that the performance of carbon tax regulation in reducing carbon dioxide emissions depends on a large tax rate that is not feasible in the practical market and, if the tax rate is small, the carbon tax regulation only increases the cost of the multi-modal transportation without changing the multi-modal routes. Similarly, it is different to ensure that the carbon tax regulation must perform well in the green logistics center location and allocation planning. However, the existing literature only focuses on using sensitivity analysis to discuss the effect of the carbon tax rate on the logistics planning without deeply quantifying its performance in designing a green logistics network.
Additionally, as an effective alternative to carbon tax regulation, multi-objective optimization is employed by many studies to solve the green logistics center location and allocation problem, e.g., Wang et al. [20], Pishvaee et al. [21], and Govindan et al. [22]. In these studies, the emission objective that aims to minimize the total carbon dioxide emissions of a logistics network is independent of the cost objective for planning. By using a weighted sum method, the ε-constraint method, or the normalized normal constraint method, Pareto solutions for the problem can be obtained to help decision makers make a tradeoff between the cost objective and the emission objective. Compared with the carbon tax regulation, multi-objective optimization is more straightforward without adding an additional cost to the logistics activities.
It is clear that the Pareto solutions to the multi-objective optimization for the green logistics center location and allocation problem provide a benchmark that can be used to test the performance of carbon tax regulation in a quantitative way. Therefore, in this study, as an improvement to the existing literature, we utilize both carbon tax regulation and multi-objective optimization to optimize the problem, and then analyze the performance of carbon tax regulation based on the Pareto solutions provided by the multi-objective optimization. Through this analysis, we aim to find the best carbon tax rate for a given case and check if it is feasible in practice.

2.2. Review of the Logistics Center Location and Allocation Problem under an Uncertain Environment

Improving reliability is an important goal for transportation/logistics/supply chain planning. Uncertainty is the main issue that influences the reliability of planning [36,37]. The logistics center location and allocation problem under an uncertain environment receives extensive attention from the logistics planning field. There have been many studies that concern one source of uncertainty, in which demand uncertainty related to the logistics center location and allocation problem (logistics network design problem) has received the widest attention, e.g., Zhang et al. [23], Zhang and Xu [24], Pishvaee et al. [25], Amin et al. [26], Hatefi and Jolai [27], and Shimizu et al. [28]. Studies that consider supply uncertainty can also be found, e.g., Lieckensab and Vandaeleab [29]. As indicated by Sun et al. [13], combining more than one source of uncertainty can further help enhance the reliability of the planning. However, there have been a few articles that consider mixed uncertainties when modeling the logistics center location and allocation problem. The formulation of both demand uncertainty and supply uncertainty are the common combination in these limited articles, e.g., Lee and Dong [30] and Zeballos et al. [31].
The uncertainty associated with logistics centers also exists in the logistics center location and allocation problem. Similar to the reason that results in supply and demand uncertainty, the operation capacities of logistics centers cannot be modeled in a deterministic way. Therefore, in the logistics network, there are three kinds of parameters that are uncertain in the logistics center location and allocation planning: supply capacities of suppliers, operation capacities of logistics centers, and demands of customers. In this study, the mixed uncertainties that cover all the participants in the three-stage logistics network will be comprehensively formulated in the optimization, which further improves the reliability of planning when compared with considering only one or part of the uncertainties.
Moreover, stochastic programming is employed by the majority of related studies to deal with the uncertainty, while fuzzy set theory and fuzzy programming are less popular compared with the above two methods. However, as stated by Zarandi et al. [38] and Zheng and Liu [39], using fuzzy programming is more applicable in practice, since it does not need large-scale historical data required by stochastic programming, but unattainable in most cases to fit the possibility distributions of uncertain parameters. Based on fuzzy set theory introduced by Zadeh [40], uncertain parameters can be effectively represented by fuzzy numbers, and objectives and constraints that contain fuzzy parameters can be addressed by fuzzy programming. As a result, in this study, we build fuzzy programming models to deal with the problem using the fuzzy set theory to describe the fuzzy parameters. This method is similar to the one developed by Pishvaee et al. [21]. The differences include using a different kind of fuzzy numbers to formulate the fuzzy parameters and propose a different analysis method to explore the effect of the fuzziness on the planning.

2.3. Research Gaps

Overall, through the literature review presented in Section 2.1 and Section 2.2, we find that there are still research gaps for the green logistics center location and allocation problem in an uncertain environment.
(1) The effectiveness of carbon tax regulation in reducing carbon dioxide emissions of the logistics network needs to be demonstrated, since there are a few studies on other topics (e.g., Sun et al. [13]) finding that carbon tax regulation sometimes does not work. However, the existing literature only focuses on the use of regulation without discussing its effectiveness in a quantitative way.
(2) There is more than one method to reduce carbon dioxide emissions, e.g., carbon tax regulation and multi-objective optimization. Consequently, in practical decision making, decision makers should decide which method is more useful. However, there are currently no relative articles that systematically analyze this issue.
(3) The sources of uncertainty are not fully covered by the existing literature. Among the related studies, the majority only concerns one source. A few articles consider the combination of supply uncertainty and demand uncertainty. However, the capacity uncertainty of logistics centers has rarely gained attention.
(4) The stochastic programming used by the majority of studies is different to realize due to its excessive demand for large-scale historical data that is difficult to obtain in most cases. Therefore, it is worthwhile to try to use fuzzy programming to model the uncertain logistics center location and allocation problem and, accordingly, explore the effects of the fuzziness on the problem optimization.

2.4. Research Works

Consequently, the following two improvements in enhancing environmental sustainability and reliability of the planning can still be made.
(1) Comparing the performances of multi-objective optimization and carbon tax regulation in reducing carbon dioxide emissions, and helping decision makers to determine the more efficient method to be used for the green logistics center location and allocation problem.
(2) Improving the reliability of the logistics center location and allocation planning by considering mixed uncertainties of all the participants in the logistics network, selecting suitable methods to model the uncertainties and the planning problem under mixed uncertainties, and deeply analyzing the effect of mixed uncertainties for planning to provide decision makers with helpful insights.
To achieve the above two goals, our work covers five aspects.
(1) Two carbon dioxide emission optimization methods, known as multi-objective optimization and carbon tax regulation, are used in the green logistics center location and allocation problem.
(2) Based on the fuzzy set theory, the uncertain parameters, i.e., supply capacities of suppliers, operation capacities of logistics centers, and demands of customers, are modelled by triangular fuzzy numbers.
(3) Two fuzzy linear programming models are proposed to deal with the green logistics center location and allocation problem under mixed uncertainties. The fuzzy constraints that contain fuzzy parameters are further addressed by a fuzzy credibility measure and fuzzy chance-constrained programming to realize the defuzzification of the fuzzy models.
(4) The performance of carbon tax regulation in reducing carbon dioxide emissions of the logistics network is verified based on the benchmark, i.e., Pareto solutions, provided by the multi-objective optimization in a numerical case.
(5) Based on the same numerical case, the effect of the mixed uncertainties on the green logistics center location and allocation planning is quantified by sensitivity analysis and fuzzy simulation. The approach to determine the best confidence level for the fuzzy chance constraints is developed.

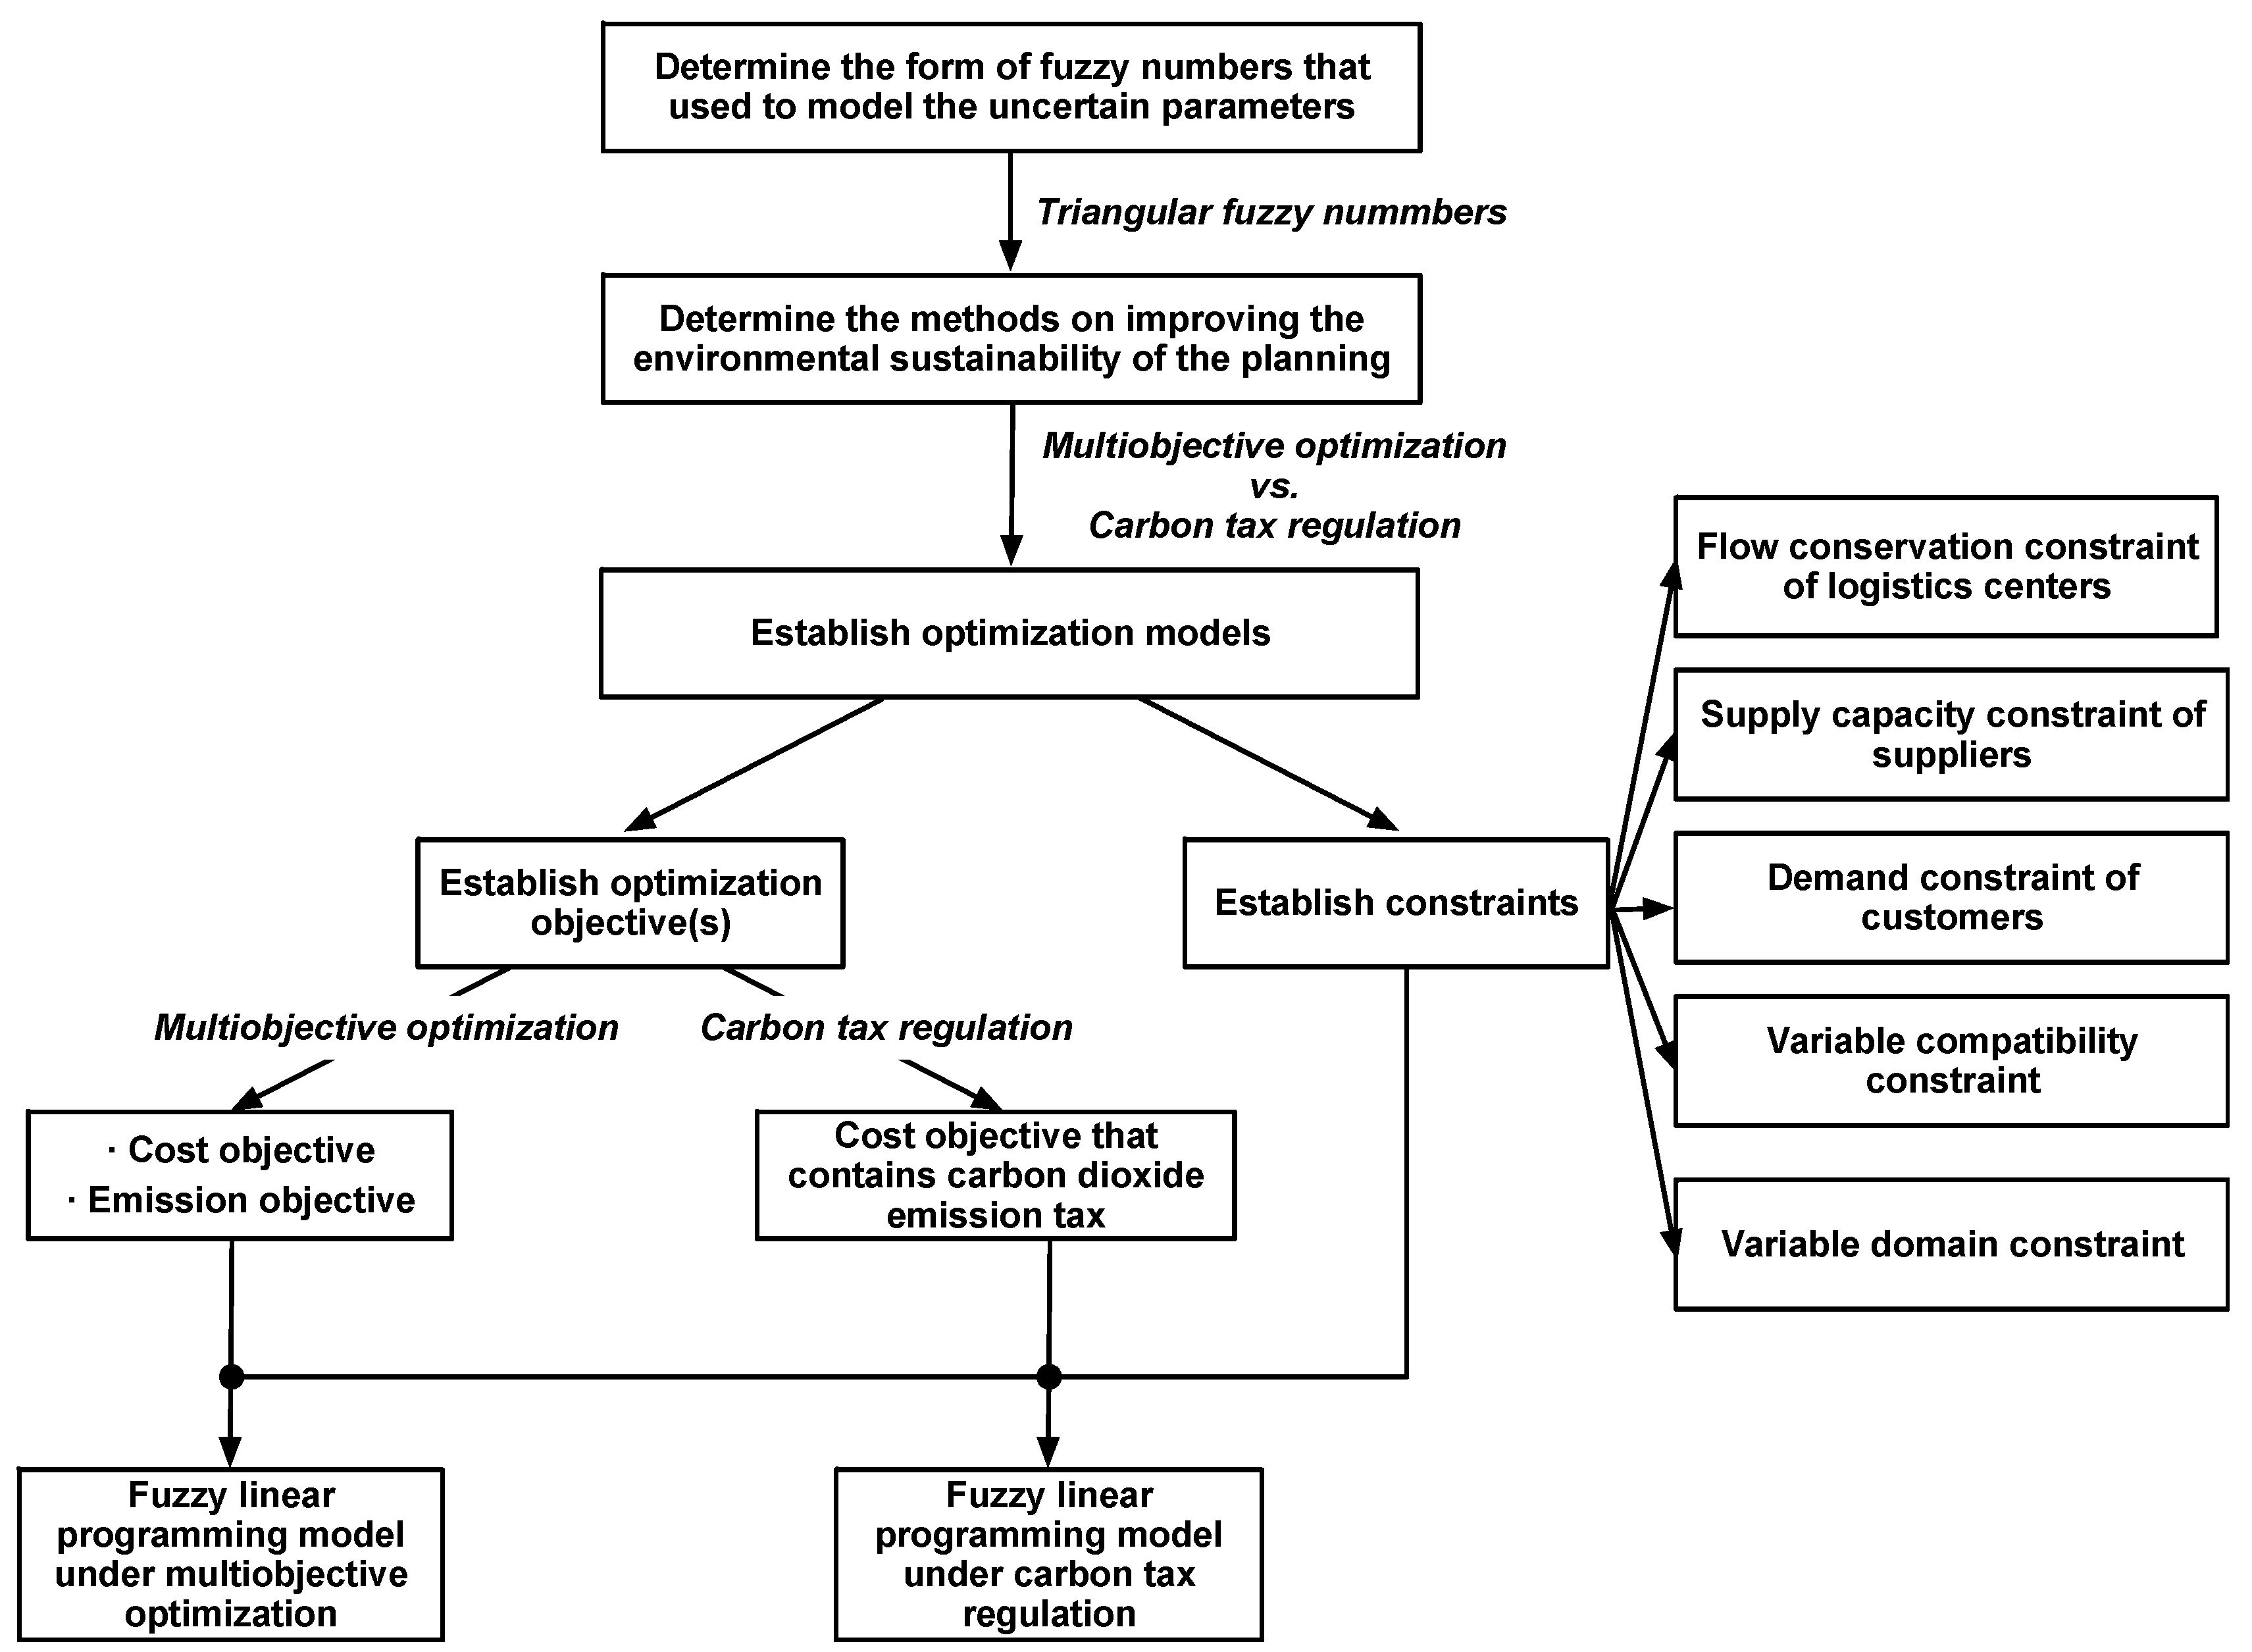
3. Fuzzy Linear Programming Models

In this section, we establish two fuzzy linear programming models for the green logistics center location and allocation problem under mixed uncertainties, according to the steps illustrated by Figure 2, which is provided to help readers better understand how this study was modelled.

3.1. Modeling Mixed Uncertianties

In this study, uncertain parameters of the logistics network are modeled by fuzzy numbers based on the fuzzy set theory. The following three kinds of fuzzy numbers are commonly used forms to model fuzziness [41].
(1) interval fuzzy numbers [32,42],
(2) triangular fuzzy numbers [13,37,43,44],
(3) trapezoidal fuzzy numbers [18,42,45].
The advantage of using triangular fuzzy numbers to describe fuzzy parameters has been indicated by Özceylan and Paksoy [43] and Sun and Li [37]. They can fully reflect the various opinions of different decision makers on estimating fuzzy parameters and keep the associated fuzzy arithmetic operations simpler and more flexible.
Triangular fuzzy numbers use pessimistic and optimistic estimations to describe fuzzy parameters [13,37,43,44]. The definitions of the estimations are given as follows.
(1) Pessimistic estimation refers to the values of fuzzy parameters in the worst case, which has a low probability of occurring in practice. In this case, suppliers and logistics centers suffer from a capacity shortage and customers having insufficient demands.
(2) Most likely, estimation is associated with the most realistic case and represents the values of fuzzy parameters in most cases.
(3) Optimistic estimation matches the best case, which is as unlikely as the worst case in the real world, in which the suppliers and logistics centers have sufficient capacities and customers show positive demands.
Consequently, this study continues to use triangular fuzzy numbers to model the fuzzy supply capacities of suppliers, the fuzzy operation capacities of logistics centers, and the fuzzy demands of customers.

3.2. Notation

  • Sets
    • N c : Set of the candidate logistics centers in the logistics network.
    • N s : Set of the suppliers in the logistics network.
    • N d : Set of the customers in the logistics network.
    • N : Set of the nodes in the logistics, where N = N c N s N d .
  • Indexes
    • i ,   j ,   h : Indexes of nodes in the logistics network, where i , j , h N .
  • Network Parameters
    • s ˜ i = ( s i 1 ,   s i 2 ,   s i 3 ) : Fuzzy supply capacity in ton per year of supplier i , where i N s .
    • e ˜ i = ( e i 1 ,   e i 2 ,   e i 3 ) : Fuzzy operation capacity in ton per year of candidate logistics center i , where i N c .
    • v ˜ i = ( v i 1 ,   v i 2 ,   v i 3 ) : Fuzzy demand in ton per year of customer i , where i N d .
    • d i j : Travel distance in kilometer from node i . to node j, where i ,   j N .
  • Cost Parameters
    • g : Travel cost in CNY per ton per kilometer of trucks, where CNY is the abbreviation of Chinese yuan, the Chinese monetary unit.
    • c i : Fixed construction cost in CNY of candidate logistics center i , where i N c .
    • f i : Operation cost in CNY per ton per year of candidate logistics center i , where i N c .
    • c t a x : Carbon tax rate in CNY per kilogram.
  • Emission Parameters
The logistics network consists of nodes (i.e., suppliers, logistics centers, and customers) and directed arcs that connect the nodes. Logistics activities that generate carbon dioxide emissions take place in both nodes (e.g., loading and unloading operations) and arcs (e.g., transportation). Therefore, nodes and arcs are the sources of carbon dioxide emissions. In this study, we define the following two parameters in order to calculate the carbon dioxide emissions of the logistics network.
e m i : Carbon dioxide emission factor in kilogram per ton of node i , i.e., the carbon dioxide emitted by node i when handling one ton of goods, where i N .
e m i j : Carbon dioxide emission factor in kilogram per ton per kilometer of the transportation line from node i to node j , i.e., the carbon dioxide in kilogram emitted by moving one ton of goods and one kilometer on the transportation line from node i to node j , where i ,   j N .
  • Auxiliary Parameter
    • M : A sufficiently large positive number.
  • Decision Variables
    • x i j : Non-negative variable that represents the freight volume in ton distributed from node i . to node j .
    • y i : 0–1 variable. If candidate logistics center i is selected, y i = 1. Otherwise, y i = 0, where i N c .

3.3. Fuzzy Mixed Integer Linear Programming Models

• Objectives under multi-objective optimization
Under the multi-objective optimization, the optimization model for the green logistics center location and allocation problem yields two independent objectives (i.e., cost objective and emission objective) but one set of constraints. There is no additional cost for carbon dioxide emissions when using multi-objective optimization to improve the environmental sustainability of the planning. In this study, the two objectives are built as follows. There exists more than one Pareto solution to the problem that can be obtained by, for example, the weighted sum method.
minimize i N j N g · x i j · d i j + i N c c i · y i + i N c j N d f i · x i j ,
Equation (1) is the cost objective. It aims to minimize the construction and operation cost for constructing and operating the logistics network.
minimize i N j N e m i j · x i j · d i j + i N s j N c ( e m i + e m j ) · x i j + i N c j N d e m j · x i j ,
Equation (2) is the emission objective meant to minimize the total carbon dioxide emissions of the logistics network.
Based on the two equations above, we can establish the objectives of the green logistics center location and allocation problem under carbon tax regulation shown as Equations (3).
• Objective under carbon tax regulation
Under carbon tax regulation, the activities in the logistics network are charged for each unit of carbon dioxide emission with a tax, which is its first difference from the multi-objective optimization. The carbon dioxide emissions can be, thereby, converted into part of the logistics network cost. Consequently, when using carbon tax regulation, there is only one objective shown as Equation (3) that aims at minimizing the total cost of the logistics network containing construction, operation, and carbon dioxide emission costs. Equation (3) can be considered as the weighted sum of Equation (1) and Equation (2), in which the weights distributed to Equation (1) and Equation (2) are 1 and c t a x , respectively. When c t a x . is set by decision makers, there is only one optimal solution to the problem, which is the second difference from the multi-objective optimization.
minimize i N j N g · x i j · d i j + i N c c i · y i + i N c j N d f i · x i j + c t a x · [ i N j N e m i j · x i j · d i j + i N s j N c ( e m i + e m j ) · x i j + i N c j N d e m j · x i j ] ,
• Constraint Sets
i N s x i j h N d x j h = 0 j N c ,
Equation (4) is the flow conservation constraint of candidate logistics centers. It ensures that there are no goods created or kept by the logistics center during the logistics process.
j N c x i j s ˜ i i N s ,
Equation (5) is the supply capacity constraint of suppliers. It ensures that the goods volume supplied by each supplier should not exceed its supply capacity.
i N c x i j v ˜ j j N d ,
Equation (6) is the demand constraint of customers. It ensures that the goods volume received by each customer should not be lower than its demand.
i N s x i j e ˜ j j N c ,
Equation (7) is the operation capacity constraint of candidate logistics centers. It ensures that the goods volume handled by each candidate logistics center should not exceed its operation capacity.
M · y i j N d x i j i N c ,
Equation (8) is the variable compatibility constraint among variables. It ensures that the candidate logistics center can be selected only when goods are assigned to it. In particular, when the candidate logistics center is not selected, then j N d x i j = 0 , which leads to y i 0 , according to the equation. Then minimization of the objective will set y i equal to 0.
x i j 0 i N j N ,
y i { 0 ,   1 } i N c ,
Equations (9) and (10) are the variable domain constraints that ensure the values of the variables should follow their respective definitions.

4. Defuzzification Based on Fuzzy Chance-Constrained Programming

The mathematical model proposed in Section 3 involves fuzzy parameters. Consequently, it cannot provide decision makers with crisp logistics network plans. In order to obtain the best plan by solving the model, defuzzification should be conducted to generate an equivalent crisp model. Fuzzy chance-constrained programming is widely acknowledged to be an effective approach to deal with the fuzzy constraint. In this section, we implement the defuzzification of the fuzzy constraints based on the steps shown in Figure 3.

4.1. Step 1: Selection of a Fuzzy Measure

Based on any one of the fuzzy possibility, necessity, and credibility measures, fuzzy chance-constrained programming can convert fuzzy constraints into fuzzy chance constraints in which the possibility/necessity/credibility that the fuzzy event associated with a certain fuzzy constraint holds should not be lower than a prescribed confidence level. The confidence level falls in the range [0,1] and is determined by decision makers based on their preference. As indicated by various studies [13,18,37], the uncertainty will influence the optimization results through the confidence level.
The selection of fuzzy measure determines the modeling of fuzzy chance constraints. As stated by Zarandi et al. [38], Zheng and Liu [39], and Cao and Lai [46], fuzzy possibility and necessity measures are not self-dual, since a fuzzy event might fail even though its possibility is 1 and hold even if its necessity is 0. On the contrary, a fuzzy credibility measure is self-dual and can ensure that a fuzzy event definitely holds when its credibility is 1 and fails when its credibility is 0 [38,39,46]. Such a characteristic makes it the most widely used measure in the fuzzy chance-constrained programming. By contrast, there is no literature that uses a fuzzy necessity measure, and a few studies, e.g., Gen et al. [47] and Mula et al. [48], adopt a fuzzy possibility measure. Utilizations of the three fuzzy measures in the literature, in turn, reflect their feasibility to a certain degree. Consequently, we can draw the conclusion that the fuzzy credibility measure is most suitable for establishing fuzzy chance constraints.

4.2. Step 2: Construction of Fuzzy Chance Constraints

In this study, we use the fuzzy credibility measure to build the fuzzy chance constraints for the supply capacity constraint, the demand constraint, and the operation capacity constraint that involves fuzzy parameters, which are shown as Equations (11) to (13).
C r { j N c x i j s ˜ i } α i N s ,
C r { i N c x i j v ˜ j } α j N d ,
C r { i N s x i j e ˜ j } α j N c ,
In the above equations, C r {   } is the credibility that the fuzzy event in {   } holds. α [ 0 ,   1 ] is the confidence level.

4.3. Step 3: Crisp and Linear Reformations of Fuzzy Chance Constraints

According to Zheng and Liu [39], Sun et al. [13], and Sun and Li [37], a triangular fuzzy number a ˜ = ( a 1 ,   a 2 ,   a 3 ) , where a 1 a 2 a 3 , and a deterministic number r . have a relationship, which shown in Equation (14).
C r { a ˜ r } = { 1 if   r a 1 2 a 2 a 1 r 2 ( a 2 a 1 ) if   a 1 r a 2 a 3 r 2 ( a 3 a 2 ) if   a 2 r a 3 0 if   r a 3 ,
According to our previous studies [13,37,49], C r { a ˜ r } α can be further modified into Equations (15) and (16), which is illustrated by Figure 4.
2 α · a 2 ( 2 α 1 ) · a 3 r if   α [ 0 ,   0.5 ] ,
2 ( 1 α ) · a 2 + ( 2 α 1 ) · a 1 r if   α ( 0.5 ,   1.0 ] ,
According to Equations (15) and (16), fuzzy chance constraint Equation (11) can be rewritten as Equations (17) and (18), which are crisp and linear functions.
2 α · s i 2 ( 2 α 1 ) · s i 3 j N c x i j i N s if   α [ 0 ,   0.5 ] ,
2 ( 1 α ) · s i 2 + ( 2 α 1 ) · s i 1 j N c x i j i N s if   α ( 0.5 ,   1.0 ] ,
Fuzzy chance constraint Equation (12) is equivalent to Equation (19).
C r { i N c x i j v ˜ j 0 } α j N d ,
According to the fuzzy arithmetic operations of triangular fuzzy numbers, the left-hand formula C r { i N c x i j v ˜ j 0 } of Equation (19) can be modified into formula C r { ( i N c x i j v j 3 ,   i N c x i j v j 2 ,   i N c x i j v j 1 ) 0 } . Therefore, Equation (12) can be converted into Equations (20) and (21).
2 α · ( i N c x i j v j 2 ) ( 2 α 1 ) · ( i N c x i j v j 1 ) 0 j N d if   α [ 0 ,   0.5 ] ,
2 ( 1 α ) · ( i N c x i j v j 2 ) + ( 2 α 1 ) · ( i N c x i j v j 3 ) 0 j N d if   α ( 0.5 ,   1.0 ] ,
Similar to the modification of Equation (11) into Equations (17) and (18), fuzzy chance constraint Equation (13) can be reformulated as Equations (22) and (23), which are also crisp and linear.
2 α · e j 2 ( 2 α 1 ) · e j 3 i N s x i j j N c if   α [ 0 ,   0.5 ] ,
2 ( 1 α ) · e j 2 + ( 2 α 1 ) · e j 1 i N s x i j j N c if   α ( 0.5 ,   1.0 ] ,
After the defuzzification, we can obtain two crisp linear models. The first model yields two objectives including Equations (1) and (2). The second model is for the green logistics center location and allocation problem under carbon tax regulation, and its objective is shown in Equation (3). The two models share the same constraints that include Equations (4), (8)–(10), (17), (18), and (20)–(23). Since these models are linear, they can be effectively solved by an exact solution algorithm (e.g., branch-and-bound algorithm) run by mathematical programming software (e.g., LINGO).

5. Computational Experiments

5.1. Numerical Case Description

In this section, we design a numerical case that includes three suppliers, three candidate logistics centers, and two customers to discuss the feasibility of the proposed fuzzy programming methods in dealing with the problem. The numerical case is indicated by Figure 5. Although the structure of the logistics is designed manually, the values of the parameters in the numerical case presented in Table 1 and Table 2 are set by referring to the real-world data of China.
In the numerical case, the travel distances and carbon dioxide emission factors of all the transportation lines are given in Table 1. Moreover, as reported by the National Development and Reform Commission of China, the road full-truck-load freight cost in January and February 2019 is 0.46 CNY per ton per kilometer [50]. However, this administration also points out that the cost trend is decreasing due to the national policy of transferring road freight to railways and waterways. Consequently, in this study, considering the logistics center location and allocation optimization as a long-term planning, we set the travel cost, i.e., g defined in Section 3.2, as 0.4 CNY per ton per kilometer.
The fuzzy supply capacities of suppliers, fuzzy operation capacities of candidate logistics centers, and fuzzy demands of customers as well as their carbon dioxide emission factors are given in Table 2. The construction cost and operation cost of the logistics centers are also presented in Table 2.
In this study, we use mathematical programming software LINGO version 18.0 (LINDO Systems Inc., Chicago, IL, USA [51]) to run the standard branch-and-bound algorithm to solve the green logistics center location and allocation problem under mixed uncertainty on a MacBook Pro Laptop with Intel Core i5, 2.3 GHz CPU, and 8GB RAM (Apple Inc., Cupertino, CA, USA), and obtain the global optimum solutions to the problem.

5.2. Multi-Objective Optimization Analysis

We set the confidence level α to 0.9, and undertake a multi-objective optimization for the green logistics center location and allocation problem. In order to generate the Pareto solutions to the problem, we employ the weighed sum method [52] to combine the cost objective and emission objective together into one objective indicated by Equation (24), where w 1 and w 2 are the non-negative weights distributed to the two objectives.
minimize   w 1 · ( i N j N g · x i j · d i j + i N c c i · y i + i N c j N d f i · x i j ) + w 2 · [ i N j N e m i j · x i j · d i j + i N s j N c ( e m i + e m j ) · x i j + i N c j N d e m j · x i j ] ,
Consequently, we can obtain a single-objective mixed integer linear programming model whose objective is Equation (24) and constraints contain Equations (4), (8)–(10), (17), (18), and (20)–(23). We can then vary the values of the two weights, solve the model under each combination of weight values, and obtain the Pareto solutions to the problem shown in Figure 6.
It can be observed from Figure 6 that the cost objective and emission objective cannot reach their respective optima simultaneously. If the decision makers improve one objective, the other will be worsened. The Pareto solutions presented in Figure 6 can effectively help decision makers select the most suitable candidate based on their preference in a certain case. In particular, compared with the first solution on the left, the second one can help reduce the carbon dioxide emissions by approximately 5.8% with a slight increase of the cost objective by approximately 0.017%.

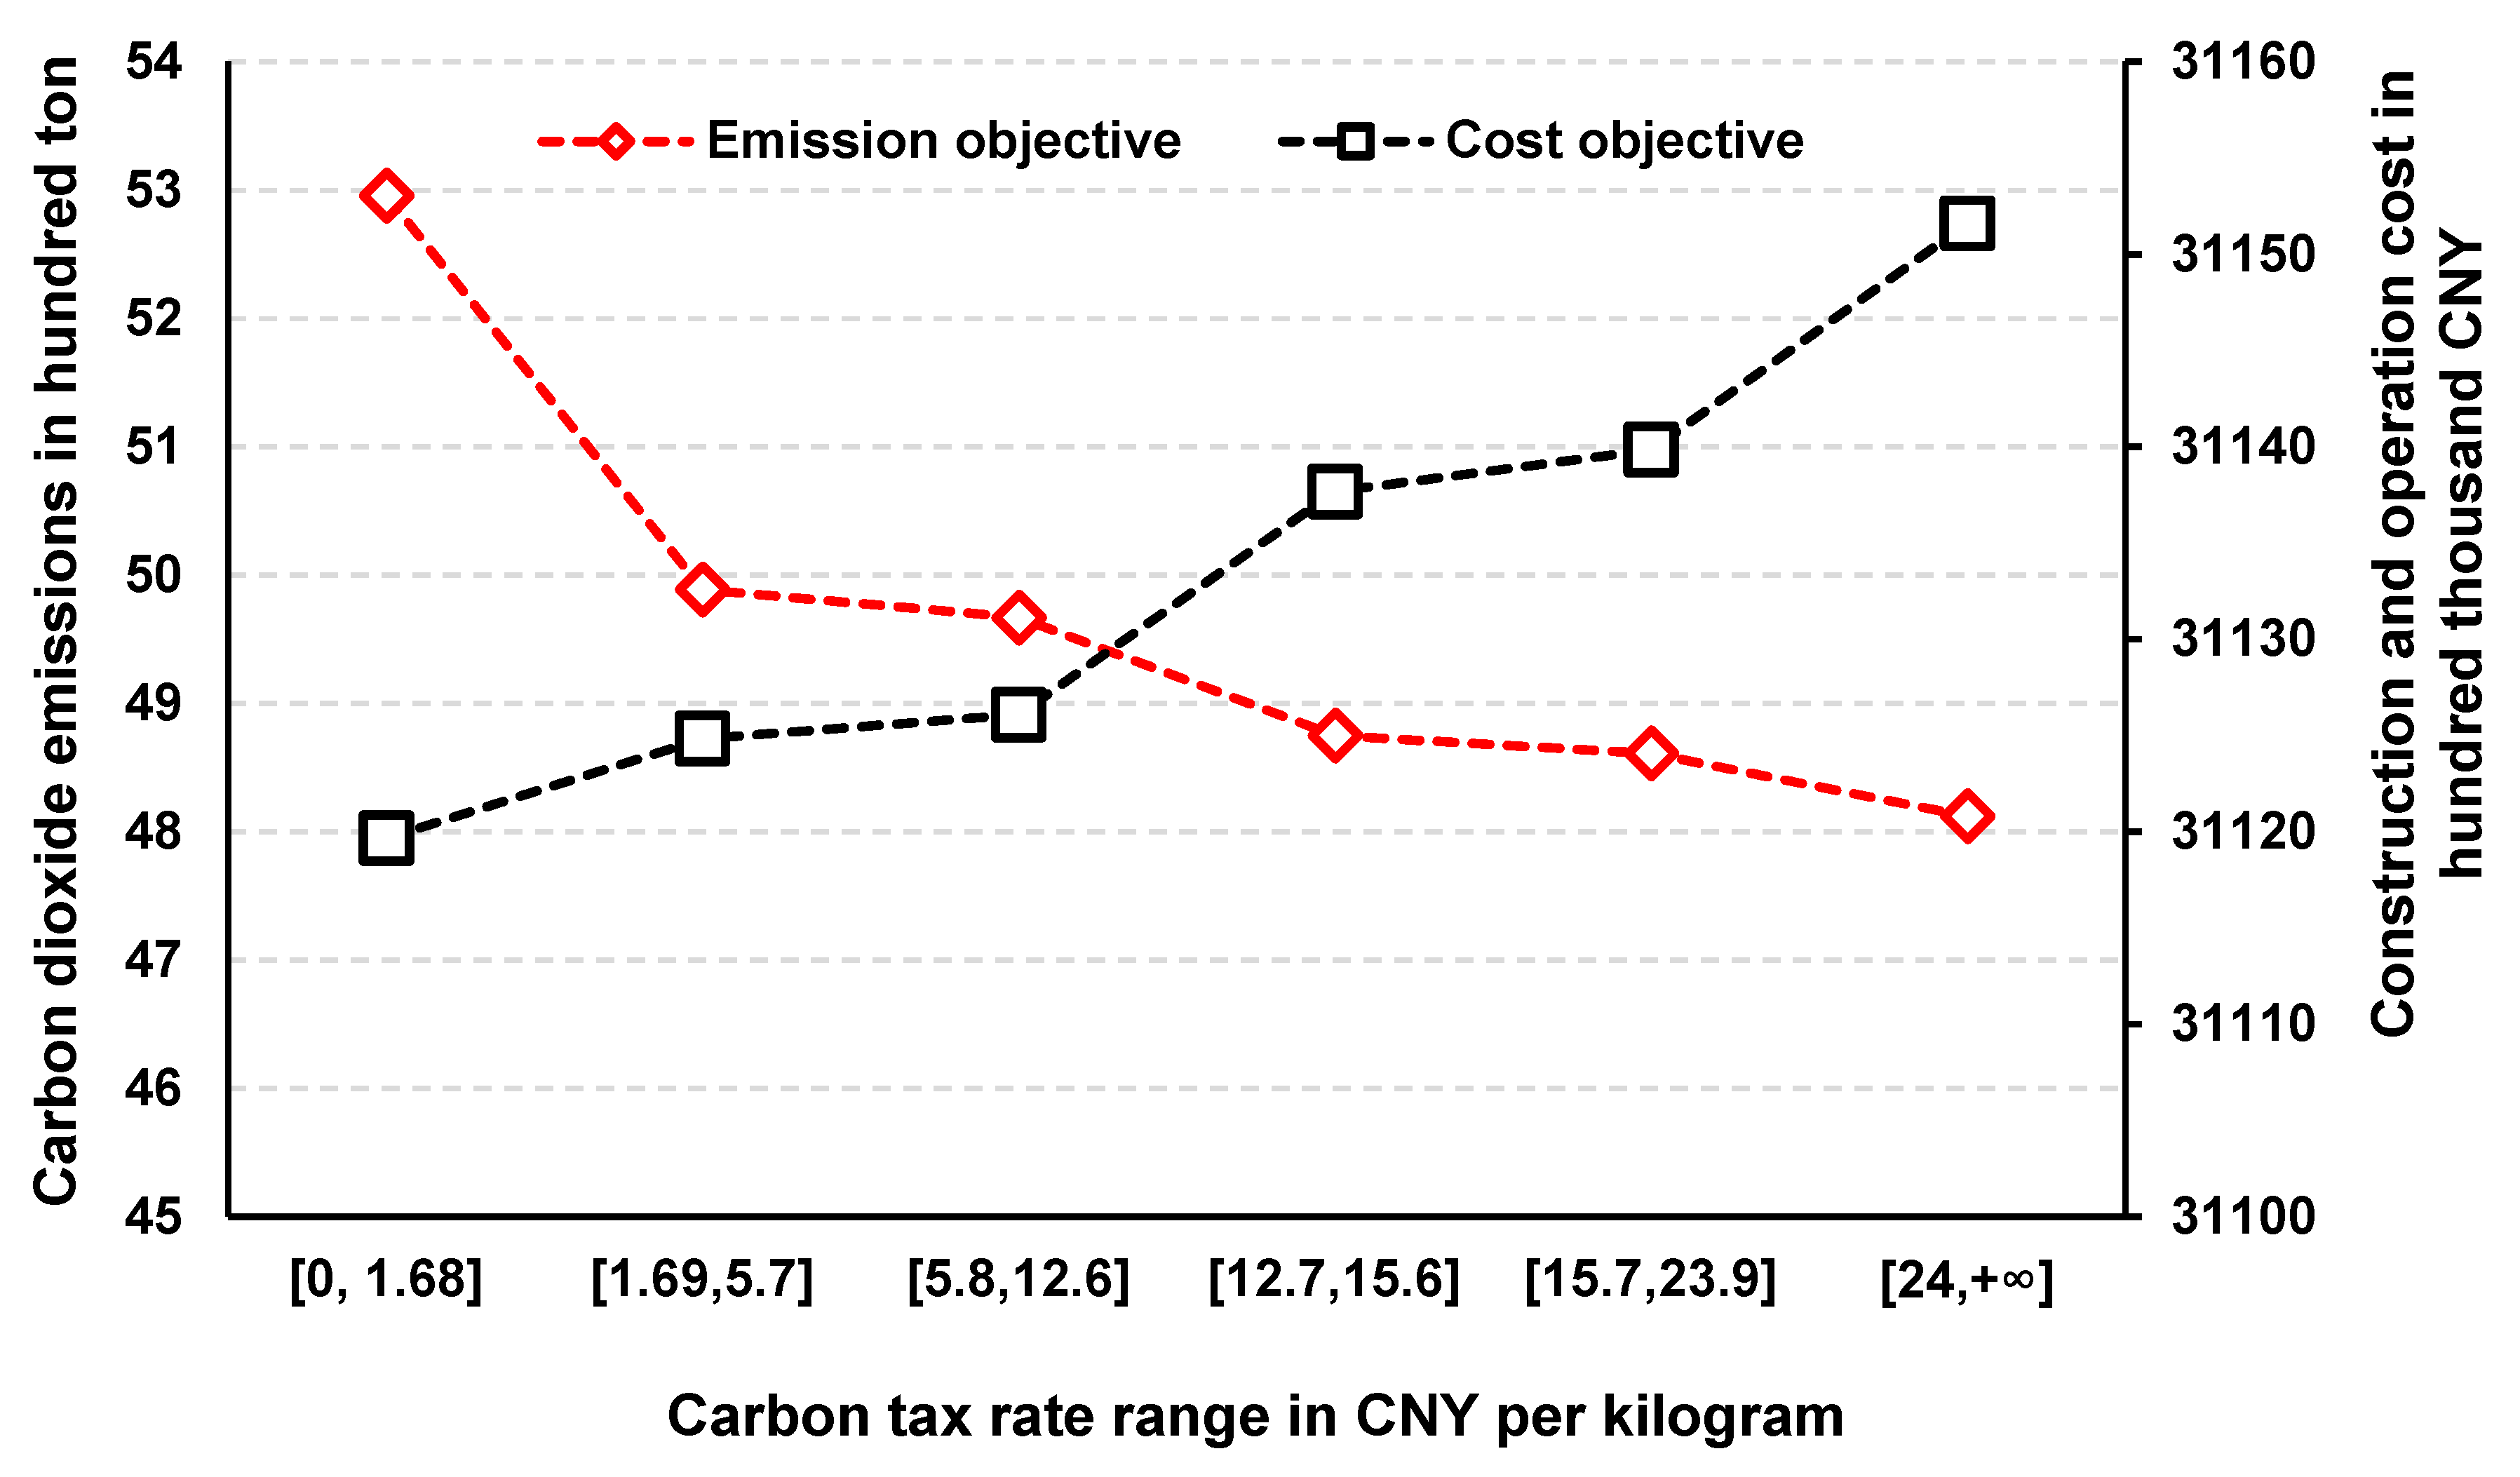
5.3. Sensitivity of the Optimization Results with Respect to the Carbon Tax Regulation

When the confidence level α is set to 0.9, we analyze the sensitivity of the optimization results with respect to the carbon tax emission regulation. We increase the carbon tax rate in CNY per kilogram from 0.1 to 24 with a step of 0.01. Then, we optimize the problem under each carbon tax rate, and obtain the construction and operation cost of the logistics network based on Equation (1), and carbon dioxide emissions based on Equation (2), under different carbon tax rates. Carbon tax rates, whose corresponding construction and operation cost as well as carbon dioxide emissions have the same values, form a range. For example, when the carbon tax rate in CNY per kilogram increases from 0 to 1.68, both values of construction and operation cost and carbon dioxide emissions remain the same. Moreover, 1.68 CNY per kilogram is the upper bound, since the above-mentioned values change when the carbon tax rate in CNY per kilogram increase from 1.68 to 1.69 by the given step. Consequently, [0, 1.68] is a carbon tax rate range, and 1.69 CNY per kilogram is the lower bound of the successive range. Lastly, we can find all the carbon tax rate ranges that correspond to the six Pareto solutions shown in Figure 6. The sensitivity is shown in Figure 7.
As we can see from Figure 7, the carbon emissions are sensitive to the carbon tax regulation when the carbon tax rate increases from the range [0.1, 1.68] to the range [1.69, 5.7]. For example, if the carbon tax rate increases from 1.68 CNY per kilogram to 1.69 CNY per kilogram by approximately 0.6%, the carbon dioxide emissions will decrease by approximately 5.8%. However, when the carbon tax rate exceeds the range [1.69, 5.7], a significant increase of the carbon tax rate only slightly decreases the carbon dioxide emissions, while leading to a heavy economic burden. For example, increasing the carbon tax rate from 1.69 CNY per kilogram to 24 CNY per kilogram results in reducing carbon dioxide emissions by only approximately 3.5%. In these cases, the performance of carbon tax regulation in reducing carbon dioxide emissions is restricted.
Furthermore, when the carbon tax rate varies within a certain range, as shown in Figure 7, the carbon emissions of the logistics network remain unchanged, as do the construction and operation cost of the logistics network. As a result, increasing the carbon tax rate within a certain range does not help reduce carbon dioxide emissions, but only worsens the economy of the logistics network. For each range, its lower bound is the best. Therefore, for the case presented in Section 5.1, the best carbon tax rate should be 1.69 CNY per kilogram.

5.4. Sensitivity of the Carbon Tax Regulation with Respect to the Confidence Level

We can calculate the performance of the best carbon tax rates under different confidence levels in reducing the carbon dioxide emissions, as shown in Equation (25).
p e r f o r m α = e m max α e m α e m max α e m min α · 100 % ,
where p e r f o r m α is the performance of the best carbon tax rate under confidence level α , and e m min α and e m max α are the minimum emission value and maximum emission value in kilograms of the Pareto solutions under confidence level α , respectively. e m α is the emissions in kilograms under the best carbon tax rate under confidence level α . We also obtain the best carbon tax rates under different confidence levels based on the analysis that generates Figure 7. The results are indicated in Figure 8.
As shown in Figure 8, the carbon dioxide emissions of the logistics network decrease considerably when using carbon tax regulation under the best tax rates. Confidence levels have great influences on the carbon tax regulation. It can be observed that the performance of the best carbon tax rate is best when the confidence level is set to 0.9, which also corresponds to the minimum carbon tax rate of 1.69 CNY per kilogram. The worst performance is under a confidence level of 0.8, and can be only achieved by using a relatively high tax rate of 11.82 CNY per kilogram.

5.5. Comparison between Multi-Objective Optimization and Carbon Tax Regulation

After obtaining the best carbon tax rate, decision makers would also like to know whether the rate can be used in practice or not, which determines whether the carbon tax regulation can be adopted. As claimed by Sun et al. [13], a small rate might be infeasible in reducing carbon dioxide emissions, since the carbon emission tax does not dominate the cost of the system. Moreover, a large rate might be helpful to lower the emissions to a certain degree, but might not be applicable in practice considering the practical market situation. If the carbon tax regulation is not applicable, decision makers can use multi-objective optimization as an alternative. Since the values of parameters in the numerical case are set by referring to the real-world data of China, we will discuss the effectiveness of the carbon tax regulation under the Chinese scenario.
As stressed by the Chinese Academy of Environmental Planning, the carbon tax rate for China by year 2030 is suggested to be 0.04 (lower level), 0.1 (medium level), or 0.2 (upper level) CNY per kilogram [53]. All these rates fall into ranges that are not large enough to cut carbon dioxide emissions. Moreover, compared with the recommended rates, the best carbon tax rates under different confidence levels are considerably large, which might not be feasible in the practical carbon tax regulation.
As a result, when the presented case relates to the Chinese scenario, we can draw the conclusion that using a multi-objective objective is more effective than the carbon tax regulation, especially considering the carbon tax regulation is currently in a pilot stage in China and it is difficult to determine a practical carbon tax rate. By using multi-objective optimization, we can obtain emission optimized solutions without adding any additional cost for the logistics network.

5.6. Sensitivity of the Pareto Solutions with Respect to the Confidence Level

In this section, we vary the confidence level of the fuzzy chance constraints from 0.5 to 1.0 with a step of 0.1, which generates Pareto solutions to the logistics center location and allocation problem under each confidence level. The computational results are listed in Table 3. In this table, the numbers are presented as a cost objective in hundred thousand CNY and an emission objective in 100 ton.
Table 3 illustrates that the Pareto solutions are sensitive to the confidence level. With an increase of the confidence level, the values of both the cost objective and the emission objective of the Pareto solutions increase. We also mark the minimal values of cost objective and emission objective under different confidence levels by underlining and double underlining, respectively, so that readers can easily capture the variations of these values when the confidence level changes. As we can see from Table 3, when the confidence level improves from 0.5 to 1.0, the minimum value of the emission objective in 100 ton of the Pareto solutions increases from 36.42 to 51.13, which is an increase of approximately 40.39%, and the minimum value of the cost objective in 100,000 CNY increases from 19,108.0 to 31,127.4, or approximately 62.9%.
Since the sensitivity shown in Table 3 is significant, it is necessary to help decision makers determine the best confidence level, so that a crisp logistics center location and allocation plan could be provided to them. However, it is difficult to clearly identify the best confidence level only based on the sensitivity analysis shown in Table 3.

5.7. Fuzzy Simulation to Determine the Best Confidence Level for the Uncertain Problem

In practical decision making on the green logistics center location and allocation problem under mixed uncertainties, decision makers should determine the weights of the two objectives. The sensitivity analysis given in Table 3 helps decision makers find the most suitable weights that match a certain decision-making scenario. In this study, we assume that w 1 = 1 and w 2 = 10 , which indicates that decision makers pay nearly the same attention to the cost objective and emission objective. In practical decision making, according to the preference of decision makers, they can use multicriteria decision-making methods to determine the values of weights distributed to the two objectives [37,49,54]. Although different values of weights might lead to different computational results for the best confidence level, the following logic that helps decision makers identify the best confidence level remains the same.
To evaluate the logistics center location and allocation plans under different confidence levels when the weights of the objectives are set, decision makers should test their reliability on satisfying the supply constraint of suppliers, the operation capacity constraint of selected logistics centers, and the demand constraint of customers in the practical operation stage of the logistics network before its planning stage.
Then, the decision makers can identify all the logistics center location and allocation plans whose reliability is acceptable. Among these plans, the one with the minimum value of the objective that combines the cost objective and the emission objective by the weighted sum method corresponds to the best confidence level, and can be undertaken in practice.
However, challenge related to the above decision making exists. The practical operation situation that includes the practical supply capacities of suppliers, the practical operation capacities of selected logistics centers, and the practical demands of customers is only determined and known in the operation stage of the logistics network. It cannot be known in the long-term planning stage. Consequently, it is impossible to test the reliability of the plans in the future operation stage during the planning stage.
Sun et al. [13,18,37,42] proposes a fuzzy simulation approach to simulate the practical transportation situation by randomly generating the deterministic values of fuzzy parameters based on the fuzzy membership function of fuzzy numbers. We can use these simulated deterministic values as the practical values of fuzzy parameters in the operation stage of the logistics network. As a result, the practical situations of the logistics network in the operation stage are known in a simulation way, and can be further used to test the reliability of the logistics center location and allocation plans under different confidence levels quantitively. Fuzzy simulation is shown in Figure 9, in which the fuzzy membership of a deterministic number r with respect to a triangular fuzzy number a ˜ = ( a 1 ,   a 2 ,   a 3 ) is described in Equation (26).
μ a ˜ ( r ) = { r a 1 a 2 a 1 a 1 r < a 2 1 a 2 r a 3 a 4 r a 4 a 3 a 3 < r a 4 0 otherwise ,
We can run the fuzzy simulation shown in Figure 9 several times to generate several simulated deterministic operation situations of the logistics network, which can be seen in Appendix A: Table A1. Then we test whether the logistics center location and allocation plan under a certain confidence level satisfies the three deterministic constraints of Equations (27) to (29) in each operation situation. If these constraints are all satisfied, we consider that the plan is feasible in the corresponding operation situation. Otherwise, the plan is not feasible. Lastly, we can obtain the ratio that a plan is feasible in all the simulated operation situations of the logistics network. Such a ratio can be used to quantify the reliability of the plan.
j N c x i j s i t i N s ,
i N c x i j v j t j N d ,
i N s x i j e j t j N c
where s i t , v i t , and e j t are the simulated deterministic supply capacity, demand, and capacity of associated nodes in the t th simulated deterministic operation situation of the logistics network. t = 1, 2, 3, …, T, where T is the times of running the fuzzy simulation. In this study, we set T as 20. The calculation results of the above defined ratios are presented in Figure 10.
As shown in Figure 10, when w 1 = 1 and w 2 = 10 , the reliability of the logistics center location and allocation plan improves with the increase of the confidence level. The improvement is significant, with reliability increasing 19 times from 5% to 100%, when the confidence level is set as 1.0 instead of 0.9. Simultaneously, the value of the cost (emission) objective slightly increases from 3,112,608 thousand CNY (4967 ton) to 3,112,990 thousand CNY (5270 ton), or approximately 0.01% (6.1%). Therefore, we can considerably enhance the reliability of the logistics center location and allocation plan with a slight sacrifice of the cost objective and emission objective. As for the case presented in Section 5.1 under w 1 = 1 and w 2 = 10 , the best confidence level for the plan is 1.0, due to its advantage of high reliability. The corresponding logistics center location and allocation plan is illustrated in Figure 11.
It should be noted that when the confidence level is set as 0.5, the three fuzzy chance constraints are modified into Equations (30)–(32), which are the deterministic constraints formulated by the logistics center location and allocation problem under certainty. As indicated by Figure 10, the logistics center location and allocation plan under certainty yields an extremely low reliability, such that it cannot be ensured that the supply capacity constraint of suppliers, the operation capacity constraint of logistics centers, and the demand constraint of customers are all satisfied. Consequently, we can draw the conclusion that considering mixed uncertainties in the logistics center location and allocation problem helps greatly improve the reliability of the plan.
j N c x i j s i 2 i N s ,
i N c x i j v j 2 j N d ,
i N s x i j e j 2 j N c

6. Conclusions

In this study, we discuss the modelling and optimization for a green logistics center location and allocation problem under mixed uncertainties. The main contributions made by this study are fourfold, as follows.
(1) Environmental sustainability of the logistics network is improved by using two methods, i.e., multi-objective optimization and carbon dioxide emissions. The performance of the carbon tax regulation in reducing carbon dioxide emissions can be tested based on the benchmark provided by the Pareto solutions generated by multi-objective optimization.
(2) Mixed uncertainties, including the supply capacities of suppliers, the operation capacities of logistics centers, and the demands of customers, are comprehensively modelled using triangular fuzzy numbers based on fuzzy set theory in order to improve the reliability of the logistics center location and allocation planning.
(3) Two fuzzy linear programming models are proposed to formulate the green logistics center location and allocation problem under mixed uncertainties based on the two carbon dioxide emission reduction methods. The fuzzy models are easily defuzzied by using fuzzy chance-constrained programming. The crisp models can be solved by an exact solution algorithm run by mathematical programming software.
(4) A method based on sensitivity analysis and fuzzy simulation is developed to quantify the effects of the mixed uncertainties on the logistics center location and allocation plan and help decision makers to effectively make tradeoff between improving the economy and enhancing the reliability of planning.
Based on the numerical case discussion, we can also draw the following conclusions that can help decision makers better construct, manage, and operate logistics networks. The second conclusion reveals an important managerial implication that carbon tax regulation does not always work in planning a green logistics network and its effectiveness should be tested before being implemented. The remaining conclusions provide techniques for improving environmental sustainability and reliability of the logistics network planning.
(1) Multi-objective optimization shows that the cost objective and emission objective are in conflict with each other. Improving any one of the objectives will worsen the other. Using the weighted sum method, Pareto solutions to the problem can be generated, which can help decision makers make effective tradeoffs between the two objectives and select the most suitable plan that matches a certain decision-making situation.
(2) Based on the benchmark provided by multi-objective optimization, we report a numerical case in which carbon tax regulation needs a high carbon tax rate to enhance its performance. Such a high rate might be infeasible in the practical market. Zhang et al. [22] find that the effectiveness of carbon tax regulation in reducing carbon dioxide emissions is very sensitive to the specific case. As a result, carbon tax regulation should be tested quantitively by decision makers to check its effectiveness before being implemented in either planning or practice.
(3) Compared with deterministic logistics center location and allocation planning, formulating mixed uncertainties in the planning greatly improves its reliability. The mixed uncertainties can be effectively modelled by using triangular fuzzy numbers based on the fuzzy set theory. Fuzzy linear programming models and their crisp reformulations based on fuzzy chance-constrained programming can be established to solve the problem by providing the global optimum solutions.
(4) Sensitivity analysis reveals that the mixed uncertainties have significant effects on the planning through the confidence level in the fuzzy chance constraints. Decision makers can use fuzzy simulation designed in Section 5.7 to quantify such effects and determine the best confidence level in order to gain a crisp logistics center location and allocation plan.
Currently, this study only considers a three-stage logistics network with forward flows. In our future work, we will improve the logistics network by considering reverse flows, which are very important elements of the logistics system to improve the complexity of the problem for better practical decision making. Furthermore, we will try to develop a heuristic algorithm for the green logistics center location and allocation problem under mixed uncertainties, which is acknowledged to be an NP-hard problem. The numerical case and proposed exact solution method can provide benchmarks to test the accuracy of the heuristic algorithm. We will also design a large-scale real-world case in our future work to test the efficiency of the exact solution method and the heuristic algorithm, and then to discuss the effectiveness of the carbon tax regulation using the analysis demonstrated in Section 5.2, Section 5.3, Section 5.4 and Section 5.5.

Author Contributions

Y.S. and Y.L. proposed the problem discussed in this paper. Y.S. and Y.L. developed the mathematical models and developed the defuzzification method for the fuzzy models. Y.S. and C.Z. designed the numerical case. Y.S., Y.L., and C.Z. conducted the computation, sensitivity analysis, and fuzzy simulation in the case study. Y.S. and YL. wrote the paper. C.Z. thoroughly reviewed and improved the paper. All authors have discussed and contributed to the manuscript. Both authors have read and approved the final manuscript.

Funding

The Project for Humanities and Social Sciences Research of Ministry of Education of China, grant number 19YJC630149, the Shandong Provincial Natural Science Foundation of China, grant number ZR2019BG006, and the Shandong Provincial Higher Educational Social Science Program of China, grant number J18RA053 funded this research.

Conflicts of Interest

The authors declare no conflict of interest.

Appendix A

Table A1. Fuzzy simulation results in 100 ton.
No.Supply Capacity of Supplier 1Supply Capacity of Supplier 2Supply Capacity of Supplier 3Operation Capacity of Logistics Center 4Operation Capacity of Logistics Center 5Operation Capacity of Logistics Center 6Demand of Customer 7Demand of Customer 8
119692004127617062325133616041627
218571780121116032154130915431796
318681912123017392134167413301795
416991648134619402184147213022255
517341638128217112361131213501670
616512043121718422034137113321796
716151616121019252213135213391712
816171803120419322113137813921668
917061709152518152231150513251775
1016191695124019012074139513101722
1116111619134119092084155414452328
1216131665123519902208130413961939
1318321749124118502028132215681689
1419161737120618282017146413501748
1516371826121917622287158014861715
1616091689142619862057134313901761
1720051741159917082093134514132002
1816111787154816242231132513932008
1919051737122417052188130213001776
2017271604123616822156138713211809

References

  1. Żak, J.; Węgliński, S. The selection of the logistics center location based on MCDM/A methodology. Transp. Res. Procedia 2014, 3, 555–564. [Google Scholar] [CrossRef]
  2. Wang, B.; He, S. Robust optimization model and algorithm for logistics center location and allocation under uncertain environment. J. Transp. Syst. Eng. Inf. Technol. 2009, 9, 69–74. [Google Scholar] [CrossRef]
  3. Pishvaee, M.S.; Farahani, R.Z.; Dullaert, W. A memetic algorithm for bi-objective integrated forward/reverse logistics network design. Comput. Oper. Res. 2010, 37, 1100–1112. [Google Scholar] [CrossRef]
  4. Cordeau, J.F.; Pasin, F.; Solomon, M.M. An integrated model for logistics network design. Ann. Oper. Res. 2006, 144, 59–82. [Google Scholar] [CrossRef]
  5. Lee, J.E.; Gen, M.; Rhee, K.G. Network model and optimization of reverse logistics by hybrid genetic algorithm. Comput. Ind. Eng. 2009, 56, 951–964. [Google Scholar] [CrossRef]
  6. Zhang, J.; Liu, H.; Yu, G.; Ruan, J.; Chan, F.T. A three-stage and multi-objective stochastic programming model to improve the sustainable rescue ability by considering secondary disasters in emergency logistics. Comput. Ind. Eng. 2019, 135, 1145–1154. [Google Scholar] [CrossRef]
  7. Roscoe, S.; Cousins, P.D.; Lamming, R.C. Developing eco-innovations: A three-stage typology of supply networks. J. Clean. Prod. 2016, 112, 1948–1959. [Google Scholar] [CrossRef]
  8. Tavana, M.; Santos-Arteaga, F.J.; Mahmoodirad, A.; Niroomand, S.; Sanei, M. Multi-stage supply chain network solution methods: Hybrid metaheuristics and performance measurement. Int. J. Syst. Sci. Oper. Logist. 2018, 5, 356–373. [Google Scholar] [CrossRef]
  9. Sadic, S.; de Sousa, J.P.; Crispim, J.A. A two-phase MILP approach to integrate order, customer and manufacturer characteristics into Dynamic Manufacturing Network formation and operational planning. Expert Syst. Appl. 2018, 96, 462–478. [Google Scholar] [CrossRef]
  10. J.-Sharahi, S.; Khalili-Damghani, K.; Abtahi, A.R.; Rashidi-Komijan, A. Type-II Fuzzy Multi-Product, Multi-Level, Multi-Period Location–Allocation, Production–Distribution Problem in Supply Chains: Modelling and Optimisation Approach. Fuzzy Inf. Eng. 2018, 10, 260–283. [Google Scholar] [CrossRef]
  11. Carter, C.R.; Ellram, L.M. Reverse logistics: A review of the literature and framework for future investigation. J. Bus. Logist. 1998, 19, 85. [Google Scholar]
  12. Dowlatshahi, S. Developing a theory of reverse logistics. Interfaces 2000, 30, 143–155. [Google Scholar] [CrossRef]
  13. Sun, Y.; Hrušovský, M.; Zhang, C.; Lang, M. A time-dependent fuzzy programming approach for the green multimodal routing problem with rail service capacity uncertainty and road traffic congestion. Complexity 2018, 2018. [Google Scholar] [CrossRef]
  14. Liao, C.H.; Tseng, P.H.; Lu, C.S. Comparing carbon dioxide emissions of trucking and intermodal container transport in Taiwan. Transp. Res. Part D Transp. Environ. 2009, 14, 493–496. [Google Scholar] [CrossRef]
  15. IEA. CO2 Emissions from Fuel Combustion 2019; International Energy Agency: Paris, France, 2019; Available online: https://webstore.iea.org/co2-emissions-from-fuel-combustion-2019-overview (accessed on 15 November 2019).
  16. Rodrigue, J.P.; Slack, B.; Comtois, C. Green logistics. In Handbook of Logistics and Supply-Chain Management; Emerald Group Publishing Limited: Bingley, UK, 2008; pp. 339–350. [Google Scholar]
  17. Crainic, T.G. Service network design in freight transportation. Eur. J. Oper. Res. 2000, 122, 272–288. [Google Scholar] [CrossRef]
  18. Sun, Y.; Zhang, G.; Hong, Z.; Dong, K. How uncertain information on service capacity influences the intermodal routing decision: A fuzzy programming perspective. Information 2018, 9, 24. [Google Scholar] [CrossRef]
  19. Xu, Z.; Elomri, A.; Pokharel, S.; Mutlu, F. The Design of Green Supply Chains under Carbon Policies: A Literature Review of Quantitative Models. Sustainability 2019, 11, 3094. [Google Scholar] [CrossRef]
  20. Wang, F.; Lai, X.; Shi, N. A multi-objective optimization for green supply chain network design. Decis. Support Syst. 2011, 51, 262–269. [Google Scholar] [CrossRef]
  21. Pishvaee, M.S.; Torabi, S.A.; Razmi, J. Credibility-based fuzzy mathematical programming model for green logistics design under uncertainty. Comput. Ind. Eng. 2012, 62, 624–632. [Google Scholar] [CrossRef]
  22. Govindan, K.; Paam, P.; Abtahi, A.R. A fuzzy multi-objective optimization model for sustainable reverse logistics network design. Ecol. Indic. 2016, 67, 753–768. [Google Scholar] [CrossRef]
  23. Hang, Y.; Xie, L.; Hang, W.; Cui, X. A robust model for 3PLS to design a remanufacturing logistics network under the uncertain environment. In Proceedings of the 2007 IEEE International Conference on Automation and Logistics, Jinan, China, 18–21 August 2007; IEEE: Piscataway, NJ, USA, 2007; pp. 367–372. [Google Scholar]
  24. Zhang, W.; Xu, D. Integrating the logistics network design with order quantity determination under uncertain customer demands. Expert Syst. Appl. 2014, 41, 168–175. [Google Scholar] [CrossRef]
  25. Pishvaee, M.S.; Jolai, F.; Razmi, J. A stochastic optimization model for integrated forward/reverse logistics network design. J. Manuf. Syst. 2009, 28, 107–114. [Google Scholar] [CrossRef]
  26. Amin, S.H.; Zhang, G. A multi-objective facility location model for closed-loop supply chain network under uncertain demand and return. Appl. Math. Model. 2013, 37, 4165–4176. [Google Scholar] [CrossRef]
  27. Hatefi, S.M.; Jolai, F. Robust and reliable forward–reverse logistics network design under demand uncertainty and facility disruptions. Appl. Math. Model. 2014, 38, 2630–2647. [Google Scholar] [CrossRef]
  28. Shimizu, Y.; Matsuda, S.; Wada, T. A flexible design of logistic network against uncertain demands through hybrid meta-heuristic method. In Computer Aided Chemical Engineering; Elsevier: Amsterdam, The Netherlands, 2006; Volume 21, pp. 2051–2056. [Google Scholar]
  29. Lieckens, K.; Vandaele, N. Multi-level reverse logistics network design under uncertainty. Int. J. Prod. Res. 2012, 50, 23–40. [Google Scholar] [CrossRef]
  30. Lee, D.H.; Dong, M. Dynamic network design for reverse logistics operations under uncertainty. Transp. Res. Part E Logist. Transp. Rev. 2009, 45, 61–71. [Google Scholar] [CrossRef]
  31. Zeballos, L.J.; Méndez, C.A.; Barbosa-Povoa, A.P.; Novais, A.Q. Multi-period design and planning of closed-loop supply chains with uncertain supply and demand. Comput. Chem. Eng. 2014, 66, 151–164. [Google Scholar] [CrossRef]
  32. Chen, G.; Zhang, J.; Fu, J. Multi-objective fuzzy location-allocation-routing problem in urgent relief distribution system. J. Transp. Syst. Eng. Inf. Technol. 2014, 14, 160–167. [Google Scholar]
  33. Bai, Q.; Chen, M. The distributionally robust newsvendor problem with dual sourcing under carbon tax and cap-and-trade regulations. Comput. Ind. Eng. 2016, 98, 260–274. [Google Scholar] [CrossRef]
  34. Duan, X.; Heragu, S. Carbon Emission Tax Policy in an Intermodal Transportation Network. In Proceedings of the IIE Annual Conference, Nashville, TN, USA, 30 May–2 June 2015; Volume 30. [Google Scholar]
  35. Zhang, D.; He, R.; Li, S.; Wang, Z. A multimodal logistics service network design with time windows and environmental concerns. PLoS ONE 2017, 12, e0185001. [Google Scholar] [CrossRef]
  36. Törnquist, J. Computer-Based Decision Support for Handling Uncertainty in Railway Traffic and Transportation. Ph.D. Thesis, Blekinge Institute of Technology, Karlskrona, Sweden, 2004. [Google Scholar]
  37. Sun, Y.; Li, X. Fuzzy Programming Approaches for Modeling a Customer-Centred Freight Routing Problem in the Road-Rail Intermodal Hub-and-Spoke Network with Fuzzy Soft Time Windows and Multiple Sources of Time Uncertainty. Mathematics 2019, 7, 739. [Google Scholar] [CrossRef]
  38. Zarandi, M.H.F.; Hemmati, A.; Davari, S. The multi-depot capacitated location-routing problem with fuzzy travel times. Expert Syst. Appl. 2011, 38, 10075–10084. [Google Scholar] [CrossRef]
  39. Zheng, Y.; Liu, B. Fuzzy vehicle routing model with credibility measure and its hybrid intelligent algorithm. Appl. Math. Comput. 2006, 176, 673–683. [Google Scholar] [CrossRef]
  40. Zadeh, L.A. Fuzzy sets as a basis for a theory of possibility. Fuzzy Sets Syst. 1999, 100, 9–34. [Google Scholar] [CrossRef]
  41. Liu, X. Measuring the satisfaction of constraints in fuzzy linear programming. Fuzzy Sets Syst. 2001, 122, 263–275. [Google Scholar] [CrossRef]
  42. Shaocheng, T. Interval number and fuzzy number linear programmings. Fuzzy Sets Syst. 1994, 66, 301–306. [Google Scholar] [CrossRef]
  43. Özceylan, E.; Paksoy, T. Interactive fuzzy programming approaches to the strategic and tactical planning of a closed-loop supply chain under uncertainty. Int. J. Prod. Res. 2014, 52, 2363–2387. [Google Scholar] [CrossRef]
  44. Liang, T.F.; Cheng, H.W. Application of fuzzy sets to manufacturing/distribution planning decisions with multi-product and multi-time period in supply chains. Expert Syst. Appl. 2009, 36, 3367–3377. [Google Scholar] [CrossRef]
  45. Sun, Y.; Liang, X.; Li, X.; Zhang, C. A Fuzzy Programming Method for Modeling Demand Uncertainty in the Capacitated Road–Rail Multimodal Routing Problem with Time Windows. Symmetry 2019, 11, 91. [Google Scholar] [CrossRef] [Green Version]
  46. Cao, E.; Lai, M. A hybrid differential evolution algorithm to vehicle routing problem with fuzzy demands. J. Comput. Appl. Math. 2009, 231, 302–310. [Google Scholar]
  47. Gen, M.; Tsujimura, Y.; Ida, K. Method for solving multi-objective aggregate production planning problem with fuzzy parameters. Comput. Ind. Eng. 1992, 23, 117–120. [Google Scholar] [CrossRef]
  48. Mula, J.; Peidro, D.; Poler, R. The effectiveness of a fuzzy mathematical programming approach for supply chain production planning with fuzzy demand. Int. J. Prod. Econ. 2010, 128, 136–143. [Google Scholar] [CrossRef]
  49. Sun, Y.; Li, X.; Liang, X.; Zhang, C. A Bi-Objective Fuzzy Credibilistic Chance-Constrained Programming Approach for the Hazardous Materials Road-Rail Multimodal Routing Problem under Uncertainty and Sustainability. Sustainability 2019, 11, 2577. [Google Scholar] [CrossRef] [Green Version]
  50. NDRC. Available online: http://jgjc.ndrc.gov.cn/Detail.aspx?TId=706&newsId=6894 (accessed on 15 November 2019).
  51. Schrage, L. LINGO User’s Guide; LINDO System Inc.: Chicago, IL, USA, 2006; Available online: http://www.lindo.com/ (accessed on 15 November 2019).
  52. Sawik, B. Weighted-sum approach for bi-objective optimization of fleet size with environmental aspects. In Applications of Management Science; Emerald Publishing Limited: Bingley, UK, 2018; pp. 101–116. [Google Scholar]
  53. Wang, J.; Yan, G.; Jiang, K.; Liu, L.; Yang, J.; Ge, C. The study on China's carbon tax policy to mitigate climate change. China Environ. Sci. 2009, 29, 101–105. [Google Scholar]
  54. Wang, R.; Yang, K.; Yang, L.; Gao, Z. Modeling and optimization of a road–rail intermodal transport system under uncertain information. Eng. Appl. Artif. Intell. 2018, 72, 423–436. [Google Scholar] [CrossRef]
Figure 1. A three-stage logistics network.
Sustainability 11 06448 g001
Figure 2. Modelling steps for the green logistics center location and allocation problem under mixed uncertainties.
Sustainability 11 06448 g002
Figure 3. Defuzzification steps.
Sustainability 11 06448 g003
Figure 4. Crisp reformulation of C r { a ˜ r } α .
Sustainability 11 06448 g004
Figure 5. Numerical case.
Sustainability 11 06448 g005
Figure 6. Pareto solutions to the green logistics center location and allocation problem.
Sustainability 11 06448 g006
Figure 7. Sensitivity of the optimization results with respect to the carbon tax regulation.
Sustainability 11 06448 g007
Figure 8. Performances of the best carbon tax rates under different confidence levels.
Sustainability 11 06448 g008
Figure 9. Fuzzy simulation [13,18,27,45].
Sustainability 11 06448 g009
Figure 10. Ratios that the plan under different confidence levels is feasible in the simulated deterministic operation situations of the logistics network when w 1 = 1 and w 2 = 10 .
Sustainability 11 06448 g010
Figure 11. The multi-objective green logistics center location and allocation plan under confidence level of 1.0 when w 1 = 1 and w 2 = 10 .
Sustainability 11 06448 g011
Table 1. Travel distances and carbon dioxide emission factors of the transportation lines.
Transportation LineTravel Distances in KilometerEmission Factors in Kilogram per Ton per KilometerTransportation LineTravel Distances in KilometerEmission Factors in Kilogram per Ton per Kilometer
(1, 4)250.10(3, 6)300.08
(1, 5)380.06(4, 7)350.08
(1, 6)500.08(4, 8)500.07
(2, 4)460.04(5, 7)450.04
(2, 5)250.07(5, 8)300.10
(2, 6)300.05(6, 7)600.06
(3, 4)650.07(6, 8)400.04
(3, 5)480.04
Table 2. Values of the parameters associated with nodes in the logistics network.
NodesFuzzy Supply Capacities in Thousand TonFuzzy Operation Capacities in Thousand TonFuzzy Demands in Thousand TonEmission Factors in Kilogram per TonConstruction Cost in Million CNYOperation Cost in CNY per Ton
1160, 190, 210 2.50
2160, 220, 230 2.00
3120, 150, 170 1.50
4 160, 210, 230 3.0010007.0
5 200, 250, 270 4.5012005.0
6 130, 170, 190 2.009006.0
7 130, 150, 1703.00
8 160, 180, 2502.50
Table 3. Sensitivity of the Pareto solutions with respect to the confidence level.
Confidence Level0.50.60.70.80.91.0
Pareto Solutions to the Problem(19,108.0, 38.42)(19,114.8, 41.26)(21,119.6, 44.47)(22,113.4, 52.88)(31,119.7, 52.96)(31,127.4, 54.01)
(19,112.2, 37.84)(19,118.5, 40.75)(21,119.6, 44.37)(22,113.7, 52.77)(31,124.8, 49.89)(31,129.5, 52.77)
(19,121.4, 37.00)(19,130.3, 39.69)(21,120.7, 43.71)(22,130.6, 51.34)(31,126.1, 49.67)(31,129.9, 52.70)
(21,123.8, 36.78)(21,127.8, 39.57)(21,133.4, 42.70)(22,153.0, 50.38)(31,137.7, 48.75)(31,140.9, 51.82)
(31,124.5, 36.65)(31,134.2, 39.24)(31,140.3, 42.17)(22,162.2, 50.29)(31,139.9, 48.61)(31,142.2, 51.74)
(31,146.0, 45.15)(31,151.6, 48.12)(31,156.6, 51.14)
(31,158.0, 51.13)

