1. Introduction
Land take is a major global anthropic pressures [
1,
2,
3,
4]. When considering all possible land use changes (LUC) [
5,
6,
7], land take is defined as the conversion of agricultural or natural and semi-natural land into urban land [
8]. This kind of land use alteration is considered to have the most environmental impact, among other forms of soil degradation such as compaction, erosion, salinization, or contamination [
9]. Indeed, land take is an irreversible and unsustainable process which leads to the depletion of soil ecosystem services [
10,
11,
12]. One of the drivers of land take is urbanization, which refers to the exodus of populations from rural to urban areas, with an increasing quantity of people moving to cities. Therefore, land take is associated with the growth of urban population, which is expected to increase by up to 66% by 2050 [
13]. If this is true on the global scale, in some Western countries, land take also occurs for economic and political reasons rather than for population pressure [
11,
14].
In Italy, for example, in the late 50s, the resident population was 50,623,569 inhabitants and the land occupied by urban areas was 8700 Km
2, with a growth rate of 19.5% and 16.5%, respectively, until 2017 [
15,
16]. Ineffective planning has been pointed out by some authors as one of the drivers of land take in Italy due to the weakness of its spatial and urban plans, especially at the local level [
17,
18,
19].
Moreover, urban sprawl or “urban sprinkling” have been identified as common phenomena in some areas of the country, such as the Padania Valley [
20], the Mediterranean inlands and coastal plains, and the hilly coasts in the center and south of Italy [
21].
Besides the aforementioned aspects, further drivers of land take in Italy are related to some peculiar features of its housing market and of the fiscal laws [
22]. Specifically, Italy reveals a paradox contrary to economic laws, which consists of one of the highest proportions of vacant dwellings (23%) in Europe—just after Greece, Malta, and Spain—combined with rising house prices, leading to a shortage of housing for the population with the lowest incomes [
23]. Furthermore, between 2007 and 2018, the yearly Italian Finance Bill allowed municipalities to use 80% of land taxation incomes from new urban transformations (primary and secondary urbanization) to finance their current expenditures. Indeed, since municipalities are in charge of local planning control, there has been a conflict of interests between taxation and urban planning that has acted for many years as a booster of urban expansion [
22]. This condition particularly affects local municipalities in Italy, since the municipal local development plans (MLDPs) are overcharged by new development zones for residential, productive, and commercial areas.
An Introduction to Friuli Venezia Giulia Region (Italy)
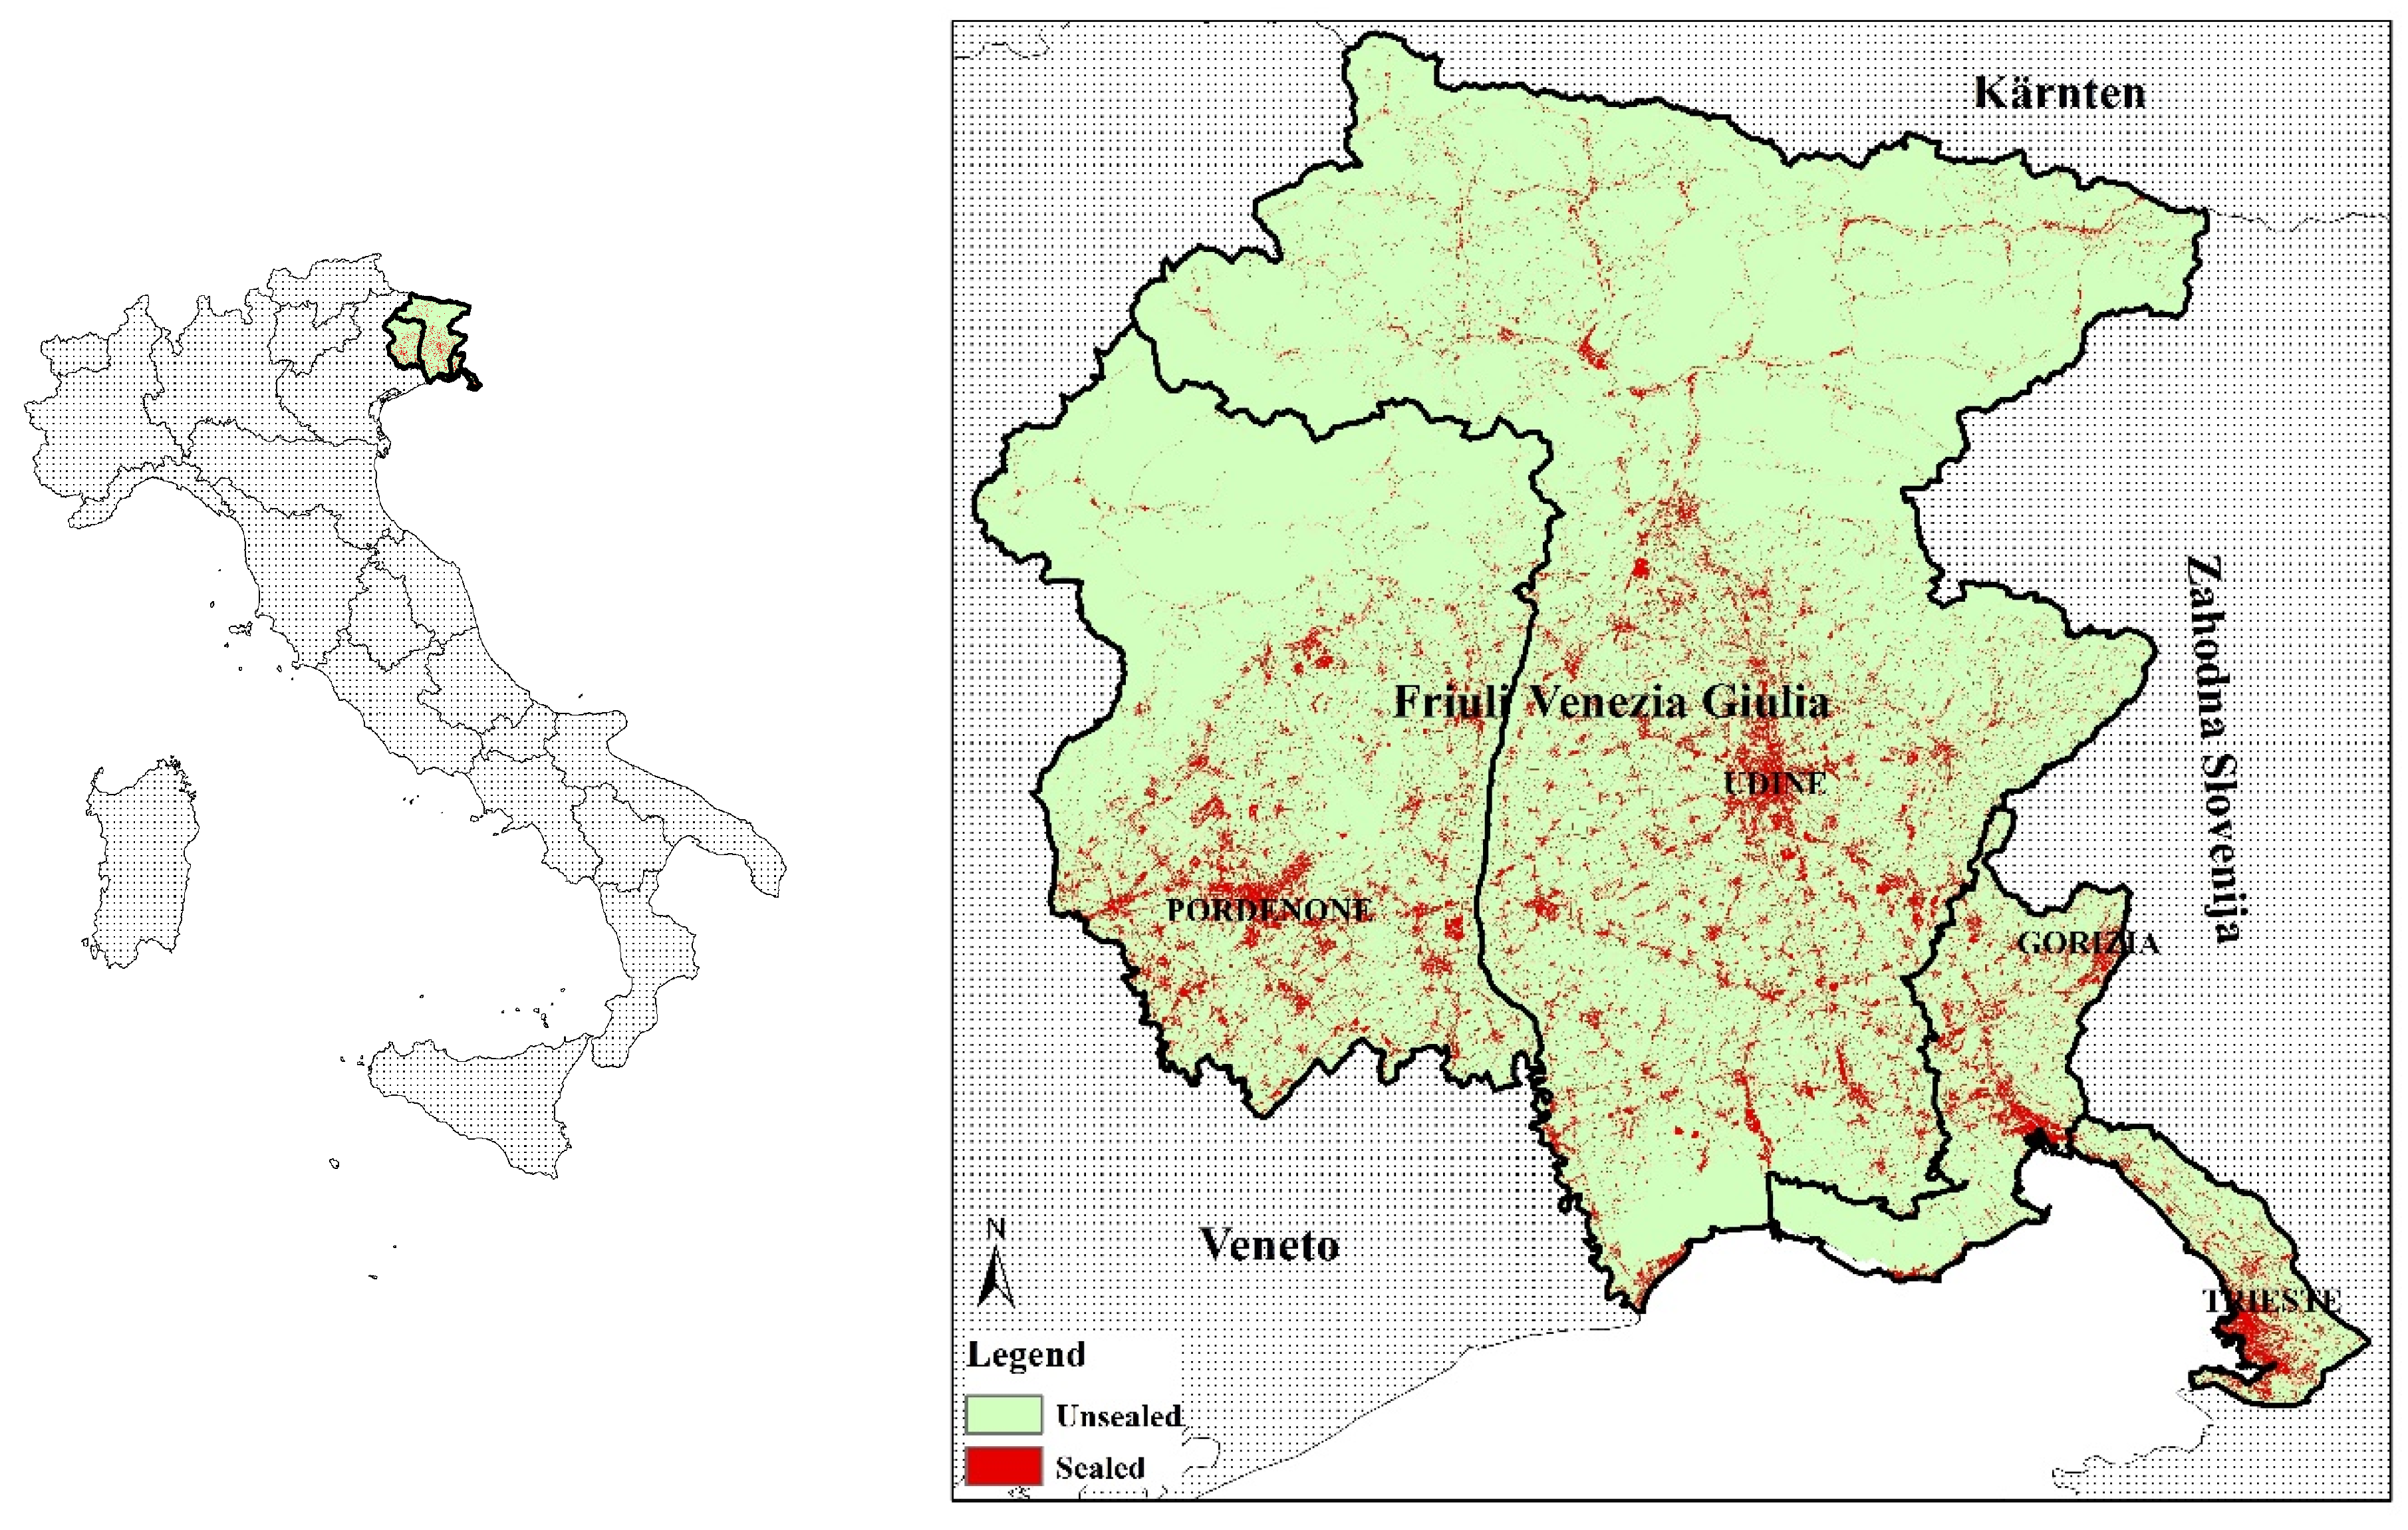
Friuli Venezia Giulia (FVG) is one of the smallest regions of Italy, spanning 785 thousand ha, with approximately 1.2 million inhabitants [
15] (
Figure 1).
The landscape is heterogeneous and includes coasts, plains, hills, lakes, and part of the Western Alps, and is the origin of very different microclimatic conditions, which is a peculiarity of this area of Italy. The mountainous territory covers more than 40% of the region, while hills cover approximately 20% and the rest is floodplains and coastal areas. This heterogeneity has characterized the economy of the region, especially as concerns its primary production, ranging from crop yields of cereals, mainly produced in the plains, to the production of wine in the eastern hills.
Despite the demographic stagnation, the traffic of people and goods in FVG has steadily increased. This has been the effect of the changing geopolitical conditions of Eastern Europe. Indeed, being situated between eastern Italian regions (Veneto Region) and the Austrian/Slovenian territories (see
Figure 1), this region has historically bridged Western and Eastern Europe and the future development of the high-speed/high-capacity European Corridor V, with the rationalization of public and private mobility seen as one of the most important targets for the economic development of the four provinces: Pordenone, Udine, Gorizia, and Trieste.
In a more recent analysis on land take, based on the national map of land consumption by the Italian Institute for Environmental Protection and Research (ISPRA) [
24], FVG is the fourth most urbanized Italian region in terms of pro capita urban area (573 m). This index represents the low-density urban development model of some areas in FVG well; it is quite soil-inefficient, given the high demand for space per inhabitant. Even if FVG does not have an absolute level of urbanization comparable to the most sealed regions in Italy, its relative value displays quite a problematic trend. Therefore, despite the fact that in the year 2015–2016, the annual per capita land take (0.8 m
2/inhabitant/year) was below the national threshold (1.1 m
2/inhabitant/year), the absolute figure of 50 ha is the sign of an irreversible process that is taking place independently of the demographic trend. As argued, from 1951 to 2015, the population in FVG decreased from 1,226,121 to 1,221,218.
In continuity with past trends, recent land take has also occurred mostly in the plain areas, consuming the most fertile and productive agricultural fields, which have been transformed into new residential, industrial, and commercial areas.
A specific character of the land take in FVG is urban development for new industrial and commercial zones, which has shaped most landscape transformations in recent years. The regional council, which is institutionally empowered to pass planning laws—FVG being one of the five regions in Italy with a statute of autonomy—has initiated a legislative reform to limit land take for commercial and industrial use, forwarding the objective of adopting planning policies compliant with the goal of zero net land take by 2050 [
25]. This decision to promote a specific policy against land take, aimed at reducing sealed surfaces for productive and commercial uses, acknowledges that soil sealing is one of the major anthropogenic processes causing environmental and landscape degradation [
26,
27].
Policies against land take are mainly based on a quantitative approach to reduction [
28], which is undoubtedly reasonable from a general and pragmatic point of view. Nonetheless, measuring the quantity of land take and fixing a threshold of reduction is not enough to create an effective and efficient policy against land take.
A large amount of the literature to date has focused particular attention on filling the gap between the theoretical knowledge of a territorial phenomenon and its practical comprehension, where practical comprehension refers to the possibility of deepening our knowledge of the quantitative and qualitative territorial effects of targeted policies that act to reduce a particular phenomenon.
In this manuscript, historical land take trends in FVG are quantitatively introduced (
Section 1), while in
Section 2, a particular methodology has been developed to assess the undeveloped zones for industrial and commercial uses that have been assigned building rights by plans (hereafter, we refer to this condition using the term “residual areas”).
Results and discussion are provided in
Section 3 and
Section 4, with particular attention paid to what this study revealed in relation to the regional law against land take for productive and commercial planning zones.
2. Materials and Methods
The methodology is structured as follows: first, the datasets employed for the analysis of the past land take trend are introduced, with specific attention paid to industrial and commercial sites. The approach used to quantify the upcoming land use transformations for industrial and commercial uses has been accurately described, with a distinction between the predicted quantity of land take and the predicted quantity of soil sealing. The past and future trends were organically threated to provide a first comprehensive assessment of the LUC dynamics in FVG, giving a complete evaluation of the phenomena in light of the most recent legislative approach to land take reduction.
Analysis of the residual areas was performed to assess future land take and the sealing rate by industrial and commercial land use zoning. Residual areas are the portions of the homogeneous planning zones that are undeveloped at present, but can be potentially built on in future, since they have been assigned building rights by the MLDP. Actually, the regional planning authority cannot rely on a complete, comprehensive, and up to date assessment of these areas for the overall regional territory. Thus, the approach focused on defining a method to assess potential land take by residual industrial and commercial areas in terms of future impact on the rural territory, by detecting the residual unsealed and undeveloped land use zones on the basis of the original dataset of the mosaic of the municipal local development plans (MMLDP) described in this paper, and by deleting the parts of the zones that were already developed in past.
2.1. Data Description
2.1.1. The Land-Use Geo Database of the MOLAND FVG Project
The first set of regional land use maps for FVG was published in 2001, along with the Monitoring Land Use/Cover Dynamics (MOLAND) FVG project. This involved the creation of four land use databases—the reference one for the year 2000 and three historical ones for the 50s through the 70s and 80s for the whole regional territory. This land use information has provided crucial information for planning, governing, and analyzing the territorial system after the first development phase experienced in this region after the Second World War. It was the result of a video-photointerpretation process from Indian Remote Sensing (IRS) satellite images and color orthophotos by onscreen image interpretation with a minimum mapping unit of 100 m2 for the artificial land use types and 250 m2 for the remaining classes, and a cartographic validation through ancillary data (particularly MLDP).
All four datasets share a common land use classification system compliant with the Corine Land Cover European standard [
29,
30,
31], with an additional fourth level for the artificial land classes (
Table 1) [
32]. In this research, land use change was calculated from the fourth level of classification, thus allowing a detailed assessment to be achieved [
7,
33].
2.1.2. The National High-Resolution Land Consumption Map
The national high-resolution land consumption (NHRLC) map is a 10 m raster covering the entire Italian territory and produced yearly by ISPRA since 2015 within its institutional activities of land take monitoring [
34,
35]. This dataset was derived using semi-automatic classification techniques from high-resolution satellite images, with the purpose of detecting sealed and artificial areas [
34]. Topographic geodatabases, local scale maps, and vector Openstreet data were used as ancillary information to improve the image classification, particularly for the detection of the street network [
16,
35]. The NHRLC map classifies the territory according to a binary system into consumed (class 1) and non-consumed (class 0) land, and is downloadable as open access data from the SINANET portal (
http://groupware.sinanet.isprambiente.it/uso-copertura-e-consumo-di-suolo/library/consumo-di-suolo).
Table 2 shows the grouping of the different land cover typologies into the two classes.
Unlike the HRL Copernicus classification system, the Italian NHRLC map system classifies railways, quarries, and dumping sites as land taken [
36], and has an improved resolution from 20 m to 10 m, which also makes it suitable for analyses at the local scale.
In this study, the most recent NHRLC raster dataset for the year 2017 was analyzed to ascertain the quantity and distribution of sealed land within the industrial and commercial planning zones and the administrative areas. The 2017 NHRLC dataset has a 10 m resolution, allowing for a detailed assessment of the permeable/impervious surfaces in the context of study.
2.1.3. The Mosaic of the Municipal Local Development Plans
In Italy, the structure and processes followed by the municipal authorities in preparing statutory land use plans are defined by laws and planning acts issued by each Regional Council in the absence of a national framework law. The MLDP (in Italy, namely the “Piano Regolatore Generale Comunale”) in some regions, including FVG, is divided into a structure plan (a long term strategic vision) and a territorial development plan (operative plan with zoning functions) with additional, more detailed public or private implementation plans for some specific developments [
37].
The MLDP comprises the zoning classification system and the connected standards that apply homogeneous functions and constraints or building rights within each zone over the entire municipal administrative territory, as set by the n 1444/1968 national decree. The FVG regional planning authority (FVGRPA) has adopted the national zoning classification system, while allowing the municipalities to specify a second-level zoning classification to specify the zones into sub-zones. However, unlike other regional authorities, the FVGRPA has not issued mandatory technical standards for the MLDP spatial datasets and maps, nor has it obliged municipalities to standardize the second-level classification codes and the structure of the geographic data. Consequently, the MLDP maps do not comply with a standard sub-zoning classification, and the structure and graphical layout can be very different between municipalities.
Nonetheless, any political decision regarding territorial development and land-use change should be based on a sound information base. Consequently, the FVGRPA has recently undertaken the mosaicking of the zoning schemes of MLDPs to gain a comprehensive overview of the progress of the municipal planning provisions.
The mosaic is the result of a standardization of both the geometries and attributes of the original 215 MLDP maps actually in force, one for each municipality, the years of approval of which are different between administrative areas. Therefore, the creation of the MMLDP database requires time and resources by the regional planning authority and, for some planning zone codes, is still in progress. Indeed, the standardization of the zone codes of the MLDPs maps started with the industrial, craftwork, and commercial zones, and it is in progress for other land use types (e.g., residential, services, facilities etc.).
The MMLDP is not an open dataset since is used by the FVGRPA for institutional purposes, and it was approved for external use for the first time in this study, given the scientific purposes of the analysis.
The MMLDP is a vector dataset extended to the whole territory of the FVG region, where the geometry of industrial, craftwork, and commercial homogeneous planning zones is represented by polygons, each one associated with a set of attributes mostly derived from the original plans. In particular, there are zone and sub-zone codes that identify each industrial or commercial land use type, with an additional standard regional zoning code (sub-zones in
Table 3) resulting from the standardization process.
Each zone consists of a developed part, built in the past, and an undeveloped component that holds planning rights for future development, without a clear geometric boundary on the map.
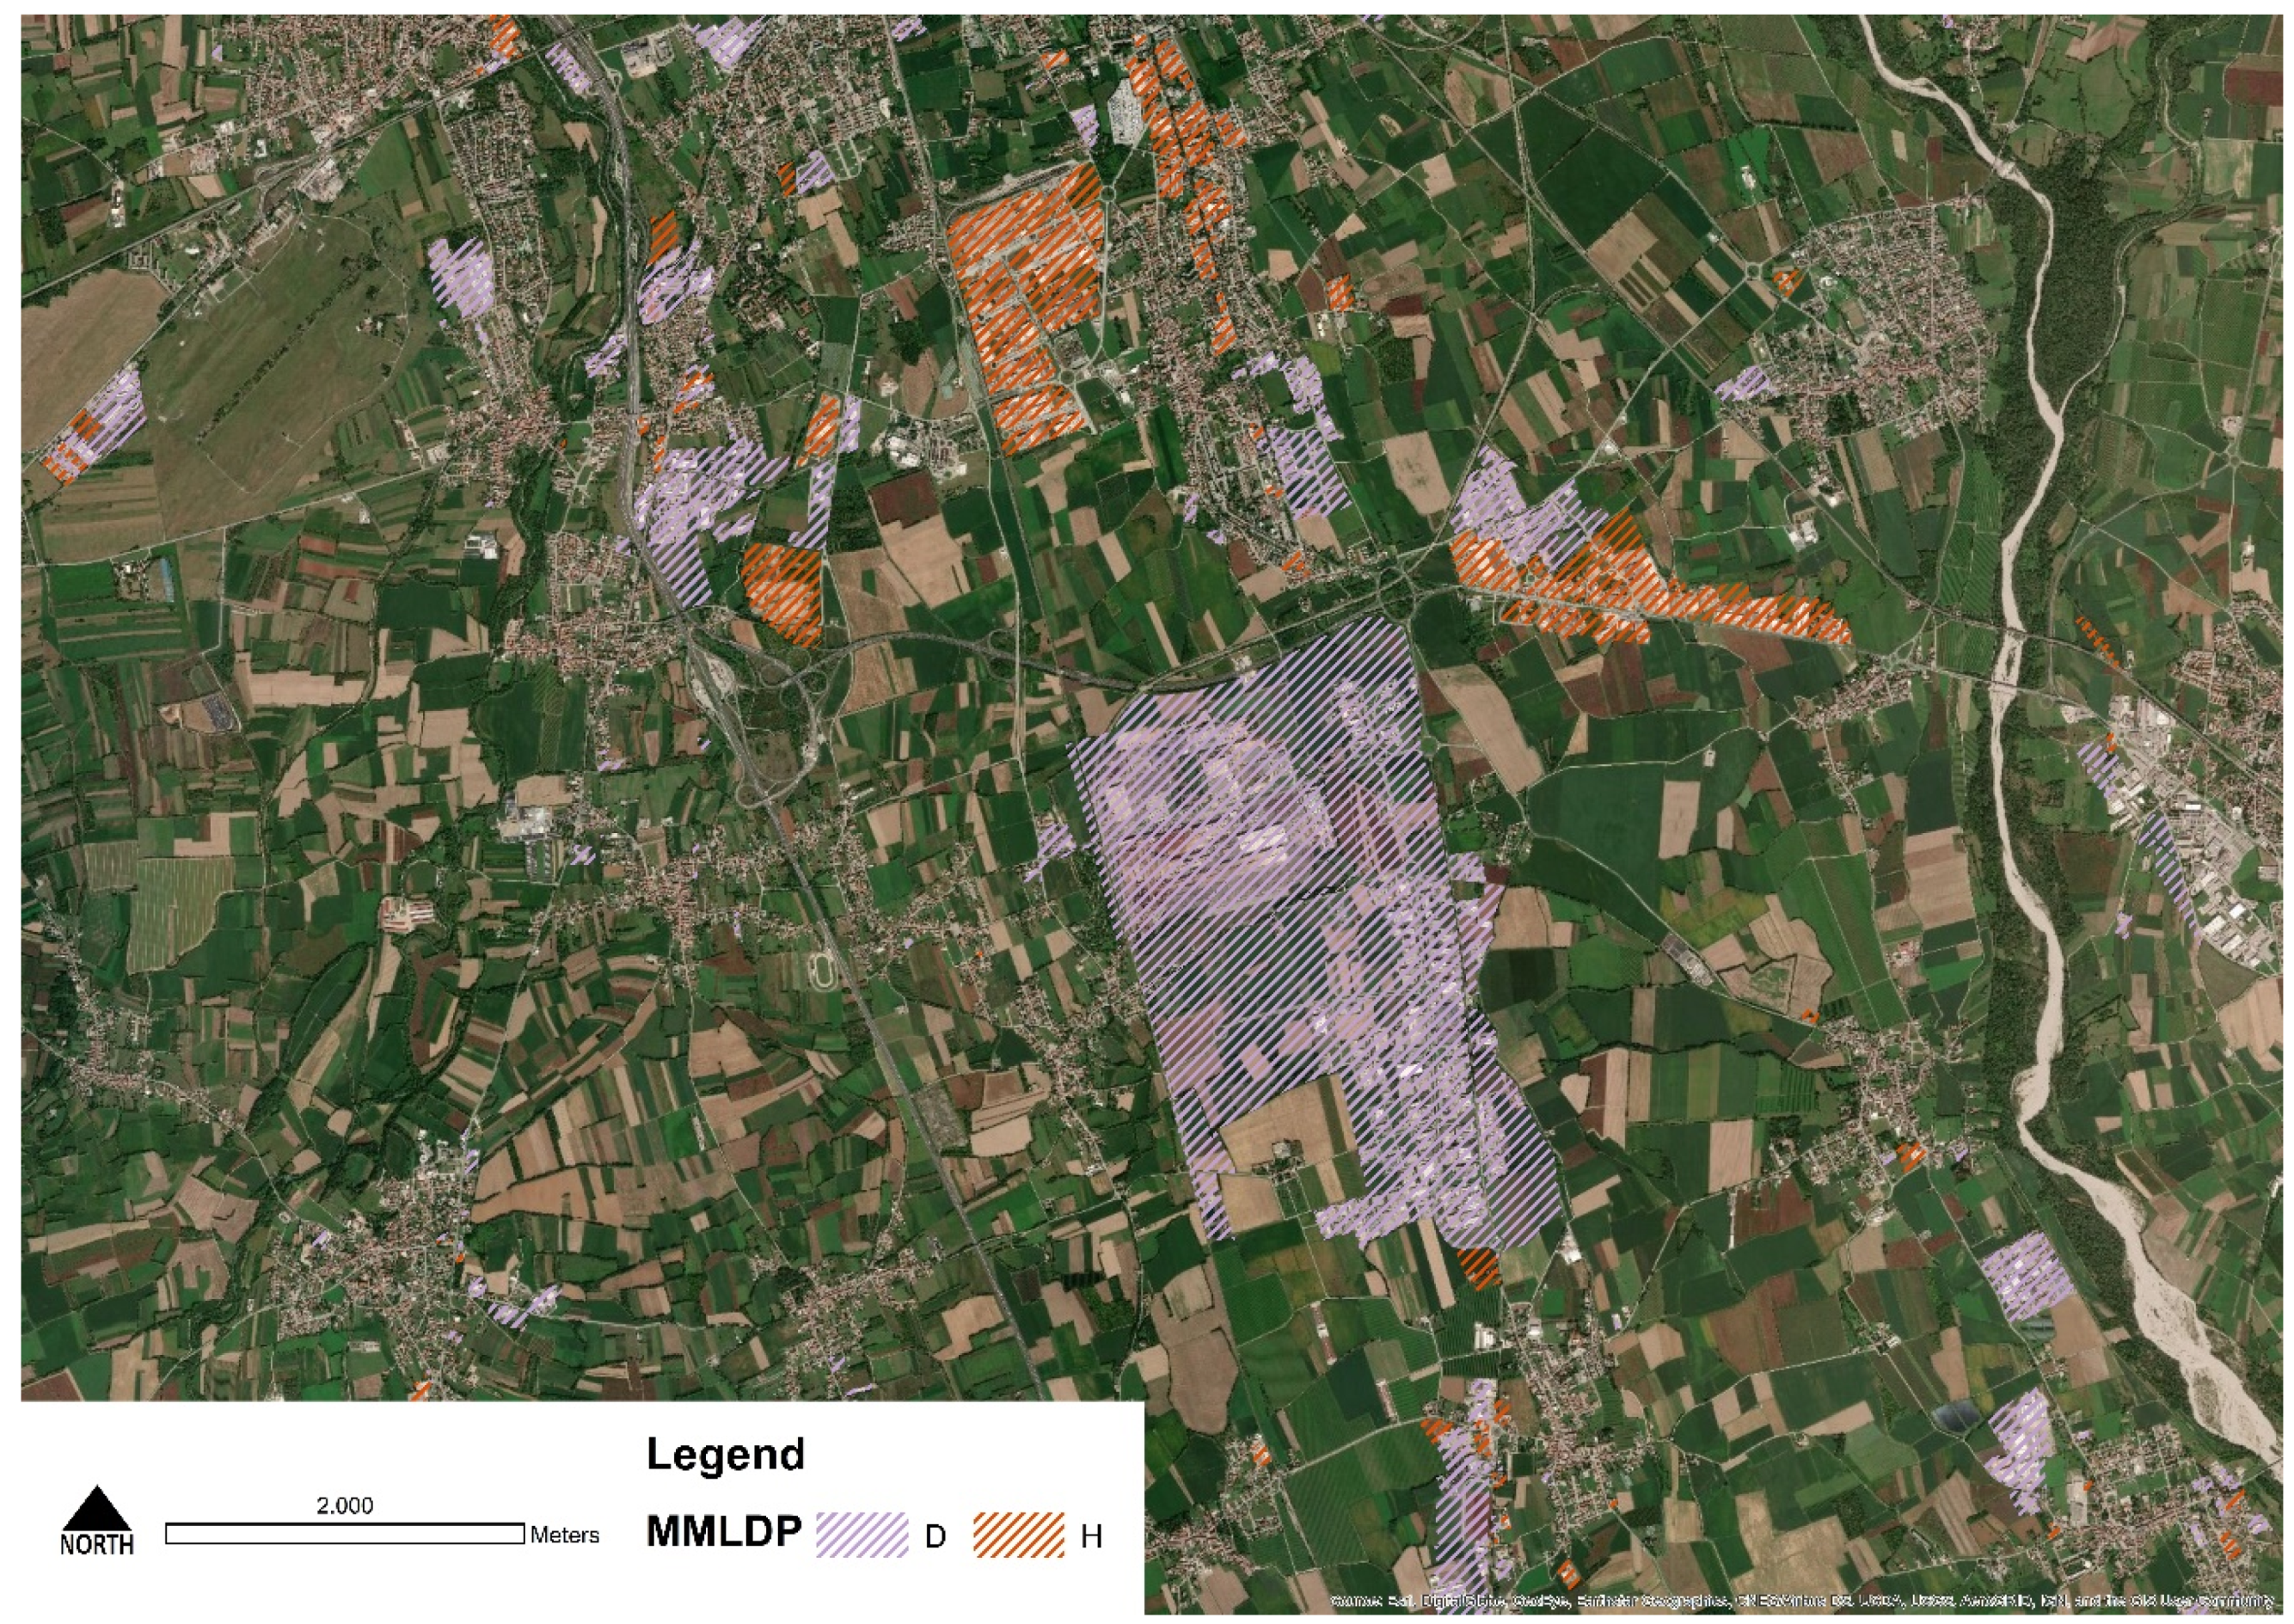
The MMLDP data had been put through error checking by the FVGRPA, but it lacked a proper error checking report. Therefore, before proceeding with the analyses, further cleaning was performed over the geometries and the attributes of the MMLDP to remove duplicated polygons. Further, the correctness of the reclassification from the original sub-zone codes into the new standard regional zone codes was checked, by performing targeted selections with the support of orthophotos to visually control the correspondence between the land use type (
Figure 2).
While using the MMLDP dataset, this study detected the following weaknesses in the attributes of the data:
the incomplete implementation index of many planning zones/polygons and the lack of the corresponding geometric data. This information is fundamentally required to detect the planning zones with building rights that have not yet been developed—and eventually in the future could be returned to an agricultural or more sustainable land use—from those that have been completely or partially filled during development;
the incomplete “coverage ratio coefficient”, or the ratio between the maximum buildable area and the total area of the planning zone, which is defined in the MLDP. Usually this coefficient varies between 50% and 90% of the total zone area, leaving the remaining part unsealed.
The above data gaps were resolved by further processing as described in the following section.
The corrected version of the MMLDP was composed of all the homogeneous planning zoning polygons for D and H codes, which in
Figure 2 are identified by two different colors: light violet for D zones and orange for H zones. The updated version of the MMLDP was used for the analysis of the residual areas, thus allowing future land take to be quantified.
2.1.4. Other Data
The FVG municipal administrative units layer (2016) from the regional geo-geoportal was used to provide the provincial and regional limits used for the area statistics.
In order to carry out a quantitative and qualitative analysis of land take, D (industrial) and H (commercial) zones were analyzed according to the elevation of their location as a proxy of landscape “sensitivity”—the higher the altitude, the more fragile the environment—following the approach of the national land take quantification by ISPRA [
16]. The layer of the municipal administrative units by elevation zone was created by joining the municipal administrative unit layer and the ISTAT Excel table of the Italian municipalities by elevation zone, which carries an elevation code according to the location of the town hall (
Table 4).
2.2. Data Processing
2.2.1. Computation of Planned Industrial and Commercial Land Use
The computation of the planned industrial and commercial land use and its rate of imperviousness was carried out via the joint analysis of the vector dataset of the MMLDP and the NHRLC raster map.
The analysis of the planned land use involved area statistics organized by planning zone of the MMLDP, divided by province, elevation zone, different classification levels of land use type (e.g., industrial, commercial etc.). The summary statistics by area were performed using the respective area codes: the municipality code—one of the many attributes associated to each planning zone—that results from the concatenation of the region, province, and municipality codes, the elevation, and the land use type codes.
The computation of the imperviousness rate for developed industrial and commercial land uses relied on the area analysis of the sealed/unsealed land from the raster NHRLC map within each planning zone of the MMLDP vector layer. Impervious surfaces result from the development of both industrial and commercial buildings and related infrastructures. The imperviousness data were used (i) to assess the implementation rate of the planning zones and, consequently, of the residual areas described hereafter, (ii) to calculate the average sealing rate for the developed industrial and commercial areas, and (iii) to predict the exact future amount of soil sealing for each administrative area (e.g., province). The complete procedure in ArcGIS included:
the creation of a raster of the MMLDP sub-zones with a vector to raster conversion of the MMLDP on the basis of a new attribute field in the vector layer, derived after concatenation of FID (feature ID) and homogeneous sub-zone codes (as in
Table 3);
a cross-tabulation between the NHRLC (imperviousness) and the MMLDP (planning zones) rasters, resulting in a table report where each polygon/zone, with its original FID, was associated with the absolute and relative area of sealed (1) and not sealed (0) land; then the tabulation table was joined, through the common FID field, to the original attribute table of the MMLDP;
the selection of residual areas to quantify and locate the land that will be affected by new development in the near future. This process was organized into several sub-processes described in the following section.
2.2.2. The Computation of the Residual Areas
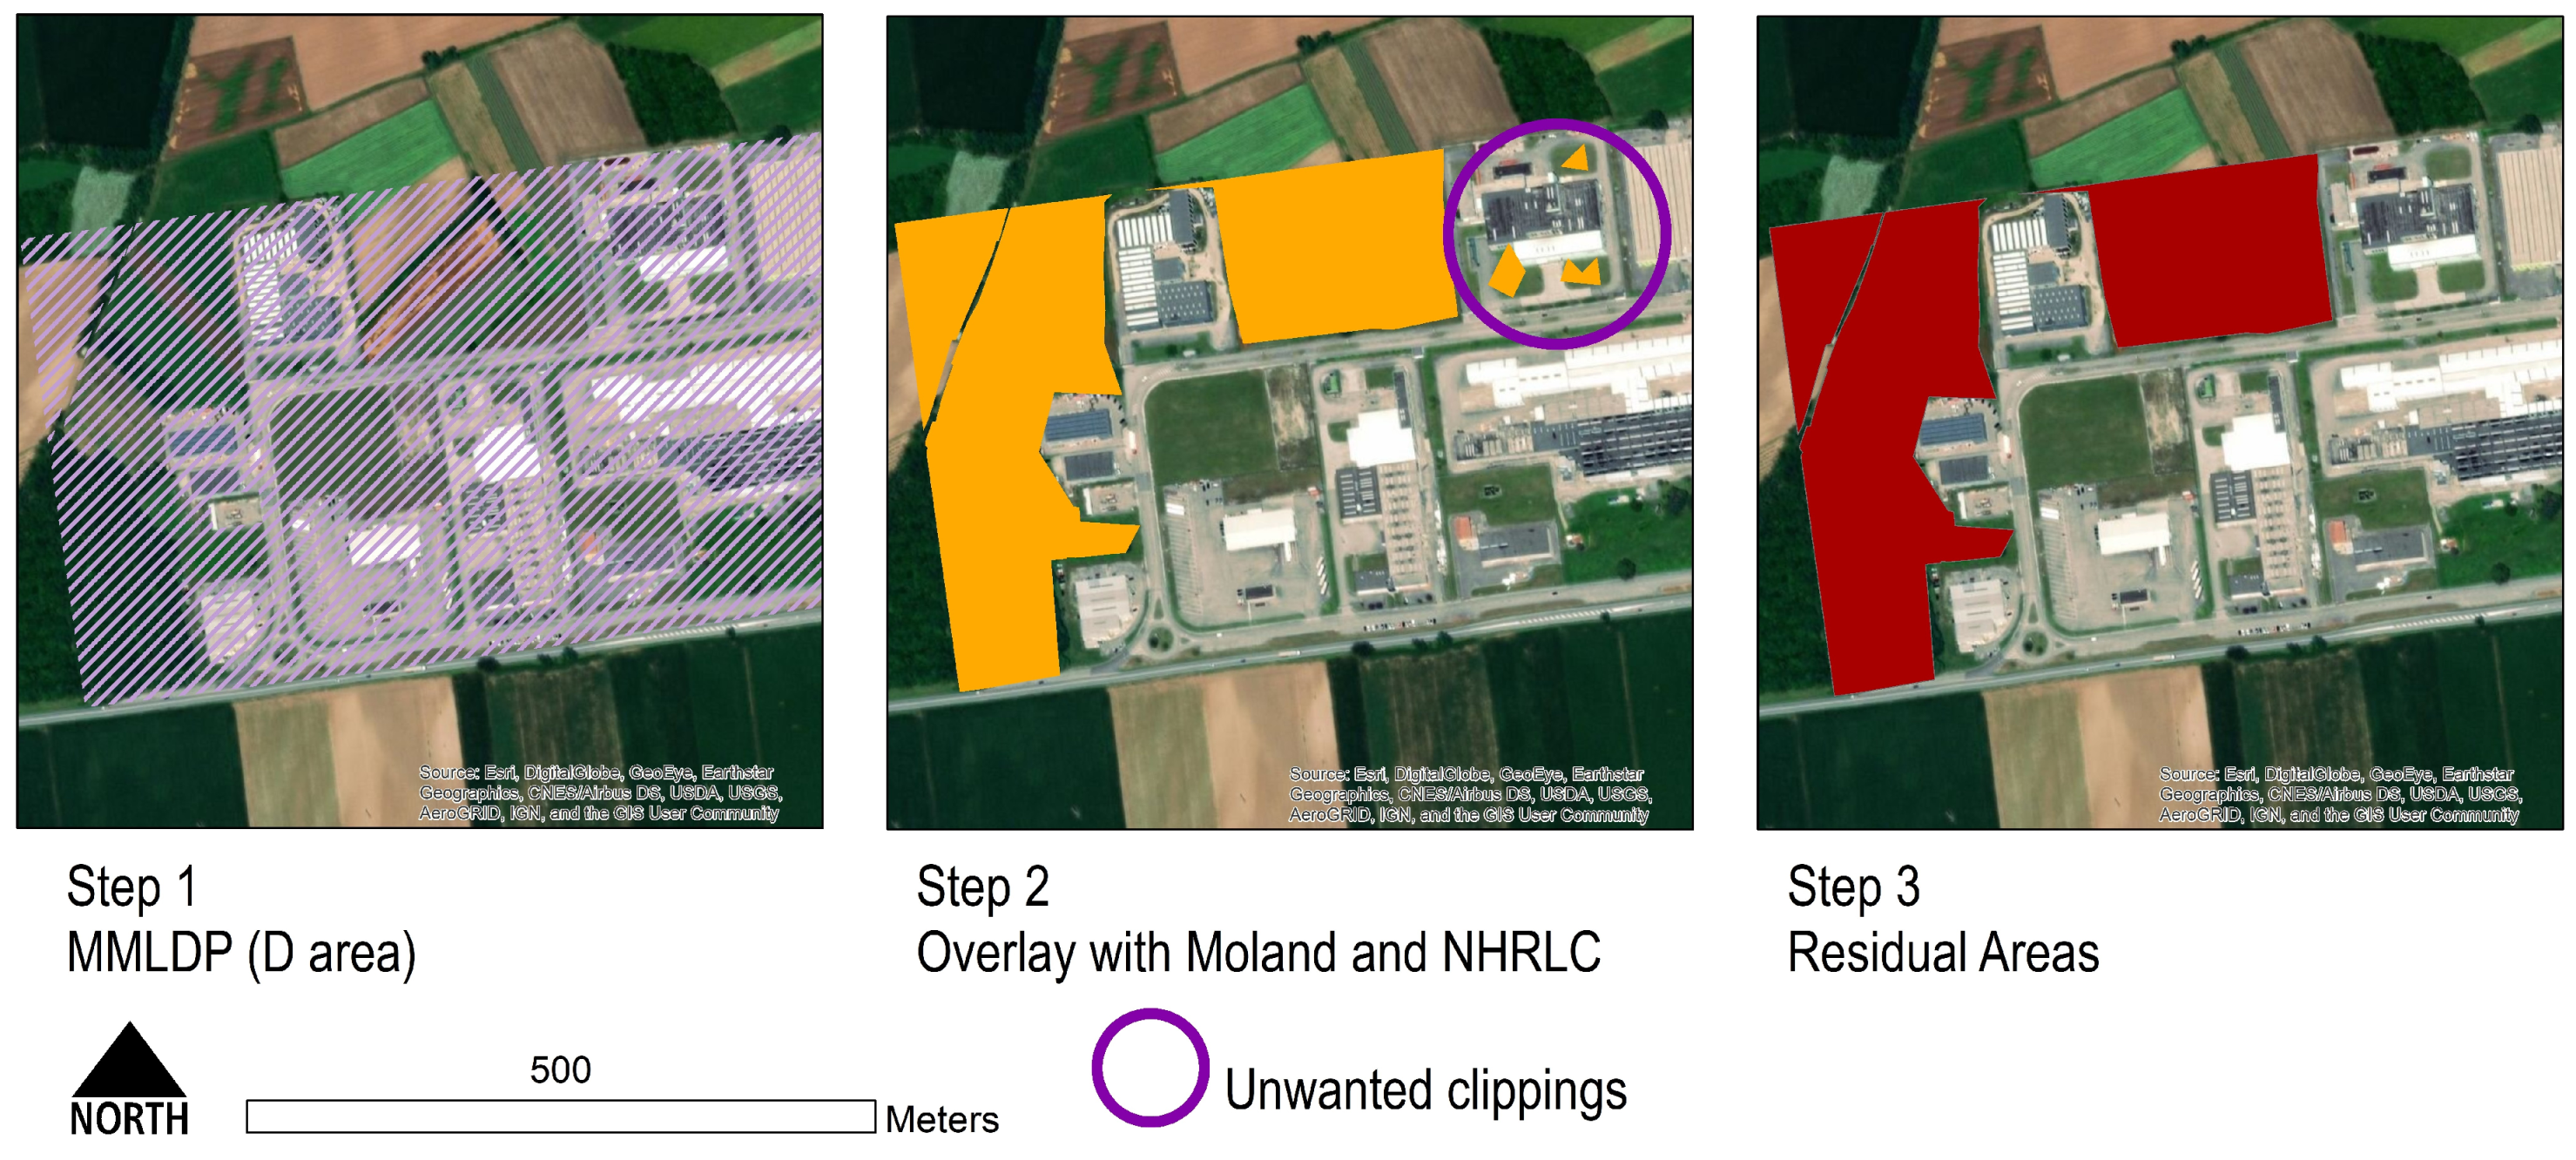
The residual areas were derived via a stepwise Geographic Information System process based on an overlay analysis, aimed at erasing from the MMLDP (Step 1 in
Figure 3) the already developed sealed areas, thus finding the remaining unsealed part of each MMLDP zone that carried landowners’ development rights for future industrial or commercial zones.
Residual areas were calculated via the following operations. Initially, the artificial areas (Class 1, First level,
Table 1) of the MOLAND 2000 land cover dataset were used to erase from the MMLDP (Step 2 in
Figure 3) the areas that had already been developed in the past, up to the year 2000.
Subsequently, the same erase operation was performed by using the sealed areas of the 2016 NHRLC raster to update as much as possible (to the year 2016) the state of completion of each planning zone. This last dataset did not allow the deletion of all developed areas (including the non-sealed ones) but was the only up-to-date land use data available.
A correction was then performed (Step 3 in
Figure 3) on the features to delete the unwanted polygons that did not correspond to residual areas resulting from the overlay analysis due to the different nature of the original data. For this purpose, an indicator of geometrical compactness was calculated for each polygon of the shapefile. The indicator represented the degree of margin fragmentation, calculated as the relationship between the area and the perimeter of the polygon. The more regular the polygon, the higher the probability that it was a true residual area of undeveloped industrial or commercial lots, while the more irregular the polygon, the higher the probability that it was an unintentional raw geometry produced by an unwanted clipping in the previous overlay.
The formula that was used to set this indicator was:
FC = ((2π√A) ÷ π) ÷ P × 100 [
38]
where:
FC = Form Compactness
A = polygon area (square meters)
P = polygon perimeter (meters)
Once the indicator was calculated, the unwanted clippings were selected using their geometrical compactness. The steps of the above procedure are shown in
Figure 3.
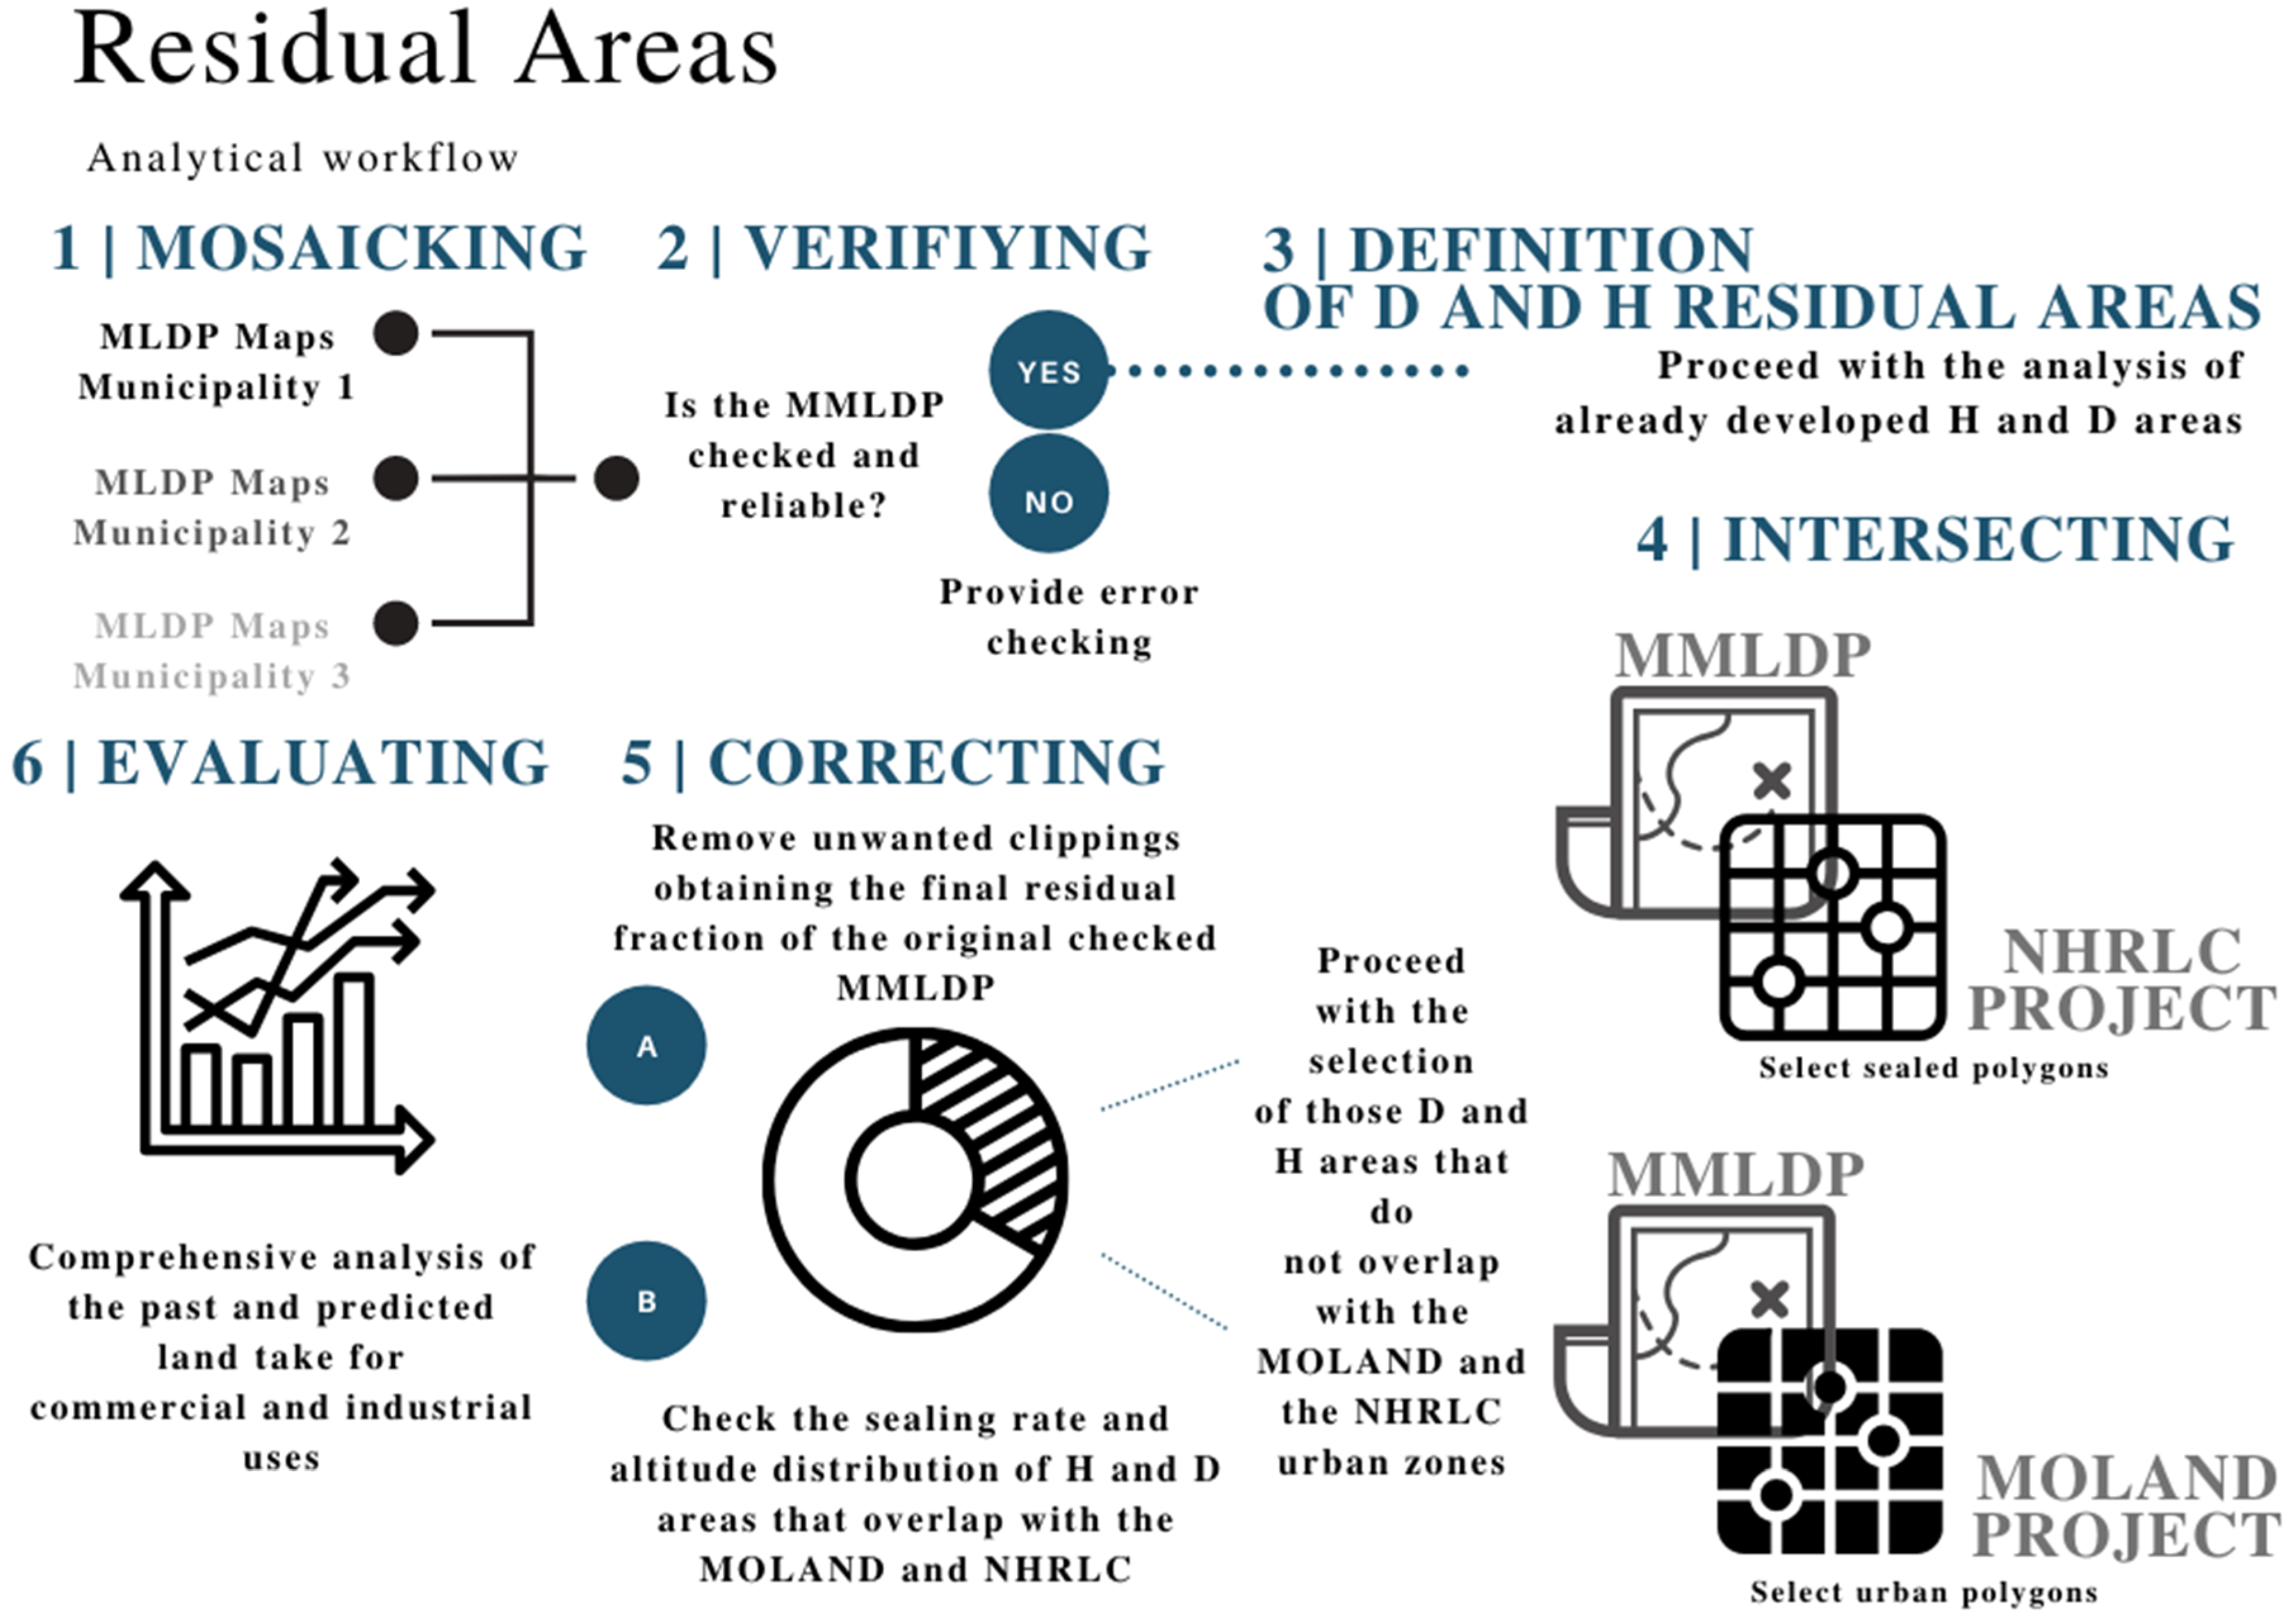
Once the GIS stepwise procedure had been performed, a last step was addressed to reach a quantification of the average sealing rate in the already developed industrial and commercial areas. This final procedure was crucial, since the MMLDP did not contain the coverage ratio coefficient, or the ratio between the maximum buildable area and the total area of the planning zone that was defined in the MLDP; therefore, it was impossible to make a reliable estimation of the exact amount of future soil sealing. This step was performed by intersecting the non-residual part of the MMLDP with the NHRLC and calculating the effective sealing rate of the D and H areas.
The overall procedure is displayed in the analytical workflow chart (
Figure 4), which briefly summarizes the methodological steps that served to produce the results presented below.
3. Results
Between 1980 and 2000, agricultural land was affected by massive urbanization: more than 6000 ha of open fields were converted into urban areas, with a 2.3% loss of agricultural land [
39]. This means that every day, more than 8000 square meters were urbanized.
In the same period, natural and semi-natural land experienced a small gain (less than 800 ha) which did not compensate for the loss of agricultural fields. Afforestation occurs predominantly in mountainous low valley areas, where pastures and permanent grass have been replaced by forest. Nonetheless, this kind of naturalization is a consequence of land abandonment in residual alpine areas—suffering from the weakening of the grazing economy—and has not led to an increase in the environmental quality of these areas.
In addition, the increase of urban areas took place without a corresponding real, positive trend of the population. Between 1980 and 2000, the region experienced a population decrease of more than 50,000 inhabitants, a loss of 4.4% [
15].
The analysis of past spatial–temporal patterns of land take in the Friuli Venezia Giulia region (
Table 5) showed that the land occupied by industrial and commercial uses in the year 2000 covered 11,092 ha, equal to 1.4% of the regional territory.
The extent of artificial land across the four provinces in 2000 (respectively Gorizia, Pordenone, Trieste, and Udine) showed an occupation of 14.3%, 9.9%, 32.8%, and 6.8% of their provincial administrative area.
Comprehensively, FVG region experienced an urbanization trend equal to 5776 ha in twenty years (1980–2000, see
Table 5), mostly concentrated in the provinces of Udine and Pordenone, for which 2499 ha was the specific land take for commercial and industrial uses.
The analysis of the planned industrial and commercial land use (
Table 6) showed that the whole extension of these areas in the FVG region was 15,966 ha: 13,922 ha were represented by D, industrial zones, while 2043.2 were H, commercial zones, covering 2% of the entire administrative area. The industrial zones (D), with 13,922 ha, occupied around 87%t of the planned zones area.
When considering the share of D and H by elevation zone, a concentration of industrial and commercial areas of about 69% in the plain zone of the region was found, while the mountain area had only 6.3%.
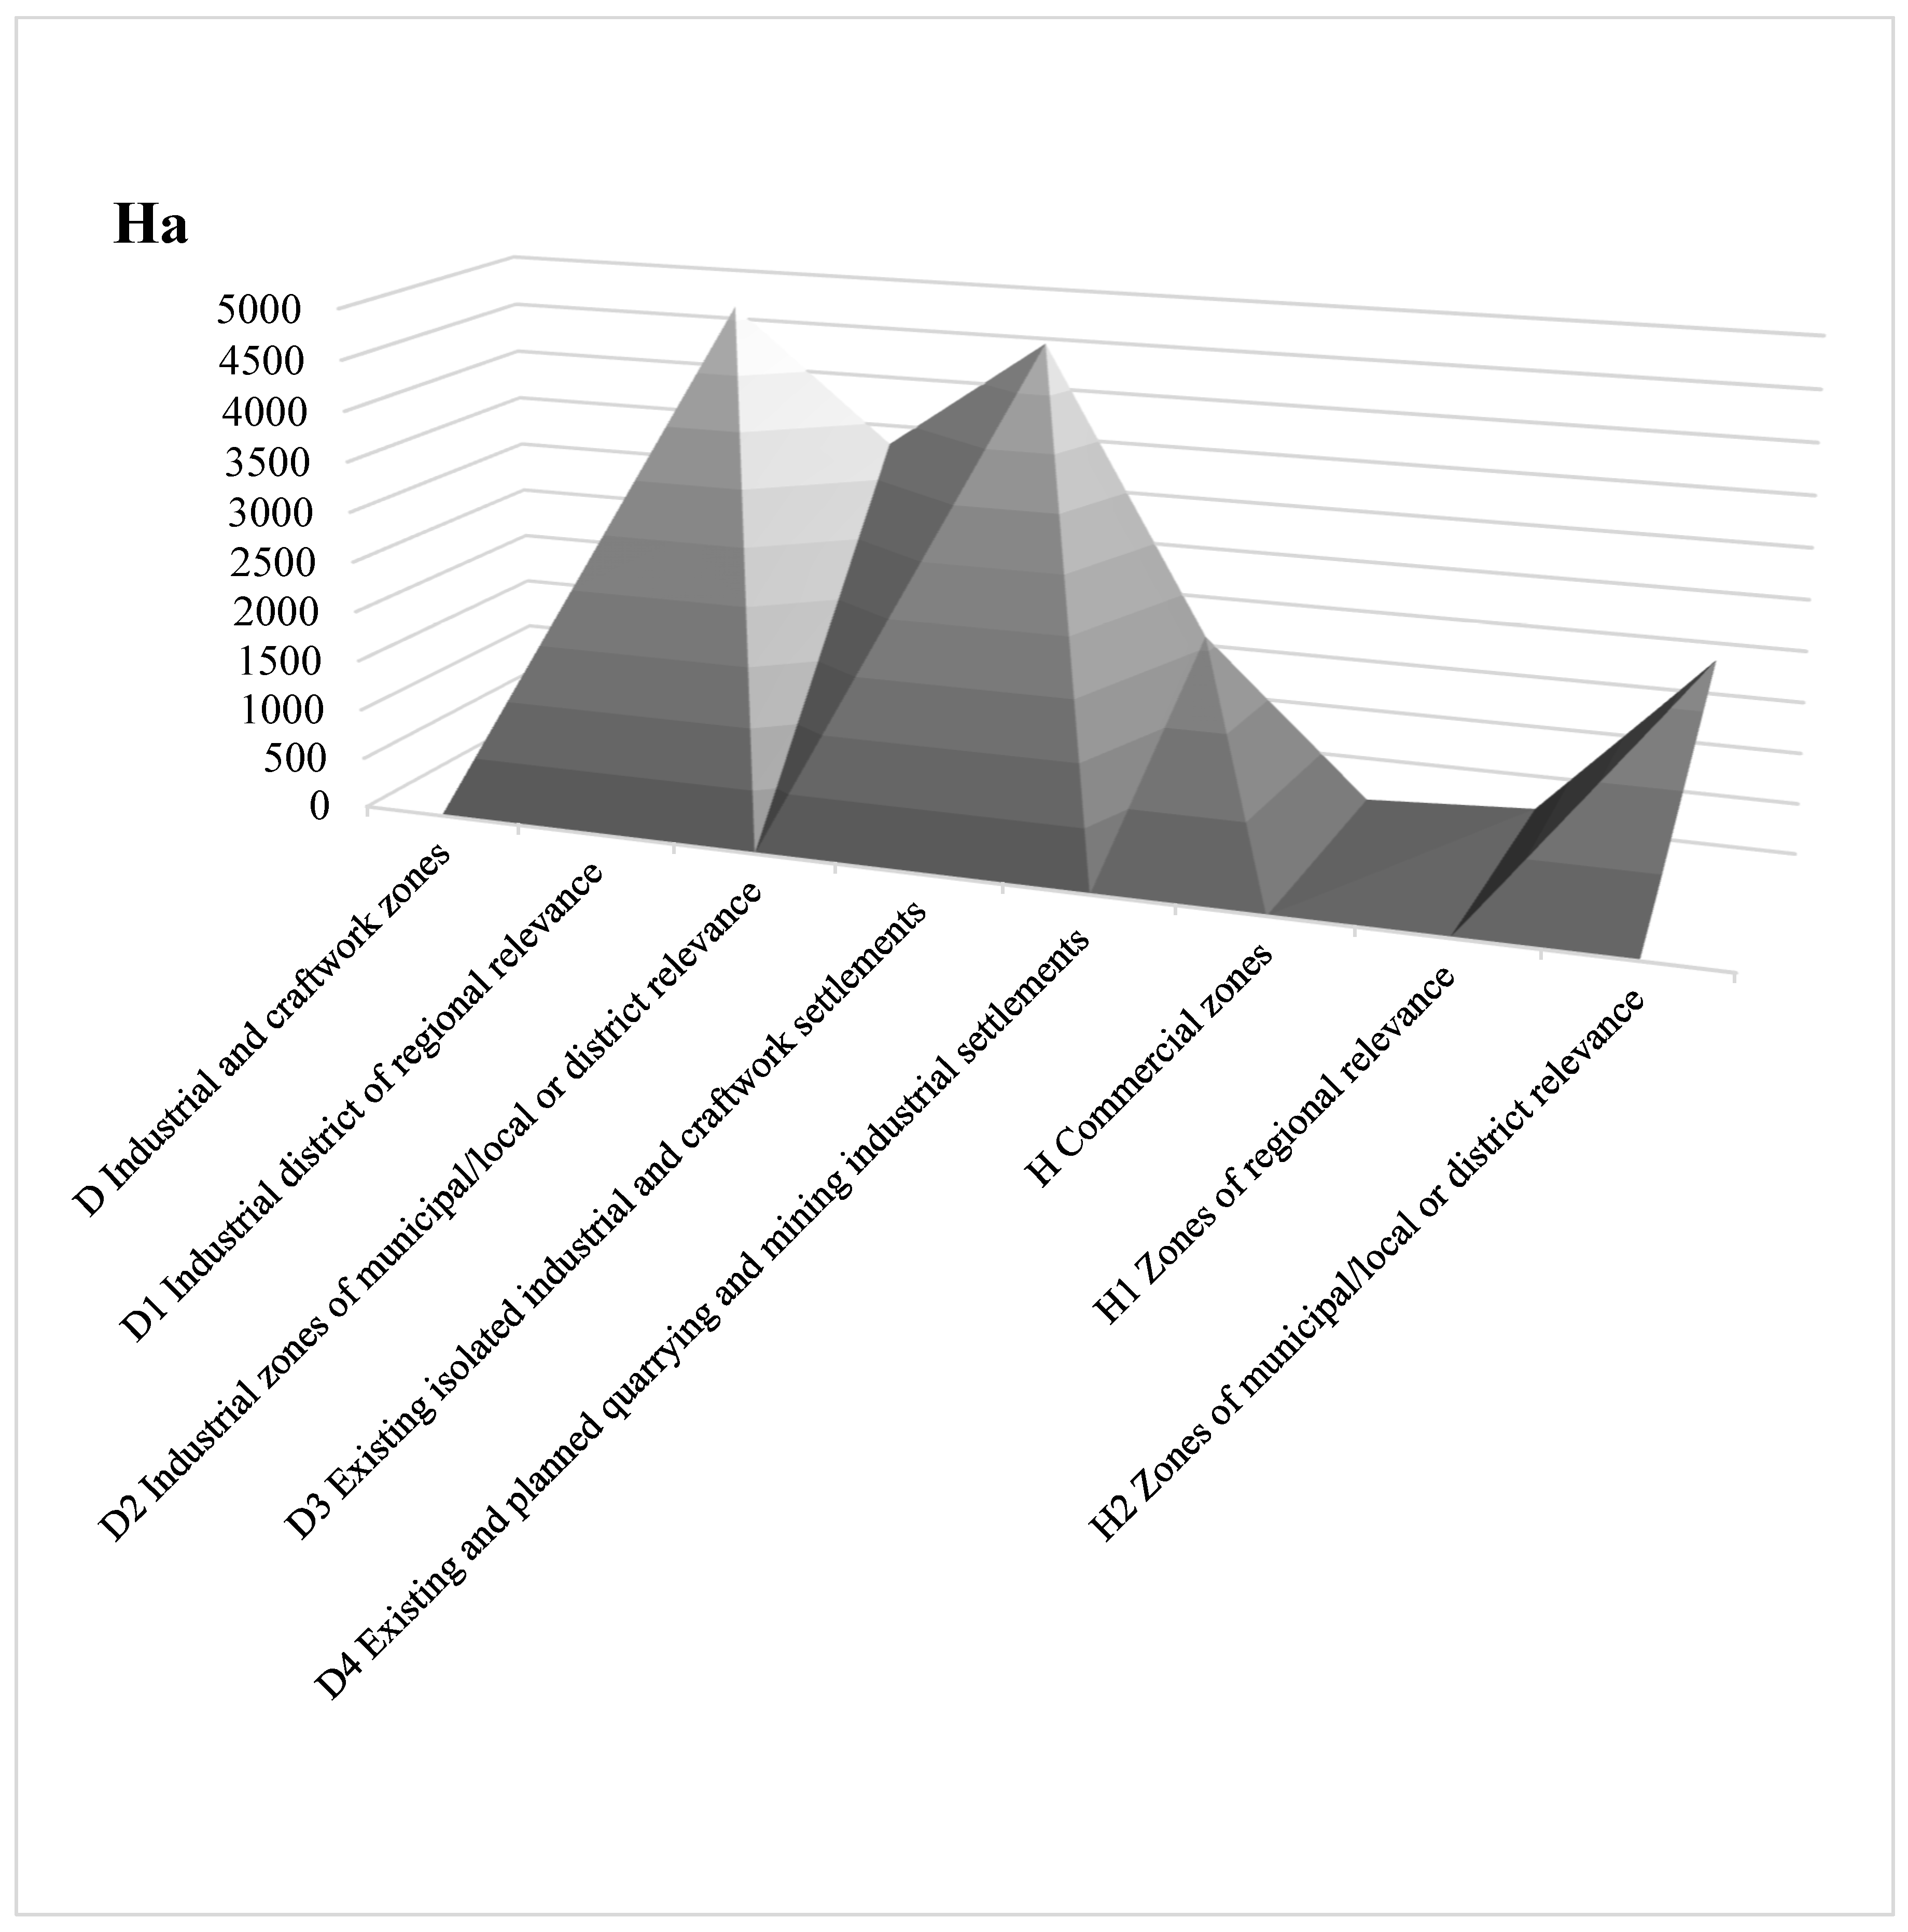
The industrial and commercial zones by type in FVG (
Figure 5) showed that “industrial district of regional relevance” (D1) and “existing isolated industrial and craftwork settlements” (D3) were the most represented industrial land use types, while the “commercial zones of municipal/local or district relevance” (H2) were dominant in the commercial type. The planned zones D1, D3, and H2, covered altogether around 68% of the entire planned area.
As previously discussed, in order to reach a more accurate and detailed assessment of future land take, the soil-sealing percentage of D and H zones from the MMLDP was measured (
Table 7). This final analytical step was used to analyze the quantity and location of present and future imperviousness within the planning zones. The latter, in particular, estimated the residual areas and therefore allowed the quantity of soil at risk of being sealed in the next years for D and H land uses to be predicted for each province.
3.1. Gorizia Province
The total amount of land occupied by industrial use in Gorizia Province was 1345 ha, while the total amount for commercial uses totaled 256 ha (
Table 8), making 1601 ha for both functions. This analysis revealed that the residual area was about 328 ha, which was greater than the extension of land taken for the same uses registered between 1980 and 2000 (
Table 5). When comparing this result with the NHRLC data (see
Table 7), it was estimated that in future, the urbanization process will completely seal more than 206 ha of free soil.
3.2. Pordenone Province
The data in
Table 9 point out that the total amount of land occupied by industrial uses in the province of Pordenone was 4456 ha, while for commercial uses it was 583 ha, which together amounted to 5039 ha. The analysis of the residual area resulted in about 877 ha, which approximated the land taken for the same uses registered between 1980 and 2000 (see
Table 5). When comparing this result with the NHRLC data (see
Table 7) it was estimated that future urbanization will completely seal more than 540 ha of free soil.
3.3. Trieste Province
The overall industrial land (
Table 10) in the province of Trieste was equal to 821 ha, with 83 ha for commercial uses; together, these functions covered 904 ha. The total residual area was about 43, ha which was less than the land taken for the same uses registered between 1980 and 2000 (see
Table 5), but it was noted that this province has several constraints due to its complex landform. This result, combined with the NHRLC data (see
Table 7), allowed estimation of a future urbanization process that will completely seal more than 27 ha of free soil.
3.4. Udine Province
The territory of Udine province had 8603 ha of industrial and commercial planned land use as a whole (
Table 11), most of which were industrial areas (7450 ha), while the diverse commercial types showed a total amount of 1153 ha. The analysis of the residual areas for both industrial and commercial uses pointed out about 2632 ha of undeveloped area that, consequently, amounted to twice as much as the consumption for the same land uses registered between 1980 and 2000 (see
Table 5). When comparing this extent with the NHRLC data (see
Table 7), the resulting estimate showed that if all industrial and commercial planning zones were built on in the future, urbanization would seal more than 1435 ha of free soil.
4. Discussion
The historical land take trends in FVG between 1980 and 2000 highlighted that the expansion of urban areas, with the resulting land take, and the contraction of agricultural areas were the most relevant spatial changes in the time frame of the analysis. In particular, another factor contributing to the loss of agricultural land is the increase of woodland in mountain areas due to the abandonment of agriculture and the crisis of the livestock sector in the uplands.
The increase of artificial areas was also dependent on a considerable contribution of the industrial and commercial land uses due, especially in the first decade, to the economic development that followed the disastrous earthquake that hit the FVG region in the year 1976.
The analysis of the mosaic of the municipal local development plans for the FVG regional territory showed that the amount of land designated for urban transformation into commercial and productive uses in the next years (residual areas at present) exceeded the quantity of land that had been transformed in the recent past (historical trend 1980–2000).
Analysis of the residual areas showed that the portion of the total amount of planned industrial and commercial land use (15,966 ha) that remains undeveloped is 3881 ha—specifically, 3412 ha for industrial uses and 469 ha for commercial uses.
This means that in the upcoming years, the residual areas for industrial and commercial uses will take more land than the amount taken for the same uses in the past (2499 ha, see
Table 6), achieving an overall artificialization that will maintain FVG in the top ranks of land take.
Moreover, it was estimated that the land take process will cover a quantity of 2210 ha with impervious materials (soil sealing), which is about 50% of the total extension of residual areas designated for transformation (planned land take). This distinction (land take vs. soil sealing) is fundamental to determining the precise amount of land that will be affected by a permanent alteration of soil properties, with the associated well-known effects on soil ecosystem services, hydrological cycle, and biodiversity. Finally, considering that land take planning provisions are largely affected by economic, political, and social dynamics, the upcoming urbanization will mostly seal the plain-area and most fertile soil of FVG, maintaining a process that threatens the primary productivity of the agricultural sector and its related landscape character.
If specific laws do not consider the MLDP residual building capacity, the large stock of undeveloped industrial and commercial areas will likely remain so, despite the economic crisis of the real estate sector and, specifically, the fall in demand for industrial and commercial buildings, which is partly due to an oversupply of productive sites and built-up surfaces. As a consequence, the application of policies against land take will fail to address the goal of “no net land take by 2050” [
25], even though this target was specified in Art. 1 of the Regional Law n. 21 of 25 September 2015 on land take limitation (LR 21/2015).
The recently introduced Regional Law n. 6 of 29 April 2019 entitled “Urgent measures to recover regional competitiveness”, which repealed the LR 21/2015 on land take limitation, did not consider at all the above mentioned aspects, and it ignored the peculiar quantity, distribution, form, and speed of a complex, difficult-to-govern phenomenon. These laws, rather than introducing normative policies to support municipalities in limiting land take by converting the undeveloped D and H zones back to agricultural land, do not recognize potential land take deriving from future development of the residual industrial and commercial areas. In addition, these normative policies allow for further expansion of settlements under certain conditions (see Art. 63 quinquiens of LR 21/2015).
This approach confirmed that the absence of a comprehensive law at a national level that establishes a guiding framework to limit land take produces local dichotomies. Indeed, in Italy, on one hand there are regions that are virtuously working to integrate the quantitative and qualitative knowledge of land use change processes into a disciplinary codified approach, aimed at blocking further unnecessary development (see the Regional Law on land take limitation of Emilia Romagna n. 24 of 21 December 2017). On the other side, there are regions that are ignoring all these conditions, allowing an inertial, but still continuing, process of land use alteration and landscape degradation.
The results of this research highlighted that virtuous laws of territorial governments are those that integrate a deep knowledge of past and current land use change dynamics into the political agenda of the regional council, fostering a real discussion on what is necessary to pragmatically govern urban transformations and their environmental and landscape effects.
A way to limit the land take process in FVG is to define qualitative soil indicators that allow for the establishment of general rules to apply limitation, mitigation, and compensation measures according to the quality of land and the character of the planned urban transformation. The overlap of the planned residual areas with land suitability maps, soil function maps [
40], or landscape and ecosystem service maps, designed to attain maximum efficiency in the selection of suitable sites for transformation, is considered to be a minimum required procedure that matches the need to define site-specific conditions that limit the impacts of the land take process.
Recent experience has demonstrated that land suitability maps can integrate multiple land indicators (e.g., land capability classification, habitat quality, altimetry, natural differentiated vegetation index) to define where, how, and on what terms land use alteration can be realized. The integration at a local level of land suitability indicators is seen as a good practice that should frame the existent strategic environmental assessment (SEA) of local plans and projects [
41,
42], avoiding additional and unnecessary bureaucratic environmental evaluation.
This procedure is based on criteria to evaluate the feasibility of urban transformations, by assuming that if a piece of land has a high qualitative value, it cannot be transformed at all (limitation). While if the transformation is feasible, the SEA determines whether the transformation is sufficiently ecologically balanced (mitigation) or if it is necessary to find another external site to counterbalance the negative impact of the urban transformation provided for in the local plan.
5. Conclusions
This manuscript represents a first attempt to present a comprehensive analysis of past, current, and future land use change due to urbanization in FVG, with specific attention to industrial and commercial sites that are treated, under particular conditions, by the LR 21/2015. In this study, it was made evident that the Friuli Venezia Giulia region has been affected by a huge conversion of agricultural land into urban land cover, which should be carefully considered in designing policies against land take, especially when considering that this process has evolved in the absence of an increase in population since the 50s. In addition, the analyses highlighted that the past trend concerning industrial and commercial sites in particular has consumed less soil than it could consume in the near future if specific action by the regional political governance does not aim to cut down undeveloped residual planned transformations of MLDPs.
To this end, we suggested in the discussion section some measures aiming to achieve in practice the “No net land take” target by 2050. In the first instance, it is recommended that virtuous policies be enacted to allow municipalities to return undeveloped residual areas to agricultural land with a legislative reform following the example of Emilia Romagna. Secondly, it was proposed that the existing procedure of strategic environmental assessment be integrated with land suitability maps to evaluate the feasibility of each land use alteration (not only industrial and commercial sites) and to define how to limit, mitigate, or compensate for land take.
The coupled introduction of the above-mentioned measures is envisaged as a minimum required standard procedure aimed at bridging the gap that divides the scientific knowledge on land use change and the practical development of local plans and projects, which is indifferent to the contingent environmental problems of land take.
Some final conclusive remarks are devoted to highlighting that land take reduction and the regeneration of the existing built-up stock is highly influenced by the quantity and quality of spatial data that the local, provincial, and regional authorities can manage during decision-making processes. The FVG case demonstrates that often the lack of land use / land cover data, residual areas, soil properties, sealing rates or contamination represents an effective limit to sustainable long term policies.
The introduction of legislative reforms for land take limitation should also take into account that a huge amount of residual area is unnecessary due to the decreased demand for these spaces, and so it is expected that these residual areas will remain undeveloped for many years. This will lead to the introduction at the national level of fiscal regulations that prevent private owners from maintaining long-term building rights to undeveloped land parcels. The introduction of a decaying term for the private building right in MLDP, coupled with a land use taxation system based on the assessment of land quality, is considered to be essential in reforming the regional agenda towards more sustainable and virtuous territorial government processes.


