Article

The Effects of Rainfall Runoff Pollutants on Plant Physiology in a Bioretention System Based on Pilot Experiments

1
Key Laboratory of Urban Stormwater System and Water Environment, Ministry of Education, Beijing University of Civil Engineering and Architecture, Beijing 100044, China
2
Beijing Advanced Innovation Center of Urban Design for Future Cities, Beijing 100044, China
3
State Key Laboratory of Water Environment Simulation, School of Environment, Beijing Normal University, Beijing 100875, China
4
National Demonstration Center for Experimental Water Environment Education (Beijing University of Civil Engineering and Architecture), Beijing 100044, China
*
Author to whom correspondence should be addressed.
Sustainability 2019, 11(22), 6402; https://doi.org/10.3390/su11226402
Submission received: 19 September 2019 / Revised: 12 November 2019 / Accepted: 12 November 2019 / Published: 14 November 2019
(This article belongs to the Section Environmental Sustainability and Applications)

Abstract

:
Bioretention facilities have been widely used in the construction of Sponge City in China, but there have also been doubts about whether road runoff pollutants have adverse effects on plant growth. In response to this problem, this paper explored the effects of bioretention on the removal of pollutants and explored the effects of runoff on plant growth and physiology. The results showed that (1) the average concentration reduction rate and load removal rate of TN and NO3--N were above 70%, the average NH4+-N concentration reduction rate and load removal rate were greater than 90%, and the removal of elemental N was affected by the influent concentration. The removal effect of the four heavy metals was not very great. The average concentration reduction rate and load removal rate of heavy metals were 65.4–95.7% and 85.4–99.4%, respectively. The cumulative load removal rate of various pollutants was above 87.0%. (2) The runoff of high–concentration pollutants had a negative or no significant effects on the net photosynthesis rates (Pn), chlorophyll contents (CC), and electrolyte leakage (EL) of most plants (e.g., Iris tectorum Maxim, Rosa xanthina Lindl, and Ligustrum vicaryi). It had a significantly negative effect on the plant height of shrub plants (e.g., Rosa xanthina Lindl and Ligustrum vicaryi), but had a positive effect on Pn and CC of Iris lactea var. chinensis. (3) The runoff of low–concentration pollutants had a positive or no significant effects on the physiological indexes of herbaceous plants (e.g., Iris tectorum Maxim and Iris lactea var. chinensis), but there were no explicit conclusions regarding the physiological indicators of shrub plants (e.g., Rosa xanthina Lindl and Ligustrum vicaryi). It had no obvious effects on the plant height of these four species of plants.

1. Introduction

With the continuous advancement of urbanization, the drastic increase in impervious area has caused a significant decrease in the amount of rainwater infiltration. Stormwater runoff has exerted tremendous pressure on municipal drainage facilities. At the same time, the pollutants trapped by stormwater runoff on impervious ground have also become an important contributor of nonpoint source pollution of surface water. Currently, rainfall runoff pollution is one of the most pressing water quality challenges, as nonpoint source pollution is more difficult to control than point source pollution [1,2].
In China, the term “Sponge City” has been widely used since 2013 to describe a new paradigm in urban drainage planning and design. The use of low-impact development (LID) and best management practices (BMPs) is promoted, and impervious city surfaces are built or retrofitted to allow infiltration, evaporation, storage, and so on, which essentially allows cities to act as a sponge [3]. Bioretention has been an important measure during the construction of “Sponge City” in China. Bioretention facilities are increasingly regarded as sustainable rainwater control measures because of their effects in reducing runoff pollution, total surface runoff, and peak flows. Bioretention facilities act as in situ runoff water purification facilities [4] that purify runoff through physical (filtration, evaporation), chemical (adsorption, ion exchange, and precipitation), and biological (phytoremediation, microbial action) means [5,6,7]. At the same time, the filter media can retain and slowly release rainwater into the soil through infiltration or drainpipes, thereby reducing the peak runoff and reducing the drainage pressure on municipal facilities.
Plants play an important role in maintaining the purification effect of bioretention [8,9]. Plants can directly remove nutrients from rainwater by absorbing pollutants [10,11] and can indirectly maintain the effects by altering the physicochemical properties of soil abiotic components and soil microbial activity, e.g., via oxygenation of the rhizosphere. In addition, the growth of plant roots affects the porosity and permeability of the growing media [12], thereby affecting the time of contact between the runoff pollutants and the growing media [13]. Studies have shown that plants play a vital role in the removal of particulate matter and N [14,15]. Read et al. [16] showed that plants in eastern Australia effectively removed the nutrients from runoff. Lucas and Greenway [17] also indicated that plant systems play the most important role in the removal of nitrate nitrogen (NO3--N). Plants can also directly absorb metals, and their root activities can also affect the growing media organic matter content and pH, which indirectly affects the shape and migration ability of metals [18,19]. Plants contribute as much as 10% to metal removal by direct absorption [20,21]. However, studies have also shown that the contribution of plants often differs greatly depending on the plant species [15,22]. Planting several plant species into one bioretention facility may increase the removal rate of runoff pollutants. Wu et al. [23] showed that planting two species of plants had greater ammonia nitrogen (NH4+-N), nitrate nitrogen (NO3--N), and total phosphorus (TP) bioretention removal effects than planting a single species of plant, while plant health, adapting well to the environment, and proper combinations also played a positive role in prolonging the life of bioretention [24]. Therefore, it is necessary to further explore the effect of various plant combinations on the removal of runoff pollutants.
However, the suitability of plants in bioretention depends not only on their ability to remove pollutants but also on their ability to withstand pollutants [14]. The plants in bioretention facilities may be affected by flooding and pollution, and even nutrients (e.g., N and P) may have negative impact on the growth of plants that have adapted to low–nutrient soils [15]. However, there have been few studies exploring this aspect. In a study on the antifouling abilities of 20 typical bioretention plants, Read et al. [15] indicated that rainwater did not significantly affect the growth and biomass of the plants, but there were still large differences between species. Zanin et al. [11] conducted on-site monitoring of 11 plant species in the bioretention facilities at Agripolis Campus of the University of Padova, and the survival rate of the plants that were planted in filler was greater than 90%. The inflow water quality, volume, and time interval of bioretention facilities may involve significant uncertainty, and their influences on plant growth need to be studied.
In recent years, the construction of “Sponge City” has been advancing in an orderly manner, but there are still doubts as to whether road runoff pollutants will adversely affect plant growth in bioretention facilities. Some thought that the pollutants presented in road runoff would poison plants, or that road runoff would drown the plants. In this study, three rainfall types, two rainfall frequencies, and two influent concentrations were designed. The aim was to determine whether road runoff (water quality, frequency, and water volume) has adverse effects on plant growth and physiology. The other aim was to study the removal of pollutants from a bioretention system planted with various plant species.

2. Materials and Methods

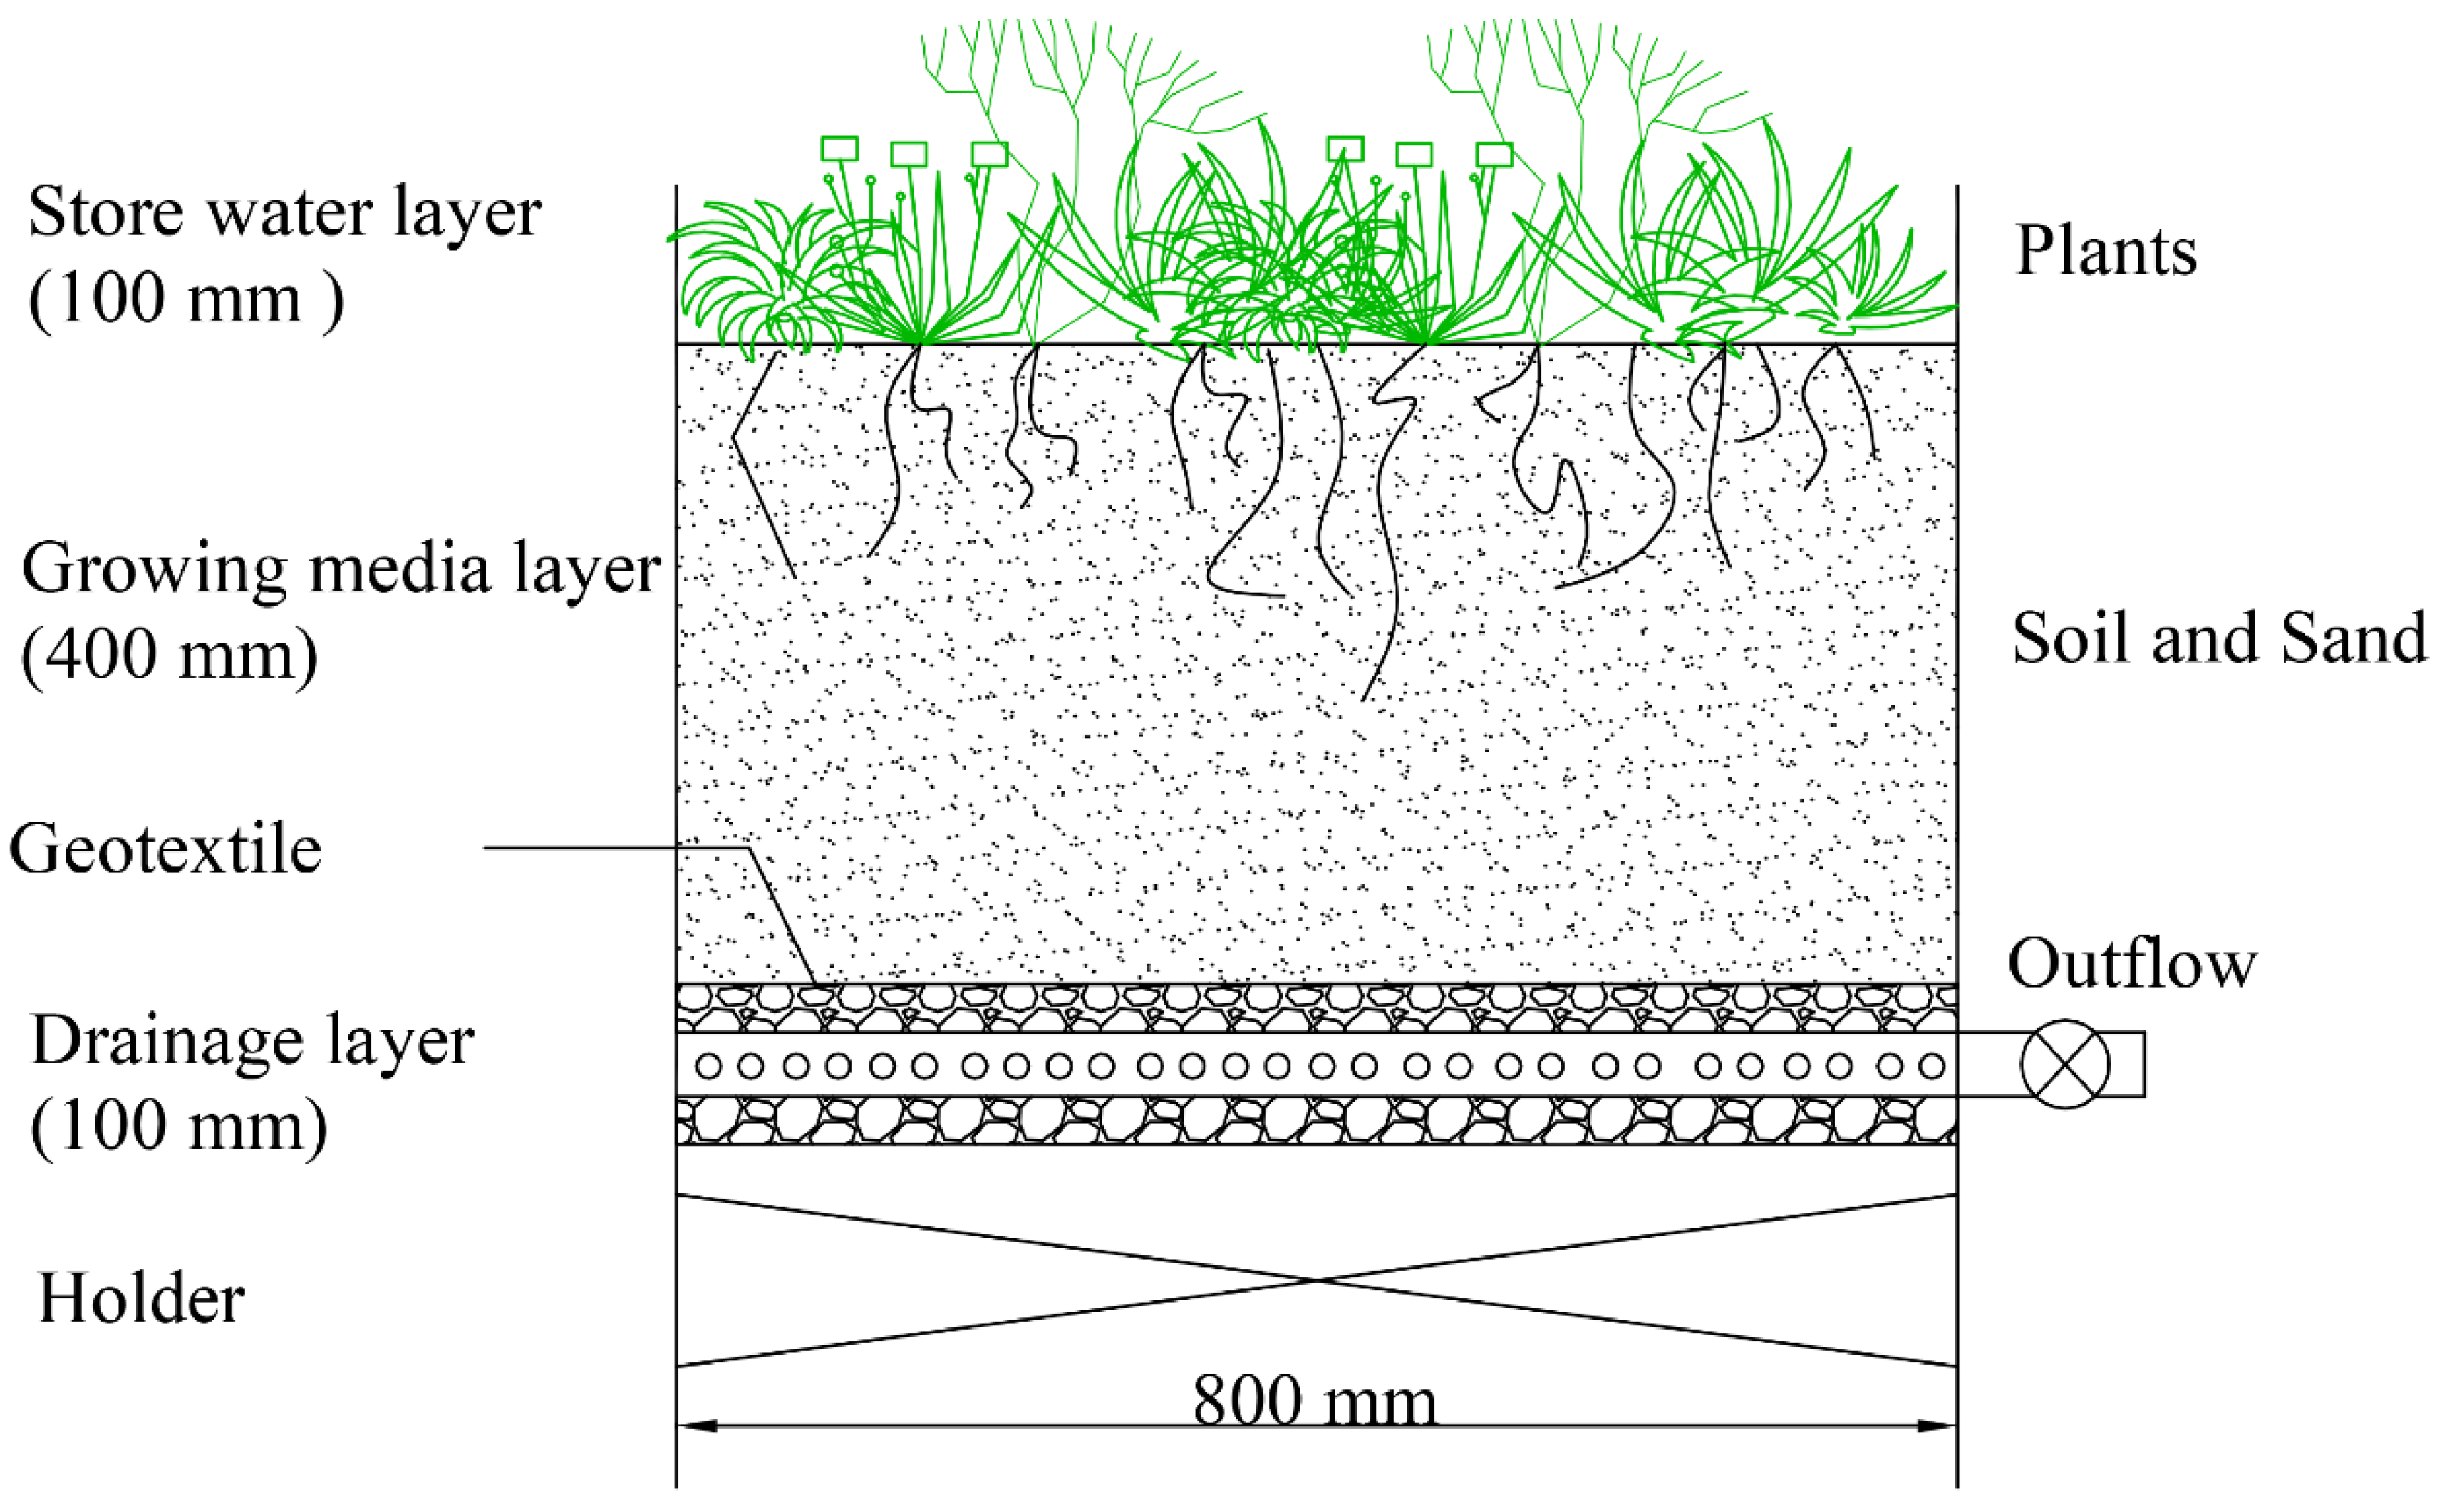
2.1. Bioretention System Design

Three experimental devices were designed for this study. The devices were box structures and were made of PVC boards. Their height was 600 mm. The length and width were both 800 mm. The structure is shown in Figure 1. The system was built as a traditional bioretention system.
The drainage layer at the bottom of the bioretention was composed entirely of gravel that was 100 mm thick with a diameter of approximately 10 mm, and the layer contained a perforated blind pipe with a diameter of 50 mm that served as a drainpipe. The growing media layer was 400 mm thick. Geotextile was placed between the growing media layer and the drainage layer to prevent the media from passing into the drainage layer. The store water layer was 100 mm deep.
The selected growing layer media was the local topsoil and sand combination in engineering, and its volume ratio was 4:6. After hydraulic compaction, the saturation infiltration coefficient of the media was tested. The coefficient was 110 mm/h, which satisfied the recommended range of 50–200 mm/h for Australia [25], at least 12.5 mm/h for the USA and New Zealand [26,27], and between 36 and 360 mm/h in Austria [28].
After investigating the typical plants on the main road of the Beijing “Sponge City” pilot area, two species of shrubs (Ligustrum vicaryi and Rosa xanthina Lindl) and two herbaceous plants (Iris tectorum Maxim and Iris lactea var. chinensis) were chosen as the study plants. The four species are perennial, with relatively well-developed roots, and they have high drought tolerance and water-flooding properties, as well as high ornamental value.
In May 2018, three bioretention facilities were constructed outside on the campus of Beijing University of Civil Engineering and Architecture (N39°45’1.47′′, E116°16′56.85′′): SS-L and SS-H were the experimental groups, and SS-T was the control group. The influent of the experimental groups was artificially simulated road runoff. The influent of SS-H, SS-L, and SS-T was high–concentration road runoff, low–concentration road runoff, and tap water, respectively. SS refers to mixed topsoil and sand in the growing media layer. There were four species of plants in each experimental device, and each species had 6–8 plants.

2.2. Experimental Procedures

In accordance with the water quality measurements of typical urban road runoff in Beijing [29], the dissolved nutrients and heavy metals in stormwater were the focus of this study. The temporal and spatial distribution of urban road runoff pollution often varies dramatically, and bioretention facilities are usually used to treat initial runoff. Therefore, special high pollution levels were set in this study. Road runoff was simulated by adding an analytically pure chemical to tap water for 24 h to achieve the designed pollutant concentration. The low–concentration inflow was based on the actual water quality of road runoff in Beijing, and the high–concentration runoff was twice the value of the low–concentration runoff. However, the test concentration and design value had some differences. Table 1 shows the actual mean test values of the influent.
In Beijing’s 30-year rainfall data from 1983 to 2012, a total of 793 rainfall events were recorded, while rainfall events with a depth less than 2.0 mm were not considered. The rainfall types of light rain, moderate rain, heavy rain, and rainstorm are defined according to the 24-h rainfall depth. Their ratios were 48.3%, 27.6%, 15.6%, and 8.4% for the 793 rainfall events, respectively. Their average rainfall depths were 5.1, 16.0, 34.2, and 78.2 mm, respectively (Table 2).
According to the Code for Planting Planning and Design on Urban Roads of China, the green rate of roads with a boundary line width greater than 50 m should not be less than 30%. Therefore, the catchment area to bioretention facility area was set to 3:1 in this study. The effective storage depth was 100 mm, and overflow discharge would occur when rainfall exceeded 33.3 mm. Therefore, for heavy rain and rainstorm events, the designed rainfall depths were all set to 33.3 mm. The simulated rainfall event times for different rainfall types were determined by the statistical ratio of light rain:moderate rain:heavy rain/rainstorms, which was 48.3:27.6:24.0 (about 2:1:1). The experiment was carried out for four rounds. For each round, the sequence of rainfall types was moderate rain, light rain, light rain, and heavy rain/rainstorms, and the inflow was 34, 11, 11, and 64 L, respectively.
In addition, according to the statistical results, the average interval between rainfall events in the wet season (June–August) was about four days in Beijing, and accordingly the number of water inlet intervals of the simulation was four days. Another set of water inlet intervals was 10 days, which was based on rainfall statistics from September to October. In order to quantitatively control the inflow to the devices, the influence of natural rainfall on the devices should be eliminated. The devices were covered with a rainproof cloth before natural rainfall events started, and were uncovered when the rain ended.

2.3. Sampling and Analyzing Methods

2.3.1. Effluent Collection and Testing

Plants were planted in each bioretention facility in May 2018, with 6–8 plants per species. The background sampling analysis of plant physiology was performed at the end of July 2018. From July to November 2018, there were 16 sessions of simulated rainfall runoff inflow. The effluent of the experimental group was sampled and tested. The effluent from each device was collected separately, and its volume and the average water quality were tested. The water quality analysis was carried out in the laboratory in accordance with the standard methods [30].

2.3.2. Plant Sample Collection and Testing

In this study, the plant physiological indexes tested were the net photosynthetic rate (Pn, µmol CO2/m2s), chlorophyll content (CC, mg/g), and electrolyte leakage (EL, %). Photosynthesis is a physiological process in which plants are most susceptible to environmental influences during growth. Chlorophyll is also an important physiological indicator of plants, and its content directly affects the normal metabolism of plants. When a plant is subjected to pollutant stress, the selective permeability of the cell membrane system is impaired, the membrane permeability increases, and some soluble substances in the cell are extravasated. The EL is an indicator that reflects the permeation performance of the plant membrane system.
The plants were selected from the same batch of plants in the same nursery base. There were no significant differences in the plants’ heights and fresh weights at the initial stage of planting. The plant height was measured before the beginning of winter, and each device and the highest five strains of each plant were selected for measurement. About every 20 days, the Pn, CC, and EL were measured. A total of five tests were performed, of which the first measurement was the background value before the experiment. The upper, middle, and lower parts of each plant were selected for each leaf. Then the upper, middle, and lower leaves were mixed separately. Two pieces of leaves were taken from each mixture separately to test the net photosynthesis rate (Pn), and the final test results were the average of the six samples. After testing Pn, all samples were mixed, and the CC and EL test values were measured.
A closed portable infrared gas analysis (IRGA) system (LI-6400 Portable Photosynthesis System, LI-COR, Lincoln, NE, USA) was used to determine the Pn. The measurements were carried out between 9 a.m. and 11 a.m. To test the chlorophyll, fresh leaves were cut to increase the surface area of the tissue exposed to the extractant, and 0.08–0.1 g of a sample was weighed in a centrifuge tube (the specific mass was recorded). Eight milliliters of ethanol (95%) were used as an extractant, and the samples were stored in a dark environment at 4 °C for two days. The extractant was measured for absorbances at 649 nm and 665 nm, and the CC was converted according to the Sartory and Grobbelaar [31] and Arnon [32] methods. The Lutts et al. [33] method was used for the EL testing, and some improvements were made to the method. Firstly, fresh leaves were cut into 1-cm-long pieces and 0.1-g pieces were placed in test tubes. Secondly, 25 mL of distilled water was added to the test tube, the mixture was cultured in a closed environment at a temperature of 20–25 °C for 24 h, and the electrical conductivity was measured. Thirdly, the tube was resealed, a vent was created with a toothpick, and the tube was placed in a water bath for 30 min. Fourthly, the tube was cooled to room temperature (20–25 °C) to determine the boiling conductivity. The ratio of the two conductivity values was the value of EL.

2.4. Data Analysis

Statistical analysis was performed using SPSS 22.0 (IBM, Chicago, IL, USA). Variance analysis was used to analyze the differences in the effects of different treatments on the effluent quality, plant growth and physiological indicators (p < 0.05). The mapping was performed using Origin 8.5 (OriginLab, Hampton, MA, USA).
The concentration reduction rate (CRR), volume retention rate (VRR), mass removal rate (MRR), and cumulative pollutant load removal rate (CLRR) of the bioretention system are as follows:
CRR = C i n , i     C o u t , i C i n , i
VRR = V i n , i     V o u t , i V i n , i
MRR = C i n , i   × V i n , i     C o u t , i   × V o u t , i C i n , i   ×   V i n , i  
CLRR = ( 1 i = 1 n C o u t , i ×   V o u t , i i = 1 n C i n , i ×   V i n , i )   × 100 %
C i n , i , C o u t , i indicates the i-th water inflow and the effluent concentration, respectively. V i n , i ,   V o u t , i represents the i-th inlet and outlet volume, respectively. n indicates the number of experiments, 16. Equations (2)–(4) only calculate the removal rates based on the simulated inflow, neglecting the fact that untreated overland flows for heavy rain/rainstorms would also contribute to the outflow, pollutant mass, and overall load. Therefore, the calculated VRR, MRR, and CLRR values are higher than the actual drainage.

3. Results and Discussion

3.1. Effects of Bioretention

3.1.1. Retention and Pollutant Removal Effect

For the 5.1-mm simulated rainfall events, there was no effluent in any device, and runoff was retained in the system. For the 16.0 mm and 33.3 mm simulated rainfall events, the average VRRs of the devices were 55.3 ± 24.0% and 53.8 ± 6.2%, respectively, which was similar to the results of previous studies [22,34,35]. The VRR of 16.0 mm was slightly larger than that of 33.3 mm, and the two sets of VRRs did not reach the level of statistically significant difference (p > 0.05). Moreover, the VRR had relatively larger fluctuation for the 16 mm simulated rainfall events. This result may be because of water absorption by media particles in the growing media layer, which was not saturated, and therefore, subsequent VRR measurements are often more susceptible to the influences of temperature and dry period. To increase the VRR, some researchers set an elbow at the bottom of bioretention systems to create a storage area. While the VRR of traditional bioretention was 78%, the VRR with a water storage area could reach 99% under the same hydrological conditions, and the number of overflows was noticeably reduced [7].
Table 3 shows the outflow concentration and pollutant reduction effect of each device. Different influent concentrations result in differences in the N effluent concentration, CRR and MRR (p < 0.05, n = 8). A low–concentration influent is more favorable to the reduction in pollutants than the high–concentration influent, which also indicates that the bioretention system does not have a good ability to resist the concentration load impact on elemental N. Compared with NO3--N and TN, the removal effect of NH4+-N was the best, with an average CRR of more than 90% and an average MRR of more than 95%. The CRR of the NO3--N and TN concentrations were better than those of several existing studies [36,37,38]. This may be due to the variety of plants and acceptable planting density used in this study [11].
Bioretention had a high removal effect on Zn and Cd. For Zn, the average CRR and average MRR of each device were greater than 95% and had good stability, and the maximum effluent concentration was only 0.46 mg/L. For Cd, the average CRR and average MRR of each device were above 75% and 89%, but the CRR fluctuated greatly (maximum 99.1%, minimum 16.7%), and 30% (SS-L), 40% (SS-H) of the effluent was lower than the World Health Organization (WHO) standard for drinking water quality (3 µg/L). The inflow concentration had a great influence on the removal of Cu, which resulted in the difference of CRR and MRR between the two groups (p < 0.05), but the Cu concentration of each device effluent was lower than the WHO water quality criterion (2.0 mg/L). For Pb, the CRR and MRR were lower than those of the other three kinds of metals, and only 50% (SS-L) and 60% (SS-H) of the Pb effluent concentrations met the WHO water quality criterion (10 µg/L). All four heavy metals had better reduction effects in the high–concentration influent, which was similar to the results of Liu et al. [18]. In the Lim et al. [39] study, Cu and Pb were also less effective than Cd and Zn, but their bioretention system was filled with coconut coir and soil. In this study, although the bioretention system had a high plant abundance and planting density, the heavy metal reduction was not very high compared to the results of existing studies [39,40]. Studies have shown that the appropriate addition of submerged organic carbon sources in bioretention systems can effectively remove nutrients and heavy metals, especially Cu [19,40].

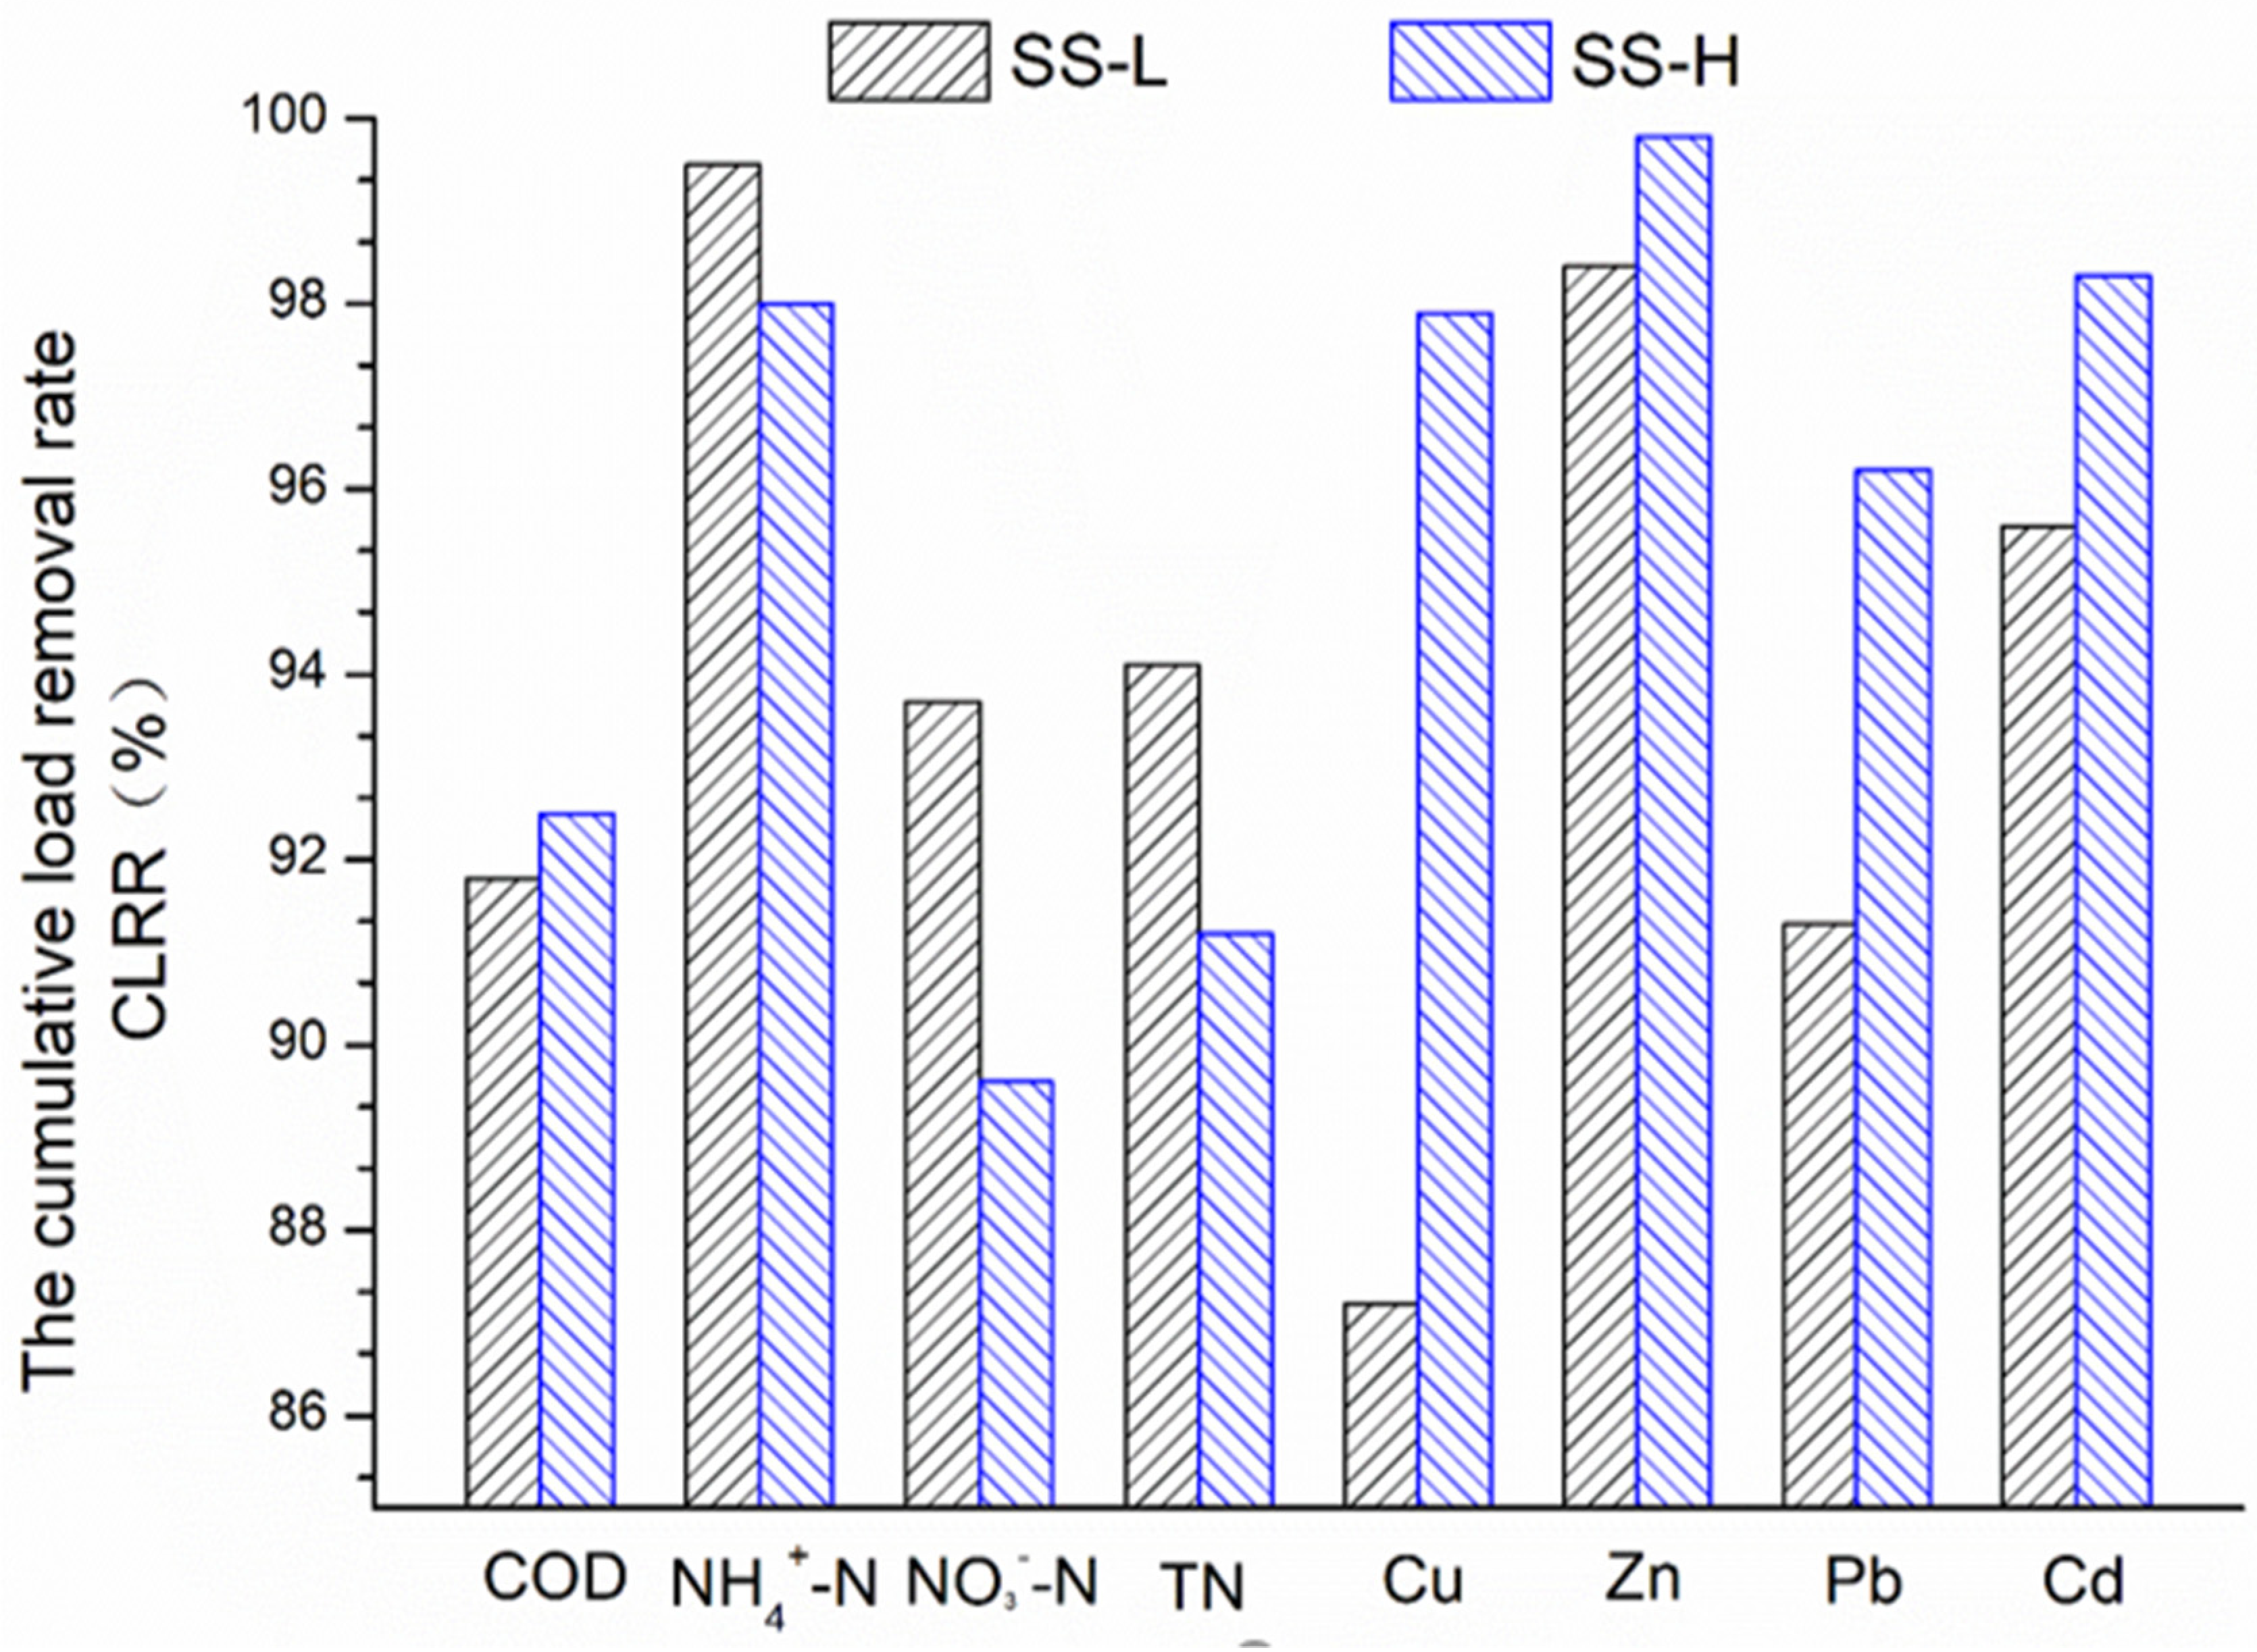
3.1.2. Cumulative Load Removal Rate of the Contaminants (CLRR)

The CLRR of the pollutants is shown in Figure 2. In the SS-L, Cu had the lowest CLRR, 87.2%, and the CLRR of the remaining pollutants was more than 90%, of which the CLRR of NH4+-N even reached 99.5%. In the SS-H, the CLRR of NO3--N was 89.6%, and the CLRR of the remaining pollutants was more than 91%, of which the CLRR of Zn even reached 99.8%.
Bioretention has a sufficient ability to remove heavy metals, and media adsorption often plays a major role [39]. The adsorption effect was relatively fast, and the adsorption sites could quickly adsorb pollutants; as a result, the CLRR of the high–concentration runoff as the water source was higher than that of the low–concentration runoff. On the other hand, N had a higher CLRR for the low–concentration runoff, which may be due to the biochemical reactions of plants and microorganisms required by the system to consume N. The process was relatively slow; as a result, the system was unable to consume the N trapped in the system in time, resulting in a higher CLRR of N in the low–concentration influent.
At the same time, the simulated runoff of 5.1 mm was retained in the device, and as a result, the MRR of pollutants under this rain intensity was 100%; thus, increasing the number of light rain simulations will continuously improve the CLRR of the device. In the actual rainfall process, the higher the frequency of light rain and the proportion of annual rainfall, the more conducive the system is for removing the pollutant load.
However, selecting 3:1 as the drainage:bioretention area might reduce the catchment area ratio, compared to conventional recommendations. It could result in a potentially significant reduction in the loads that the experimental bioretention areas are subjected to. When conducting similar research, those with a much higher catchment area ratio should be aware of this limitation.

3.2. The Effect of Road Runoff on Plant Growth and Physiological Indexes

3.2.1. Plant Height

The plant height statistics were determined in November, and the heights of various plants are shown in Figure 3. For Iris tectorum Maxim and Iris lactea var. chinensis, there was no significant difference in the plant heights (p > 0.05, n = 5) between the experimental group and the control group. However, the heights of Ligustrum vicaryi and Rosa xanthina Lindl in the SS-H were significantly lower than those in the SS-L and SS-T (p < 0.05). However, there was no significant difference between the plant heights in the SS-L and SS-T (p > 0.05). The low–concentration road runoff and tap water had no significant effect on the heights of various plants; the high–concentration road runoff had a negative effect on the growth of Ligustrum vicaryi and Rosa xanthina Lindl but had no noticeable effect on the growth of Iris tectorum Maxim and Iris lactea var. chinensis.

3.2.2. Net Photosynthetic Rate

During the experiment, all the devices were placed outdoors and spaced 1 m apart to ensure that the natural conditions of the devices were the same. Before the plants were irrigated with polluted runoff, all devices were subjected to the same maintenance, but there were still differences in the plant physiological index background test.
In Figure 4, in the SS-L, the Pn of Iris tectorum Maxim fluctuated in the early stage, but there was an overall increasing trend; in the SS-H, there was a significant downward trend, and each time, the data difference reached a significant level (p < 0.05, n = 6). In the SS-T, the Pn of Iris tectorum Maxim was stable. At the same time, the ratio to the background level showed that the Pn of the Iris tectorum Maxim in the SS-L increased by nearly 120%, and the Pn in the SS-H decreased by nearly 60%, which was much different from the change degree of SS-T (32%). The high–concentration road runoff accelerated the decline of the Pn of Iris tectorum Maxim. However, the low–concentration road runoff increased the Pn of Iris tectorum Maxim. Similarly, with the change in season, the outdoor temperature decreased, and the Pn of Rosa xanthina Lindl with tap water and high–concentration road runoff steadily decreased. The fourth and fifth photosynthetic rate ratios showed that the later period with high–concentration runoff accelerated the decline in the photosynthetic rate, while overall, the low–concentration road runoff could maintain the original Pn of Rosa xanthina Lindl in the experimental stage.
For the experimental and control group, Iris lactea var. chinensis Pn showed a significant downward trend (p < 0.05). However, the ratios of the tap water group and low–concentration runoff group to the background level were similar, while the ratio of Pn with high–concentration runoff as the water source was higher than that with tap water and low–concentration runoff. Compared with tap water, high–concentration runoff as a water source could alleviate the decrease in the Iris lactea var. chinensis Pn. Compared with tap water, the effect of low–concentration runoff was not clear (the difference of proportion was less than 5% in the later period).
Except the significant decrease in the Pn between August and July (p < 0.05), the Pn of Ligustrum vicaryi in the experimental group and the control group in September to November changed little and decreased slightly. The difference in Pn between the SS-L and the SS-T was gradually smaller, and even in the later stage, the Pn of the SS-T was higher than that of the SS-L. The ratio of Pn to the background level in the control group was higher than the ratio of Pn to the background level in the experimental group, which showed that road runoff restrained the photosynthesis of Ligustrum vicaryi in the later stages of the experiment.
In this study, the effect of road runoff pollutants on plant photosynthesis was not the same. In addition to the different resistances of various plants to pollutants, this result may be due to the interaction between the pollutants themselves, e.g., the increase in Zn, Cu, Mg, and Ca in plants may be a defense against Cd toxicity [41], which may relieve the inhibition of photosynthesis.

3.2.3. Plant Chlorophyll

The change trend of CC for Iris tectorum Maxim was similar to that of Pn (Figure 5). The CC in the SS-H showed a decreasing trend, decreasing to approximately 51.5% of the background level during the experiment; however, the CC in the SS-L and SS-T fluctuated, but the overall change was not significant. During the experiment, the CC in the SS-L was nearly 16.7% higher than the background level, while the SS-T decreased by nearly 19.9%. The velocity of chlorophyll decline was accelerated by using high–concentration road runoff as the water source for Iris tectorum Maxim, while low–concentration road runoff maintained and even increased the CC.
The CC of Iris lactea var. chinensis in each device showed similar trends; the process fluctuated, and there was an overall downward trend. During the experiment, the difference in the CC between the experimental group and the control group gradually decreased, and the CC of the SS-H even gradually exceeded that of the SS-T, and ration of CC to the background level in the SS-H was also higher than that in the other two groups, which showed that using high–concentration road runoff as the water source was helpful for relieving the CC decline. The ratio of CC with high–concentration runoff was higher than the ratio of CC with tap water, and the difference reached 28% in the experimental stage. The proportion of Iris lactea var. chinensis chlorophyll with low–concentration runoff was only 6.4% higher than that of Iris lactea var. chinensis chlorophyll with tap water. For Rosa xanthina Lindl, similar phenomena were shown only in the early stages of the experiment. This result may be because Rosa xanthina Lindl has better adaptability to road runoff. There was no clear chlorophyll change trend in the experimental group and the control group.
The CC of Ligustrum vicaryi fluctuated but increased. In particular, the CC of the SS-T increased significantly, reaching 180% of the background level on 14 November 2018. At the same time, the CC of the experimental group also increased at the end of the experiment, and the content was maintained between 120% and 145% of the background level. During the experiment, although the outdoor temperature decreased as the seasons changed, the overall CC of Ligustrum vicaryi continued to increase. The CC increase was slower when runoff was the influent water source than when tap water was used. The runoff was not conducive to the normal physiological changes in the CC of Ligustrum vicaryi.
In previous studies, heavy metals have often inhibited the CC of plants, and there is often a negative correlation between the concentration of heavy metals and the CC of plants when the content is greater than the self-regulating concentration; the higher the content, the faster the CC of plants decreases [42]. The results were not the same in this study, which may have been because a single variable was assessed: only the metal content was considered, and the experiment was mostly conducted at a constant temperature. However, the intent of this experiment was to simulate actual conditions. The experimental group contained not only heavy metals but also nitrogen, organic matter, and potassium, necessary for plant growth, resulting in some differences between the CC and change trend in our results and the previous research.

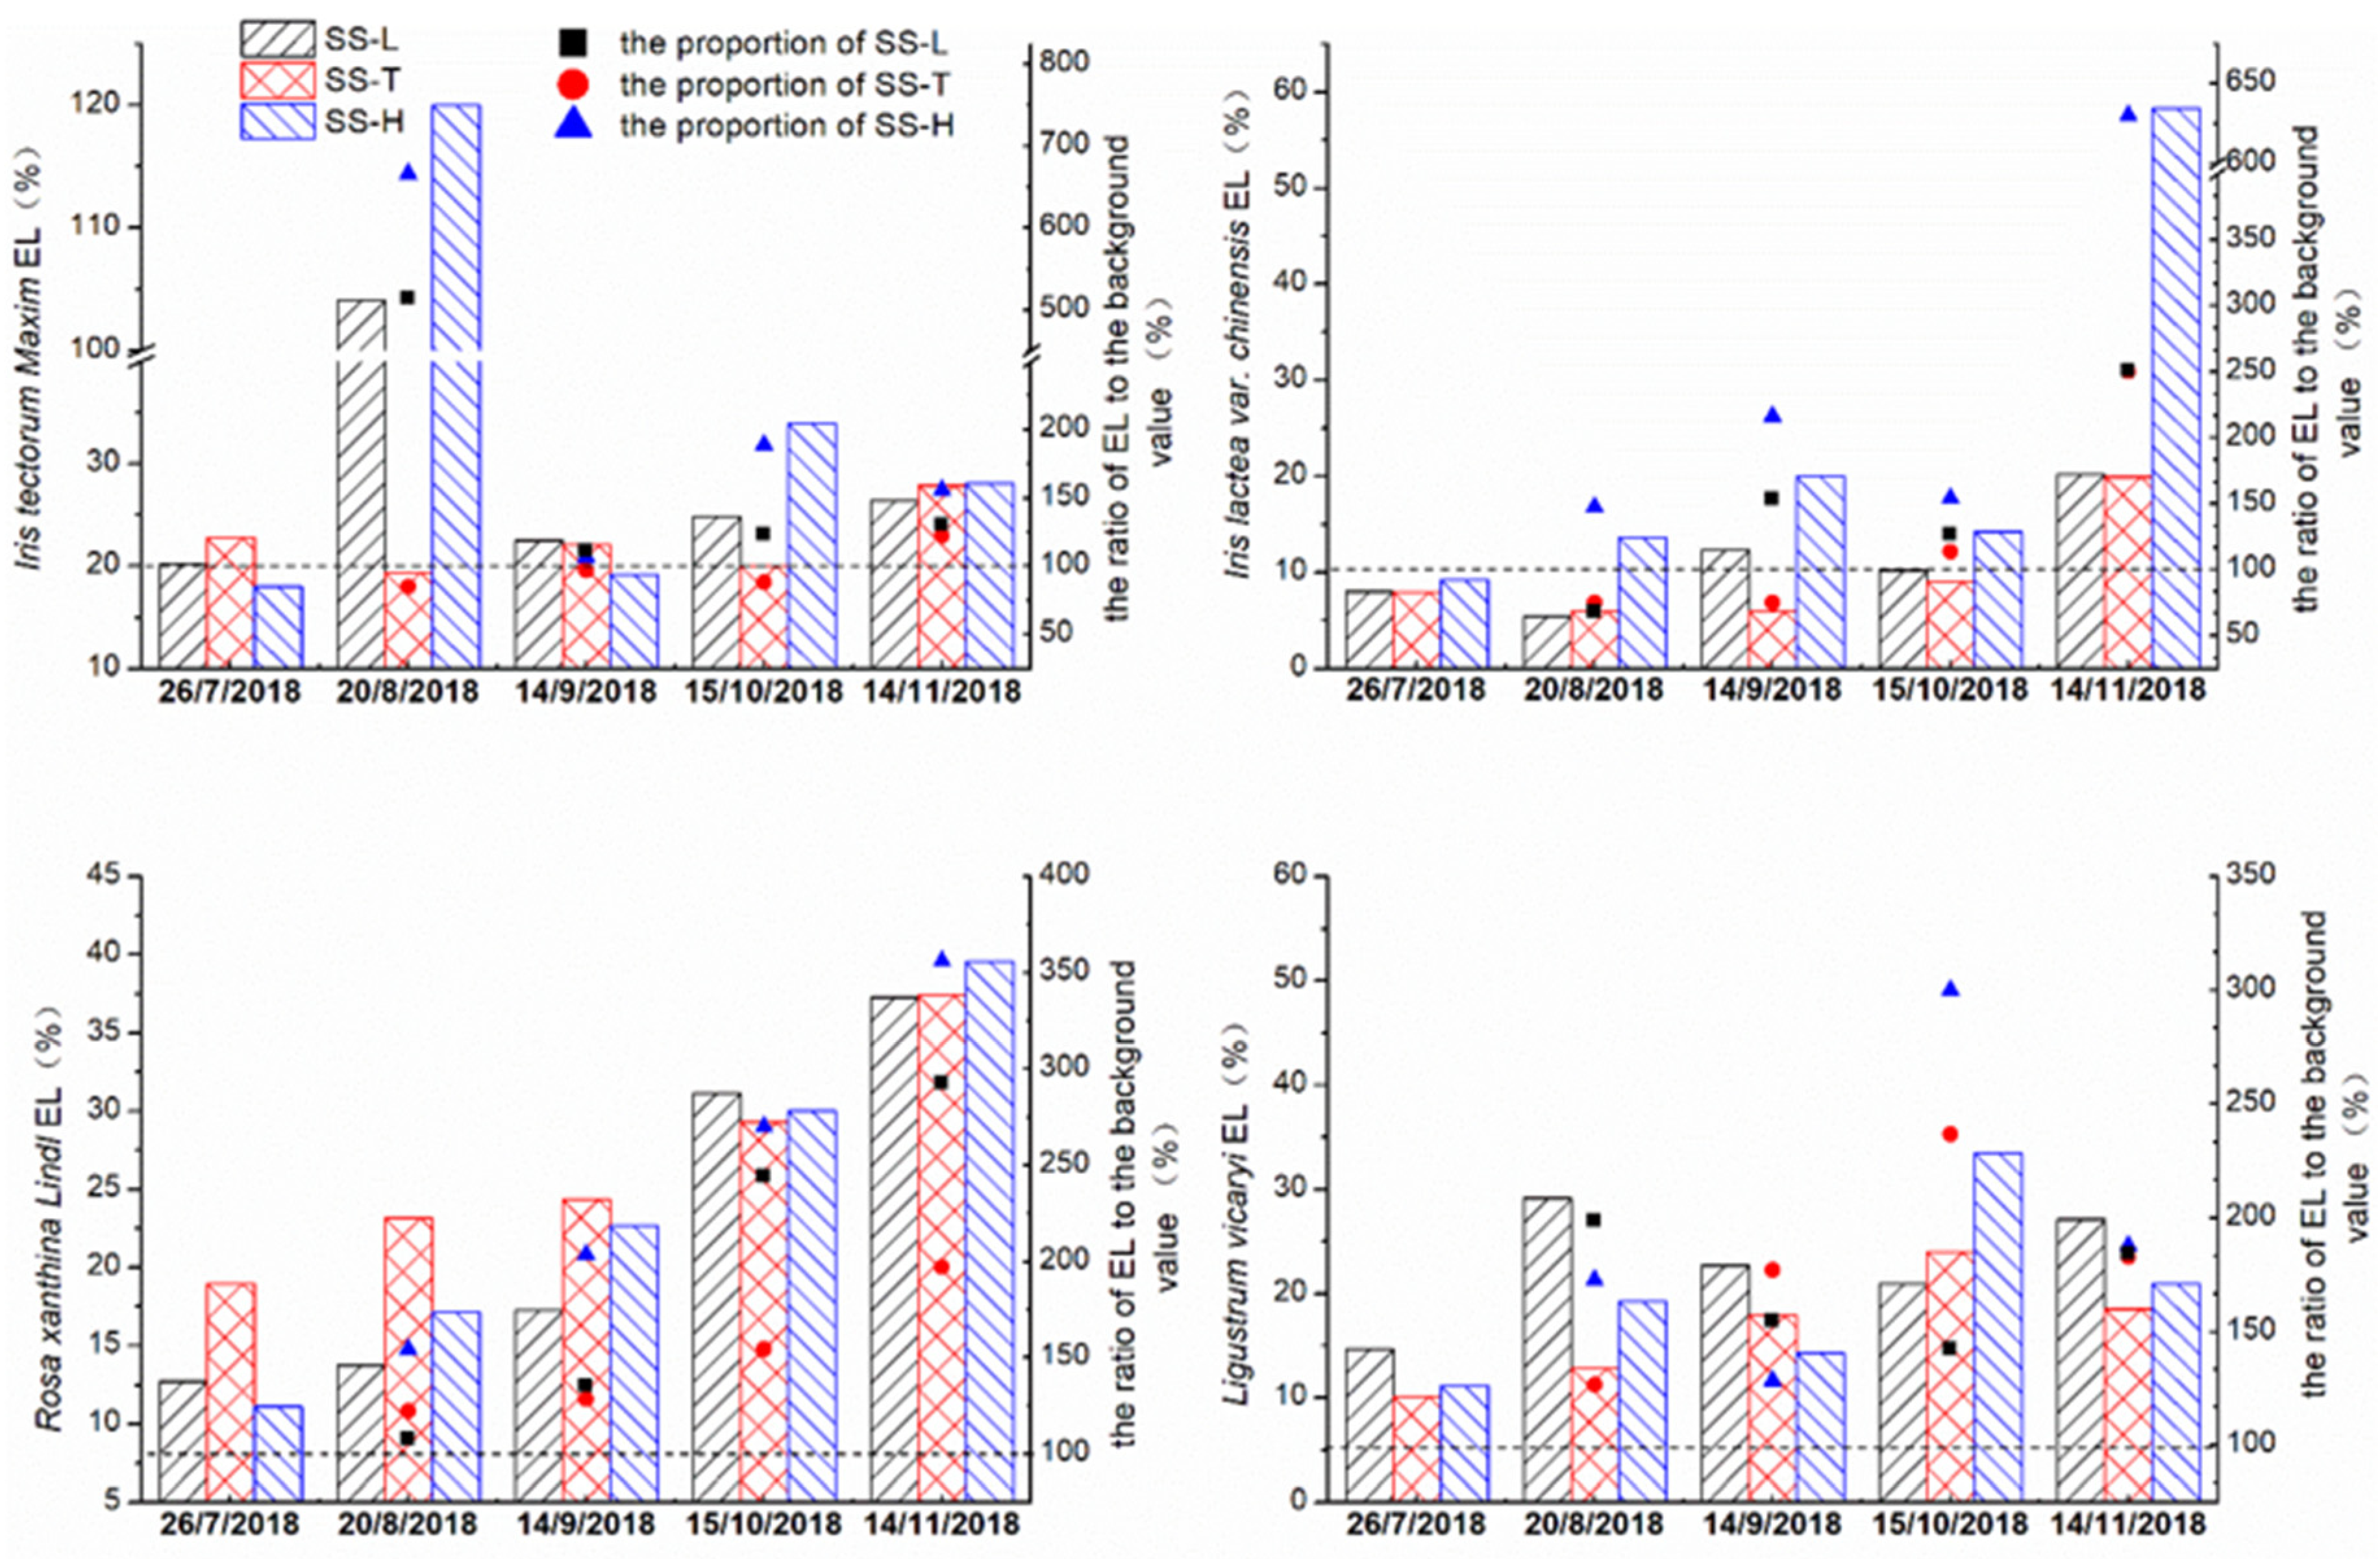
3.2.4. Electrolyte Leakage

In the early stage with road runoff as the inflow water source, the EL of Iris tectorum Maxim in the experimental group increased sharply; the EL reached 6–7 times the background level, and then Iris tectorum Maxim reduced the degree of electrolyte extravasation through self-regulation (Figure 6). A similar phenomenon occurred with Ligustrum vicaryi. The ELs of all the plants showed an upward trend, among which the growth proportion of electrolyte in the experimental group of Iris tectorum Maxim, Iris lactea var. chinensis and Rosa xanthina Lindl was steadily greater than that in the control group. This result shows that compared with tap water, road runoff as an inflow water source increased the EL in these three plants. From the ratio of each EL to the background level, the high–concentration road runoff led to a noticeable increase in the EL. The effects of the low–concentration road runoff and tap water on the ELs of the plants were not evident except Rosa xanthina Lindl. However, although the EL of Ligustrum vicaryi increased overall, the ratio of EL to the background level still varied, but the ratio tends to be similar at the end of the experiment. With the change in season, the electrolytes of Ligustrum vicaryi improved by using tap water and road runoff as the inflow water, but the differences in EL due to these two kinds of water sources were not clear.
Compared with tap water, the high–concentration road runoff exacerbated the degrees of electrolyte extravasation of Iris tectorum Maxim, Iris lactea var. chinensis, and Rosa xanthina Lindl. The effect of low–concentration runoff on Iris tectorum Maxim and Iris lactea var. chinensis was not evident, but the low–concentration runoff exacerbated the degree of electrolyte exudation of Rosa xanthina Lindl. This result was different from those of Zhao et al. [43] and Cakmak and Marschner [44]: low doses reduced and high concentrations increased the electrolyte extravasation of the membrane. There are three possible reasons. Firstly, the low–concentration of pollutants in the road runoff may have exceeded the capacity of plant regulation, and high concentrations may promote the formation of reactive oxygen radicals in plant leaves, resulting in cell membrane damage and increased membrane permeability [45]. Secondly, this study occurred in a natural environment, and the plant physiological changes were affected by temperature declines. Finally, during the application of runoff, the plant growth stage often also affects the change in membrane permeability.

3.2.5. Summary of Plant Growth and the Physiological Indicators

The general effects of road runoff on plant growth and physiology are listed in Table 4. During the experiment, road runoff had no significant effect on the plant heights of the herbaceous plants; only the high–concentration road runoff had a negative impact on the plant heights of the shrubs. Moreover, there was no yellowing, leaf spots, deformities, tissue necrosis, or wilting in the leaves of the plants. There was no difference in appearance, or it was impossible to distinguish whether the plants belonged to the experimental group or the control group.
Compared with tap water, low–concentration road runoff was helpful for the retention of the Iris tectorum Maxim Pn and CC, which was helpful for overcoming the natural decline in physiological indexes caused by external environmental changes; in contrast, the high–concentration road runoff exacerbated the decline in the Pn and CC. The high–concentration road runoff improved the Pn and CC maintenance of Iris lactea var. chinensis, while the low–concentration runoff and tap water had similar effects on the Pn and CC of Iris lactea var. chinensis. Compared with tap water, the low–concentration runoff improved the maintenance of the Pn of Rosa xanthina Lindl, while the high–concentration runoff exacerbated the decrease in the Pn. However, the influence of road runoff on the CC of Rosa xanthina Lindl was not noticeable. Compared with tap water, road runoff increased the Pn decline in Ligustrum vicaryi and inhibited the increase in CC. The high–concentration road runoff exacerbated the increase in EL of Iris tectorum Maxim, Iris lactea var. chinensis, and Rosa xanthina Lindl by damaging the selective transmittance of plant membranes. The low–concentration road runoff caused only the EL of Rosa xanthina Lindl to noticeably improve. Compared with tap water, the damage to the plant membranes of Ligustrum vicaryi due to road runoff was not obvious.
Low–concentration runoff pollutants had no effect or positive effects on the physiological indexes of herbaceous plants, but the effects were mostly negative or there was no effect on the shrubs. The effects of high–concentration runoff pollutants on the plant physiological indexes were mostly negative or unobvious but the high–concentration runoff also had a positive effect on the Pn and CC of Iris lactea var. chinensis. The difference in concentration had little effect on the Pn and CC of Ligustrum vicaryi, but the effect on the EL of Rosa xanthina Lindl was quite obvious. The high–concentration runoff pollutants inhibited the growth of some plants, but the concentration in the actual conditions was basically unaffected. Therefore, in the selection of plants for bioretention, the impact of pollution should indeed be considered.

4. Conclusions

Based on the Beijing rainfall data statistics for 1983 to 2012 and the water quality characteristics of Beijing roads, three rainfall types, two rainfall frequencies, two influent concentrations, and four typical plant species were used in this study. Local topsoil and sand were used as the filler in an engineered bioretention system to create a scenario that simulated actual rainfall and practical engineering applications. In this study, we obtained the following conclusions:
The bioretention system with four plants species removed N efficiently and stably; however, the removal of heavy metals was relatively more limited. A high abundance of plants may contribute to the direct absorption of nutrients, improves soil microbial activity and maintains the stability of bioretention systems but does not contribute measurably to the removal of heavy metals. A short contact time and an insufficient adsorption capacity for metal ions are important reasons for the low removal rate of heavy metals. In the subsequent research, a modified material may be added to the growing media layer to increase the adsorption capacity of metal ions while appropriately delaying the contact time between runoff and the media.
The positive or negative effects of road runoff on the various indicators of different plants were not the same, and there were clear interspecies differences. The high–concentration runoff pollutants had a nonpositive effect on most plant physiological process; however, the low–concentration runoff pollutants had a nonnegative effect on the herb physiologies but different effects on the shrub physiological indexes.
The high–concentration runoff pollutants had a significant negative impact only on the plant heights of the shrubs, but from the appearance of plant leaves, stems and buds, there was no significant difference between road runoff and tap water as water sources. The results of this study confirm the removal effect of plant diversity on N. It is also recommended that plant selection should not only consider the contribution of plants to pollutant removal but also the road runoff and specific bioretention operating conditions for normal plant growth.

Author Contributions

Y.G., Y.H, and Z.S. conceived and designed the experiments. J.L. and H.L. supervised the experiments and managed the funding. Y.H., W.W., and S.W. performed the experiments. Y.H. analyzed the data. Y.G. and Z.S. supervised the data analysis. Y.H. and Y.G. wrote the manuscript.

Funding

The research was supported by the Major Science and Technology Program for Water Pollution Control and Treatment (2017ZX07403001), the National Natural Science Foundation of China (41530635), the Beijing University of Civil Engineering and Architecture Research Fund for Pyramid Talents Development, and the Beijing Higher Education High Level Teachers Team Construction Program (CIT & TCD201704055).

Conflicts of Interest

The authors declare no conflict of interest.

References

  1. Hsieh, C.; Davis, A.P. Evaluation and Optimization of Bioretention Media for Treatment of Urban Storm Water Runoff. J. Environ. Eng. 2005, 131, 1521–1531. [Google Scholar] [CrossRef]
  2. Wang, L.Z.; Lyons, J.; Kanehl, P.; Bannerman, R.; Emmons, E. Watershed urbanization and changes in fish communities in southeastern Wisconsin streams. Jawra J. Am. Water Resour. Assoc. 2010, 36, 1173–1189. [Google Scholar] [CrossRef]
  3. Mao, X.; Jia, H.; Shaw, L.Y. Assessing the ecological benefits of aggregate LID-BMPs through modelling. Ecol. Model. 2017, 353, 139–149. [Google Scholar] [CrossRef]
  4. Hurley, S.E.; Forman, R.T.T. Stormwater ponds and biofilters for large urban sites: Modeled arrangements that achieve the phosphorus reduction target for Boston’s Charles River, USA. Ecol. Eng. 2011, 37, 850–863. [Google Scholar] [CrossRef]
  5. Davis, A.P. Field Performance of Bioretention: Hydrology Impacts. J. Hydrol. Eng. 2008, 13, 90–95. [Google Scholar] [CrossRef]
  6. Feng, W.; Hatt, B.E.; Mccarthy, D.T.; Fletcher, T.D.; Deletic, A. Biofilters for stormwater harvesting: Understanding the treatment performance of key metals that pose a risk for water use. Environ. Sci. Technol. 2012, 46, 5100–5108. [Google Scholar] [CrossRef]
  7. Liu, J.; Sample, D.; Bell, C.; Guan, Y. Review and Research Needs of Bioretention Used for the Treatment of Urban Stormwater. Water 2014, 6, 1069–1099. [Google Scholar] [CrossRef]
  8. Taylor, A.; Wetzel, J.; Mudrock, E.; King, K.; Cameron, J.; Davis, J.; McIntyre, J. Engineering Analysis of Plant and Fungal Contributions to Bioretention Performance. Water 2018, 10, 1226. [Google Scholar] [CrossRef]
  9. Henderson, C.; Greenway, M.; Phillips, I. Removal of dissolved nitrogen, phosphorus and carbon from stormwater by biofiltration mesocosms. Water Sci. Technol. 2007, 55, 183–191. [Google Scholar] [CrossRef]
  10. Fritioff, Å.; Greger, M. Aquatic and Terrestrial Plant Species with Potential to Remove Heavy Metals from Stormwater. Int. J. Phytoremediation 2003, 5, 211–224. [Google Scholar] [CrossRef]
  11. Zanin, G.; Bortolini, L.; Borin, M. Assessing Stormwater Nutrient and Heavy Metal Plant Uptake in an Experimental Bioretention Pond. Land 2018, 7, 150. [Google Scholar] [CrossRef]
  12. Hatt, B.E.; Fletcher, T.D.; Ana, D. Hydraulic and pollutant removal performance of fine media stormwater filtration systems. Environ. Sci. Technol. 2008, 42, 2535–2541. [Google Scholar] [CrossRef] [PubMed]
  13. Hunt, W.F.; Davis, A.P.; Traver, R.G. Meeting hydrologic and water quality goals through targeted bioretention design. J. Environ. Eng. 2011, 138, 698–707. [Google Scholar] [CrossRef]
  14. Bratieres, K.; Fletcher, T.D.; Deletic, A.; Zinger, Y. Nutrient and sediment removal by stormwater biofilters: A large-scale design optimisation study. Water Res. 2008, 42, 3930–3940. [Google Scholar] [CrossRef]
  15. Read, J.; Fletcher, T.D.; Wevill, T.; Deletic, A. Plant Traits that Enhance Pollutant Removal from Stormwater in Biofiltration Systems. Int. J. Phytoremediation 2010, 12, 34–53. [Google Scholar] [CrossRef]
  16. Read, J.; Wevill, T.; Fletcher, T.; Deletic, A. Variation among plant species in pollutant removal from stormwater in biofiltration systems. Water Res. 2008, 42, 893–902. [Google Scholar] [CrossRef]
  17. Lucas, W.C.; Greenway, M. Nutrient retention in vegetated and nonvegetated bioretention mesocosms. J. Irrig. Drain. Eng. 2008, 134, 613–623. [Google Scholar] [CrossRef]
  18. Liu, Z.; Li, J.; Li, P.; Li, Y.; Li, W. Study of Bioretention System on Heavy-Metal Removal Effect. Pol. J. Environ. Stud. 2018, 27, 163–173. [Google Scholar] [CrossRef]
  19. Zhao, L.Y.; Schulin, R.; Nowack, B. The effects of plants on the mobilization of Cu and Zn in soil columns. Environ. Sci. Technol. 2007, 41, 2770–2775. [Google Scholar] [CrossRef]
  20. Davis, A.P.; Shokouhian, M.; Sharma, H.; Minami, C. Laboratory Study of Biological Retention for Urban Stormwater Management. Water Environ. Res. 2001, 73, 5–14. [Google Scholar] [CrossRef]
  21. Muthanna, T.M.; Viklander, M.; Blecken, G.; Thorolfsson, S.T. Snowmelt pollutant removal in bioretention areas. Water Res. 2007, 41, 4061–4072. [Google Scholar] [CrossRef] [PubMed]
  22. Xia, J.; Wang, H.; Stanford, R.L.; Pan, G.; Shaw, L.Y. Hydrologic and water quality performance of a laboratory scale bioretention unit. Front. Environ. Sci. Eng. 2018, 12, 14. [Google Scholar] [CrossRef]
  23. Wu, J.; Cao, X.; Zhao, J.; Dai, Y.; Cui, N.; Li, Z.; Cheng, S. Performance of biofilter with a saturated zone for urban stormwater runoff pollution control: Influence of vegetation type and saturation time. Ecol. Eng. 2017, 105, 355–361. [Google Scholar] [CrossRef]
  24. Clark, S.E.; Pitt, R. Targeting treatment technologies to address specific stormwater pollutants and numeric discharge limits. Water Res. 2012, 46, 6715–6730. [Google Scholar] [CrossRef] [PubMed]
  25. Water, M. WSUD Engineering Procedures: Stormwater: Stormwater; Csiro Publishing: Clayton, Australia, 2005. [Google Scholar]
  26. Auckland Regional Council. Stormwater Management Devices: Design Guidelines Manual; ARC Technical Publication No.10; Auckland Regional Council: Auckland, New Zealand, 2003.
  27. Claytor, R.A.; Schueler, T.R. Design of Stormwater Filtering Systems; Chesapeake Research Consortium: Edgewater, MD, USA, 1996. [Google Scholar]
  28. Coustumer, S.L.; Fletcher, T.D.; Deletic, A.; Barraud, S.; Lewis, J.F. Hydraulic performance of biofilter systems for stormwater management: Influences of design and operation. J. Hydrol. 2009, 376, 16–23. [Google Scholar] [CrossRef]
  29. Hou, P.; Ren, Y.; Wang, X.; Ouyang, Z.; Zhou, X. Research on evaluation of water quality of Beijing urban stormwater runoff. Environ. Sci. 2012, 33, 71–75. [Google Scholar] [CrossRef]
  30. Rice, E.W.; Baird, R.B.; Eaton, A.D.; Clesceri, L.S. Standard Methods for the Examination of Water and Wastewater; American Public Health Association: Washington, DC, USA, 2012; Volume 10. [Google Scholar]
  31. Sartory, D.; Grobbelaar, J. Extraction of chlorophyll a from freshwater phytoplankton for spectrophotometric analysis. Hydrobiologia 1984, 114, 177–187. [Google Scholar] [CrossRef]
  32. Arnon, D.I. Copper enzymes in isolated chloroplasts. Polyphenoloxidase in Beta vulgaris. Plant Physiol. 1949, 24, 1–15. [Google Scholar] [CrossRef]
  33. Lutts, S.; Kinet, J.M.; Bouharmont, J. NaCl-induced Senescence in Leaves of Rice (Oryza sativa L.) Cultivars Differing in Salinity Resistance. Ann. Bot. 1996, 78, 389–398. [Google Scholar] [CrossRef]
  34. Jiang, C.-B.; Li, J.-K.; Zhang, B.-H.; Ruan, T.-S.; Li, H.-E.; Dong, W. Design parameters and treatment efficiency of a retrofit bioretention system on runoff nitrogen removal. Environ. Sci. Pollut. Res. 2018, 25, 33298–33308. [Google Scholar] [CrossRef]
  35. Hatt, B.E.; Fletcher, T.D.; Deletic, A. Hydrologic and pollutant removal performance of stormwater biofiltration systems at the field scale. J. Hydrol. 2009, 365, 310–321. [Google Scholar] [CrossRef]
  36. Blecken, G.T.; Zinger, Y.; Deletić, A.; Fletcher, T.D.; Hedström, A.; Viklander, M. Laboratory study on stormwater biofiltration: Nutrient and sediment removal in cold temperatures. J. Hydrol. 2010, 394, 507–514. [Google Scholar] [CrossRef]
  37. Dietz, M.E. Low Impact Development Practices: A Review of Current Research and Recommendations for Future Directions. Water Air Soil Pollut. 2015, 22, 543–563. [Google Scholar] [CrossRef]
  38. Davis, A.P.; Mohammad, S.; Himanshu, S.; Christie, M. Water quality improvement through bioretention media: Nitrogen and phosphorus removal. Water Environ. Res. 2006, 78, 284–293. [Google Scholar] [CrossRef]
  39. Lim, H.S.; Lim, W.; Hu, J.Y.; Ziegler, A.; Ong, S.L. Comparison of filter media materials for heavy metal removal from urban stormwater runoff using biofiltration systems. J. Environ. Manag. 2015, 147, 24–33. [Google Scholar] [CrossRef]
  40. Blecken, G.T.; Zinger, Y.; Deletic, A. Impact of a submerged zone and a carbon source on heavy metal removal in stormwater biofilters. Ecol. Eng. 2009, 35, 769–778. [Google Scholar] [CrossRef]
  41. Zhang, X.; Zhang, X.; Bo, G.; Li, Z.; Xia, H.; Li, H.; Jian, L. Effect of cadmium on growth, photosynthesis, mineral nutrition and metal accumulation of anenergy crop, king grass (Pennisetum americanum × P. purpureum). Biomass Bioenergy 2014, 67, 179–187. [Google Scholar] [CrossRef]
  42. Manios, T.; Stentiford, E.I.; Millner, P.A. The effect of heavy metals accumulation on the chlorophyll concentration of Typha latifolia plants, growing in a substrate containing sewage sludge compost and watered with metaliferus water. Ecol. Eng. 2003, 20, 65–74. [Google Scholar] [CrossRef]
  43. Zhao, X.J.; Sucoff, E.; Stadelmann, E.J. Al and Ca Alteration of Membrane Permeability of Quercus rubra Root Cortex Cells. Plant Physiol. 1987, 83, 159–162. [Google Scholar] [CrossRef] [Green Version]
  44. Cakmak, I.; Marschner, H. Increase in Membrane Permeability and Exudation in Roots of Zinc Deficient Plants. J. Plant Physiol. 1988, 132, 356–361. [Google Scholar] [CrossRef]
  45. Belimov, A.A.; Safronova, V.I.; Tsyganov, V.E.; Borisov, A.Y.; Kozhemyakov, A.P.; Stepanok, V.V.; Martenson, A.M.; Gianinazzi-Pearson, V.; Tikhonovich, I.A. Genetic variability in tolerance to cadmium and accumulation of heavy metals in pea (Pisum sativum L.). Euphytica 2003, 131, 25–35. [Google Scholar] [CrossRef]
Figure 1. Structural diagram of the bioretention.
Sustainability 11 06402 g001
Figure 2. Cumulative load removal rate of the various pollutants.
Sustainability 11 06402 g002
Figure 3. The heights of the four plant species in the experimental group and the control group.
Sustainability 11 06402 g003
Figure 4. The Pn of the four plant species in the experimental group and the control group changed over time.
Sustainability 11 06402 g004
Figure 5. The CC of the four plant species in the experimental group and control group changed over time.
Sustainability 11 06402 g005
Figure 6. The electrolyte leakage of the four plant species in the experimental group and the control group changed over time.
Sustainability 11 06402 g006
Table 1. Influent water quality.
Water Quality IndexSimulated Road Runoff QualityChemical Agent
Mean Low ConcentrationsMean High Concentrations
COD170.13277.44C6H12O6
NH4+-N7.7816.68NH4Cl
NO3--N6.8510.67KNO3
TN22.0135.69
Cu0.382.11CuSO4
Zn3.1513.06ZnSO4
Pb58.37151.56Pb(NO3)2
Cd65.97214.83(Cd)2SO4
pH7.287.18NaOH/HCl
Note: The concentration units of Pb and Cd are µg·L-1, and the remaining indicator units are mg·L-1.
Table 2. Rainfall statistics and influent water volume.
Rainfall TypesRainfall TimesProportion (%)Average Rainfall (mm)Inflow
Volume (L) **
Light rain38348.35.111
Moderate rain21927.61634
Heavy rain 12415.634.2 (33.3) *64
Rainstorms678.478.2 (33.3) *64
Notes: *: The values in parentheses are the overflow of the devices. **: Water inflow volume = average rainfall/(green area/catchment area) × device cross-sectional area.
Table 3. The effluent water quality and pollutant reduction effect of the devices.
IndexEffluent ConcentrationConcentration Reduction
Rate (CRR)
Mass Removal Rate
(MRR)
SS-LSS-HSS-LSS-HSS-LSS-H
COD31.57 ± 15.9944.12 ± 19.4672.13 ± 27.0376.41 ± 23.2086.53 ± 16.5688.47 ± 9.53
NH4+-N0.10 ± 0.09b0.59 ± 0.35a96.31 ± 7.51a90.66 ± 10.90b98.80 ± 2.07a95.10 ± 6.02b
NO3--N 1.09 ± 0.50b2.33 ± 1.27a75.86 ± 17.5476.72 ± 13.7989.61 ± 6.4989.35 ± 6.04
TN 2.82 ± 1.28b6.09 ± 3.69a81.34 ± 16.95a74.42 ± 28.04b92.25 ± 5.8988.47 ± 11.25
Cu0.14 ± 0.130.09 ± 0.0665.41 ± 23.10b92.84 ± 9.25a85.44 ± 12.09b96.39 ± 5.28a
Zn 0.13 ± 0.100.13 ± 0.1495.69 ± 2.0498.73 ± 1.0298.10 ± 1.2599.34 ± 0.71
Pb13.30 ± 6.9910.31 ± 6.2069.80 ± 21.2581.84 ± 23.3887.46 ± 9.6690.61 ± 13.11
Cd 6.76 ± 6.077.89 ± 13.0875.55 ± 31.2689.28 ± 21.8789.48 ± 12.8393.41 ± 13.45
pH7.83 ± 0.477.48 ± 0.45
Notes: (1) The unit of Pb and Cd is µg/L, and the unit of the other indicators is mg/L; (2) There are significant differences according to the least significant difference (LSD) test when different letters are used (p < 0.05). The data labeled “a” are significantly higher than the data labeled “b”. No letter indicates no statistical difference (p > 0.05); (3) Data for the mean ± the SD.
Table 4. Effect of road runoff on plant physiological indexes.
PlantsHeightPnCCEL
CLCHCLCHCLCHCLCH
Iris tectorum Maxim××+-+-×-
Iris lactea var. chinensis×××+×+×-
Rosa xanthina Lindl×-+-××--
Ligustrum vicaryi×-----××
Notes: (1) + indicates a positive impact on plants. Compared with tap water, the degrees of Pn and CC decline can be alleviated, and the increase in EL is inhibited; (2) - indicates a negative impact on plants. Compared with tap water, the degrees of Pn and CC decline can be aggravated, and the increase in EL is accelerated; (3) × compared with tap water, there was no noticeable impact; (4) CL, low concentration runoff; CH, high concentration runoff.

