Article

Impact of Safety Attitude on the Safety Behavior of Coal Miners in China

1
School of Engineering and Technology, China University of Geosciences (Beijing), Beijing 100083, China
2
Department of Architecture and Civil Engineering, City University of Hong Kong, Hong Kong, China
3
Department of Engineering Physics, Tsinghua University, Beijing 100084, China
*
Author to whom correspondence should be addressed.
Sustainability 2019, 11(22), 6382; https://doi.org/10.3390/su11226382
Submission received: 26 September 2019 / Revised: 5 November 2019 / Accepted: 7 November 2019 / Published: 13 November 2019
(This article belongs to the Section Energy Sustainability)

Abstract

:
Most coal mine accidents are attributed to the unsafe behavior of miners. Adjusting the safety attitude and thus improving miners’ safety behavior is important for accident prevention. However, the relationship between safety attitude and safety behavior in the coal mining industry has not been explored. The coal miners’ safety attitude scale and safety behavior scale were used to analyze the impact of safety attitude on safety behavior and investigate the correlation between four dimensions of safety attitude and two kinds of safety behavior. The impact of demographic characteristics including age, length of service, and education level on safety attitude and safety behavior was also measured. A survey of miners at four coal mines in China resulted in 593 valid responses. The result indicates that safety attitude is not only positively related to safety behavior but also positively related to safety participation and safety compliance. From the four dimensions of safety attitude, the team safety climate directly affects safety participation and safety compliance. Management safety commitment, job stress, and fatalism are not significantly related to safety participation and safety compliance. The results show that age and length of service were slightly related to safety attitude, and the education level was not significantly related to safety attitude. Age, length of service and education level had no impact on safety behavior. The contribution of this study to the current literature is that the safety attitude of coal miners can positively affect safety behavior and can be improved by fostering a good team safety climate. Practical implications emphasize safety training and safety education, especially for young miners. Managers should reinforce safety commitment, provide adequate safety equipment, timely communicate with miners, and encourage miners to actively communicate with colleagues to improve safety behavior and prevent accident in the coal mining industry.

1. Introduction

Most researches focus on the relationship between safety attitude, safety behavior, and accidents. Donald and Siu pointed out that safety attitude has predictive effects on accident outcomes and thus contributes to the tendency of accidents [1]. Heinrich reported that employees’ poor attitudes lead to bad accidents [2]. Studies have indicated that the unsafe behaviors of coal miners leads to accidents [3]. Shin et al. found that adjusting the safety attitudes of employees reduces unsafe behaviors and eventually reduces the occurrence of accidents [4]. Thus, changing the safety attitudes of miners is critical to the prevention of accidents [5].
Safety attitude reflects employees’ beliefs and feelings about safety policies, procedures, and practices [6]. Safety behavior refers to individuals’ behaviors to promote the health and safety of their working environment [7]. Knowledge, attitude, and practice (KAP) is an ideal model of behavior change, and it indicates that employees with a good safety attitude have good safety behavior [8]. Good safety attitude can affect miners sustainably and improve safety behavior imperceptibly. In dry bulk shipping, Lu et al. explored the impact of seafarers’ perceptions of national culture and leadership on safety attitude and safety behavior [9]. Shin et al. investigated the construction workers’ mental processes to analyze the feedback mechanisms regarding safety attitudes and safe behaviors [4]. By investigating the relationship between food safety knowledge, attitude, and behavior, Baser et al. found that safety attitude has a significant relationship with safety behavior [10]. These studies support the premise that safety attitudes have an important impact on safety behavior in general, but the specific impact on coal miners needs clarification.
In recent years, the number of coal mine accidents in China has declined significantly, with the death toll dropping from 1151 in 2015 to 333 in 2018. But serious accidents with more than three deaths occur sometimes, the safety management of coal mines faces great challenges [11,12]. The geological conditions of coal mines are complex and more than 90% are underground mines, the safety of coal mines has become an increasingly prominent problem. Most coal miners are migrant workers with a low level of knowledge and weak safety awareness [3]. Because of miners’ experiences with working conditions and long-term operations underground, their individual characteristics are very different from those working in other industries, and the impact of their safety attitude on safety behavior is still unknown. On the basis of the above analysis, this study aims to reveal the relationship between safety attitude and safety behavior in the coal mining industry. Therefore, this study intended to adopt appropriate questionnaires to measure coal miners’ safety attitude and safety behavior and, thus, investigate the impact of safety attitude on safety behavior.

2. Literature Review and Hypothesis Development

This section describes findings from reviewing the literature on safety attitudes and safety behavior in order to choose appropriate questionnaires. It then expressly states the hypotheses addressed by the analyses in this study.

2.1. Safety Attitude

Safety attitude reflects employees’ beliefs and emotions concerning safety policies, procedures, and practices [6]. To date, many different scales have been developed to measure safety attitudes, and the structural dimensions of safety attitude can vary greatly across industries [13,14,15]. Cox initially proposed a structure of safety attitude based on five dimensions, namely, the effectiveness of arrangements for safety, individual responsibility, personal skepticism, the safety of the work environment, and personal immunity [16]. Haerkens et al. developed a safety attitude questionnaire for the healthcare industry, and it comprised of six dimensions: Teamwork climate, job satisfaction, safety climate, stress recognition, working conditions, and perceptions of management [17]. For the Chinese coal industry, Zhang developed a safety attitude scale to measure senior managers’ attitudes toward safety [18]. Wu et al. designed a factor structure of safety attitude that included four dimensions: Team safety climate, management safety commitment, fatalism, and job stress. This construct has good reliability and can effectively measure coal miners’ safety attitudes in the Chinese coal industry [19].

2.2. Safety Behavior

Safety behavior is defined as individuals’ behaviors to promote the health and safety of working environment [7]. Neal, Griffin, and Hart proposed two sub-dimensions of safety behavior: Safety compliance and safety participation. Safety participation and safety compliance are regarded as two types of safety behavior. Safety compliance indicates that employees follow safety procedures and carry out safety activities to maintain workplace safety. Safety participation reflects employees’ positive participation in safety activities or safety meetings to promote safety in the workplace. Clarke and Ward indicated that safety compliance belongs to in-role behavior, while safety participation belongs to extra-role behavior, it stressed the voluntary and active participation of workers in safety activities [20]. In addition, Christian et al. found that safety compliance and safety participation were correlated with occupational injuries and accidents [21]. DeArmond et al. indicated that safety compliance and safety participation had a negative relationship with occupational injuries. Two types of safety behavior are critical to injury and accident prevention [22]. The definition and components of safety behavior proposed by Neal, Griffin, and Hart were adopted in this study [23].

2.3. Hypotheses

In this study, the below hypotheses were developed on the basis of previous research on the impact of safety attitude on safety behavior.
The correlation between safety attitude and safety behavior is gradually being recognized. Fugas studied the effect of organizational safety climate on safety compliance and safety participation, and the relationship between organizational safety climate and proactive safety behaviors was mediated by safety attitude [24]. The results indicated that safety attitude directly affects safety participation and indirectly affects safety compliance through perceived behavioral control. Baser et al. explored the relationship between food safety knowledge, attitude, and behavior and found that safety attitude is positively correlated with safety behavior [10].
From the review of previous studies, the following hypotheses are proposed.
Hypothesis H1.
Safety attitude is positively correlated with safety behavior.
Hypothesis H2a.
Safety attitude is positively correlated with safety compliance.
Hypothesis H2b.
Safety attitude is positively correlated with safety participation.
Rundmo pointed out that the attitude of the manager affects the manager’s decisions, the employee’s safety attitude, and the company’s emphasis on safety [25]. Zhang et al. found that managers’ attitudes toward safety can influence the safety climate and safety behavior of miners [18]. Accordingly, managers’ safety attitude has a significant impact on coal miners’ safety behavior. Thus, the following assumptions are proposed.
Hypothesis H3a.
The management safety commitment is positively related to safety compliance.
Hypothesis H3b.
The management safety commitment is positively related to safety participation.
In a team setting, miners can influence the attitude of colleagues. One person’s negative attitude toward safety can affect that of colleagues [24]. Schwatka and Rosecrance found that safety climate significantly affects workers’ behavior and that workers’ perceptions of their colleagues’ safety attitudes play a mediating role in the relationship between the two variables [26]. Therefore, a good team safety climate will promote the safety behavior of coal miners.
Hypothesis H4a.
Team safety climate is positively correlated with safety compliance.
Hypothesis H4b.
Team safety climate is positively correlated with safety participation.
Studies have indicated that job stress directly affects an employee’s safety behavior [27]. Leung et al. asserted that physical stress seriously hampers workers’ safety behavior and can make them extremely prone to accidents [28].
Hypothesis H5a.
Job stress negatively and directly predicts safety compliance.
Hypothesis H5b.
Job stress negatively and directly predicts safety participation.
A fatalist employee believes that the occurrence of occupational accidents is attributable to “fate” [27]. Therefore, fatalism in an employee reduces safety behavior and can easily lead to accidents.
Hypothesis H6a.
Fatalism is negatively correlated with safety compliance.
Hypothesis H6b.
Fatalism is negatively correlated with safety participation.
When studying the factors of safety attitude that affect safety behavior, both internal and external factors should be considered. The internal factors included in this study are fatalism and job stress. Some internal factors are regarded as moderating variables [10]. The external factors included in this study are management safety commitment and team safety climate. The hypotheses involving these internal and external factors are as follows.
Hypothesis H7a.
The management safety commitment is negatively correlated with fatalism.
Hypothesis H7b.
The management safety commitment is negatively correlated with job stress.
Hypothesis H8a.
Team safety climate negatively predicts fatalism.
Hypothesis H8b.
Team safety climate negatively predicts job stress.
The longer an employee has worked for an enterprise, the more safety education they have received; therefore, they have a greater understanding of the work tasks and pay more attention to all unsafe aspects. Older employees are more stable than young employees, so they pay more attention to safety when working, do not take risks at work, and do not operate against the rules, all of which are behaviors that can reduce the occurrence of accidents. Siu et al. proposed that age affected the safety attitude of construction workers [29]. The results showed that the older the construction workers, the more positive their safety attitude. In addition, Caffaro et al. found that the length of service decreases unsafe behaviors [30].
According to the above analysis, the sociodemographic characteristics of coal miners, including age, length of service, and education level, were measured, and the following assumptions are put forward.
Hypothesis H9a.
Demographic characteristics are positively related to safety attitude.
Hypothesis H9b.
Demographic characteristics are positively related to safety behavior.

3. Methods

In this study, the obtained safety attitude questionnaire and safety behavior questionnaire were used to measure the safety attitude and behavior of coal miners. Data were obtained by reliability analysis and confirmatory factor analysis and then used to further verify the scale.

3.1. Research Tools

Currently, different industries have different safety attitude measurement scales. Williamson’s five-dimensional safety attitude questionnaire, divided into long and short scales, is representative in the manufacturing industry [31]. In the chemical industry, the employee safety attitude questionnaire compiled by Donald is widely recognized [1]. The Safety Attitude Questionnaire designed by Sexton is also widely used [32]. However, these questionnaires and scales were all developed in a foreign work environment, and it is necessary to carry out the process of “localization” for domestic use. For industries other than coal mining, researchers in China have often used safety attitude questionnaires, such as the compiled “Safety attitude towards Construction Workers’ Personal Protective Equipment”, which is difficult to apply widely. In addition, the coal industry has unique production characteristics. The complex underground environment of coal mines poses a threat to the life and health of miners. Therefore, the development of a scale suitable for measuring coal miners’ safety attitudes must be based on the current status of domestic coal mine production. The coal miners’ Safety Attitude Questionnaire (SAQ) proposed by Wu has shown high reliability and validity under the current coal mine production conditions and was used in this study [19]. This SAQ has 17 questions and includes four dimensions of safety attitude: Team safety climate, management safety commitment, fatalism, and job stress.
For the analysis of safety behavior, Neal designed a scale for measuring safety compliance and safety participation to propose a structural model. The resulting Safety Behavior Questionnaire (SBQ) is now widely accepted [23]. The SBQ has six questions and contains two dimensions of safety behavior: Safety compliance and safety participation.

3.2. Procedure and Participants

The questionnaire administered in this study contained three parts. The first part described the questionnaire to introduce its purpose and content so that participants understood the survey. The second part was used to collect demographic information, such as the coal miners’ gender, age, education level, and length of service. The purpose of the third part was to measure the safety attitude and safety behavior of coal miners using the SAQ and SBQ.
A five-point Likert scale, from one = “completely disagree” to five = “completely agree”, was adopted to grade the questionnaire items: The higher the score, the more positive the miners’ safety attitude and the better the safety behavior.
The SAQ and SBQ were distributed to a sample of the population. The two questionnaires were distributed to safety managers in the four coal mining enterprises, and the safety managers explained the two questionnaires to the coal miners. After the coal miners completed the two questionnaires, the safety managers collected and returned them. Some questionnaires were also published online. The survey responses were analyzed using confirmatory factor analysis and reliability analysis. The respondents from this survey were from four different coal mining enterprises in Shanxi, Inner Mongolia, and Anhui provinces. This distribution renders the sample more representative and allows for its extension to the entirety of China. A total of 808 questionnaires were received; 593 of them were valid. The ages of the final respondents ranged from 21 to 58 years (N = 575, M = 32, SD = 7.39), and their length of service ranged from one to 38 years (N = 587, M = 5.75, SD = 5.21). In terms of educational background, 1.1% of the participants received primary education, 23.4% received secondary education, 40.7% received high school education, and 38.1% received a bachelor’s degree. All respondents were male.

3.3. Data Analysis

Confirmatory factor analysis (CFA) is an important analytic tool for the estimation of scale reliability [30] by assessing the internal consistency and reliability of latent constructs. In this study, CFA was conducted to test the correlation between the conceptual model and the survey data [29]. Confirmatory factor analysis attempts to verify a hypothesized factor structure of observed variables by testing the relationship between observed measures and their underlying latent factors. CFA results may indicate that a model is not acceptable for reasons such as insignificant indicators, so it should be modified and improved. Thus, the adequacy of the initial CFA model should be determined, and the model’s fit to the data must be evaluated [31]. The goodness of fit is examined to evaluate the acceptability of the initial CFA model [29].
The safety attitude questionnaire used in this study was verified by Wu [19]. Additionally, the safety behavior questionnaire proposed by Neal [23] has been verified and matured in many studies. Therefore, only reliability analysis and confirmatory factor analysis were required for this study. The reliability analysis was used to analyze the internal consistency of the four dimensions and the safety attitude scale. The internal consistency reliability reflects the correlations between questionnaire items belonging to one dimension [33]. Cronbach’s α was used to measure the internal consistency reliability and the composite reliability index (CRI), a complementary consistency index based on the factor loadings, and residuals, which overcomes some shortcomings of α as reliability estimation [34,35]. After the reliability analysis, confirmatory factor analysis was conducted to verify the structural validity of the questionnaire. An overall goodness-of-fit (GOF) test was used to evaluate the quality of the safety attitude’s four-dimensional structure and the safety behavior’s two-dimensional structure [36]. The indicators of GOF in this study were χ2 / d . f . , goodness-of-fit index (GFI), adjusted goodness-of-fit index (AGFI), comparative fit index (CFI), normed fit index (NFI), Tucker–Lewis index (TLI), and root-mean-square error of approximation (RMSEA). According to Hair, RMSEA should be less than 0.08, and AGFI, CFI, and GFI should be greater than 0.90 [36]. Schreiber et al. reported that CFI, TLI, and RMSEA are significant fit indicators. They specified that the validity of a constructed model is confirmed if CFI is greater than 0.95, TLI is greater than 0.95, and RMSEA is less than 0.08. The above studies indicated that χ2 / d . f . should be less than three [37]. In this research, the χ2 / d . f . value of less than three is considered ideal.
Then, structural equation modeling was used to test the reliability and validity of the research model to verify the hypotheses. In this approach, an initial model is first established from the hypothesis, and whether the model can be identified is then determined. If the model can be identified, then a "violation estimate" of the test model is applied to check for unexplained values in the data analysis. If the model can be identified and lacks a "violation estimate", then confirmatory factor analysis can be used to analyze the overall fitness and internal structure fitness of the model. Next, the fitness of the model and data is determined by assessing whether the fitness index is accepted, whether the critical ratio (CR) of the path coefficient is greater than 1.96, and whether the critical ratio is significant. If the fitness does not meet requirements, then the model needs to be modified until it matches the data. The data were analyzed by Analysis of Moment Structure (AMOS v22.0) (International Business Machines Corporation, New York, NY and USA).

4. Results

Confirmatory factor analyses were used to determine whether the two survey instruments could effectively measure the safety attitude and safety behavior of coal miners. The analysis described in this section consisted of two parts. First, the questionnaire was verified, and then the structural equation model of safety attitude and safety behavior was constructed.

4.1. Confirmatory Factor Analysis

This section focuses on the confirmatory factor analysis of the SAQ and SBQ. Confirmatory factor analysis was used to further analyze the collected data.
The safety attitude questionnaire used in this study was verified by Wu [19]. Additionally, the safety behavior questionnaire proposed by Neal [23] has been verified and matured in many studies. Therefore, only reliability analysis and confirmatory factor analysis were required.
The Cronbach’s α values of the safety attitude scale and its four dimensions (fatalism, management safety commitment, job stress, and team safety climate) were 0.873, 0.929, 0.778, 0.764, and 0.642, respectively [19]. The composite reliability indices of four dimensions of safety attitude (fatalism, management safety commitment, job stress, and team safety climate) were 0.933, 0.862, 0.881, and 0.887, respectively. The Cronbach’s α values of safety behavior and its two dimensions (safety compliance and safety participation) were 0.880, 0.830, and 0.853, respectively. Since α values greater than 0.6 indicate that the design of the questionnaire is reliable [33], both the SAQ and SBQ were deemed reliable. Data analysis was performed by maximum likelihood, and the variance of the four dimensions of safety attitude and that of the two dimensions of safety behavior were merged. The CR of the safety attitude path coefficient was between 12.966 and 26.410 [19], and the CR of the safety behavior path coefficient was between 17.55 and 21.06. The path coefficients of both safety attitude and safety behavior were significant, and the significance level, p, was less than 0.001. Hence, these path coefficient parameters were significantly different. The path coefficient values of safety behavior are shown in Table 1.
In the safety attitude structural model, the overall GOF indicators of the confirmatory factor analysis were χ2 = 380.662 (d.f. = 139, χ2 / d . f . = 2.73 < 3), GFI = 0.93 > 0.90, AGFI = 0.91 > 0.90, CFI = 0.96 > 0.95, TLI = 0.95 ≥ 0.95, and RMSEA = 0.06 < 0.08 [19]. These values showed that the structural model of safety attitude had good validity. The indicators of the safety behavior structural model that met the requirements for an ideal model were GFI = 0.98 > 0.90, AGFI = 0.95 > 0.90, CFI = 0.98 > 0.95, and TLI = 0.97 > 0.95. However, χ2 / d . f . = 4.726 (χ2 = 37.81, d.f. = 8) and RMSEA = 0.08 did not meet requirements. Because χ2 / d . f . and RMSEA differed only slightly from the acceptable value and other indicators met the requirements, the structural model of safety behavior was considered to match the data.
According to the above analysis, both the SAQ and SBQ have good internal consistency, and the structural models of safety attitude and safety behavior match the data. Thus, the two questionnaires can effectively measure the safety attitude and safety behavior of coal miners.

4.2. The Impact of Safety Attitude on Safety Behavior

4.2.1. Establishing the Model of the Relationship between Safety Attitude and Safety Behavior

First, the structural model of the relationship between safety attitude and safety behavior was established. Then, safety attitude and safety behavior were used as potential variables. Fatalism, job stress, management safety commitment (MSC), and team safety climate (TSC) were regarded as the index variables of safety attitude. Safety compliance (SC) and safety participation (SP) were used as the index variables of safety behavior.
Accordingly, the structural model of the impact of safety attitude on SC and SP was constructed. Safety attitude, SC, and SP were used as potential variables. Then, the four dimensions of safety attitude were analyzed as the index variables of safety attitude.
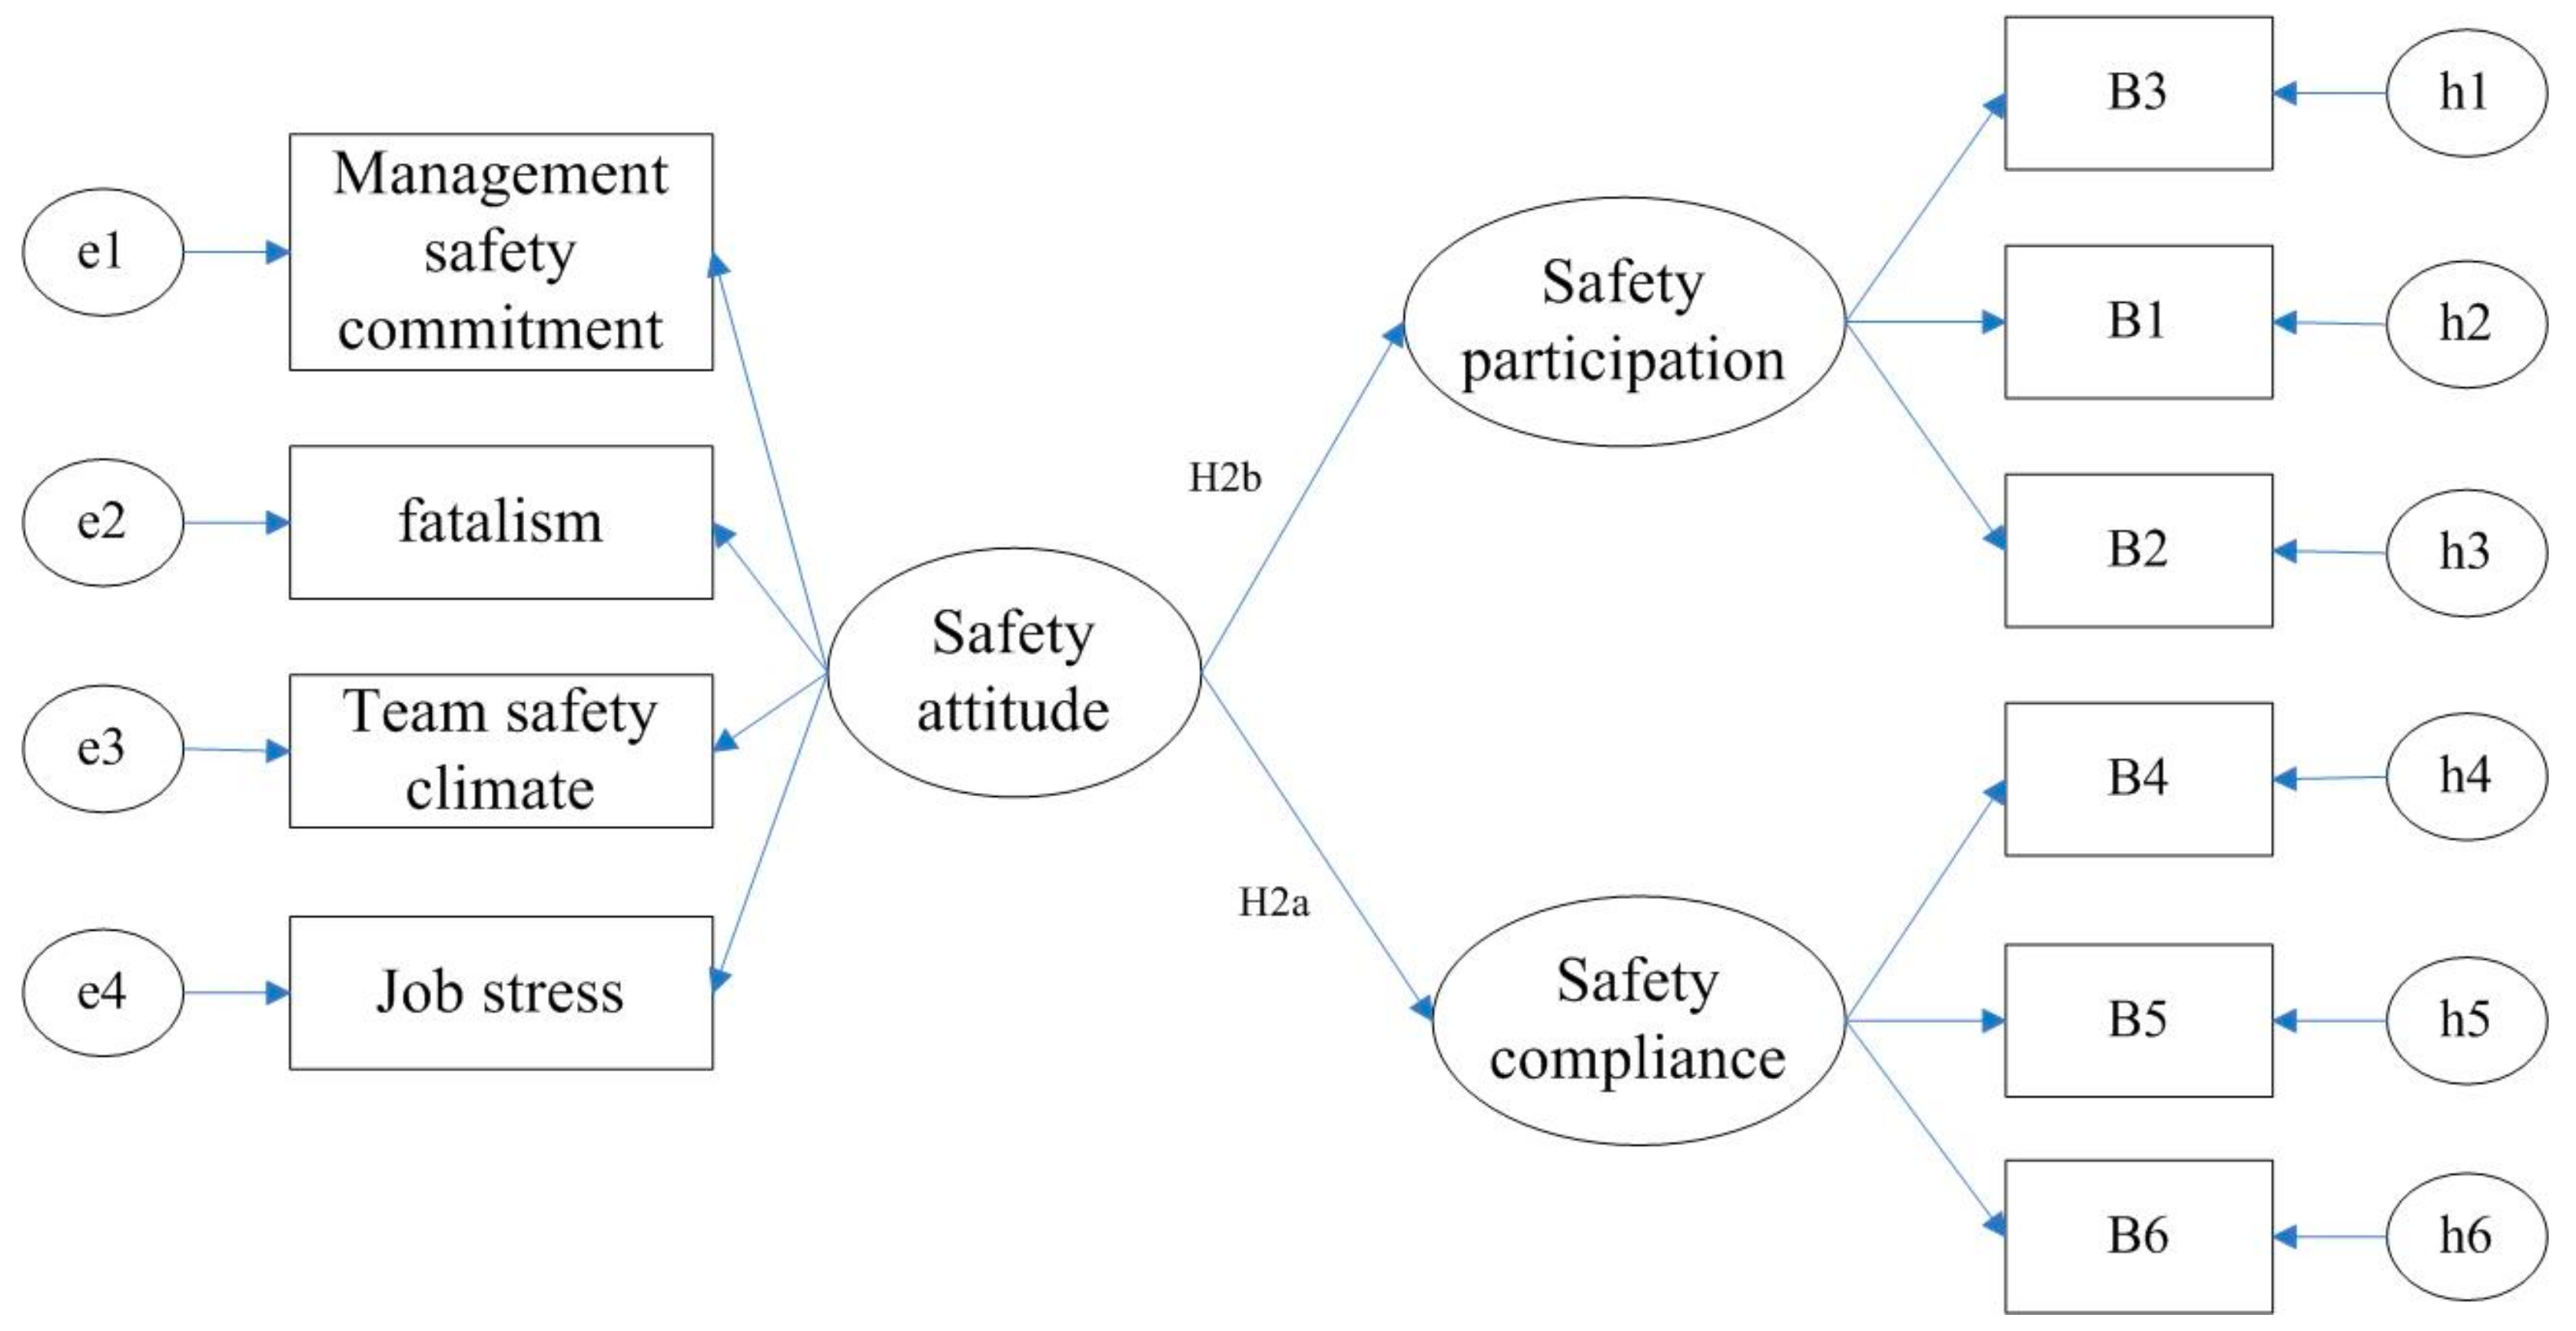
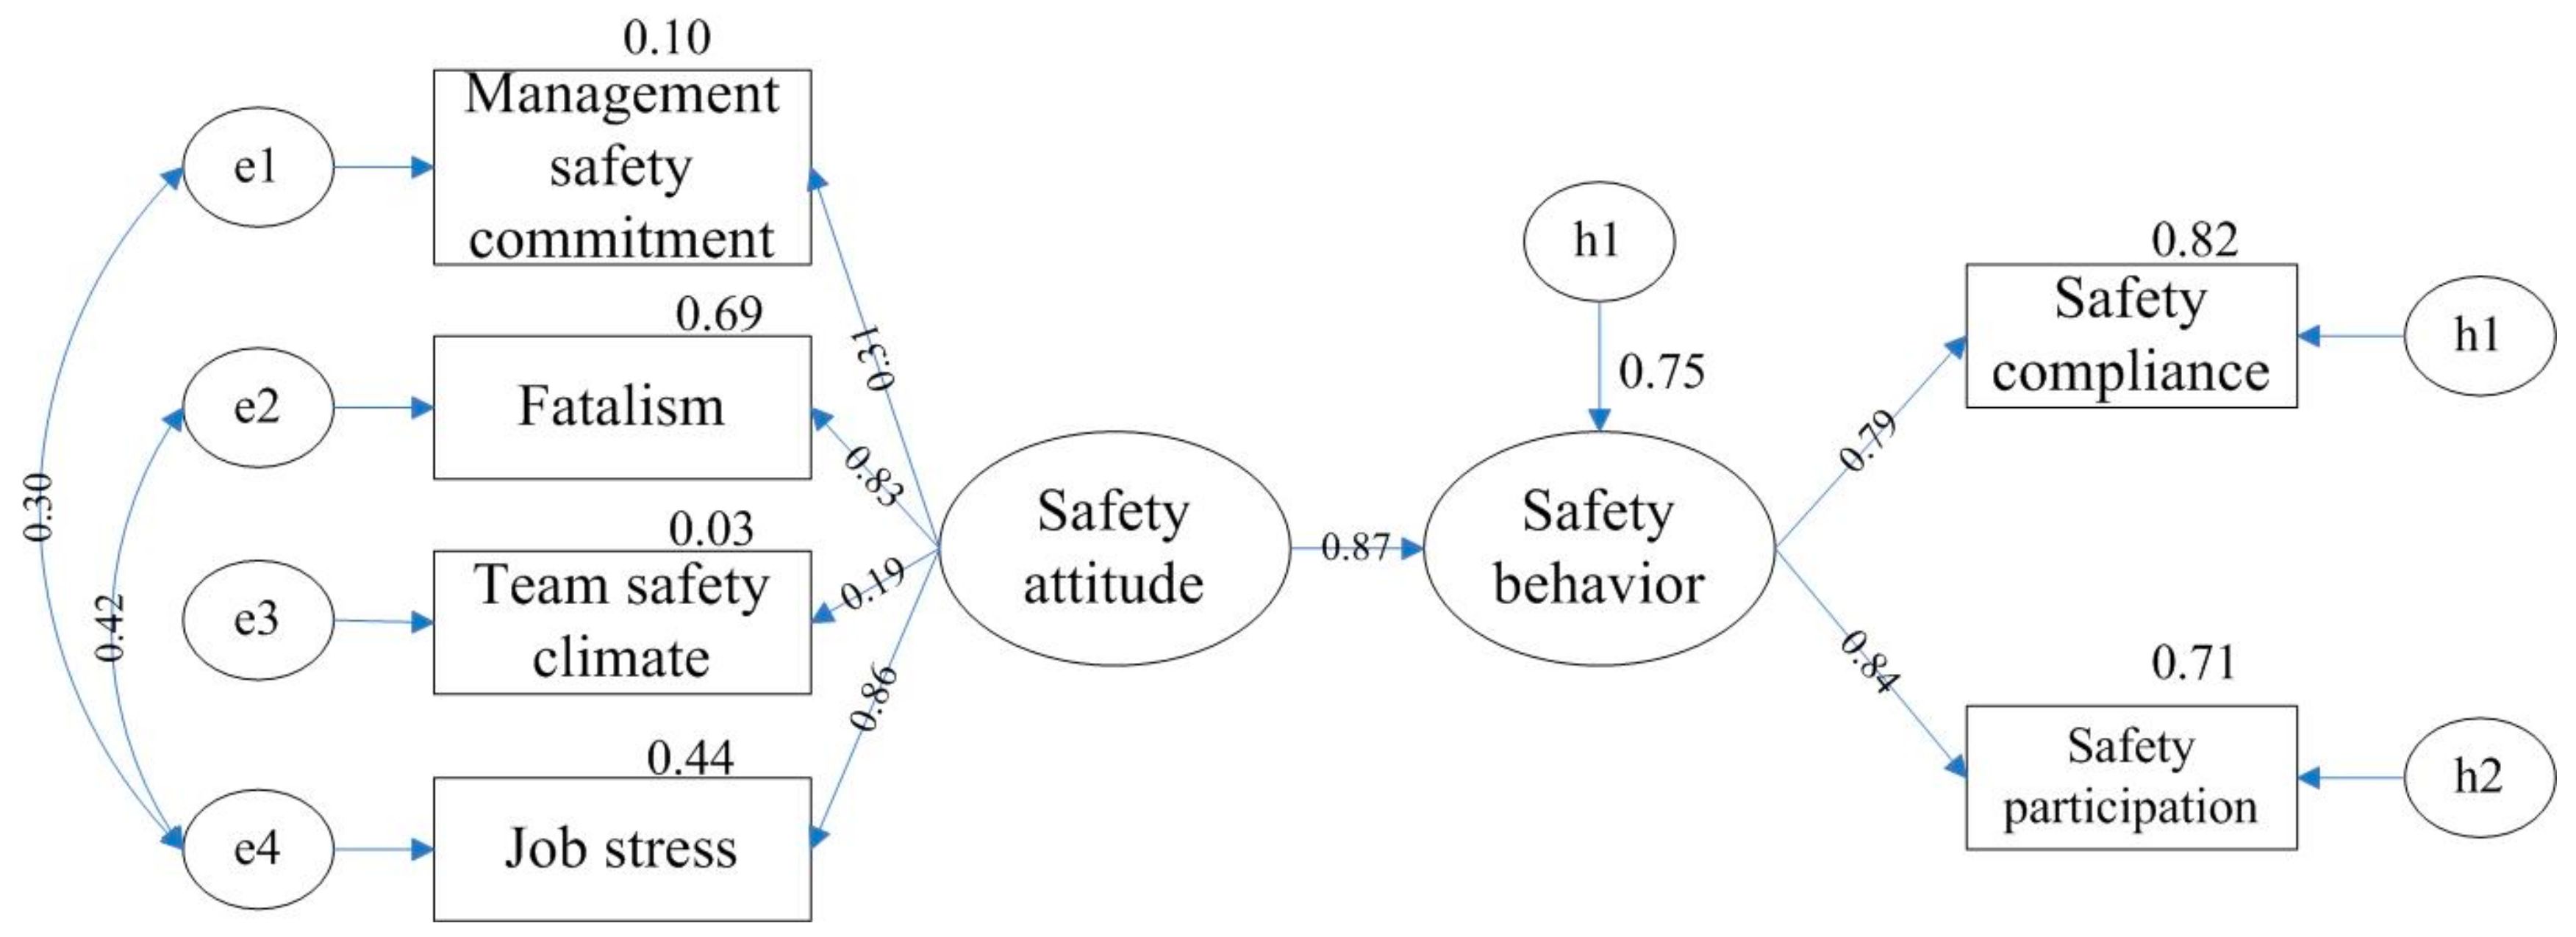
On the basis of previous research, AMOS v22.0 (International Business Machines Corporation, New York, NY and USA) was used to draw the two initial models shown in Figure 1 and Figure 2. The first initial model regards safety attitude as an extrinsic variable and safety behavior as an exogenous variable. In the second initial model, safety attitude is an extrinsic variable, and safety compliance and safety participation are exogenous variables.

4.2.2. Evaluation of the Two Initial Structural Models

The structural equation models were evaluated by their d.f. values. If d.f. = 8 > 0, then the model is over-identified and needs to be modified. The "violation estimate" and an evaluation of the overall model fit are needed to modify the model.
1. “Violation estimate” test
The error variances of all indicators were significant (p = 0.000). The normalized path coefficients of the two initial models are shown in Table 2 and Table 3.

5. Evaluation of the Overall Model Fit

The overall model fit between safety attitude and safety behavior was evaluated. The analysis indicated that χ2 / d . f . = 22.83 (χ2 = 182.62, d.f. = 8), which is much higher than the ideal value (<3.00); NFI = 0.85, TLI = 0.72, and CFI = 0.85 are lower than the acceptable value (>0.90), and RMSEA = 0.19 is far from the acceptable value (<0.08). The fitness index of the model did not meet the requirements for the ideal model. Therefore, the initial model did not match the data and needed to be modified.
Correspondingly, the initial model of the impact of safety attitude on SP and SC was evaluated. The results indicated that χ2 / d . f . = 9.15 (χ2 = 302.08, d.f. = 33), which is significantly different from the acceptable value (<3). In addition, RMSEA = 0.12 is far from the acceptable value (<0.08). The other indicators (NFI = 0.89, TLI = 0.86, and CFI = 0.90) were acceptable but not ideal. Therefore, this model needed to be amended.

6. Modification of the Model

Although the above analysis confirmed the fit of the internal structure of the model, the overall fitness index value of the initial structural model did not meet the requirements. Since the CR of the path coefficient reached a significant level, the main modifications were applied to the two initial models on the basis of the modified index (MI) value. The MI values are shown in Table 4 and Table 5.
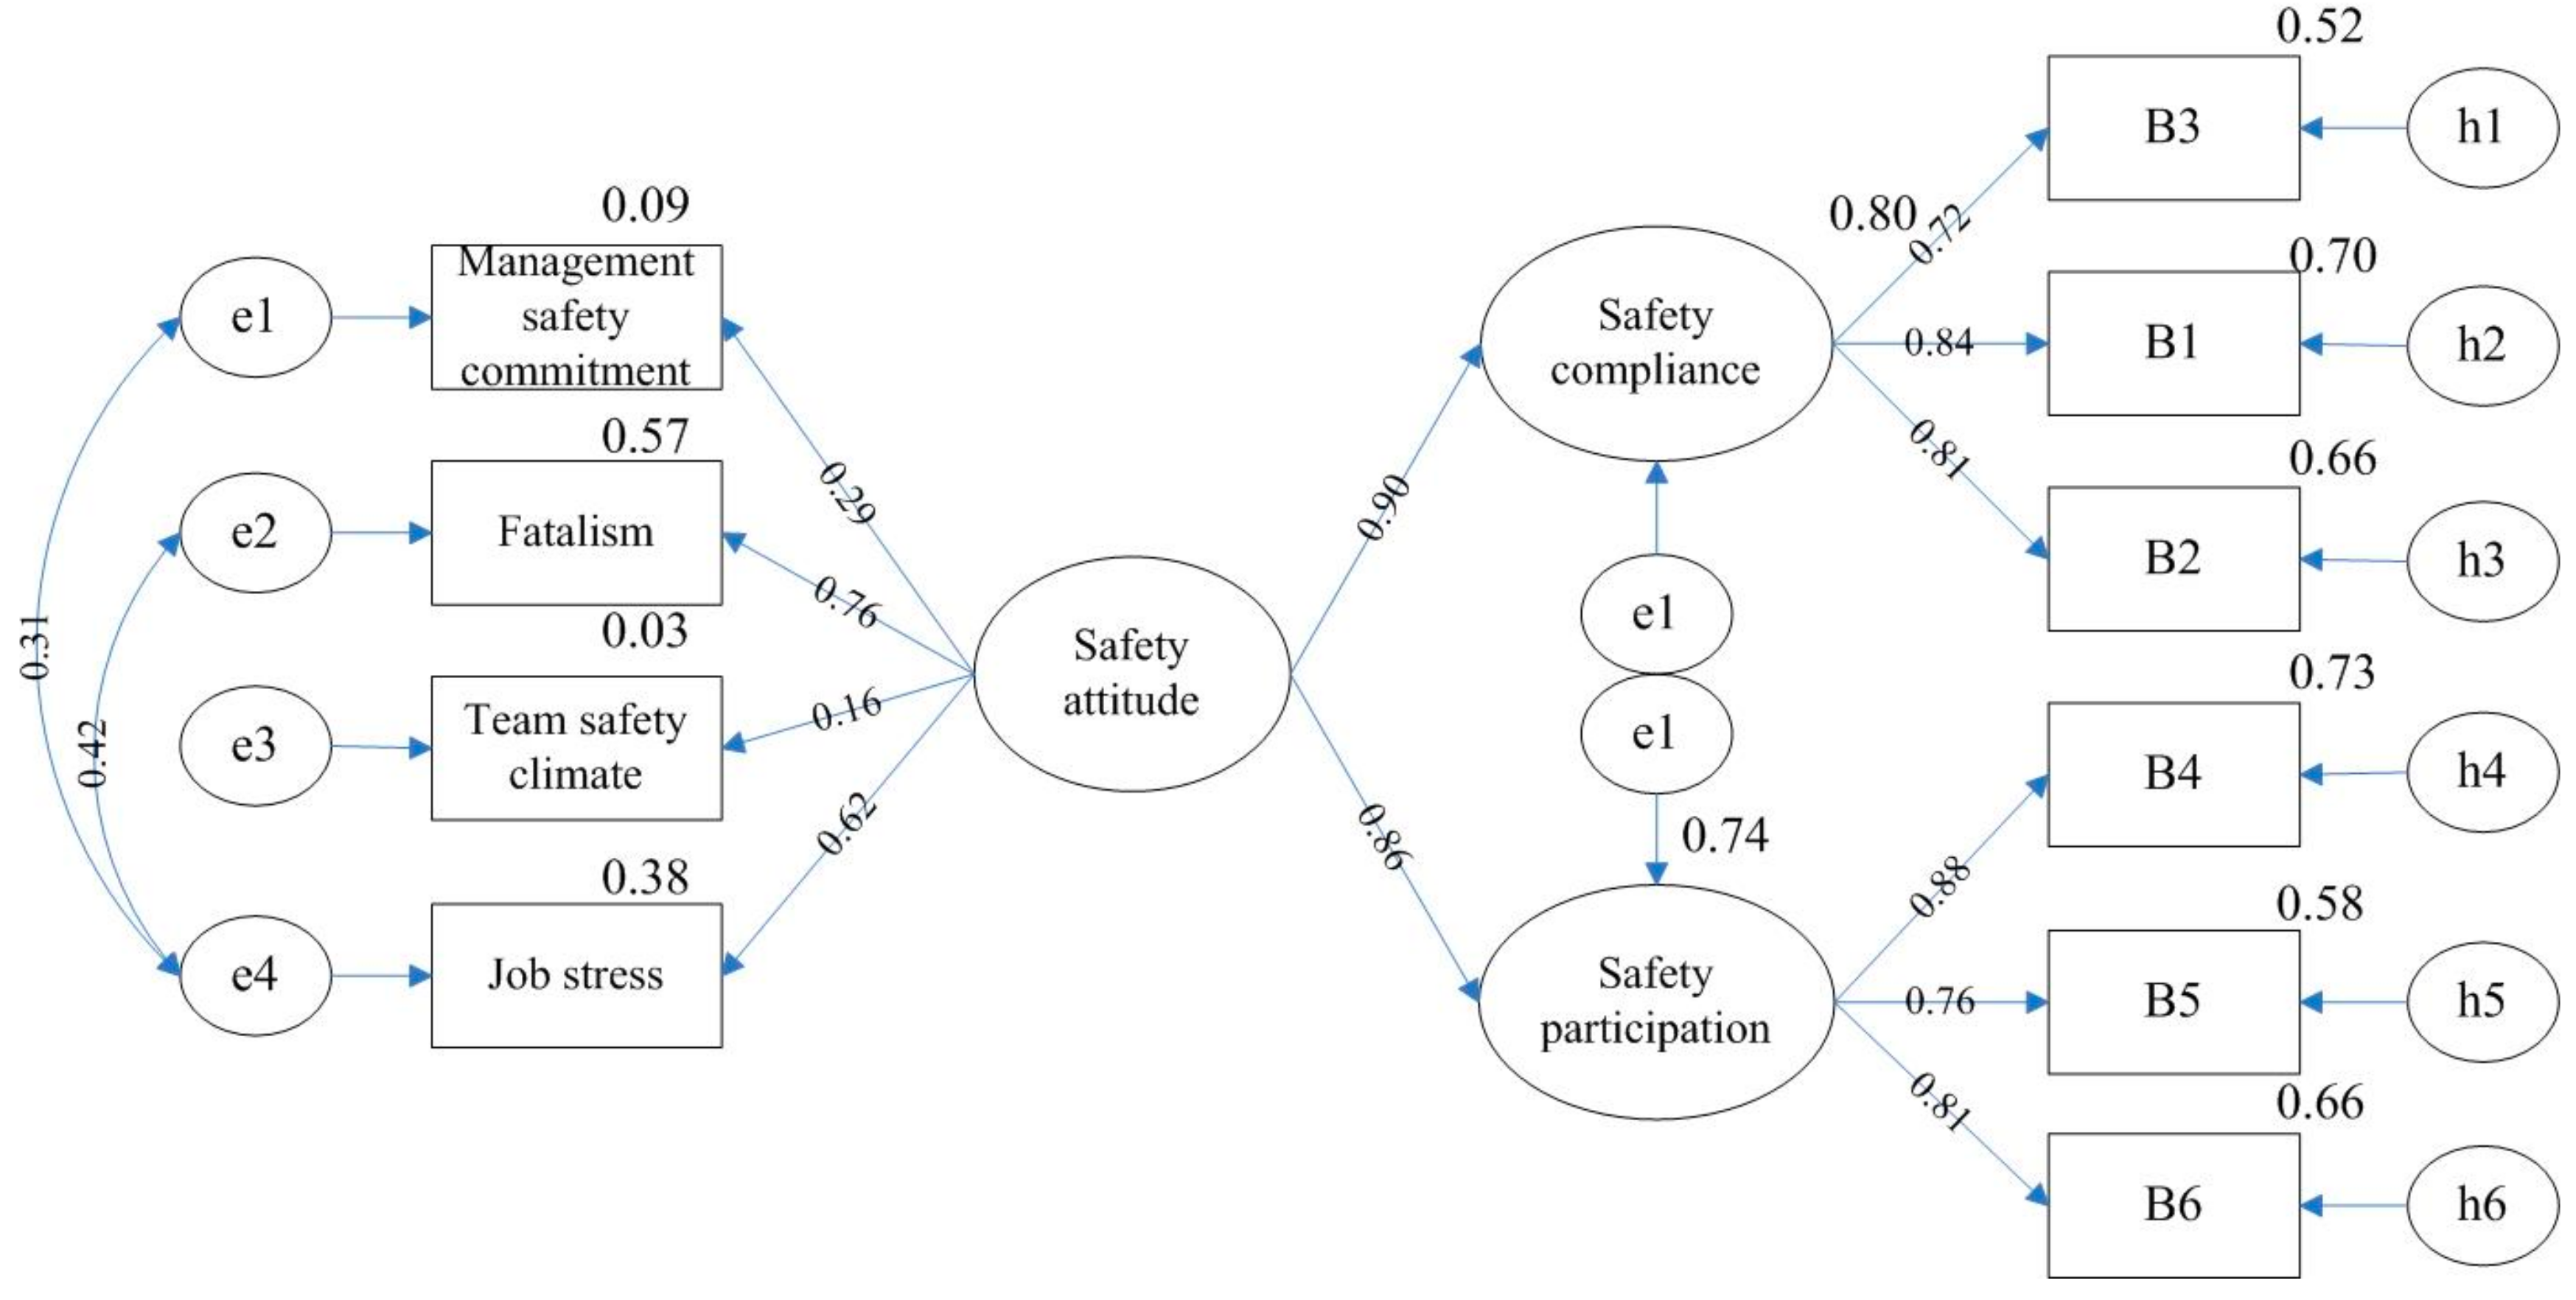
From the modified index table, a path was added in each revision process to verify the overall fitness of the model. According to the revised indicators obtained from the validation results, the path relations e2 and e4 were first added to the initial model of the relationship between safety attitude and safety behavior. The results showed that χ2 / d . f . = 9.36. Although χ2 / d . f . had been greatly reduced, it had not yet reached an acceptable level. After the path relations e1 and e4 were added in the above model, all indicators of the model reached an acceptable level, as illustrated in Table 6. The revised model is illustrated in Figure 3.
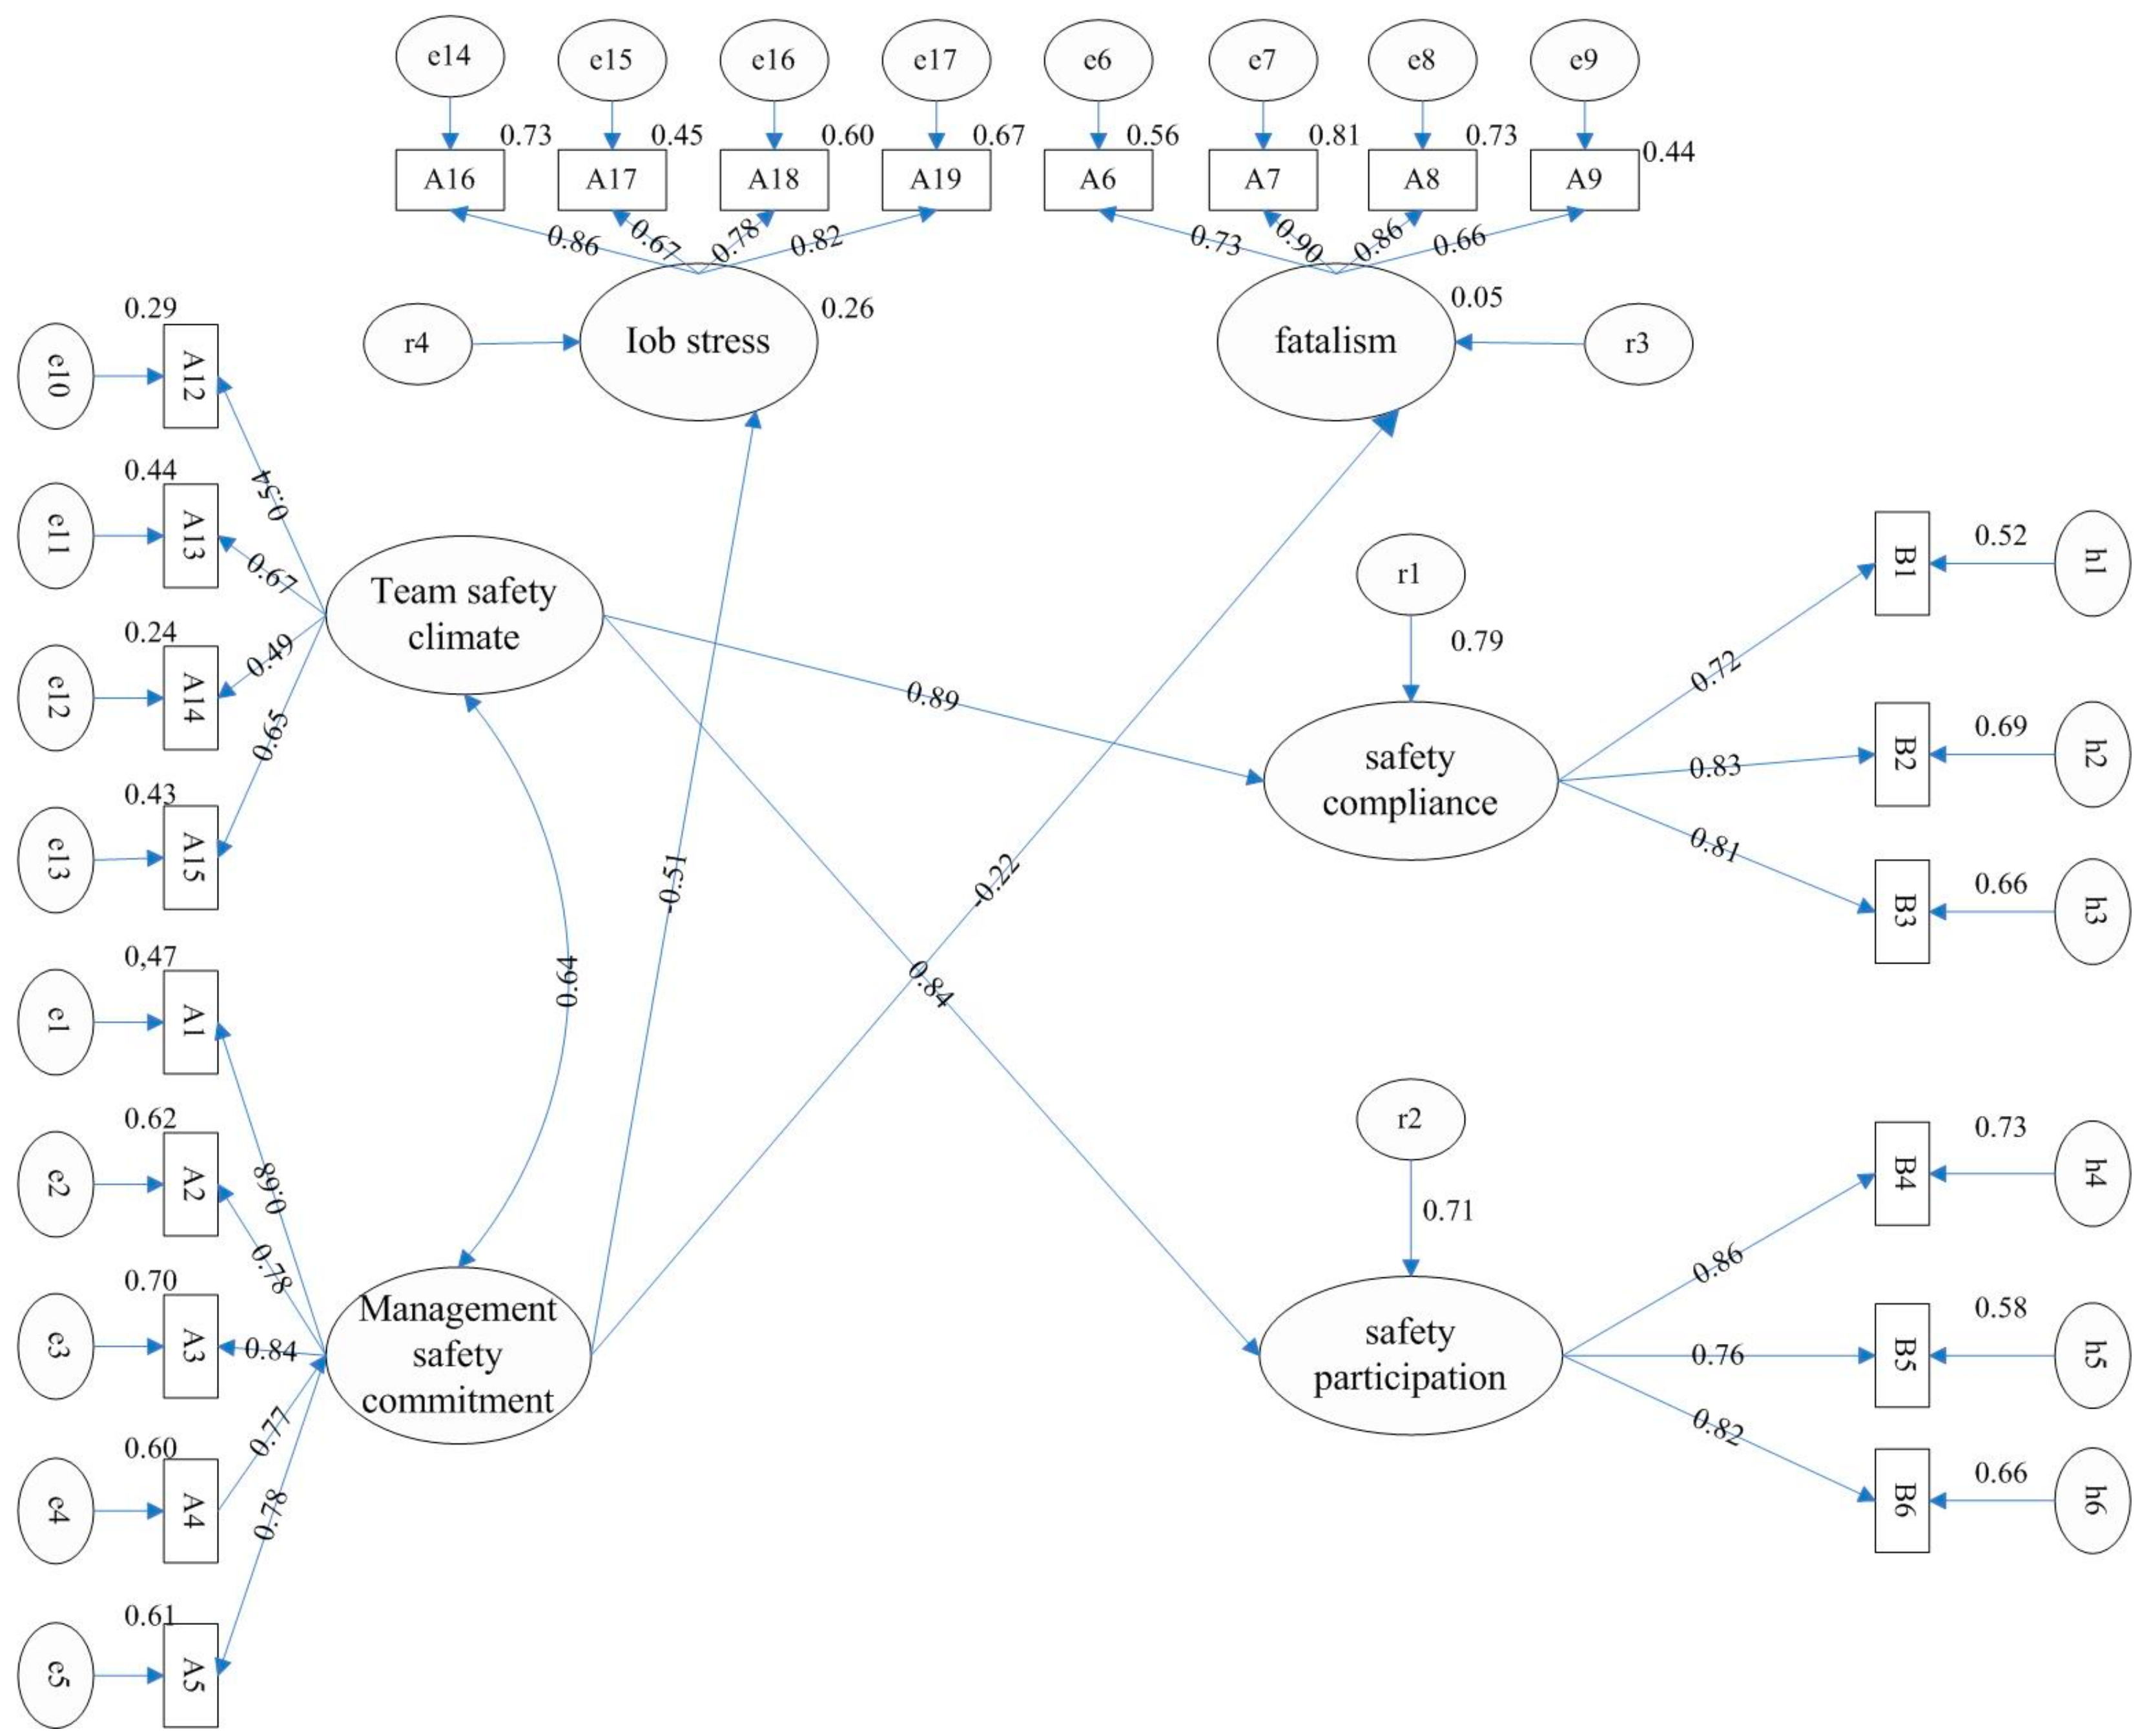
For the model of the impact of safety attitude on SC and SP, the path relations e2 and e4 and the path relations e1 and e4 were added. The results indicated that χ2 / d . f . = 3.64, which differs slightly from the ideal level (<3), and the other indicators were acceptable. Thus, the modified model was considered acceptable, as illustrated in Table 7. The revised model is illustrated in Figure 4.

6.1. Analysis of the Relationship between Safety Attitude and Safety Behavior

The parameters of the model of the relationship between safety attitude and safety behavior, as well as the path coefficients of the impact of safety attitude on SC and SP, are illustrated in Table 8. The analysis results showed that safety attitude was positively correlated with safety behavior, safety compliance, and safety participation. Therefore, H1, H2a, and H2b were verified.

6.2. The Impact of the Four Dimensions of Safety Attitude on SC and SP

6.2.1. Establishing the Initial Model of the Relationship between the Four Dimensions of Safety Attitude and Two Kinds of Safety Behavior

When constructing the structural model, management safety commitment and team safety climate were regarded as exogenous variables of fatalism and job stress, as well as exogenous variables of the two kinds of safety behavior. Fatalism, job stress, SC, and SP were endogenous variables. At the same time, fatalism and job stress were regarded as exogenous variables of SC and SP, and the two kinds of safety behavior were considered endogenous variables. On the basis of previous research, AMOS v22.0 was used to carry out structural equation analysis for hypotheses testing. The initial model is shown in Figure 5.
The maximum likelihood method was used to analyze the initial model. The result indicated that all error variance was positive, but the path coefficient of SC ← TSC was 1.09 > 1. Thus, the model needed to be revised. The normalized path coefficients of the model are illustrated in Table 9.

6.2.2. Modification of the Model

In the initial model, the path coefficient of SC ← TSC was 1.09 > 1, so the model needed to be modified. Path coefficients greater than one can result from a small sample size, few indicators of potential variables, sampling problems, and model definition, among other factors. The solution is usually to merge highly relevant concepts or delete paths. The path coefficients are illustrated in Table 10.
From the above results, the CR of the paths F ← TSC, JS ← TSC, SC ← JS, SC ← F, SP ← JS, SP ← F, and SP ← MSC were all less than 1.96 and thus not significant, so these paths were deleted. Thus, H3b, H5a, H5b, H6a, H6b, H8a, and H8b are not valid.
The maximum likelihood method was again used for the data analysis. The path coefficient of SC ← TSC was 1.02 and thus still exceeded one, indicating that the model needed to be revised again. The path coefficient of SC ← MSC was negative, which indicated a negative correlation between management safety commitment and safety compliance. Since this finding is contrary to the assumption, this path was deleted. Correspondingly, H3a is not verified.
After deleting the path SC ← MSC, the error variances of all indicators were positive and significant. Further, the normalized path coefficients were less than one. The normalized path coefficients of the revised structural model are illustrated in Table 11. Thus, the model did not have a “violation estimate”.

6.2.3. The Overall Model Fit Evaluation of Revised Structural Model

In the initial model, the path coefficient of SC ← TSC was 1.09 > 1, so the model needed to be modified. Path coefficients greater than one can result from a small sample size, few indicators of potential variables, sampling problems, and model definition, among other factors. The solution is usually to merge highly relevant concepts or delete paths. The path coefficients are illustrated in Table 10.
The analysis result showed that χ2 / d . f . = 3.26. Since this only slightly differed from the ideal value (<3) and the other indicators met the acceptable levels, the revised model was accepted. The specific results are illustrated in Table 12. The modified model is illustrated in Figure 6.

6.2.4. Analysis of the Relationship between the Four Dimensions of Safety Attitude and the Two Kinds of Safety Behavior

According to the analysis results, team safety climate was positively correlated with both SC and SP. Therefore, H4a and H4b are verified. The negative correlation between management safety commitment and fatalism verifies H7a. Management safety commitment was negatively correlated with job stress, so H7b is verified. The correlation between safety attitude and safety behavior is shown in Table 13.

6.3. The Impact of Sociodemographic Variables on Safety Attitude and Safety Behavior

This section investigates the influence of demographic variables on safety attitude and behavior of coal miners. The demographic characteristics mainly include age, length of service and education level. The statistics and distribution of the demographic characteristics of the sample were shown in Table 14.

6.3.1. The Influence of Age on Safety Attitude and Safety Behavior

The total number of subjects with no missing value in age, safety attitude and safety behavior items were 574. According to different age intervals, participants were divided into four groups to investigate the impact of age on safety attitude and safety behavior. Since age was divided into more than two groups, one-way analysis of variance (ANOVA) was used [38]. The results showed that the average score of safety attitude and safety behavior was 60.4184, 61.9396, 64.9487, and 59.0909 and 25.5727, 25.3758, 25.0513, and 24.2720 for the age groups 21–30, 34–40, 41–50, and 51–60 years, respectively. For safety attitude, the 31–40-year-old group had the highest average score, and the 51–60-year-old group had the lowest; for safety behavior, the 21–30-year-old group had the highest average score, and the 51–60-year-old group had the lowest. Variance analysis of the impact of age on safety attitude and safety behavior was shown in Table 15.
According to the results of the variance analysis, only the F-test of safety attitude reached a significant level (p = 0.005 < 0.05), indicating that the overall safety attitude of coal miners varied for different ages. The specific difference between the two age groups still needed post hoc analysis. The F-test of safety behavior was not significant (p = 0.494 > 0.05), indicating that there was no difference in safety behavior among coal miners of different ages.
The homogeneity of variance test of safety attitude for different ages (p = 0.03 < 0.05) indicated significance; thus, the variance of safety attitude data was not homogeneous. In this study, Tamhane’s T2 method was used for post hoc analysis, and the results revealed that only the first and third age groups differed in safety attitude, and the average difference between the first and second groups was −4.53032* (* indicates p < 0.05). This showed that the safety attitude differed between the 21–30 and 41–50 age groups; in particular, the safety attitude level of the 41–50 age group was higher than that of the 21–30 age group.
Wu Minglong pointed out that the significance of the difference between dependent variables in different groups according to the variance analysis is a statistical significance [38]. To analyze the actual significance, we calculated the association strength ω2. If ω2 < 0.059, then the independent variable and dependent variable have a low correlation; if ω2 > 0.138, then the independent variable and dependent variable have a high correlation. If ω2 is between 0.059 and 0.138, then the independent variable and dependent variable have a low correlation.
With age as the independent variable and safety attitude as the dependent variable, a single-factor program was carried out to determine the association strength ω2 between age and safety attitude. The results showed the association strength of ω2 = 0.017. Thus, age had a low correlation with safety behavior.

6.3.2. The Influence of the Length of Service on Safety Attitude and Safety Behavior

The total number of subjects with no missing value in the length of service, safety attitude, and safety behavior items were 566. Since participants were divided into four groups according to the length of service, one-way ANOVA was used. The results showed that the average score of safety attitude and safety behavior was 59.0734, 61.6176, 61.7500, and 62.9524 and 25.1560, 25.2549, 25.3516, and 25.8912 for the length of service groups one to two, three to four, five to six, and seven years and above, respectively. For safety attitude, the seven years and above group had the highest average score, and the one to two years group had the lowest; for safety behavior, the seven years and above group had the highest average score, and the one to two years group had the lowest. Variance analysis of the impact of length of service on safety attitude and safety behavior was shown in Table 16.
According to the variance analysis, only the overall difference in the safety attitude of coal miners with different lengths of service was significant. Thus, there was a difference in the safety attitude level between at least two groups of coal miners. The overall difference in the safety behavior of coal miners with different lengths of service was not significant, so there was no difference in the level of safety behavior between coal miners with different lengths of service.
The homogeneity of variance test of the safety attitude of workers with different lengths of service (p = 0.00 < 0.05) indicated significance, so the variance of safety attitude data did not have homogeneity. In this study, the Game–Howell method was used as the post hoc analysis method. According to the results of the post hoc analysis, only group one and group four differed in safety attitude, and the average difference between group one and group four was −3.87899* (* indicates p < 0.05). This result showed that there were differences in safety attitude between the group with one to two years of service and the group with seven years of service or more, with the safety attitude score of the latter group higher than that of the former group.
With the length of service as the independent variable and the safety attitude as the dependent variable, a single-factor program was carried out to determine the association strength ω2 between the length of service and the safety attitude. The results indicated that the association strength ω2 = 0.010. Therefore, there was a low correlation between length of service and safety attitude.

6.3.3. The Impact of Education Level on Safety Attitude and Safety Behavior

The total number of subjects with no missing value in education level, safety attitude, and safety behavior items was 566. According to the analysis results, the highest education level attained by most subjects in this study was high school or secondary school, with 61.9% of participants below the level of undergraduate or junior college. Most coal miners are migrant workers with a weak safety awareness [3], they had a low level of education.
The education level of coal miners was divided into four groups. Therefore, one-way ANOVA were used. The results showed that the average score of safety attitude (for safety attitude, the scores of all items were added after reverse scoring; the calculation method for safety behavior scores was the same as that used for safety attitude) was 62.3333, 63.7456, 61.0866, and 60.5972, and the average score of safety behavior was 24.5000, 25.4298, 25.1602, and 25.5926 for individuals with primary education, secondary education, high school education, and a bachelor’s degree, respectively. Variance analysis of the impact of education level on safety attitude and safety behavior was shown in Table 17.
Although the average scores of safety attitude and safety behavior of the four education levels differed, according to the results of variance analysis, for the two dependent variables (safety attitude and safety behavior), the overall F-values were 2.397 (p = 0.061 > 0.05) and 0.624 (p = 0.600 > 0.05), which do not reach the significance level. Thus, there was no difference in the safety attitude or behavior among coal miners with different education levels.
The results of analyzing the impact of demographic characteristics on the safety attitude and safety behavior of coal miners showed that age and length of service were slightly related to safety attitude, and the education level was not significantly related to safety attitude. None of the demographic characteristics had an impact on safety behavior. Thus, H9a is partially verified, and H9b is not verified.
The results also showed that the safety attitude score of the 21–30 age group was lower than that of the 41–50 age group. For the length of service, the safety attitude level of coal miners with one to two years of service was significantly lower than that of miners with seven years of service or more. These results are similar to those of Siu [29]. The longer the employee has worked, the more experienced they are, so they attach greater importance to safety. Similarly, the older they are, the more stable they become, and the greater the importance they attach to safety.

7. Discussion

7.1. Findings and Implications

This study aims to investigate the impact of safety attitude on the Safety Behavior of Coal Miners in China, explore the relationship between four dimensions of safety attitude and two types of safety behavior. The seven hypotheses of this study were generally validated, although some connections have proven to be insignificant. The seven hypotheses of this study were generally validated, including H1, H2a, H2b, H4a, H4b, H7a, and H7b. H9a is partially verified, and other hypotheses have not been verified. The results indicated that safety attitude is significantly positively correlated with safety behavior, which is similar to the study of Shin and Baser [4,10]. This suggests that coal miners with a good safety attitude tend to exhibit safe behavior. Therefore, changing coal miners’ safety attitudes is of vital importance for promoting their safety behavior. Then the result indicated that safety attitude is also positively related to safety compliance and safety participation, which is slightly different from the study of Fugas [24]. Fugas thought that safety attitude had a directly effect on safety participation, and indirectly affects safety compliance through perceived behavior control. The possible explanation is that safety participation is an active safety behavior, which is more related to safety attitude, and safety compliance is more related to the compliance with safety regulations. Safety compliance ensures the control and strict enforcement of rules, and safety participation allows workers to take active action to ensure workplace safety. However, this study only explored the relationship between safety attitudes to safety participation. Whether the safety attitude indirectly predicted safety compliance by some moderator has not been verified, and further research is needed. However, when studying the impact of the four dimensions of coal miners’ safety attitude on SC and SP, not every dimension was found to be related to these two variables. The result indicated that team safety climate as an internal factor of safety attitude has a significant correlation with SC and SP. A good team safety climate can improve the safety behavior of coal miners. This finding has also been verified in the study of Schwatka and Roseclance [26]. Most studies have pointed out that the safety climate not only directly affects safety behavior [39] but also mediates the effects of other variables, such as job stress and safety awareness [40]. The result of this study indicated that creating a good safety climate can effectively promote the safe behavior of coal miners. Besides, as the external factor of safety attitude, management safety commitment was negatively related to the internal cause of safety attitude, such as fatalism and job stress. Managers care about the safety of miners, communicate with miners frequently, and provide safety equipment and facilities for miners will reduce the working pressure of miners and reduce their fatalism. It plays an important role in accident prevention.
However, this study did not reveal any impacts of the internal factors of safety attitude (job stress, fatalism) on safety behavior. This is quite different from the results of previous studies. Previous studies have indicated that job stress will directly affect an employee’s safety behavior and can make them extremely prone to accidents [28,40]. Also, a fatalist employee lacks control over risk perception and reduces proactive safety behavior, which is inconsistent with the result of this study. In addition, the result indicated that management safety commitment was insignificant correlated with safety participation, was negatively related to safety compliance. It is different from the finding of Rundmo and Zhang [18,25]. The difference may be attributed to different respondents, different safety management levels, different safety cultures in coal mines, and different dimensions of safety attitude, all of which may contribute to the variation in the results of different studies.
This study also explored the impact of demographic characteristics on the safety attitude and safety behavior of coal miners. The results show that age and length of service have a low relationship with safety attitude, whereas the education level is not significantly related to safety attitude. Siu also indicated that safety attitude was correlated with age, with older workers exhibiting more positive attitudes toward safety [29]. Therefore, in safety management, safety education and training should be strengthened for young employees with shorter lengths of service [13]. Older miners can provide guidance and supervision to younger miners to correct their safety attitude and promote their safety behaviors. In addition, younger miners should be allowed to work in positions with lower risk to reduce the occurrence of accidents. The results also indicate that the age, length of service, and education levels of coal miners have no significant relationship with on their safety behaviors. This result is different from Caffaro, who thought that length of services reduced the unsafe behaviors. It may be attributing to different research samples. Therefore, it is necessary to further study which demographic characteristics of coal mines have an impact on the safety behavior of coal miners. Thus, the positions and tasks of groups with different demographic characteristics can be adjusted to effectively prevent accidents.
This study used the SAQ and SBQ to measure the safety attitude and safety behavior of coal miners in Shanxi, Inner Mongolia, and Anhui Provinces. The analysis of the collected data indicates relatively good safety attitudes and safety behaviors of the respondents. However, many areas can be improved. First, communication with miners and the feedback provided to miners’ thoughts are still inadequate. The second problem is inadequate protective equipment provided by managers to miners. Third, to complete tasks quickly, miners’ improper operations and unsafe behaviors are not always discouraged or stopped by colleagues or managers. Furthermore, the poor working environment underground increases the job stress of miners. Most importantly, some miners still believe that an accident cannot be prevented.
The above analysis has practical implications for coal miners’ managers. First, the safety attitude and safety behavior of managers will improve the attitudes and behaviors of employees. Second, managers should frequently communicate with employees, understand their needs, and provide them corresponding protection. Praising and rewarding employees with good safety behavior will be a good approach to motivating miners. Third, when employees believe that improper operations can complete tasks quickly and will not lead to accidents, employees have a high probability of performing operations improperly and unsafely. Miners who conduct improper operations without reprimand will induce other miners to break the rules. Therefore, safety training is needed to ensure that miners recognize the impact of their colleagues’ improper operations on their own safety and create a good climate in which miners care about each other’s safety, thereby promoting their safe behaviors. Most importantly, it is necessary to strengthen the safety education of younger miners and popularize the viewpoint that safety measures can prevent accidents. Miners are more confident that the measures they take to prevent accidents are more effective than the measures taken by managers. Therefore, coal miners should be encouraged to take the initiative to participate in accident prevention. Finally, the harsh environment underground increases the job stress of miners. Improving the working environment will be a good approach to reducing the job stress of coal miners. Coal mines should offer incentives to promote the active participation of miners in safe operations.

7.2. Limitations

Several limitations of the study need to be mentioned. First, cross-section design cannot explain the causal mechanism between the safety attitude and safety behavior accurately. Longitudinal studies will need to further confirm the result. Then, most of the subjects were from Shanxi and Inner Mongolia Provinces. Future research needs to expand the areas from which respondents are recruited and increase the sample size, along with the strict selection of only valid samples and the use of self-reported questionnaires may lead to social desirability bias. However, due to the guarantee of anonymity and confidentiality, social desirability bias was expected to be relatively low. Additionally, the study is based primarily on quantitative methods. Consideration should be given to using qualitative methods to explore the relationship between safety attitudes and safety behaviors. This study indicates that the internal factors of safety attitude (job stress, fatalism) are not significantly related to the safety behavior of coal miners. The result indicates that management safety commitment is not positively related to SP and SC. These finding differs from previous research results [18,28]. Thus, future research should consider the impact of management safety commitment, job stress, or fatalism on safety behavior from the perspective of safety attitude by undertaking case studies. In addition, this study shows that the age, length of service and education level of miners had no correlation with their safety behaviors. Future research is supposed to consider the particularity of miners and investigate the impact of its demographic characteristics on safety behavior.

8. Conclusions

This survey used the SAQ and SBQ to measure the safety attitude and safety behavior of coal miners in Shanxi, Inner Mongolia, and Anhui Provinces. Then, the impact of safety attitude on safety behavior was investigated. The major conclusions and implications are as follows.
This study contributes to the current literature about safety attitude by exploring its relationship with safety behavior in coal mining industry. The results show that safety attitude is not only positively correlated with safety behavior but also positively related to SC and SP. A structural model of the impact of the four dimensions of safety attitude on SC and SP was constructed, and the results indicate that only team safety climate is positively correlated with SC and SP, while the correlations between the other dimensions of safety attitude and the two kinds of safety behavior were not significant. In addition, team safety climate is not significantly related to fatalism or job stress. The manager’s safety commitment is negatively correlated with fatalism and job stress. The impact of age, length of service, and education level on safety attitude and safety behavior was also analyzed. The results indicate that age and length of service were slightly correlated with safety attitude, and the education level was not significantly related to safety attitude. Age, length of service, and education level had no significant relationship with safety behavior. Based on the above results, it is recommended to build a good team safety climate to improve the safety attitude and safety behavior of coal miners. Practical implications emphasize safety training and safety education, especially for young miners. Managers are required to strengthen safety commitment, provide adequate safety equipment, communicate with miners in time and promote miners to discuss with colleagues in safety education and safety training, which will be of great significance for the improvement of safety behavior and accident prevention in the coal mining industry.

Author Contributions

Conceptualization, Y.L., X.W. and W.Y.; Methodology, X.W. and Y.L.; Software, W.Y. and X.L.; Validation, W.Y. and X.L.; Formal Analysis, W.Y. and X.L.; Investigation, X.W. and Y.L.; Resources, Y.L.; Data Curation, X.W. and X.L.; Writing-Original Draft Preparation, Y.L.; Writing-Review & Editing, Y.L., X.W. and J.G.; Visualization, Y.L. and J.G.; Supervision, X.W.; Project Administration, X.W.; Funding Acquisition, X.W.

Funding

This research was funded by [the MOE (Ministry of Education in China) Project of Humanities and Social Sciences] grant number [18YJCZH191]; [Fundamental Research Funds for the Central Universities of China] grant number [2-9-2017-077].

Conflicts of Interest

The authors declare no conflict of interest.

References

  1. Donald, I.; Canter, D. Employee attitudes and safety in the chemical industry. J. of Loss Prevent. Process. Ind. 1994, 7, 203–208. [Google Scholar] [CrossRef]
  2. Heinrich, H.W. Industrial Accident Prevention. A Scientific Approach. Ind. Lab. Relat. Rev. 2011, 4, 609. [Google Scholar]
  3. Wang, C.; Wang, J.; Wang, X.; Yu, H.; Bai, L.; Sun, Q. Exploring the impacts of factors contributing to unsafe behavior of coal miners. Saf. Sci. 2019, 115, 339–348. [Google Scholar] [CrossRef]
  4. Shin, M.; Lee, H.-S.; Park, M.; Moon, M.; Han, S. A system dynamics approach for modeling construction workers’ safety attitudes and behaviors. Accid. Anal. Prev. 2014, 68, 95–105. [Google Scholar] [CrossRef] [PubMed]
  5. Henning, J.B.; Stufft, C.J.; Payne, S.C.; Bergman, M.E.; Mannan, M.S.; Keren, N. The influence of individual differences on organizational safety attitudes. Saf. Sci. 2009, 47, 337–345. [Google Scholar] [CrossRef]
  6. Burke, M.J.; Sarpy, S.A.; Tesluk, P.E.; Smith-Crowe, K. General safety performance: A test of a grounded theoretical model. Pers. Psychol. 2010, 55, 429–457. [Google Scholar] [CrossRef]
  7. Lee, H.K.; Halim, H.A.; Thong, K.L.; Chai, L.C. Assessment of Food Safety Knowledge, Attitude, Self-Reported Practices, and Microbiological Hand Hygiene of Food Handlers. Int. J. Environ. Res. Pub. Health 2017, 14, 14. [Google Scholar] [CrossRef]
  8. Lu, C.-S.; Hsu, C.-N.; Lee, C.-H. The Impact of Seafarers’ Perceptions of National Culture and Leadership on Safety Attitude and Safety Behavior in Dry Bulk Shipping. Int. J. e-Navig. Marit. Econ. 2016, 4, 75–87. [Google Scholar] [CrossRef]
  9. Baser, F.; Ture, H.; Abubakirova, A.; Sanlier, N.; Cil, B. Structural modeling of the relationship among food safety knowledge, attitude and behavior of hotel staff in Turkey. Food Control. 2017, 73, 438–444. [Google Scholar] [CrossRef]
  10. Zhang, S.; Shi, X.Z.; Wu, C. Measuring the effects of external factor on leadership safety behavior: Case study of mine enterprises in China. Saf. Sci. 2017, 93, 241–255. [Google Scholar] [CrossRef]
  11. Coal Mine Safety Monitoring News. Available online: http://www.chinacoal-safety.gov.cn/xw/mkaqjcxw/201909/t20190929_337153.shtml (accessed on 29 September 2019).
  12. Loosemore, M.; Malouf, N. Safety training and positive safety attitude formation in the Australian construction industry. Saf. Sci. 2019, 113, 233–243. [Google Scholar] [CrossRef]
  13. Ram, T.; Chand, K. Effect of drivers’ risk perception and perception of driving tasks on road safety attitude. Transp. Res. Part. F-Traffic Psychol. Behav. 2016, 42, 162–176. [Google Scholar] [CrossRef]
  14. Warmerdam, A.; Newnam, S.; Wang, Y.; Sheppard, D.; Griffin, M.; Stevenson, M. High performance workplace systems’ influence on safety attitudes and occupational driver behaviour. Saf. Sci. 2018, 106, 146–153. [Google Scholar] [CrossRef]
  15. Cox, S.; Cox, T. The structure of employee attitudes to safety: A European example. Work Stress 1991, 5, 93–106. [Google Scholar] [CrossRef]
  16. Haerkens, M.; van Leeuwen, W.; Sexton, J.B.; Pickkers, P.; van der Hoeven, J.G. Validation of the Dutch language version of the Safety Attitudes Questionnaire (SAQ-NL). BMC Health Serv. Res. 2016, 16, 8. [Google Scholar] [CrossRef] [PubMed]
  17. Zhang, J.; Chen, N.; Fu, G.; Yan, M.; Kim, Y.-C. The Safety Attitudes of Senior Managers in the Chinese Coal Industry. Int. J. Environ. Res. Public Health 2016, 11, 1147. [Google Scholar] [CrossRef]
  18. Wu, X.; Yin, W.; Wu, C.; Li, Y. Development and validation of a safety attitude scale for coal miners in China. Sustainability 2017, 12, 2165. [Google Scholar] [CrossRef]
  19. Clarke, S.; Ward, K. The role of leader influence tactics and safety climate in engaging employees’ safety participation. Risk Anal. 2010, 26, 1175–1185. [Google Scholar] [CrossRef]
  20. Christian, M.S.; Bradley-Geist, J.C.; Wallace, C.; Burke, M. Workplace safety: a meta-analysis of the roles of person and situation factors. J. Appl. Psychol. 2009, 94, 1103–1127. [Google Scholar] [CrossRef]
  21. Dearmond, S.; Smith, A.E.; Wilson, C.L.; Chen, P.Y.; Cigularov, K.P. Individual safety performance in the construction industry: Development and validation of two short scales. Acc. Anal. Prev. 2011, 43, 948–954. [Google Scholar] [CrossRef]
  22. Neal, A.; Griffin, M.A.; Hart, P.M. The impact of organizational climate on safety climate and individual behavior. Saf. Sci. 2000, 34, 99–109. [Google Scholar] [CrossRef]
  23. Fugas, C.S.; Silva, S.A.; Meliá, J.L. Another look at safety climate and safety behavior: Deepening the cognitive and social mediator mechanisms. Acc. Anal. Prev. 2012, 45, 468–477. [Google Scholar] [CrossRef] [PubMed]
  24. Rundmo, T. Safety climate, attitudes and risk perception in Norsk Hydro. Saf. Sci. 2000, 34, 47–59. [Google Scholar] [CrossRef]
  25. Schwatka, N.V.; Rosecrance, J.C. Safety climate and safety behaviors in the construction industry: The importance of co-workers commitment to safety. Work 2016, 54, 401–413. [Google Scholar] [CrossRef] [PubMed]
  26. Patwary, M.A.; O’Hare, W.T.; Sarker, M.H. Occupational accident: An example of fatalistic beliefs among medical waste workers in Bangladesh. Saf. Sci. 2012, 50, 76–82. [Google Scholar] [CrossRef]
  27. Leung, M.-Y.; Liang, Q.; Olomolaiye, P. Impact of Job Stressors and Stress on the Safety Behavior and Accidents of Construction Workers. J. Manag. Eng. 2016. [Google Scholar] [CrossRef]
  28. Siu, O.-l.; Phillips, D.R.; Leung, T.-w. Age differences in safety attitudes and safety performance in Hong Kong construction workers. J. Saf. Res. 2003, 34, 199–205. [Google Scholar] [CrossRef]
  29. Caffaro, F.; Roccato, M.; Micheletti Cremasco, M.; Cavallo, E. Falls from agricultural machinery: risk factors related to work experience, worked hours, and operators’ behavior. Hum. Factors 2017, 60, 18720817738591. [Google Scholar] [CrossRef]
  30. Williamson, A.M.; Feyer, A.M.; Cairns, D.; Biancotti, D. The development of a measure of safety climate: The role of safety perceptions and attitudes. Saf. Sci. 1997, 25, 15–27. [Google Scholar] [CrossRef]
  31. Sexton, J.B.; Helmreich, R.L.; Neilands, T.B.; Rowan, K.; Vella, K.; Boyden, J.; Roberts, P.R.; Thomas, E.J. The Safety Attitudes Questionnaire: psychometric properties, benchmarking data, and emerging research. BMC Health Serv. Res. 2006, 6, 10. [Google Scholar] [CrossRef]
  32. Flynn, B.B.; Schroeder, R.G.; Sakakibara, S. A framework for quality management research and an associated measurement instrument. J. Operat. Manageme. 1994, 11, 339–366. [Google Scholar] [CrossRef]
  33. Useche, S.A.; Montoro, L.; Alonso, F.; Pastor, J.C. Psychosocial Work Factors, Job Stress and Strain at the Wheel: Validation of the Copenhagen Psychosocial Questionnaire (COPSOQ) in Professional Drivers. Front. Psychol. 2019. [Google Scholar] [CrossRef]
  34. Padilla, M.A.; Divers, J. A Comparison of Composite Reliability Estimators: Coefficient Omega Confidence Intervals in the Current Literature. Educ. Psychol. Meas. 2016, 76, 436–453. [Google Scholar] [CrossRef] [PubMed] [Green Version]
  35. Hair, J.F.; Black, W.C.; Babin, B.J.; Anderson, R.E.; Tatham, R.L. Multivariate Data Analysis: A Global Perspective; Pearson: London, UK, 2010; pp. 12–15. [Google Scholar]
  36. Schreiber, J.B.; Nora, A.; Stage, F.K.; Barlow, E.A.; King, J. Reporting structural equation modeling and confirmatory factor analysis results: A review. J. Educat. Res. 2006, 99, 323–337. [Google Scholar] [CrossRef]
  37. Wu, M.L. Questionnaire Statistical Analysis Practice—SPSS Operation and Application; Chongqing University Press: Chongqing, China, 2010; pp. 122–142. [Google Scholar]
  38. Newaz, M.T.; Davis, P.; Jefferies, M.; Pillay, M. The Psychological Contract of Safety: The Missing Link Between Safety Climate and Safety Behaviour in Construction Sites; Springer International Publishing: Cham, Switzerland, 2016; pp. 199–210. [Google Scholar]
  39. Bronkhorst, B. Behaving safely under pressure: the effects of job demands, resources, and safety climate on employee physical and psychosocial safety behavior. J. Safety Res. 2015, 55, 63–72. [Google Scholar] [CrossRef]
  40. Wu, X.; Li, Y.; Yao, Y.; Luo, X.; He, X.; Yin, W. Development of construction workers job stress scale to study and the relationship between job stress and safety behavior: An empirical study in Beijing. Int. J. Environ. Res. Public Health 2018, 15, 2409. [Google Scholar] [CrossRef] [Green Version]
Figure 1. The initial structural model of the relationship between safety attitude and safety behavior.
Sustainability 11 06382 g001
Figure 2. The initial structural model of the impact of safety attitude on Safety compliance (SC) and safety participation (SP).
Sustainability 11 06382 g002
Figure 3. The revised structural model of the relationship between safety attitude and safety behavior.
Sustainability 11 06382 g003
Figure 4. The revised structural model of the impact of safety attitude on SC and SP.
Sustainability 11 06382 g004
Figure 5. The initial structural model of the relationship between the four dimensions of safety attitude and the two kinds of safety behavior.
Sustainability 11 06382 g005
Figure 6. The revised structural model of the relationship between the four dimensions of safety attitude and the two kinds of safety behavior.
Sustainability 11 06382 g006
Table 1. The path coefficient values of the Safety Behavior Questionnaire (SBQ).
ItemsUnstandardized Path CoefficientsStandardized Path
Coefficients
Mean Standard DeviationsCRp
B3 ← SC1.000.81
B2 ← SC1.120.850.0521.06***
B1 ← SC0.830.710.0517.55***
B6 ← SP1.000.81
B5 ← SP0.930.750.0519.59***
B1–B6 are the codes of the items in the SBQ; *** indicates p < 0.001.
Table 2. The normalized regression coefficient of the structural model of the relationship between safety attitude and safety behavior.
ItemsEstimate
SB ← SA0.85
MSC ← SA0.70
F ← SA0.24
TSC ← SA 0.80
JS ← SA0.41
SP ← SB0.80
SA: Safety attitude SC: Safety compliance; SP: Safety participation; F: Fatalism; JS: Job stress; TSC: Team safety climate; and MSC: Management safety commitment.
Table 3. The normalized regression coefficient of the structural model of the impact of safety attitude on SC and SP.
ItemsEstimate
SC ← SA0.88
SP ← SA0.85
MSC ← SA0.64
F ← SA0.20
TSC ← SA0.76
JS ← SA0.35
Table 4. The modified index (MI) value of the relationship between safety attitude and safety behavior.
ItemsMIPar Change
e3 ↔ e420.41−0.08
e2 ↔ e4106.410.39
e1 ↔ e440.910.16
e: Exogenous latent variable’s residual.
Table 5. The MI value of the impact of safety attitude on SC and SP.
ItemsMIPar Change
h4 ↔ r126.490.04
e2 ↔ e4112.200.42
e1 ↔ e459.140.20
h: Endogenous latent variable’s residual and e: Exogenous latent variable’s residual.
Table 6. The confirmatory factor analysis (CFA) results for the relationship between safety attitude and safety behavior.
Model χ2 (d.f.) χ2/(d.f.) NFITLICFIRMSEA
Ideal model <3.00>0.90>0.90>0.90<0.08
Measurement model9.30(6) ***1.550.990.991.000.03
*** indicates p < 0.001.
Table 7. The CFA results for the impact of safety attitude on SC and SP.
Model χ2 (d.f.) χ2/ d.f.NFITLICFIRMSEA
Ideal model <3.00>0.90>0.90>0.90<0.08
Measurement model112.81(31) ***3.640.960.961.000.07
*** indicates p < 0.001.
Table 8. The correlation between safety attitude and safety behavior.
DimensionsUnstandardized Path
Coefficients
Standardized Path
Coefficients
Mean Standard
Deviations
CRp
SB ← SA0.740.850.0613.38***
SC ← SA0.780.880.0612.55***
SP ← SA1.130.850.0813.53***
SB: Safety behavior; SA: Safety attitude; SC: Safety compliance; SP: Safety participation; and *** indicates p < 0.001.
Table 9. The normalized regression coefficient of the initial structural model.
ItemsEstimate
F ← MSC−0.26
JS ← MSC−0.61
F ← TSC0.05
JS ← TSC0.14
SC ← TSC1.09
SP ← TSC0.94
SC ← JS−0.08
SC ← F0.04
SP ← JS−0.05
SP ← F−0.01
SC ← MSC−0.28
SC ← MSC−0.16
SC: Safety compliance; SP: Safety participation; F: Fatalism; JS: Job stress; TSC: Team safety climate; and MSC: Management safety commitment.
Table 10. The path coefficient values of the initial models.
DimensionsUnstandardized Path
Coefficients
Standardized Path
Coefficients
Mean Standard
Deviations
CRp
F ← MSC−0.43−0.260.15−2.780.01
JS ← MSC−1.11−0.610.17−6.55***
F ← TSC0.080.050.170.440.66
JS ← TSC0.260.140.181.400.16
SC ← TSC0.901.090.0910.4***
SP ← TSC1.190.940.1110.67***
SC ← JS−0.03−0.080.03−1.250.21
SC ← F0.020.040.020.800.42
SP ← JS−0.04−0.050.04−0.920.36
SP ← F−0.01−0.010.04−0.200.84
SC ← MSC−0.23−0.280.08−2.990.00
SP ← MSC−0.20−0.260.11−1.830.07
F ← MSC−0.43−0.260.15−2.780.01
JS ← MSC−1.11−0.610.17−6.55***
F ← TSC0.080.050.170.440.66
SC: Safety compliance; SP: Safety participation; F: Fatalism; JS: Job stress; TSC: Team safety climate; and MSC: Management safety commitment.
Table 11. The normalized regression coefficient of the revised structural model.
ItemsEstimate
SC ← TSC0.89
SP ← TSC0.84
F ← MSC−0.22
JS ← MSC−0.51
1 Notes: SC: Safety compliance; SP: Safety participation; F: Fatalism; JS: Job stress; TSC: Team safety climate; and MSC: Management safety commitment.
Table 12. The results of the CFA.
Model χ2 (d.f.) χ2/d.f. NFITLICFIRMSEA
Ideal model <3.00>0.90>0.90>0.90<0.08
Measurement model732.45(31)***3.260.900.920.930.06
*** indicates p < 0.001.
Table 13. The correlation between the four dimensions of safety attitude and the two kinds of safety behavior.
DimensionsUnstandardized Path
Coefficients
Standardized Path CoefficientsMean Standard DeviationsCRp
SC ↔ TSC0.730.890.0513.37***
SP ↔ TSC1.050.840.0714.29***
F ↔ MSC−0.36−0.220.08−4.73***
JS ↔ MSC−0.92−0.510.09−10.27***
SC: Safety compliance; SP: Safety participation; F: Fatalism; JS: Job stress; TSC: Team safety climate; MSC: Management safety commitment; and *** indicates p < 0.001.
Table 14. The statistics and distribution of the demographic characteristics of the sample.
ItemsSample CharacteristicsNumberPercentage (%)Cumulative Percentage (%)
Age21–30 years old33758.658.6
31–40 years old14925.984.5
41–50 years old7813.698.1
51–60 years old111.9100.0
Length of Service1–2 years10918.518.5
3–4 years20434.753.2
5–6 years12821.875.0
7 years and above14725.0100.0
Education LevelPrimary education61.11.1
Secondary education11420.121.2
High school education23140.761.9
Bachelor’s degree21638.1100
Table 15. Variance analysis of the impact of age on safety attitude and safety behavior.
ScoresdfSSMSFp
Safety AttitudeIntra-group31409.032469.6774.2860.005
Inter-group57162573.166109.585
Total57463982.198
Safety BehaviorIntra-group333.21011.0700.8000.494
Inter-group5717905.39913.845
Total5747938.609
Table 16. Variance analysis of the impact of length of service on safety attitude and safety behavior.
ScoresdfSSMSFp
Safety AttitudeIntra-group3962.702320.9012.9140.034
Inter-group58464308.256110.117
Total58765270.957
Safety BehaviorIntra-group346.38515.4621.1240.339
Inter-group5848036.53213.761
Total5878082.917
Table 17. Variance analysis of the impact of education level on safety attitude and safety behavior.
ScoresdfSSMSFp
Safety AttitudeIntra-group3793.032264.3442.3970.067
Inter-group56362095.183110.293
Total56662888.215
Safety BehaviorIntra-group325.8198.6060.6240.600
Inter-group5637764.66013.792
Total5667790.480