A Study and Factor Identification of Municipal Solid Waste Management in Mexico City


Abstract
1. Introduction
1.1. Waste Management of Megacities
1.1.1. Background Information on Mexico City
1.1.2. Policies and Current Practices of the MSWM in Mexico City
1.2. Uncertainties in MSWM of Mexico City
1.3. Aim of Research
2. Materials and Methods
3. Results
3.1. Income Per Capita
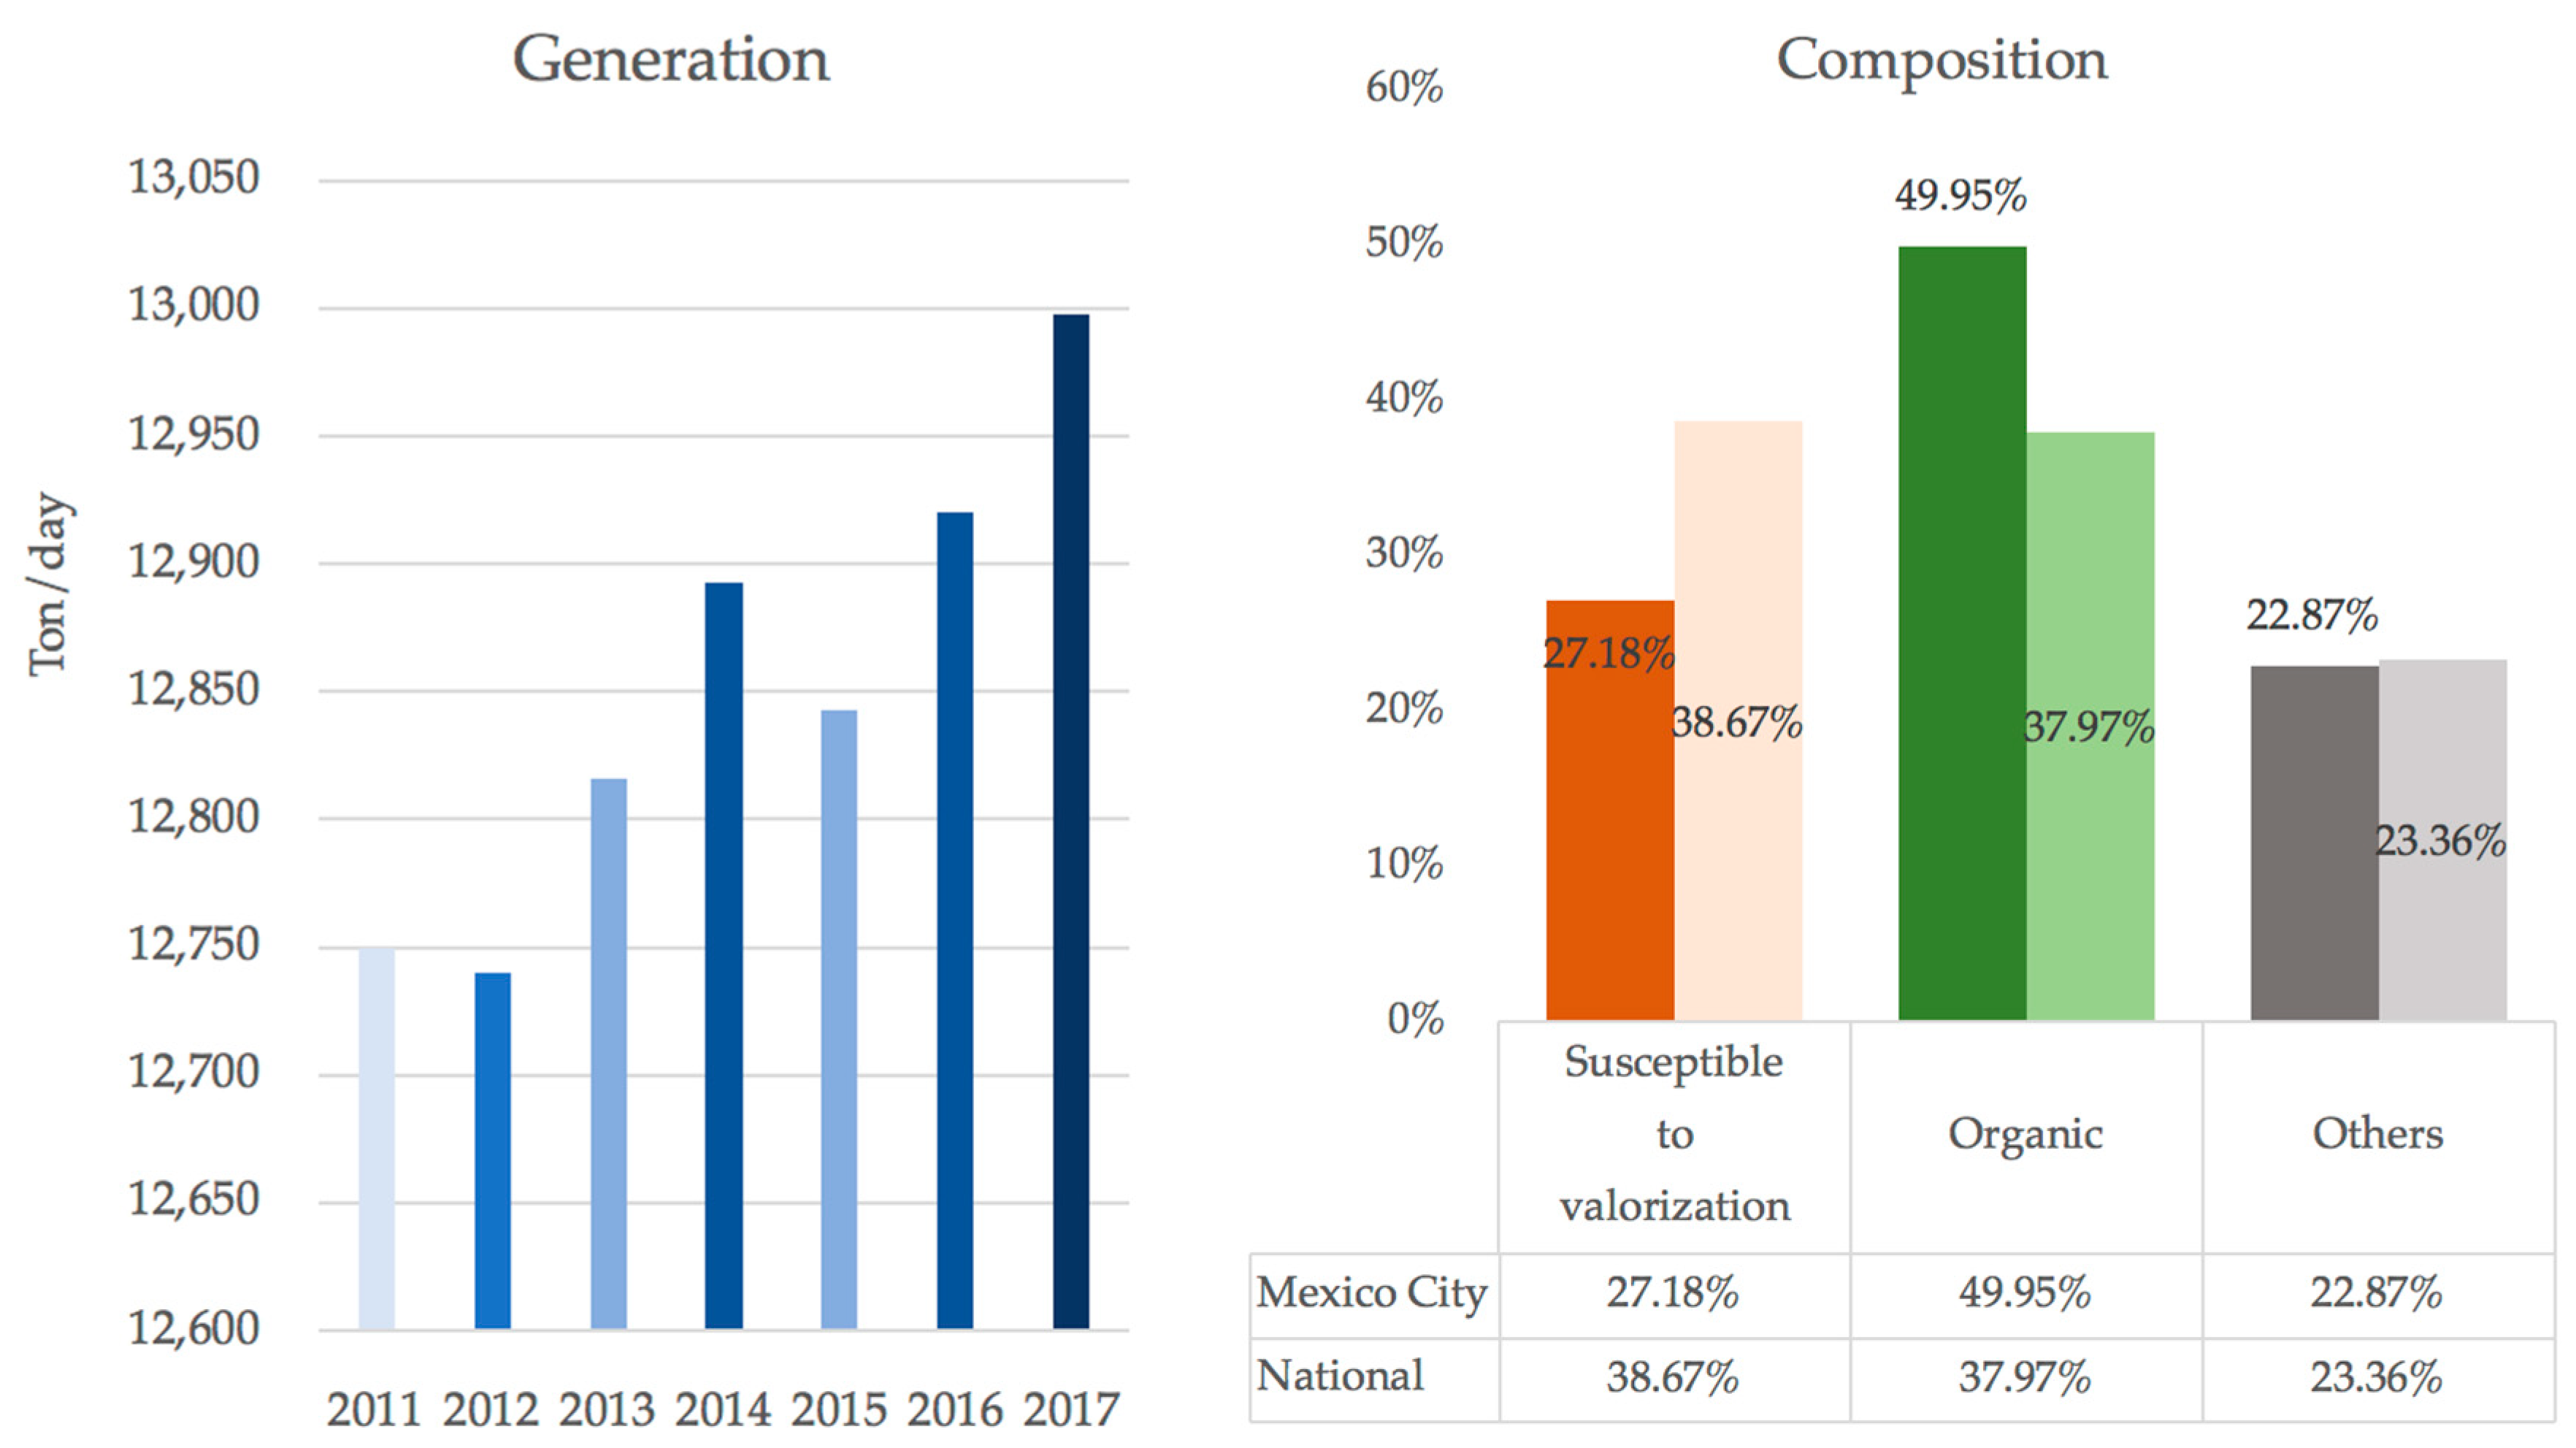
3.2. Waste Generation and Composition
3.3. Physical Component
3.3.1. Public Health (Waste Collection)
3.3.2. Environmental Control (Waste Treatment and Disposal)
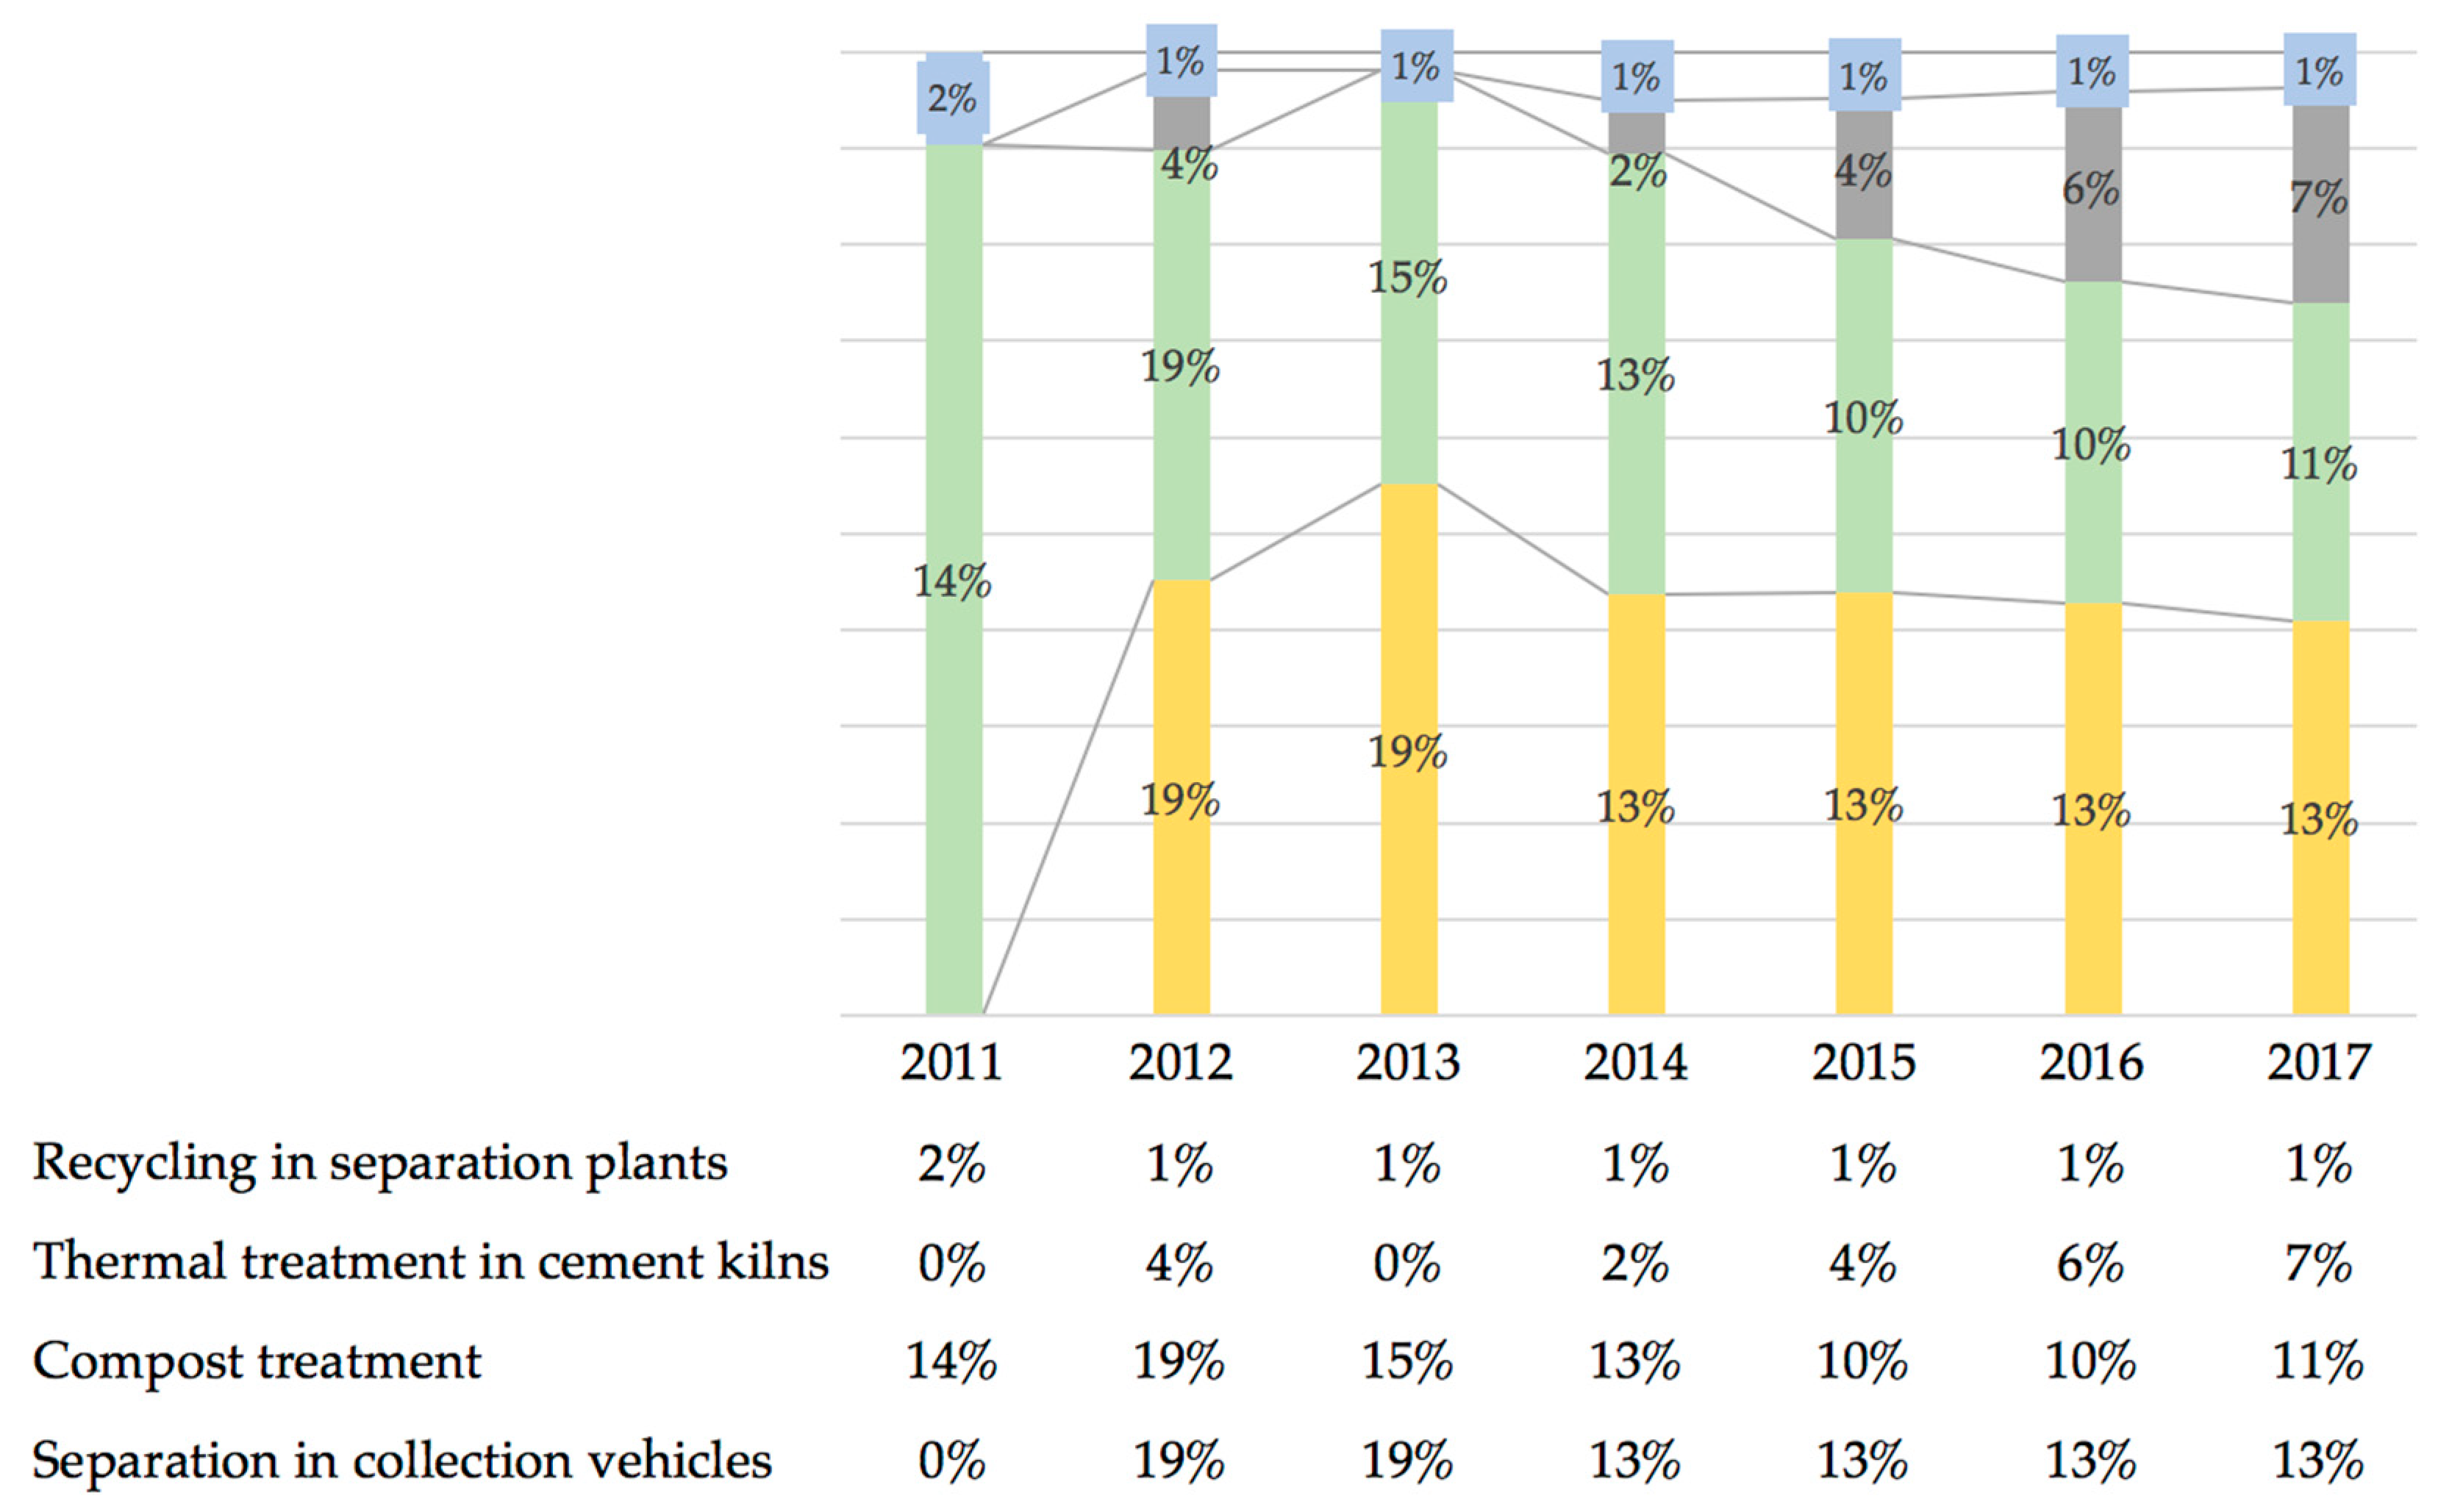
3.3.3. Resource Value (‘3Rs’—Reduce, Reuse, Recycle)
3.4. Governance
3.4.1. User Inclusivity
3.4.2. Provider Inclusivity
3.4.3. Financial Sustainability
3.4.4. Sound Institutions, Proactive Policies: National Framework
3.4.5. Sound Institutions, Proactive Policies: Local Institutional Policies
4. Discussion
4.1. Wasteaware Indicators in Mexico City
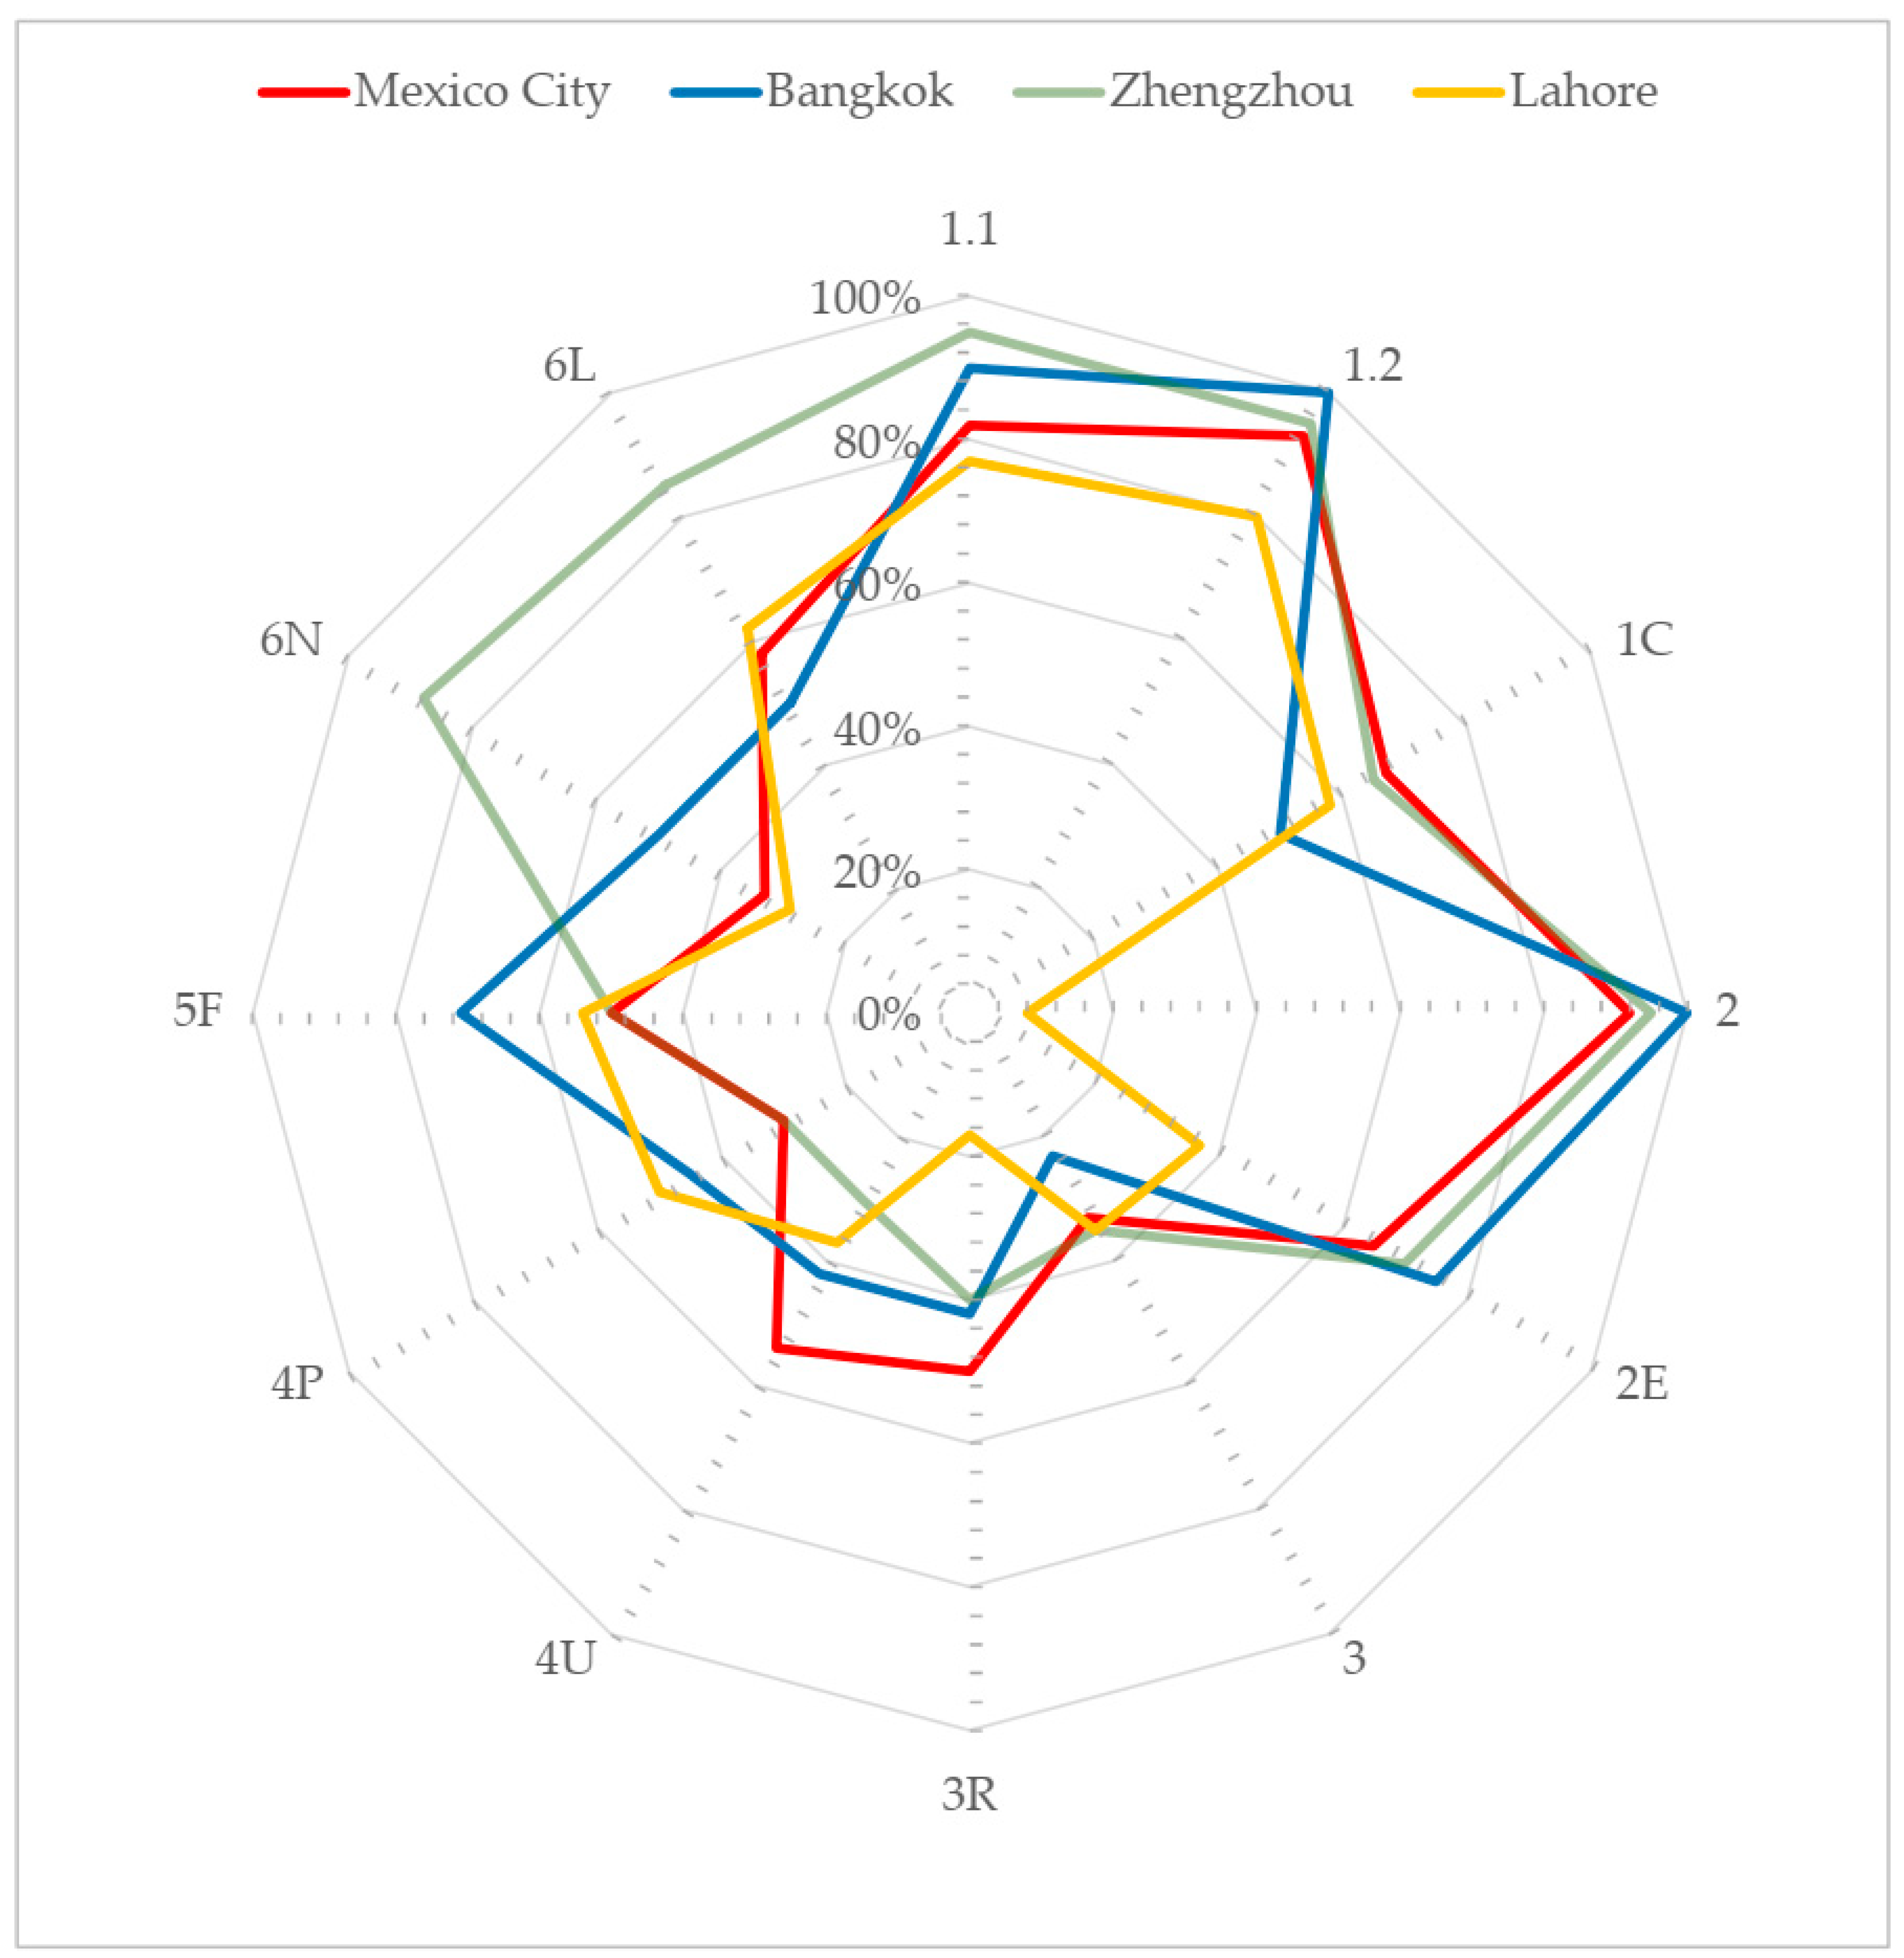
4.2. Wasteaware Indicator in Middle-Income Megacities
4.3. Recommendation
5. Conclusions
Author Contributions
Funding
Conflicts of Interest
Appendix A

| Components | Indicator | Number | Description |
|---|---|---|---|
| Public health waste collection | Waste collection coverage | 1.1 | Waste collection coverage represents the access that the population of a city has to a waste collection service. |
| Waste captured by the system | 1.2 | Waste captured by the system represents all the waste materials that are delivered to an official treatment/disposal facility or to a recycling factory. | |
| Quality of waste collection service | 1C | This is a composite indicator. The first step is getting waste from communities into the solid waste management system, and the inter-related service of street cleaning. The next step is getting the waste to final treatment or disposal facilities. The last two criteria examine, respectively, the appropriateness of service planning and monitoring and the health and safety of collection workers. | |
| Environmental control—waste treatment and disposal | Controlled treatment and disposal | 2 | The ‘numerator’ in this calculation is the total waste that is dealt with in a ‘controlled’ facility. The ‘denominator’ is the total solid waste destined for treatment or disposal—that is, the total waste generated minus the waste recycled or reused. |
| Degree of environmental protection in waste treatment and disposal | 2E | This is a composite indicator made up by marking the criteria 2E.1–2E.6. Criterion 2E.1 looks at waste reception and general site management; 2E.2 at the specific waste treatment and disposal processes and the operating procedures for their proper use; and 2E.3 focuses on environmental controls. Criterion 2E.4 assesses the efficiency of energy generation and use. The last two criteria focus on technical competence (2E.5) and on occupational health and safety (2E.6). | |
| Resource Management—reduce, reuse and recycle | Recycling rate | 3 | Includes both recycling of materials and valorization/recycling of organics. Recycling in this document represents a collection of public and private, formal, and informal activities that result in diverting materials from disposal and recovering them in order to return them to productive use. Conversion of quantitative recycling rate to ‘traffic lights’ colors: Low red: 0–9%; Low/medium: red/orange: 10–24% Medium orange: 25–44%; Medium/high: orange/green: 45–64% High green: >65% |
| Quality of 3Rs (Reduce, Reuse and Recycle) provision | 3R | This is a composite indicator made up by marking the criteria 3R.1–3R.6 below. The first two criteria focus on the quality of recycling, for dry recyclables (3R.1) and for organics (3R.2). Criterion 3R.3 assesses the policy and practical focus on the ‘top of the hierarchy’: for a higher waste generating city, this means reduction and reuse, whereas for lower waste generating cities, it is primarily diversion to recycling. Criterion 3R.4 recognizes the role of the ‘community sector’ in high-income countries and of the informal recycling sector in middle- and low-income countries. The last two criteria focus on environmental protection (3R.5) and health and safety (3R.6) |
| Components | Indicator | Number | Issue |
|---|---|---|---|
| Inclusivity | User inclusivity | 4U | Represents the degree to which all users, or potential users, of solid waste services have access to services, and are involved in and influence how those services are planned and implemented. This is a composite indicator made up by marking the criteria 4U.1–4U.6. Criterion 4U.1 assesses the extent to which all citizens, irrespective of their income level, receive a good service. The next three criteria focus on assessing the degree to which users, or potential users, of the solid waste services are involved in the planning, policy formation, implementation, and evaluation of those services. The last two criteria address complementary aspects of public awareness and education: 4U.5 assesses the level of activity and 4U.6 its effectiveness in achieving the desired behavior change. |
| Provider inclusivity | 4P | Degree of provider inclusivity represents the degree to which service providers, both municipal and non-municipal (including the formal private, community or ‘informal’ sectors), are included in the planning and implementation of solid waste and recycling services and activities. This is a composite indicator made up by marking the criteria 4P.1–4P.5 below. Criterion 4P.1 assesses the presence of legal instruments which enable both the public and private sectors to get involved in providing stable waste management services. Criteria 4P.2 and 4P.3 focus in turn on representation of the private sector and acknowledgement of the role of the informal/community sectors respectively. Criterion 4P.4 looks at the ‘balance’ between public and private sector interests, so that neither party is unduly advantaged over the other, while 4P.5 assesses the actual bid process. | |
| Financial sustainability | Financial sustainability | 5F | Represents the degree to which a city’s solid waste management service is financially sustainable. This is a composite indicator made up by marking the criteria 5F.1–5F.6 below. Criterion 5F.1 assesses transparent cost accounting procedures; 5F.2 the adequacy of the total budget, irrespective of the source of revenues; 5F.3 local cost recovery from households; 5F.4 affordability of user charges; 5F.5 coverage of disposal costs, focusing on how far disposal is ‘priced’; 5F.6 the ability to raise capital for investment |
| Sound institutions, proactive policies | Adequacy of national SWM framework | 6N | Assesses the adequacy of the national solid waste management framework—including the degree of implementation. This is a composite indicator made up by marking the criteria 6N.1–6N.6 below. The criteria cover the basic legislation and implementing regulations (6N.1); an approved and recent national strategy and clear policies (6N.2); guidelines for local government on implementation (6N.3); the designation and capacity of a single national responsible authority for solid waste management (6N.4); the environmental regulatory agency (6N.5); and the extent to which companies responsible for the products that become solid waste share the costs of its management through extended producer responsibility (6N.6) |
| Local institutional coherence | 6L | A measure of the institutional strength and coherence of the city’s solid waste management functions. This is a composite indicator made up by marking the criteria 6L.1–6L.6 below. The individual criteria assess organizational structure, institutional capacity, city-level strategic planning, availability, and quality of data, management control, and supervision of service delivery and inter-municipal co-operation. |
Appendix B
| Parameter | Year | |||||||
|---|---|---|---|---|---|---|---|---|
| 2011 | 2012 | 2013 | 2014 | 2015 | 2016 | 2017 | ||
| Generation (Ton/day) | 12,750 | 12,740 | 12,816 | 12,893 | 12,843 | 12,920 | 12,998 | |
| Population (millions of inhabitants) | 8.928 | 8.911 | 8.893 | 8.874 | 8.854 | 8.833 | 8.811 | |
| Generation per capita | ( | 521.230 | 521.799 | 525.970 | 530.264 | 529.408 | 533.859 | 538.432 |
| ( | 1.428 | 1.430 | 1.441 | 1.453 | 1.450 | 1.463 | 1.475 | |
| MSW Type | Mexico City 2008 | National 2012 | Material | Mexico City 2008 | National 2012 |
|---|---|---|---|---|---|
| Susceptible to valorization | 27.18% | 38.67% | Cardboard | 4.03% | 8.04% |
| Paper | 5.89% | 6.20% | |||
| Ferrous metals | 1.16% | 2.09% | |||
| Nonferrous metals | 0.29% | 2.88% | |||
| Plastics | 13.16% | 12.88% | |||
| Glass | 2.65% | 6.58% | |||
| Organic | 49.95% | 37.97% | Organic | 49.50% | 36.72% |
| Wood | 0.45% | 1.25% | |||
| Others | 22.87% | 23.36% | Sanitary waste | 10.77% | 6.52% |
| Textiles | 3.64% | 5.17% | |||
| Construction | 1.88% | 1.46% | |||
| Fine material | 0.80% | 3.76% | |||
| Waste management special | 1.41% | 0.00% | |||
| Hazardous waste | 0.18% | 0.00% | |||
| Others | 4.19% | 6.45% |
| Description | 2011 (Ton/Day) | 2012 (Ton/Day) | 2013 (Ton/Day) | 2014 (Ton/Day) | 2015 (Ton/Day) | 2016 (Ton/Day) | 2017 (Ton/Day) |
|---|---|---|---|---|---|---|---|
| MSW generation | 12,750 | 12,740 | 12,816 | 12,893 | 12,843 | 12,920 | 12,998 |
| Collected by sweepers | 1000 | 1000 | 1000 | 1000 | 1000 | 1000 | 1038 |
| Central supply | 927 | 585 | 585 | 585 | 585 | 585 | 585 |
| Collected by delegations | 9573 | 8201 | 8230 | 8681 | 8726 | 8865 | 8967 |
| Collected in main roads | 0 | 393 | 427 | 411 | 578 | 403 | 1082 |
| Collected by private firms | 3 | 41 | 46 | 45 | 43 | 38 | 35 |
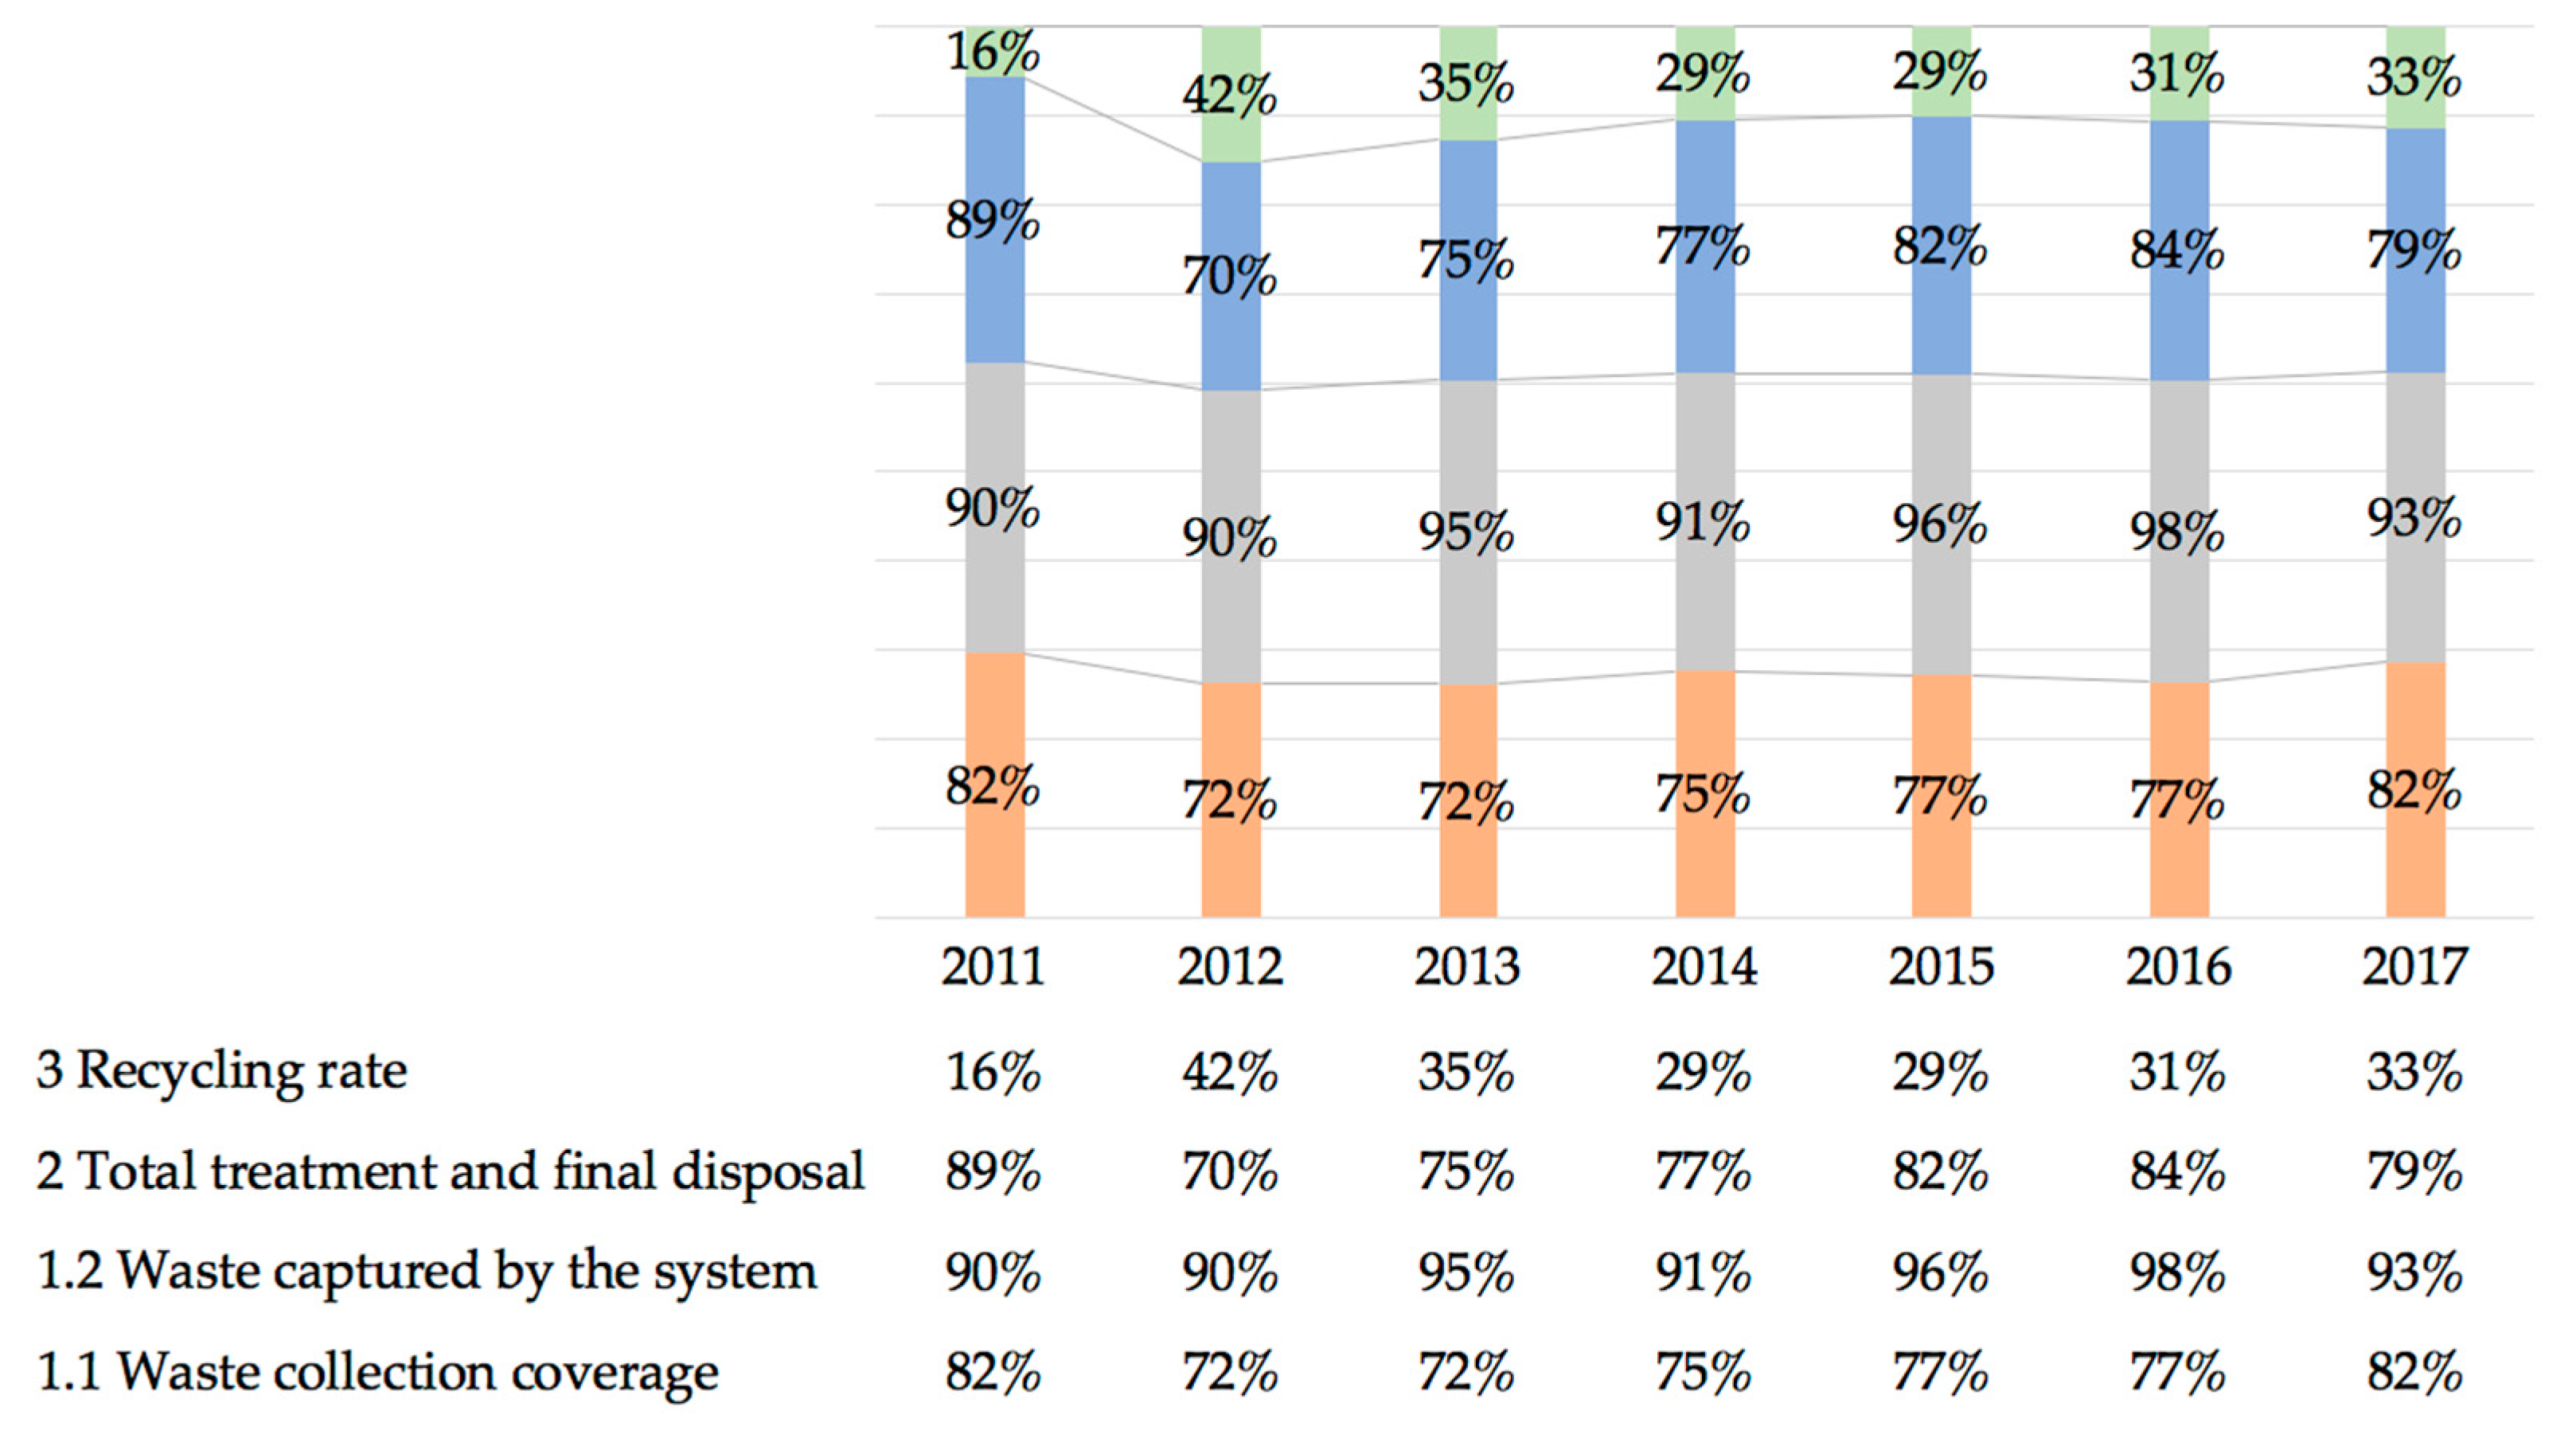
| 1.1 Waste collection coverage (Total score-normalized) | 10,504 | 9220 | 9288 | 9722 | 9932 | 9891 | 10,669 |
| 82% | 72% | 72% | 75% | 77% | 77% | 82% |
| Description | 2011 (Ton/Day) | 2012 (Ton/Day) | 2013 (Ton/Day) | 2014 (Ton/Day) | 2015 (Ton/Day) | 2016 (Ton/Day) | 2017 (Ton/Day) |
|---|---|---|---|---|---|---|---|
| MSW generation | 12,750 | 12,740 | 12,816 | 12,893 | 12,843 | 12,920 | 12,998 |
| Compost treatment | 1843 | 2374 | 1942 | 1690 | 1348 | 1325 | 1400 |
| Final disposal (landfill) | 9465 | 6151 | 7613 | 8090 | 8677 | 8712 | 7862 |
| Heat treatment (cement kilns) | 0 | 447 | 0.1 | 201 | 536 | 785 | 952 |
| Recycling (separation plants) | 196 | 103 | 84 | 191 | 182 | 165 | 163 |
| Total | 11,504 | 11,488 | 12,131 | 11,793 | 12,364 | 12,687 | 12,125 |
| 1.2 Waste captured by the system [9]. (Total score-normalized) | 90% | 90% | 95% | 91% | 96% | 98% | 93% |
| Site | 2011 (Ton/Day) | 2012 (Ton/Day) | 2013 (Ton/Day) | 2014 (Ton/Day) | 2015 (Ton/Day) | 2016 (Ton/Day) | 2017 (Ton/Day) |
|---|---|---|---|---|---|---|---|
| MSW generated | 12,750 | 12,740 | 12,816 | 12,893 | 12,843 | 12,920 | 12,998 |
| Cañada | 9465 | 2866 | 2936 | 3219 | 3054 | 4332 | 2894 |
| Cuautitlán | 613 | 1677 | 1623 | 1155 | 475 | 602 | |
| Milagro | 2191 | 2221 | 3010 | 4012 | 3294 | 3767 | |
| Xonacatlán | 287 | 0 | 0 | 0 | 0 | 0 | |
| Tepozotlán | 68 | 522 | 51 | 0 | 0 | 0 | |
| Cuautla | 118 | 257 | 196 | 191 | 208 | 108 | |
| Other sites | 8 | 0 | 0 | 0 | 403 | 491 | |
| Final disposal (landfill) | 9465 | 6151 | 7613 | 8099 | 8677 | 8712 | 7862 |
| Compost treatment | 1843 | 2374 | 1942 | 1690 | 1348 | 1325 | 1400 |
| Heat treatment (cement kilns) | 0 | 447 | 0.10 | 201 | 536 | 785 | 952 |
| Total treatment and final disposal | 11,307 | 8972 | 9555 | 9990 | 10,561 | 10,882 | 10,214 |
| 2 Treatment and final disposal (Total score-normalized) | 90% | 88% | 93% | 90% | 96% | 98% | 92% |
| Description | 2011 (Ton/Day) | 2012 (Ton/Day) | 2013 (Ton/Day) | 2014 (Ton/Day) | 2015 (Ton/Day) | 2016 (Ton/Day) | 2017 (Ton/Day) |
|---|---|---|---|---|---|---|---|
| MSW generation | 12,750 | 12,740 | 12,816 | 12,893 | 12,843 | 12,920 | 12,998 |
| Separation in collection vehicles | 0 | 2413 | 2492 | 1621 | 1621 | 1700 | 1748 |
| Compost treatment | 1843 | 2374 | 1942 | 1690 | 1348 | 1325 | 1400 |
| Thermal treatment in cement kilns | 0 | 447 | 0 | 201 | 536 | 785 | 952 |
| Recycling in separation plants | 196 | 103 | 84 | 191 | 182 | 165 | 163 |
| Total recovered | 2039 | 5337 | 4518 | 3703 | 3687 | 3975 | 4263 |
| 3 Recycling rate | 16% | 42% | 35% | 29% | 29% | 31% | 33% |
Appendix C
| 1.C Quality of Waste Collection Service | |||||||||
| Number | Criterion | 2011 | 2012 | 2013 | 2014 | 2015 | 2016 | 2017 | Reason |
| 1C.1 | Appearance of waste collection points | 15 | 15 | 15 | 15 | 15 | 15 | 15 | For this criterion, the relationship between the existing collection points and the number of clandestine landfills was taken into account, considering a low incidence for a factor less than 0.2. |
| 1C.2 | Effectiveness of street cleaning | 20 | 20 | 20 | 20 | 20 | 20 | 20 | There is considered to be a very low incidence of MSW present in the main avenues and public spaces where there are agglomerations of people, since there are manual and mechanical sweeping programs for these areas. |
| 1C.3 | Effectiveness of collection in low-income districts | 10 | 10 | 10 | 10 | 10 | 10 | 10 | According to data from 2017, 1229 clandestine dumpsites exist, 42% of the delegations of Iztapalapa, Cuauhtémoc and Benito Juarez. This is considered a medium incidence since the delegations of Iztapalapa and Cuauhtémoc concentrate the majority of marginalized areas. |
| 1C.4 | Efficiency and effectiveness of waste transport | 20 | 20 | 20 | 20 | 20 | 20 | 20 | This service is provided with specialized vehicles, where the container boxes are owned by Mexico City and the trucks are concessioned. There is greater supervision over this service if they disperse garbage along the way or the trips are not paid for. |
| 1C.5 | Appropriateness of service planning and monitoring | 10 | 10 | 10 | 10 | 10 | 10 | 10 | The planning of the collection and transfer services is done according to the POA (annual operating program) and this is done according to the amount of MSW to be collected. In most of the dependencies this amount remained constant during the period analyzed and only updated the amounts every year. In terms of monitoring, there is no supervision of the routes, only attention to citizens’ complaints. |
| 1C.6 | Health and safety of collection workers | 5 | 5 | 5 | 5 | 5 | 5 | 5 | In general, the country’s employees do not use personal protective equipment, but in Mexico City this is more evident since most of the collection employees are volunteers and are not provided with uniform and/or personal protective equipment. |
| Total score | 80 | 80 | 80 | 80 | 80 | 80 | 80 | Top score 120 | |
| Total score-normalized | 66.7% | 66.7% | 66.7% | 66.7% | 66.7% | 66.7% | 66.7% | ||
| 2.E Quality of Environmental Protection in the Final Disposal and Treatment | |||||||||
| Number | Criterion | 2011 | 2012 | 2013 | 2014 | 2015 | 2016 | 2017 | Reason |
| 2E.1 | Degree of control in the reception of MSW in the transfer stations | 10 | 10 | 15 | 15 | 15 | 15 | 15 | This is considered as a medium-high compliance, since in the transfer stations, although there is no waste dispersion in their surroundings, there is no control of dust and odors. For the years 2011 and 2012 it is considered medium since the Miguel Hidalgo transfer station had constant complaints from neighbors about the traffic congestion that it originated until it closed in 2013. |
| 2E.2 | Degree of control over the treatment and disposal of MSW | 15 | 15 | 15 | 15 | 15 | 15 | 15 | This is considered a medium-high compliance since during the analyzed period, seven final disposal sites were used: Bordo Poniente, and La Cañada, Milagro, Cuautitlán, Xonacatlan, Tepotzotlán, and Cuautla. All have machinery, daily cover and some method of waterproofing. However, none of these has leachate treatment and capture of biogas. There is no better control since the closure of the Bordo Poniente Landfill. |
| 2E.3 | Degree of monitoring and verification of environmental controls | 5 | 10 | 10 | 10 | 10 | 10 | 10 | This is considered a medium compliance. There is no record of any monitoring of ground and surface water, or treatment of leachates and biogas in the final disposal sites. However, while the final disposal and treatment sites have the authorizations at the local level, not all final disposal sites comply with national standards. This is considered to have improved since the closure of the West Bank, which did not have local or national authorizations. |
| 2E.4 | Efficiency in the use of the MSW for power generation | N/A | N/A | N/A | N/A | N/A | N/A | N/A | This is considered when there are incineration plants with energy use. |
| 2E.5 | Degree of technical competence in the planning, management, and operation of the treatment and final disposal | 10 | 10 | 10 | 10 | 10 | 10 | 10 | This is considered an average degree of compliance since the authorities in charge of the management of the MSW change every three years with the change of the local governments. In the case of private operators, there is no evidence of certification of the personnel requirements in the hiring process. |
| 2E.6 | Occupational health and safety | 15 | 15 | 15 | 15 | 15 | 15 | 15 | In general, the country’s employees do not use personal protective equipment, although in the transfer, transportation, and final disposal facilities, there are voluntary and/or informal staff who are provided with personal protective equipment; thus, this is assigned a high average rating. |
| Total score | 55 | 60 | 65 | 65 | 65 | 65 | 65 | Top score 100 | |
| Total score-normalized | 55% | 60% | 65% | 65% | 65% | 65% | 65% | ||
| 3R Quality of 3Rs—Reduce, Reuse, Recycle—Provision. | |||||||||
| Number | Criterion | 2011 | 2012 | 2013 | 2014 | 2015 | 2016 | 2017 | Reason |
| 3R.1 | Separation at the source of dry waste. Quality of recycled organic material (compost) | 14.5% | 41.4% | 38.4% | 28.8% | 26.2% | 26.3% | 27.1% | For this, the percentage of waste that the informal sector takes advantage of and what is sent to make compost was considered. It was evaluated for the years after the closure of Bordo Poniente with an average quality. |
| 5 | 10 | 10 | 10 | 10 | 10 | 10 | |||
| 3R.2 | Focus on the top levels of the waste hierarchy | 20 | 20 | 20 | 20 | 20 | 20 | 20 | The material that arrives at the compost plants for treatment is the material that was separated from the source, mainly coming from the central supply and markets. During the manufacturing process, the temperature is monitored and the material is sieved so that the final product has a homogeneous quality. |
| 3R.3 | Integration of the community and/or informal recyclers with the formal SWM service | 15 | 15 | 15 | 15 | 15 | 15 | 15 | The national level is the first to establish a compulsory separation program focused on separation efforts and not on prevention and minimization. In addition, no goals have been established to increase the percentage of recycling, which remains at the same levels since 2011. For this reason, the compliance is considered as medium. |
| 3R.4 | Environmental protection in recycling | 10 | 10 | 10 | 10 | 10 | 10 | 10 | The institutional efforts on the integration of the community in the management of the MSW focus on recycling, through publicity campaigns on the increase of the fractions into which it is necessary to separate the waste at source for use mainly by the informal sector. This leaves aside the inclusion within the system of the informal workers and individuals, thus, there is a lack of knowledge of the final destination of a significant part of the waste generated in Mexico City; therefore, a medium compliance is assigned. |
| 3R.5 | Occupational health and safety | 5 | 5 | 5 | 5 | 5 | 5 | 5 | There are no controls in the recycling process, either in the separation of MSWs carried out by volunteers and employees of the separation plants, or in the places where they are marketed and stored, with very precarious conditions, or in the transport to the industrial plants. |
| 3R.6 | Separation at the source of dry waste | 0 | 0 | 0 | 0 | 0 | 0 | 0 | In general, the country’s employees do not use personal protective equipment, but in Mexico City, this is more evident, since the employees who recycle waste are volunteers and/or ex-workers who do not have a uniform and/or personal protection equipment. |
| Total score | 55 | 60 | 60 | 60 | 60 | 60 | 60 | Top score 120 | |
| Total score-normalized | 45.8% | 50% | 50% | 50% | 50% | 50% | 50% | ||
| 4U Degree of User Inclusivity | |||||||||
| Number | Criterion | 2011 | 2012 | 2013 | 2014 | 2015 | 2016 | 2017 | Reason |
| 4U.1 | Equity in the provision of the service | 15 | 15 | 15 | 15 | 15 | 15 | 15 | There is no differentiation in the provision of the collection service depending on the level of income, since in the city the fixed and corner methods with rear cargo vehicles prevail, thus, the difference is in areas with narrow or hard to access streets. |
| 4U.2 | Right to be heard | 10 | 10 | 10 | 10 | 10 | 10 | 10 | There is a right to citizen participation in the process of elaboration of the Integral Management Program that is updated every 5 years, but there is no public consultation on the annual operating program. Therefore, this is considered an average rating. |
| 4U.3 | User participation level | 16% | 36% | 29% | 26% | 19% | 17% | 23% | To determine the level of citizen participation, the reported efficiency of the organic waste separation, which represents 49% of the total, was taken as a reference. |
| 0 | 5 | 5 | 5 | 5 | 0 | 5 | |||
| 4U.4 | Feedback mechanisms with users | 10 | 10 | 10 | 10 | 10 | 10 | 10 | There are no committees composed of different sectors of the population that meet periodically to discuss the management of MSW, although there are telephones and mailboxes in the different agencies to deal with the complaints of citizens about deficiencies in the provision of cleaning services, mainly sweeping and pickup. |
| 4U.5 | Awareness and user education | 5 | 5 | 5 | 15 | 15 | 15 | 15 | Until 2014, the communication and dissemination of the MSW management programs was carried out through the operating personnel of the cleaning services. In the subsequent years, there was a specific heading for the users’ education and dissemination programs. |
| 4U.6 | Effectiveness in achieving behavioral changes | 16% | 47% | 62% | 39% | 34% | 29% | 43% | For this parameter, the waste reported in the management plans of the commercial and service establishments was taken into account, together with the efficiency in the separation of organic waste from the homes. |
| 0 | 10 | 15 | 5 | 5 | 5 | 10 | |||
| Total score | 40 | 55 | 60 | 60 | 60 | 55 | 65 | Top score 120 | |
| Total score-normalized | 33.3% | 45.8% | 50% | 50% | 50% | 45.8% | 54.2% | ||
| 4P Degree of Provider Inclusivity | |||||||||
| Number | Criterion | 2011 | 2012 | 2013 | 2014 | 2015 | 2016 | 2017 | Reason |
| 4P.1 | Legal framework | 0 | 0 | 0 | 0 | 0 | 0 | 0 | There is a national legal framework on waste, which indicates the responsibilities and powers of the different levels of government and outlines the policy on waste at the national level. In the case of MSW, these attributions correspond to the government of Mexico City, which has published its own law and regulation regarding MSW, as well as regulations that establish the separation and treatment of some fractions of MSW. However, it does not establish the bases for public-private participation (PPP), private participation (PSP), or the participation of the informal sector. In the 2014–2020 management program, private and informal participation in recycling and stockpiling is expected up to 2020. |
| 4P.2 | Representation of the private sector | 5 | 5 | 5 | 5 | 5 | 5 | 5 | The private and informal service providers have the possibility to participate in the consultation of the Waste Management Program in the same way as the population, but not in the elaboration of the plan or the annual operating programs. |
| 4P.3 | Role of the informal sector and citizenship | 5 | 5 | 5 | 5 | 5 | 5 | 5 | There is no recognition at the same level as public services, for the private sector and the informal sector. Both the regulations and the plans and programs do not mention the services they provide or the amount of waste they handle. In the case of private companies, there is only a record of the providers of transport and final disposal services, but not of the methods used or the amount of MSW. |
| 4P.4 | Balance between the interests of the private sector and public provision of services | 10 | 10 | 10 | 10 | 10 | 10 | 10 | There is no adequate balance in the provision of services in Mexico City. The home collection service and the sweeping is only public, which does not allow the possibility of a differentiated service, or to have different methods and charges depending on the level of income of the population. In contrast, the final provision is exclusively by individuals with whom annual contracts are made, which does not allow for a long-term certainty in the quality and environmental protection of this service. The participation of the private sector is limited to the sweeping and collection from public areas with tourist and commercial attractions such as the Reforma avenue and the center. |
| 4P.5 | Bidding processes | 10 | 10 | 10 | 10 | 10 | 10 | 10 | The hiring processes are not open, but limited to the invitation of three suppliers since its duration is one year. However, the hiring processes are transparent. Contracts can be consulted through a City website and the cost and conditions of the services are known. |
| Total score | 30 | 30 | 30 | 30 | 30 | 30 | 30 | Top score 100 | |
| Total score-normalized | 30% | 30% | 30% | 30% | 30% | 30% | 30% | ||
| 5F Financial Sustainability | |||||||||
| Number | Criterion | 2011 | 2012 | 2013 | 2014 | 2015 | 2016 | 2017 | Reason |
| 5F.1 | Cost accounting | 15 | 15 | 15 | 15 | 15 | 15 | 15 | A high average rating is considered since the total cost of the MSW management service is known, but not that of the different services that comprise it. |
| 5F.2 | Coverage of the available budget | 15 | 10 | 10 | 10 | 15 | 15 | 10 | This is considered medium level, since the budget covers all the costs of operation and maintenance, but the percentage of investment is 1% for 2012, 2013, and 2017. Meanwhile, it is considered medium-high in the years 2011, 2015, and 2016 where 15% of the budget is considered for investment. |
| 5F.3 | Local cost recovery—from households | 5 | 5 | 5 | 5 | 5 | 5 | 5 | This is considered a medium-low level, since only large and high volume generators that are less than 20% of the total users pay for a particular service. |
| 5F.4 | Affordability of user charges | N/A | N/A | N/A | N/A | N/A | N/A | N/A | This is not considered as there is no direct charge to users. |
| 5F.5 | Pricing of disposal | 15 | 15 | 15 | 15 | 15 | 15 | 15 | During the period analyzed, the disposal sites used belong to individuals, who obtain an economic gain from the provision of the service. This was assigned a grade of 15, since it is not considered that they have a budget for the closure since the contracting with Mexico City is annual. |
| 5F.6 | Access to capital for investment | 5 | 5 | 5 | 5 | 5 | 5 | 5 | This indicator was considered to be low, since the investments made by Mexico City with its budget are used to replace and acquire new infrastructure to maintain the same services, but it does not have the capacity to incorporate new services. As for federal support, they are conditioned to the concession of the services that Mexico City does not contemplate as an option. |
| Total score | 55 | 50 | 50 | 55 | 55 | 55 | 50 | Top score 100 | |
| Total score-normalized | 55% | 50% | 50% | 50% | 55% | 55% | 50% | ||
| 6N Adequacy of National Solid Waste Management Framework | |||||||||
| Number | Criterion | 2011 | 2012 | 2013 | 2014 | 2015 | 2016 | 2017 | Reason |
| 6N.1 | Legislation and regulations | 15 | 15 | 15 | 15 | 15 | 15 | 15 | There is a national law and its respective regulations on solid waste, which have been updated continuously and specify that the MSW is the responsibility of local governments (state and municipal), so that at the national level, the only regulation that exists is the official norm in terms of final disposal. The other management options are left to local governments. However, it has been 14 years since the publication of this norm, which is why it is considered a high-average compliance. Therefore, a high-average rating was assigned throughout the period analyzed. |
| 6N.2 | Strategy and politics | 10 | 10 | 0 | 0 | 0 | 0 | 0 | In Mexico, the last national plan on waste covers the period 2009–2012, which defines strategies and goals to improve the management of municipal solid waste. However, this does not establish compliance dates and necessary resources; it mentions possible sources of financing, but not the mechanisms to access them. After 2012, the national plan was not updated and no new strategy has been drawn up to comply with the goals not yet reached. Because the responsibility for MSW is with local governments, at the national level there is only one program of financing to governments that wish to implement new programs or improve their management options. |
| 6N.3 | Guidelines for the implementation of procedures | 10 | 10 | 10 | 10 | 10 | 10 | 10 | There are guidelines for the preparation of plans and programs for management of MSW at local level, where the technical, environmental, and economic requirements that must be considered are specified. However, no mechanism has been developed to ensure that the new facilities are built with an adequate balance between national, regional, and local population needs, and it is common for facilities to be abandoned due to the opposition of the population or because they are not adequate for the amount and type of MSW in the region. |
| 6N.4 | National institution that implements the MSW policy | 5 | 5 | 5 | 5 | 5 | 5 | 5 | For this indicator, a medium-low level is considered, since although there is a clear policy at the national level, because the MSW is the responsibility of the state governments, each entity has different mechanisms for the implementation of the policy on waste. For the urban services, entities usually intervene in the operational part and the environment in the regulation, but there is no coordination between the states, since within the Ministry of the Environment there is no area dedicated to the management of MSW. |
| 6N.5 | Regulation and control | 5 | 5 | 5 | 5 | 5 | 5 | 5 | The regulation and control of the final disposal sites is in the charge of each state’s environmental areas, which are responsible for issuing the authorizations and supervision of the final disposal and treatment sites, and the level of supervision is very heterogeneous. It depends a lot on the resources and priorities of each state, in which more than 90% of the final disposal sites do not comply with the environmental regulations but remain in operation. |
| 6N.6 | Extended producer responsibility (EPR) or product administration (PS) | 5 | 5 | 5 | 5 | 5 | 5 | 5 | Within the legal framework on waste, there is no agreement with the producers of packaging and electronic devices to share the cost of handling the produced MSW and to enable the recycling of their products. Only the bottling companies have formed a civil association for the recovery and recycling of PET produced in schools, offering the recycling of their products. |
| Total score | 50 | 50 | 40 | 40 | 40 | 40 | 40 | Top score 120 | |
| Total score-normalized | 41.7% | 41.7% | 33.3% | 33.3% | 33.3% | 33.3% | 33.3% | ||
| 6L Local Institutional Coherence | |||||||||
| Number | Criterion | 2011 | 2012 | 2013 | 2014 | 2015 | 2016 | 2017 | Reason |
| 6L.1 | Organizational structure coherence | 15 | 15 | 15 | 15 | 15 | 15 | 20 | Until 2016, the management of the MSW was divided into the General Directorate of Urban Services in the operative part, the secretariat of works and services for the acquisition of equipment and infrastructure, and the environment for the regulation and policy in matters of waste. As of 2017, the management of the MSW is funded by the Urban Management Agency (UMA), a decentralized body with management autonomy, and with sufficient capacity to design, plan and execute the policies, programs and actions related to the management of the MSW. |
| 6L.2 | Institutional capacity | 10 | 10 | 10 | 10 | 10 | 10 | 10 | Within the dependencies related to the management of the MSW, there is an organizational chart indicating their responsibilities. However, there is no career plan with appropriate training, since most of the management positions are renewed with the local administration every three years. |
| 6L.3 | Strategic planning and management of the MSW in Mexico City | 15 | 15 | 15 | 15 | 15 | 15 | 15 | Mexico City, since the General Law for the Prevention and Integral Management of Waste published in 2004, has a plan that is updated every 6 years, which makes a diagnosis of the current situation and establishes strategies and actions for improvement in the management of the MSW. However, the amounts that will be allocated to these actions or sources of financing are not indicated. |
| 6L.4 | Availability and quality of data related to the management of the MSW | 15 | 15 | 15 | 15 | 15 | 15 | 15 | Since 2012, an inventory of waste is published annually, where the amount of MSW that is managed by the public cleaning services, as well as reports from the large generators (commerce and services) are detailed. However, there is no data on the amount of MSW and management options used, and the most recent composition study was 9 years ago. |
| 6L.5 | Administration, control and supervision of the services provided | 5 | 5 | 5 | 5 | 5 | 5 | 5 | As such, there is no area dedicated to the supervision of the MSW management services, only citizen complaints or complaints are received, and information on clandestine disposal of MSW in public areas, ravines, or rivers, but there is no exclusive dedicated area for monitoring and supervision. |
| 6L.6 | Regional cooperation | 5 | 5 | 5 | 5 | 5 | 5 | 5 | Mexico City belongs to the Environmental Commission of the Megalopolis for the states of Hidalgo, Mexico, Moleros, Tlaxcala, and Puebla, which is an organization for political coordination on environmental issues of the states that are part of the Metropolitan Area of the Valley of Mexico. However, this commission has focused on the control of air pollution and has not addressed the management of MSW in the megalopolis. |
| Total score | 65 | 65 | 65 | 65 | 65 | 65 | 70 | Top score 120 | |
| Total score-normalized | 54.1% | 54.1% | 54.1% | 54.1% | 54.1% | 54.1% | 58.3% | ||
Appendix D
| Concept | 2011 | 2012 | 2013 | 2014 | 2015 | 2016 | 2017 | |||||||
|---|---|---|---|---|---|---|---|---|---|---|---|---|---|---|
| Ton/Year | MDP | Ton/Year | MDP | Ton/Year | MDP | Ton/Year | MDP | Ton/Year | MDP | Ton/Year | MDP | Ton/Year | MDP | |
| Álvaro Obregón | 420,000 | 32.08 | 240,000 | 29.71 | 240,000 | 31.993 | 440,000 | 20.04 | 440,000 | 12.605 | 440,000 | 10.200 | 350,000 | 10.000 |
| Azcapotzalco | 230,000 | 146.10 | 200,000 | 146.43 | 200,000 | 156.905 | 200,000 | 193.13 | 200,000 | 217.164 | 200,000 | 182.731 | 200,000 | 179.633 |
| Benito Juárez | 299,755 | 170.60 | 269,780 | 169.75 | 242,802 | 180.530 | 218,522 | 181.27 | 218,522 | 184.232 | 218,000 | 179.641 | 218,000 | 200.934 |
| Coyoacán | 390,000 | 55.84 | 273,000 | 79.41 | 390,000 | 97.288 | 390,000 | 97.15 | 390,000 | 105.897 | 390,000 | 110.483 | 390,000 | 124.216 |
| Cuajimalpa | 90,000 | 17.88 | 90,000 | 16.35 | 90,000 | 16.143 | 96,000 | 20.66 | 96,000 | 28.366 | 96,000 | 38.073 | 130,000 | 42.686 |
| Cuauhtémoc | 800,000 | 227.07 | 800,000 | 311.88 | 800,000 | 389.154 | 800,000 | 467.51 | 800,000 | 488.746 | 800,000 | 511.125 | 800,000 | 579.209 |
| Gustavo A. Madero | 1,000,000 | 52.31 | 1,000,000 | 43.14 | 1,000,000 | 30.928 | 1,000,000 | 43.15 | 1,000,000 | 42.871 | 1,100,000 | 35.925 | 1,100,000 | 31.444 |
| Iztacalco | 314,000 | 15.06 | 314,000 | 3.65 | 314,000 | 10.323 | 314,000 | 18.90 | 314,000 | 21.824 | 317,000 | 37.078 | 317,000 | 39.226 |
| Iztapalapa | 1,300,000 | 237.72 | 1,300,000 | 170.64 | 1,300,000 | 135.098 | 1,300,000 | 143.60 | 1,300,000 | 107.444 | 1,341,600 | 86.566 | 1,341,600 | 103.960 |
| Magdalena Contreras | 157,147 | 32.61 | 157,747 | 18.68 | 157,747 | 30.038 | 157,747 | 40.25 | 75,513 | 44.722 | 150,806 | 43.066 | 165,886 | 43.691 |
| Miguel Hidalgo | 255,500 | 181.14 | 255,500 | 170.14 | 255,500 | 179.008 | 260,610 | 253.51 | 113,063 | 271.137 | 260,610 | 226.013 | 260,610 | 264.668 |
| Milpa Alta | 30,000 | 7.82 | 39,400 | 7.80 | 30,000 | 6.860 | 30,000 | 7.09 | 30,000 | 7.479 | 30,000 | 1.616 | 30,000 | 1.916 |
| Tláhuac | 167,000 | 48.28 | 160,000 | 32.85 | 160,000 | 34.828 | 160,000 | 33.57 | 150,025 | 77.300 | 150,000 | 6.226 | 150,000 | 6.973 |
| Tlalpan | 150,000 | 10.31 | 340,000 | 3.34 | 7 | 4.247 | 360,000 | 56.71 | 360,000 | 38.673 | 380,000 | 31.012 | 380,000 | 36.321 |
| Venustiano Carranza | 555,000 | 144.95 | 530,000 | 153.03 | 474,485 | 179.098 | 474,485 | 237.75 | 474,485 | 145.906 | 474,485 | 150.168 | 511,000 | 188.470 |
| Xochimilco | 200,000 | 42.99 | 231,400 | 42.19 | 231,400 | 67.320 | 231,400 | 125.81 | 232,000 | 89.886 | 232,000 | 95.567 | 232,000 | 95.567 |
| Transport | 4,500,000 | 693.27 | 2,555,000 | 1005.50 | 6,112,869 | 1192.591 | 4,036,808 | 1538.08 | 8,548,207 | 2,351.951 | 9,773,263 | 2547.385 | 9,773,558 | 1995.142 |
| Compost Treatment | ||||||||||||||
| Separation | ||||||||||||||
| Final disposal | 3,556,300 | 421.80 | 1,640,000 | 949.41 | 1,640,000 | 811.235 | ||||||||
| Specialized collection | 1,600,000 | 33.86 | 14,650 | 22.51 | 14,650 | 54.713 | ||||||||
Appendix E
| Country | US | Mexico | Tahiland | China | Pakistan | |
|---|---|---|---|---|---|---|
| City | New York | Mexico City | Bangkok | Zhengzhou | Lahore | |
| Country Income category | B1 | High | High-middle | Upper-Midel | Lower-middle | Lower-middle |
| Population | B2 | 8,623,000 | 8,811,000 | 10,600,000 | 9,881,000 | 8,160,000 |
| Waste generation | B3 | 4,562,500 | 4,744,270 | 4,200,000 | 2,555,000 | 1,916,000 |
| Waste perCapita (kg/year) | W1 | 529 | 538 | 396 | 259 | 235 |
| Waste perCapita (kg/day) | 1.45 | 1.48 | 1.09 | 0.71 | 0.64 | |
| Waste collection coverage | 1.1 | 100% | 82% | 90% | 50% | 77% |
| Waste captured by the system | 1.2 | 100% | 93% | 100% | 95% | 80% |
| Quality of waste collection service | 1C | 91% | 67% | 50% | 92% | 58% |
| Controlled treatment and disposal | 2 | 100% | 92% | 100% | 100% | 8% |
| Quality of environmental protection of waste treatment and disposal | 2E | 100% | 65% | 75% | 80% | 37% |
| Recycling rate | 3 | 47% | 33% | 23% | 45% | 35% |
| Quality of 3Rs—reduce, reuse, recycle-provision | 3R | 60% | 50% | 42% | 35% | 17% |
| User inclusivity | 4U | 95% | 54% | 42% | 50% | 37% |
| Provider inclusivity | 4P | 50% | 30% | 45% | 10% | 50% |
| Financial sustainability | 5F | 100% | 50% | 71% | 95% | 54% |
| Adequacy of national solid waste management framework | 6N | 100% | 33% | 50% | 93% | 29% |
| Local institutional coherence | 6l | 95% | 58% | 50% | 90% | 62% |
References
- Kaza, S.; Yao, L.; Bhada-Tata, P.; Van Woerden, F. What a Waste 2.0: A Global Snapshot of Solid Waste Management to 2050; The World Bank: Washington, DC, USA, 2018. [Google Scholar]
- Manaf, L.A.; Samah, M.A.A.; Zukki, N.I.M. Municipal solid waste management in Malaysia: Practices and challenges. Waste Manag. 2009, 29, 2902–2906. [Google Scholar] [CrossRef] [PubMed]
- Mavropoulos, A.; Wilson, D.C.; Appelqvist, B.; Velis, C.; Cooper, J. Globalization and Waste Management Final Report; International Solid Waste Association: Vienna, Austria, 2014. [Google Scholar]
- Wilson, D.C.; Rodic, L.; Scheinberg, A.; Velis, C.A.; Alabaster, G. Comparative analysis of solid waste management in 20 cities. Waste Manag. Res. 2012, 30, 237–254. [Google Scholar] [CrossRef] [PubMed]
- United Nations. World Urbanization Prospects: The 2009 Revision; UN: New York, NY, USA, 2017. [Google Scholar]
- Escalante, N.I.; Rymkiewicz, A.; Kranert, M. Understanding Waste Management in a Megacity-Experiences in Addis Ababa, Ethiopia; International Solid Waste Association: Stuttgart, Germany, 2010. [Google Scholar]
- Mavropoulos, A. Globalization, Megacities and Waste Management; International Solid Waste Association: Athens, Greece, 2010. [Google Scholar]
- Wilson, D.C. Development drivers for waste management. Waste Manag. Res. 2007, 25, 198–207. [Google Scholar] [CrossRef] [PubMed]
- Marshall, R.E.; Farahbakhsh, K. Systems approaches to integrated solid waste management in developing countries. Waste Manag. 2013, 33, 988–1003. [Google Scholar] [CrossRef]
- Mavropoulos, A. Megacities Sustainable Development and Waste Management in the 21st Century; International Solid Waste Association: Vienna, Austria, 2014. [Google Scholar]
- Guerrero, L.A.; Maas, G.; Hogland, W. Solid waste management challenges for cities in developing countries. Waste Manag. 2013, 33, 220–232. [Google Scholar] [CrossRef]
- Guibrunet, L. What is “informal” in informal waste management? Insights from the case of waste collection in the Tepito neighbourhood, Mexico City. Waste Manag. 2019, 86, 13–22. [Google Scholar] [CrossRef]
- United Nations Human Settlements Programme. Solid Waste Management in the World’s Cities: Water and Sanitation in the World’s Cities 2010; UN-HABITAT/Earthscan: Nairobi, Kenya, 2010; ISBN 9781849711708. [Google Scholar]
- Secretaría del Medio Ambiente de la Ciudad de México. PGIRS 2016–2020; Secretaría del Medio Ambiente de la Ciudad de México: Mexico City, Mexico, 2016. [Google Scholar]
- Kennedy, C.A.; Stewart, I.; Facchini, A.; Cersosimo, I.; Mele, R.; Chen, B.; Uda, M.; Kansal, A.; Chiu, A.; Kim, K.-G.; et al. Energy and material flows of megacities. Proc. Natl. Acad. Sci. USA 2015, 112, 5985–5990. [Google Scholar] [CrossRef]
- Secretaría del Medio Ambiente de la Ciudad de México. Programa de Gestión Integral de los Residuos Sólidos para el Distrito Federal 2009–2014. Gaceta Oficial del Distrito Federal 2009, 17, 25–133. [Google Scholar]
- Jefatura de Gobierno Acuerdo por el que Aprueba y Expide el. Programa General de Gestión Integral de los Residuos Sólidos. Gaceta Oficial del Distrito Federal 2004, 14, 7–128. [Google Scholar]
- Jefatura de Gobierno Regalamento de la. Ley de Residuos Sóldios del Distrito Federal. Gaceta Oficial del Distrito Federal 2008, 22, 4–24. [Google Scholar]
- Asamblea Legislativa del Distrito Federal. Ley de Residuos Sólidos del Distrito Federal. Gaceta Oficial del Distrito Federal 2003, 22, 2–20. [Google Scholar]
- Guibrunet, L.; Sanzana Calvet, M.; Castán Broto, V. Flows, system boundaries and the politics of urban metabolism: Waste management in Mexico City and Santiago de Chile. Geoforum 2017, 85, 353–367. [Google Scholar] [CrossRef]
- Secretaría del Medio Ambiente de la Ciudad de México. Inventario de Residuos Sólidos CDMX 2017; Secretaría del Medio Ambiente de la Ciudad de México: Mexico City, Mexico, 2018. [Google Scholar]
- Centro Interdisciplinario de Investigaciones y Estudios Sobre Medio Ambiente y Desarrollo. Diagnóstico Actual del Flujo de Residuos Sólidos Urbanos que se Genera en el Distrito Federal; Centro Interdisciplinario de Investigaciones y Estudios Sobre Medio Ambiente y Desarrollo: Mexico City, Mexico, 2013. [Google Scholar]
- Tsydenova, N.; Vázquez Morillas, A.; Cruz Salas, A. Sustainability assessment of waste management system for Mexico City (Mexico)—Based on analytic hierarchy process. Recycling 2018, 3, 45. [Google Scholar] [CrossRef]
- Castillo Berthier, H. Garbage, work and society. Resour. Conserv. Recycl. 2003, 39, 193–210. [Google Scholar] [CrossRef]
- Wismer, S.; Lopez de Alba Gomez, A. Evaluating the Mexican Federal District’s integrated solid waste management programme. Waste Manag. Res. 2011, 29, 480–490. [Google Scholar] [CrossRef]
- Wilson, D.C.; Velis, C.; Cheeseman, C. Role of informal sector recycling in waste management in developing countries. Habitat Int. 2006, 30, 797–808. [Google Scholar] [CrossRef]
- Wilson, D.C.; Araba, A.O.; Chinwah, K.; Cheeseman, C.R. Building recycling rates through the informal sector. Waste Manag. 2009, 29, 629–635. [Google Scholar] [CrossRef] [PubMed]
- Scheinberg, A.; Anschütz, J. Slim pickin’s: Supporting waste pickers in the ecological modernization of urban waste management systems. Int. J. Technol. Manag. Sustain. Dev. 2006, 5, 257–270. [Google Scholar] [CrossRef]
- McLaren, R.; Coleman, D.; Mayunga, S. Sustainable management of mega growth in megacities. In Proceedings of the International Federation of Surveyors, Cairo, Egypt, 16–21 April 2005; p. 16. [Google Scholar]
- Turcott Cervantes, D.E.; López Martínez, A.; Cuartas Hernández, M.; Lobo García de Cortázar, A. Using indicators as a tool to evaluate municipal solid waste management: A critical review. Waste Manag. 2018, 80, 51–63. [Google Scholar] [CrossRef] [PubMed]
- Greene, K.L.; Tonjes, D.J. Quantitative assessments of municipal waste management systems: Using different indicators to compare and rank programs in New York State. Waste Manag. 2014, 34, 825–836. [Google Scholar] [CrossRef]
- Zaman, A.U. Identification of key assessment indicators of the zero waste management systems. Ecol. Indic. 2014, 36, 682–693. [Google Scholar] [CrossRef]
- Wilson, D.C.; Rodic, L.; Cowing, M.J.; Velis, C.A.; Whiteman, A.D.; Scheinberg, A.; Vilches, R.; Masterson, D.; Stretz, J.; Oelz, B. ‘Wasteaware’ benchmark indicators for integrated sustainable waste management in cities. Waste Manag. 2015, 35, 329–342. [Google Scholar] [CrossRef]
- Yang, Y. Assessment of the Wasteaware Indicator for Selected Cities in the US and China; Columbia University: New York, NY, USA, 2018. [Google Scholar]
- Rana, R.; Ganguly, R.; Kumar Gupta, A. Evaluation of solid waste management in satellite Towns of Mohali and Panchkula–India. J. Solid Waste Technol. Manag. 2017, 43, 280–294. [Google Scholar] [CrossRef]
- Chanhthamixay, B.; Vassanadumrongdee, S.; Kittipongvises, S. Assessing the sustainability level of municipal solid waste management in Bangkok, Thailand by wasteaware benchmarking indicators. Appl. Environ. Res. 2017, 39, 49–61. [Google Scholar] [CrossRef]
- Van De Klundert, A.; Anschütz, J. Integrated Sustainable Waste Management-the Concept, 1st ed.; Scheinberg, A., Ed.; WASTE: Gouda, The Netherlands, 2001; ISBN 90-76639-02-7. [Google Scholar]
- Schübeler, P.; Wehrle, K.; Christen, J. Urban management and infrastructure. In Collaborative Programme on Municipal Solid Waste Management in Low-Income Countries; Swiss Centre for Development Cooperation in Technology and Management: St. Gallen, Switzerland, 1996. [Google Scholar]
- Wilson, D.C.; Carpinterio Rogero, A. Background, definitions, concepts and indicators. In Global Waste Management Outlook; Cannon, T., Ed.; United Nations Environment Programme: Vienna, Austria, 2015; p. 346. ISBN 9789280734799. [Google Scholar]
- The World Bank GDP Per Capita, Atlas Method (Current US$). Available online: https://data.worldbank.org/indicator/NY.GDP.PCAP.CD?end=2017&locations=MX&start=2011 (accessed on 31 January 2019).
- Instituto de Estadística y Geografía Censo Nacional de Gobiernos Municipales y Delegacionales 2017. Available online: http://www.beta.inegi.org.mx/programas/cngmd/2017/ (accessed on 11 December 2018).
- Durán, A.; Garcés, M.; Velasco, A.; Marín, J.C.; Gutiérrez, R.; Moreno, A.; Delgadillo, A. Mexico city’s municipal solid waste characteristics and composition analysis. Revista Internacional de Contaminación Ambiental 2013, 29, 39–46. [Google Scholar]
- Ayala, C.B. Análisis de la Evolución de la Gestión de los Residuos Sólidos Urbanos en el Distrito Federal 1980–2008; Instituto Politécnico Nacional: Mexico City, Mexico, 2012. [Google Scholar]
- Instituto Nacional de Ecología y Cambio Climático. Diagnóstico Básico Para la Gestión Integral de los Residuos Versión Extensa; Instituto Nacional de Ecología y Cambio Climático: Mexico City, Mexico, 2012. [Google Scholar]
- Secretaría del Medio Ambiente de la Ciudad de México Residuos Sólidos. Available online: https://www.sedema.cdmx.gob.mx/programas/programa/residuos-solidos (accessed on 17 November 2018).
- Secretaría de Energía; Banco Mundial. Evaluación Rápida del Uso de la Energía; Delegacion Miguel Hidalgo: Mexico City, Mexico, 2015. [Google Scholar]
- Secretaría de Administración y Finanzas de la Ciudad de México Egresos. Available online: https://data.finanzas.cdmx.gob.mx/egresos/ (accessed on 16 November 2018).
- Banco de México Inflación, Precios, Banco de México. Available online: http://www.anterior.banxico.org.mx/portal-inflacion/index.html (accessed on 9 January 2019).
- Hoornweg, D.A.; Bhada, P. What a Waste: A Global Review of Solid Waste Management; World Bank: Washington, DC, USA, 2012. [Google Scholar]
- European Environment Agency. Managing Municipal Solid Waste-a Review of Achievements in 32 European Countries—European Environment Agency; European Environment Agency: Copenhagen, Denmark, 2013. [Google Scholar]
- Jefatura de Gobierno. Constitución Política de la Ciudad de México. Gaceta Oficial del la CDMx 2017, 20–127. [Google Scholar]
- Secretaría de Medio Ambiente y Recursos Naturales. Ley General para la Prevención y Gestión Integral de los Residuos. D. Oficial de la Federación 2003, 10–37. [Google Scholar]
- Secretaría de Medio Ambiente y Recursos Naturales Programa Nacional para la Prevención y Gestión Integral de Residuos 2009–2012. Available online: https://www.gob.mx/semarnat/acciones-y-programas/programa-para-la-prevencion-y-gestion-integral-de-residuos (accessed on 11 December 2018).
- Cámara-Creixell, J.; Scheel-Mayenberger, C. PetStar PET bottle-to-bottle recycling system, a zero-waste circular economy business model. In Towards Zero Waste; Franco-García, M.L., Carpio-Ahuilar Jorge, C., Hans, B., Eds.; Springer: Cham, Germany, 2019; pp. 191–213. ISBN 978-3-319-92931-6. [Google Scholar]
- Muñoz-Cadena, C.E.; Arenas-Huertero, F.J.; Ramón-Gallegos, E. Comparative analysis of the street generation of inorganic urban solid waste (IUSW) in two neighborhoods of Mexico City. Waste Manag. 2009, 29, 1167–1175. [Google Scholar] [CrossRef]
- Secretaría del Medio Ambiente del la Ciudad de México. Norma ambiental para el distrito federal NADF-024-AMBT-2013, que establece los criterios y especificaciones técnicas bajo los cuales se deberá realizar la separación, clasificación, recolección selectiva y almacenamiento de los residuos del Distrito Feder. Gaceta Oficial del Distrito Federal 2015, 18, 22–43. [Google Scholar]
- Comisión Ambiental de la Megalópolis ¿Qué Hacemos? Available online: https://www.gob.mx/comisionambiental/que-hacemos (accessed on 12 December 2018).
- Medina, M. Municipal solid waste management in third world cities: Lessons learned and a proposal for improvement. In Human Settlement Development; Sassen, S., Ed.; Eoloss Publishers: Oxford, UK, 2009; Volume III, ISBN 978-1-84826-046-7. [Google Scholar]
- OECD. Competitive Cities in the Global Economy; OECD Territorial Reviews; OECD: Paris, France, 2006; ISBN 9789264027084. [Google Scholar]
- Masood, M.; Barlow, C.Y.; Wilson, D.C. An assessment of the current municipal solid waste management system in Lahore, Pakistan. Waste Manag. Res. 2014, 32, 834–847. [Google Scholar] [CrossRef]
- Henry, R.K.; Yongsheng, Z.; Jun, D. Municipal solid waste management challenges in developing countries—Kenyan case study. Waste Manag. 2006, 26, 92–100. [Google Scholar] [CrossRef] [PubMed]
- Mavropoulos, A.; Willson David, C.; Appelqvlst, B.; Vells, C.; Cooper, J. Globalization and waste management phase 1: Concepts and facts. Int. Solid Waste Assoc. 2012. Available online: https://www.iswa.org/index.php?eID=tx_iswaknowledgebase_download&documentUid=2550 (accessed on 7 November 2019).
- Ma, J.; Hipel, K.W. Exploring social dimensions of municipal solid waste management around the globe—A systematic literature review. Waste Manag. 2016, 56, 3–12. [Google Scholar] [CrossRef] [PubMed]
- Vergara, S.E.; Tchobanoglous, G. municipal solid waste and the environment: A global perspective. Annu. Rev. Environ. Resour. 2012, 37, 277–309. [Google Scholar] [CrossRef]
- Seadon, J.K. Sustainable waste management systems. J. Clean. Prod. 2010, 18, 1639–1651. [Google Scholar] [CrossRef]


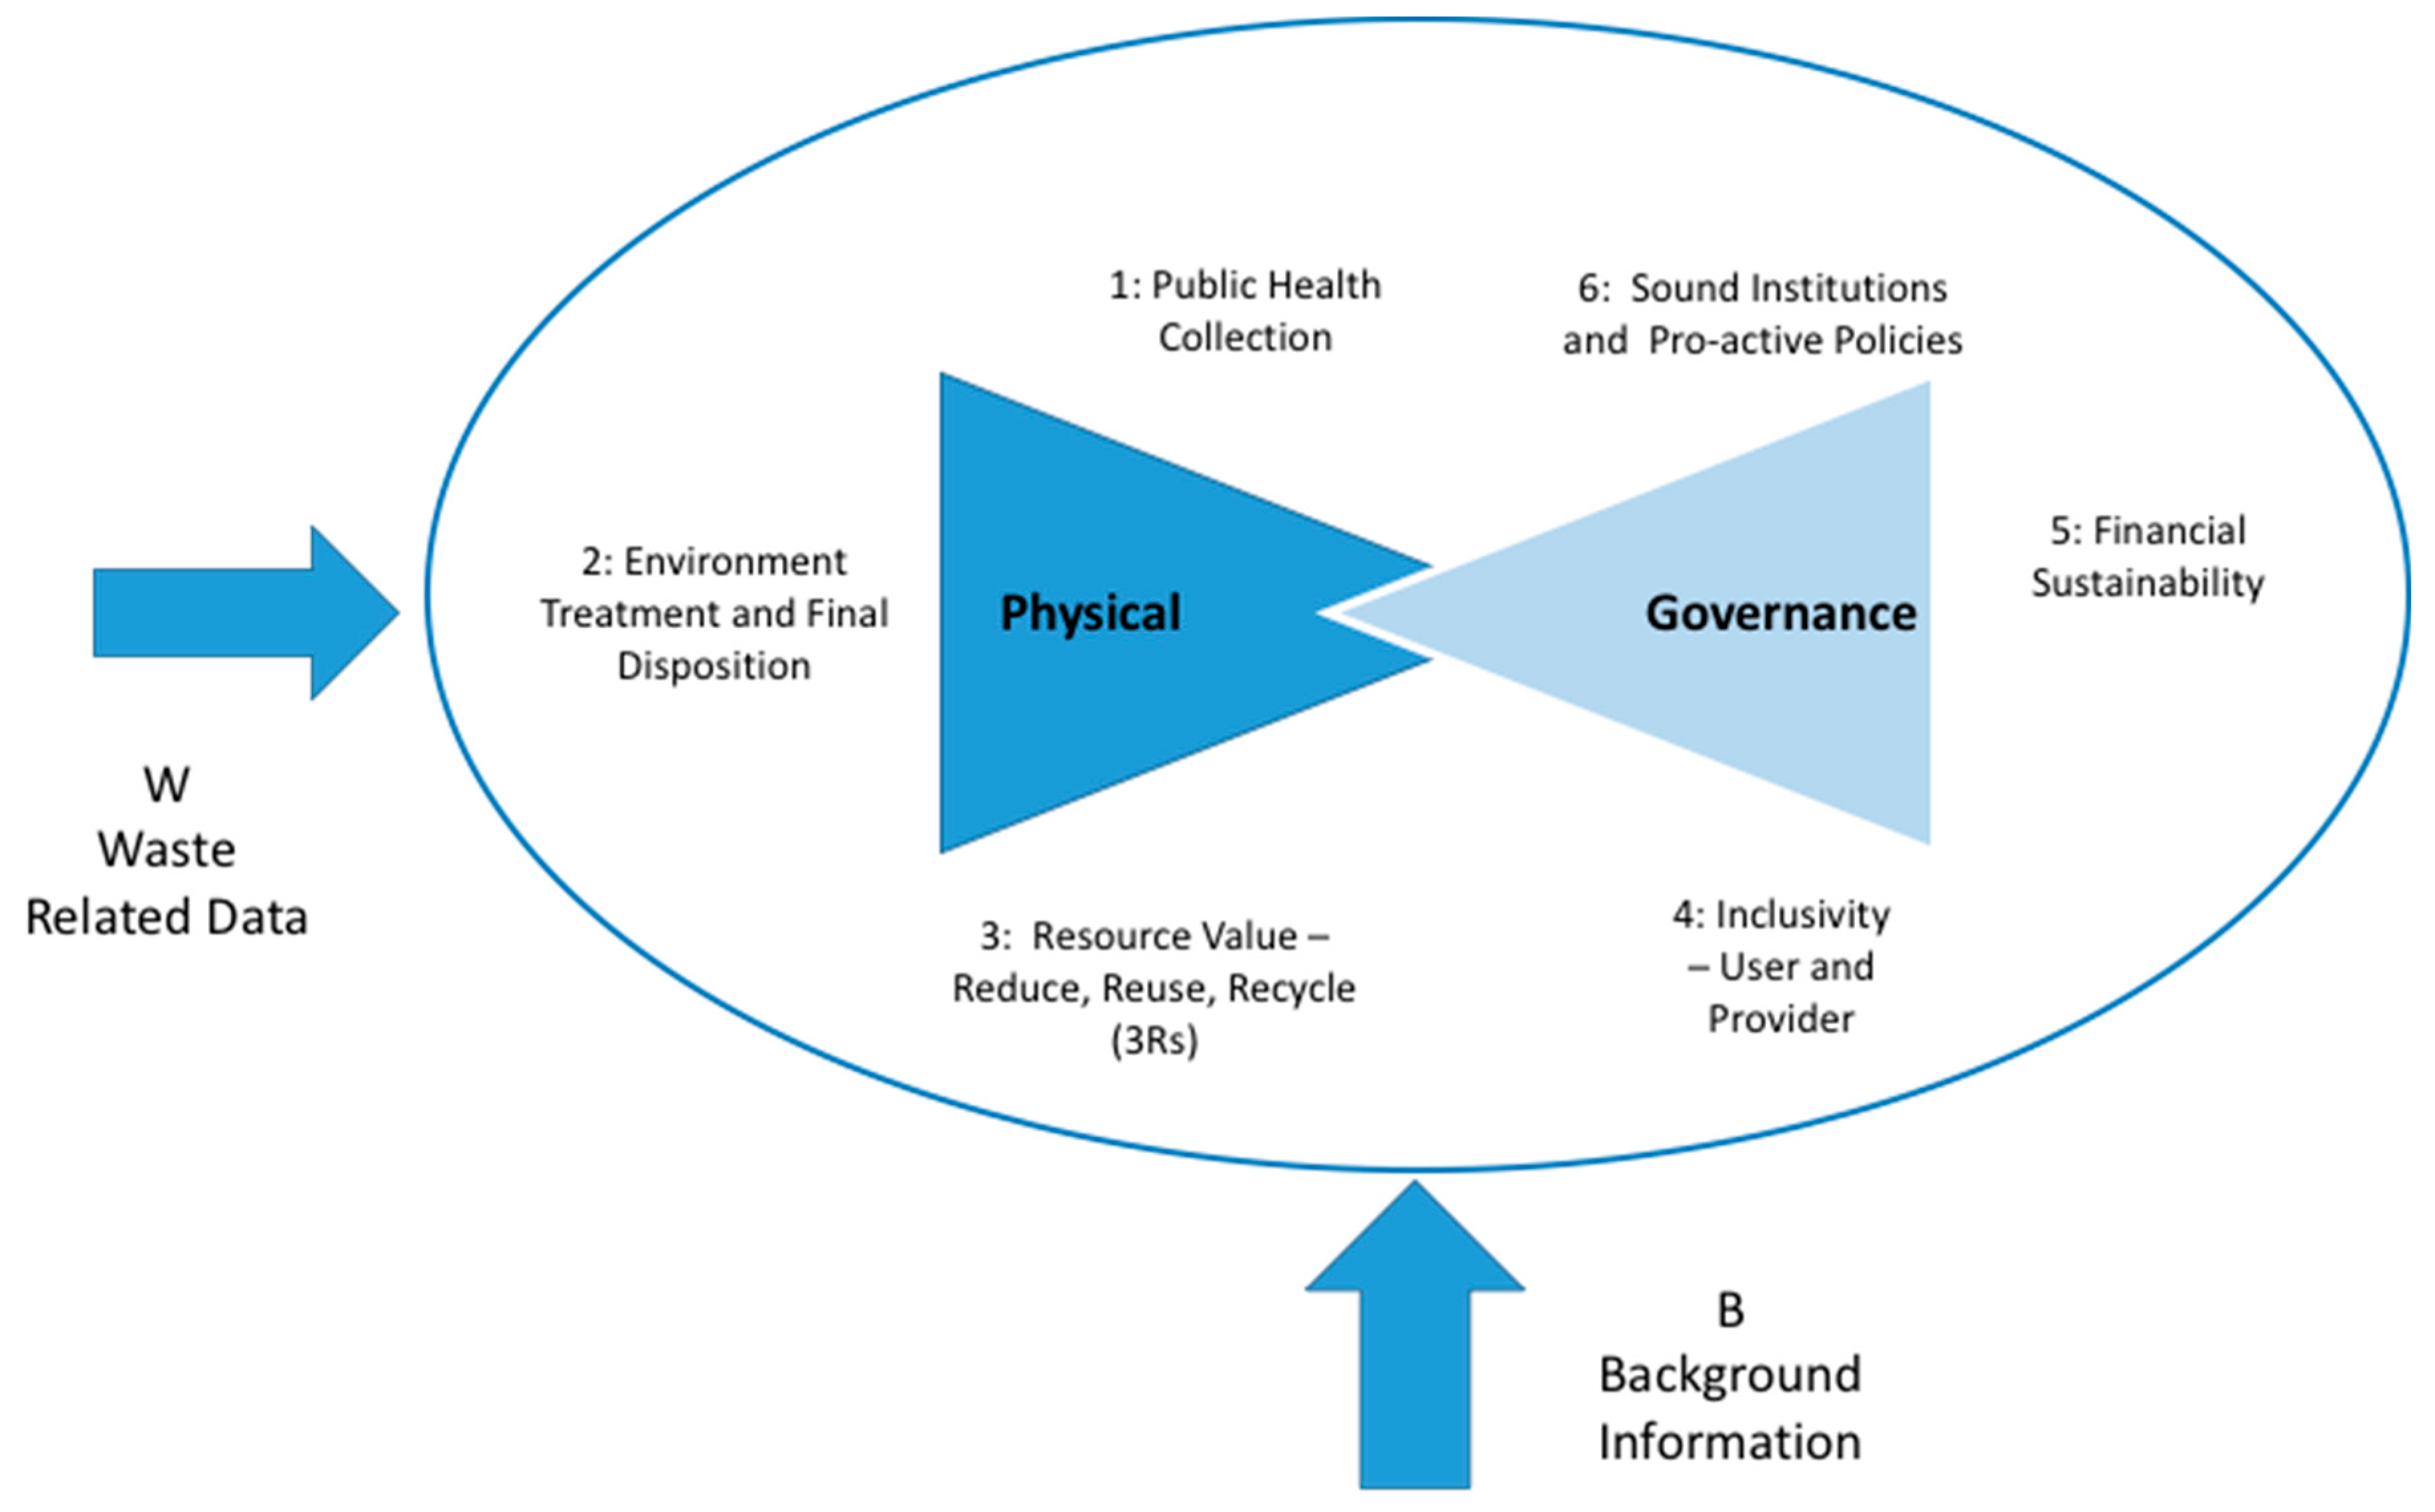
| Components | Indicator | |
|---|---|---|
| Background information | Waste-related data | B.1 National income |
| W.1 Waste per capita | ||
| W.2 Waste composition | ||
| Physical Aspects | Public health waste collection | 1.1 Waste collection coverage |
| 1.2 Waste captured by the system | ||
| 1.3 Quality of waste collection service | ||
| Environmental control (waste treatment and disposal) | 2 Controlled treatment and disposal | |
| 2E Degree of environmental protection in waste treatment and disposal | ||
| Resource management (reduce, reuse and recycle) | 3 Recycling rates | |
| 3R Quality of 3Rs (Reduce, Reuse and Recycle) | ||
| Governance | User inclusivity | 4U User inclusivity |
| Provider inclusivity | 4P Provider inclusivity | |
| Financial sustainability | 5F Financial sustainability | |
| Adequacy of national SWM framework | 6N Adequacy of national SWM framework | |
| Local institutional coherence | 6L Local institutional coherence |
| Number | Criterion | 2011–2017 | Observations |
|---|---|---|---|
| 1C.1 | Appearance of waste collection points | 15 | Medium |
| 1C.2 | Effectiveness of street cleaning | 20 | Medium-high |
| 1C.3 | Effectiveness of collection in low income districts | 10 | Medium |
| 1C.4 | Efficiency and effectiveness of waste transport | 20 | Medium-high |
| 1C.5 | Appropriateness of service planning and monitoring | 10 | Medium |
| 1C.6 | Health and safety of collection workers | 5 | Medium-low |
| Total score | 80 | Medium-high | |
| 1.C Quality of waste collection service * (Total score-normalized) | 66.7% | ||
| Number | Criterion | 2011 | 2012 | 2013–2017 |
|---|---|---|---|---|
| 2E.1 | Degree of control in the reception of MSW in the transfer stations | 10 | 10 | 15 |
| 2E.2 | Degree of control over the treatment and disposal of MSW | 15 | 15 | 15 |
| 2E.3 | Degree of monitoring and verification of environmental controls | 5 | 10 | 10 |
| 2E.4 | Efficiency in the use of the MSW for power generation | N/A | N/A | N/A |
| 2E.5 | Degree of technical competence in the planning, management, and operation of the treatment and final disposal | 10 | 10 | 10 |
| 2E.6 | Occupational health and safety | 15 | 15 | 15 |
| Total score | 55 | 60 | 65 | |
| 2.E Quality of environmental protection in the final disposal and treatment * (Total score-normalized) | 55% | 60% | 65% | |
| Medium | Medium | Medium-high | ||
| Number | Criterion | 2011 | 2012–2017 |
|---|---|---|---|
| 3R.1 | Separation at the source of dry waste | 5 | 10 |
| 3R.2 | Quality of recycled organic material (compost) | 20 | 20 |
| 3R.3 | Focus on the top levels of the waste hierarchy | 15 | 15 |
| 3R.4 | Integration of the community and/or informal recyclers with the formal SWM service | 10 | 10 |
| 3R.5 | Environmental protection in recycling | 5 | 5 |
| 3R.6 | Occupational health and safety | 0 | 0 |
| Total score | 55 | 60 | |
| 3R Quality of 3Rs—reduce, reuse, recycle–provision * (Total score-normalized) | 45.8% | 50% | |
| Medium | Medium | ||
| Number | Criterion | 2011 | 2012 | 2013 | 2014 | 2015 | 2016 | 2017 |
|---|---|---|---|---|---|---|---|---|
| 4U.1 | Equity in the provision of the service | 15 | 15 | 15 | 15 | 15 | 15 | 15 |
| 4U.2 | Right to be heard | 10 | 10 | 10 | 10 | 10 | 10 | 10 |
| 4U.3 | User participation level | 16% | 36% | 29% | 26% | 17% | 23% | 23% |
| 0 | 5 | 5 | 5 | 0 | 5 | 5 | ||
| 4U.4 | Feedback mechanisms with users | 10 | 10 | 10 | 10 | 10 | 10 | 10 |
| 4U.5 | Awareness and user education | 5 | 5 | 5 | 15 | 15 | 15 | 15 |
| 4U.6 | Effectiveness in achieving behavioral changes | 16% | 47% | 62% | 39% | 29% | 43% | 43% |
| 0 | 10 | 15 | 5 | 5 | 10 | 10 | ||
| Total score | 40 | 55 | 60 | 60 | 60 | 55 | 65 | |
| 4U Degree of user inclusivity * (Total score-normalized) | 33.3% | 45.8% | 50% | 50% | 50% | 45.8% | 54.2% | |
| Medium-low | Medium | |||||||
| Num. | Criterion | 2011–2017 |
|---|---|---|
| 4P.1 | Legal framework | 0 |
| 4P.2 | Representation of the private sector | 5 |
| 4P.3 | Role of the informal sector and citizenship | 5 |
| 4P.4 | Balance between the interests of the private sector and public provision of services | 10 |
| 4P.5 | Bidding processes | 10 |
| Total score | 30 | |
| 4P Inclusion of service providers * (Total score-normalized) | 30% | |
| Medium-low | ||
| Concept | 2011 (MMXN) | 2012 (MMXN) | 2013 (MMXN) | 2014 (MMXN) | 2015 (MMXN) | 2016 (MMXN) | 2017 (MMXN) |
|---|---|---|---|---|---|---|---|
| Borough (sweeping and collection) | 1423 | 1399 | 1550 | 1940 | 1884 | 1745 | 1949 |
| GDUS (transportation, treatment and final disposal) | 693 | 1006 | 1193 | 1538 | 3352 | 2547 | 1995 |
| Total | 2572 | 3376 | 3608 | 3478 | 4236 | 4293 | 3944 |
| Investment | 382 | 3 | 1 | 38 | 584 | 638 | 41 |
| Operation | 2190 | 3373 | 3607 | 3440 | 3652 | 3655 | 3903 |
| Inflation | 3.82% | 3.57% | 3.97% | 4.08% | 2.13% | 3.36% | 6.77% |
| Number | Criterion | 2011–2014 | 2015–2016 | 2017 |
|---|---|---|---|---|
| 5F.1 | Cost accounting | 15 | 15 | 15 |
| 5F.2 | Coverage of the available budget | 10 | 15 | 10 |
| 5F.3 | Local cost recovery—from households | 5 | 5 | 5 |
| 5F.4 | Affordability of user charges | N/A | N/A | N/A |
| 5F.5 | Pricing of disposal | 15 | 15 | 15 |
| 5F.6 | Access to capital for investment | 5 | 5 | 5 |
| Total score | 50 | 55 | 50 | |
| 5F Financial sustainability * (Total score-normalized) | 50% | 55% | 50% | |
| Medium | Medium | Medium | ||
| Number | Criterion | 2011 | 2012 | 2013–2017 |
|---|---|---|---|---|
| 6N.1 | Legislation and regulations | 15 | 15 | 15 |
| 6N.2 | Strategy and politics | 10 | 10 | 0 |
| 6N.3 | Guidelines for the implementation of procedures | 10 | 10 | 10 |
| 6N.4 | National Institution that implements the MSW policy | 5 | 5 | 5 |
| 6N.5 | Regulation and control | 5 | 5 | 5 |
| 6N.6 | Extended producer responsibility (EPR) or product administration (PS) | 5 | 5 | 5 |
| Total score | 50 | 50 | 40 | |
| 6N Adequacy of national solid waste management framework * (Total score-normalized) | 41.7% | 41.7% | 33.3% | |
| Medium-low | Medium-low | Medium-low | ||
| Number | Criterion | 2011–2016 | 2017 |
|---|---|---|---|
| 6L.1 | Organizational structure coherence | 15 | 20 |
| 6L.2 | Institutional capacity | 10 | 10 |
| 6L.3 | Strategic planning and MSWM in Mexico City | 15 | 15 |
| 6L.4 | Availability and quality of data related to the MSWM | 15 | 15 |
| 6L.5 | Administration, control and supervision of the services provided | 5 | 5 |
| 6L.6 | Regional cooperation | 5 | 5 |
| Total | 65 | 70 | |
| 6L Local institutional coherence * (Total score-normalized) | 54.1% | 58.3% | |
| Medium-high | Medium-high | ||
| No. | Category | Indicator | Result | ||||||||||||||||||||
|---|---|---|---|---|---|---|---|---|---|---|---|---|---|---|---|---|---|---|---|---|---|---|---|
| Dates on Which the Indicator was Applied | 2011 | 2012 | 2013 | 2014 | 2015 | 2016 | 2017 | ||||||||||||||||
| B.1 | National income World Bank | High middle income | |||||||||||||||||||||
| Income per capita | US $/person | 9040 | 9750 | 9960 | 10,180 | 9840 | 9100 | 8610 | |||||||||||||||
| W.1 | Generation per capita of MSW | Kg/year | 521 | 522 | 526 | 530 | 529 | 534 | 538 | ||||||||||||||
| Kg/day | 1.428 | 1.430 | 1.441 | 1.453 | 1.450 | 1.463 | 1.475 | ||||||||||||||||
| W.2 | Composition of organic MSW | % | 49.95% | ||||||||||||||||||||
| 1.1 | Public health—waste collection | Waste collection coverage | 82% | 72% | 73% | 75% | 77% | 77% | 82% | ||||||||||||||
| 1.2 | Waste captured by the system | 90% | 90% | 95% | 95% | 96% | 98% | 93% | |||||||||||||||
| 1C | Quality of waste collection service | 67% | 67% | 67% | 67% | 67% | 67% | 67% | |||||||||||||||
| 2 | Environmental control—waste treatment and disposal | Controlled treatment and disposal | 89% | 87% | 93% | 86% | 94% | 97% | 91% | ||||||||||||||
| 2E | Quality of environmental protection of waste treatment and disposal | 55% | 60% | 65% | 65% | 65% | 65% | 65% | |||||||||||||||
| 3 | Resource value—3Rs—reduce, reuse, recycle | Recycling rate | 16% | 42% | 35% | 29% | 29% | 31% | 33% | ||||||||||||||
| 3R | Quality of 3Rs—reduce, reuse, recycle-provision | 46% | 55% | 50% | 50% | 50% | 55% | 50% | |||||||||||||||
| 4U | Inclusivity | User inclusivity | 33% | 46% | 50% | 50% | 50% | 46% | 54% | ||||||||||||||
| 4P | Provider inclusivity | 30% | 30% | 30% | 30% | 30% | 30% | 30% | |||||||||||||||
| 5F | Financial sustainability | Financial sustainability | 50% | 55% | 50% | 50% | 50% | 55% | 50% | ||||||||||||||
| 6N | Sound institutions, proactive policies | Adequacy of national solid waste management framework | 42% | 42% | 33% | 33% | 33% | 33% | 33% | ||||||||||||||
| 6L | Local institutional coherence | 54% | 54% | 54% | 54% | 54% | 54% | 58% | |||||||||||||||
© 2019 by the authors. Licensee MDPI, Basel, Switzerland. This article is an open access article distributed under the terms and conditions of the Creative Commons Attribution (CC BY) license (http://creativecommons.org/licenses/by/4.0/).
Share and Cite
Gutiérrez Galicia, F.; Coria Páez, A.L.; Tejeida Padilla, R. A Study and Factor Identification of Municipal Solid Waste Management in Mexico City. Sustainability 2019, 11, 6305. https://doi.org/10.3390/su11226305
Gutiérrez Galicia F, Coria Páez AL, Tejeida Padilla R. A Study and Factor Identification of Municipal Solid Waste Management in Mexico City. Sustainability. 2019; 11(22):6305. https://doi.org/10.3390/su11226305
Chicago/Turabian StyleGutiérrez Galicia, Francisco, Ana Lilia Coria Páez, and Ricardo Tejeida Padilla. 2019. "A Study and Factor Identification of Municipal Solid Waste Management in Mexico City" Sustainability 11, no. 22: 6305. https://doi.org/10.3390/su11226305
APA StyleGutiérrez Galicia, F., Coria Páez, A. L., & Tejeida Padilla, R. (2019). A Study and Factor Identification of Municipal Solid Waste Management in Mexico City. Sustainability, 11(22), 6305. https://doi.org/10.3390/su11226305