Article

Performance and Nutritional Properties of Einkorn, Emmer and Rivet Wheat in Response to Different Rotational Position and Soil Tillage

1
The Organic Research Centre, Elm Farm, Hamstead Marshall, Newbury RG20 0HR, UK
2
Department of Agricultural and Food Sciences, Alma Mater Studiorum University of Bologna, 40127 Bologna, Italy
*
Authors to whom correspondence should be addressed.
Sustainability 2019, 11(22), 6304; https://doi.org/10.3390/su11226304
Submission received: 15 September 2019 / Revised: 5 November 2019 / Accepted: 7 November 2019 / Published: 9 November 2019
(This article belongs to the Special Issue Genetic Resources for Sustainable Agriculture)

Abstract

:
Einkorn, emmer, and rivet are three species of wheat that have largely been neglected in modern agriculture. There is a revived interest in these species as potentially successful alternatives to mainstream wheat in organic and low-input cropping systems and as sources of highly nutritious food. However, the availability of literature studies concerning rotational positions and soil tillage management is still scarce. The aim of this study was to explore the field (cover, disease resistance, yield) and quality performance (protein, fats, fiber, polyphenols, flavonoids, and antioxidant activity) of these species when organically grown in the United Kingdom. As part of the H2020 DIVERSIFOOD project, different cultivars of each species, including landraces, populations, old varieties, and where available, commercial varieties, were included in the experiment. Rotational position and tillage systems significantly affected the main agronomic performance of the minor cereals investigated, suggesting that low fertility and shallow-non-inversion tillage might be suitable options to manage tall species. Emmer showed the highest incidence of foliar diseases, whereas einkorn and rivet wheat appeared quasi-immune to the main fungal diseases (stripe rust, septoria). In addition, nutritional and nutraceutical investigation showed that the rotational position and soil management also affect metabolic pathways differently by species and within species, by genotype. Our results suggest a good potential to introduce these species in sustainable cropping systems. Furthermore, the interesting species and cultivar-by-management interactions observed can pave the way for future, better focused, research on these underutilized and underexplored species.

1. Introduction

There are at least 50,000 species of plants that are suitable for human consumption, yet fewer than 300 species make their way into the market [1]. Furthermore, within these species, only a few dozen accessions are grown on a large scale. For instance, the major wheat species grown throughout the world are Triticum aestivum L., which is usually called “common” or “bread wheat”, and Triticum turgidum ssp. durum, which is used for making pasta and often referred to either as “pasta wheat” or “durum wheat”. Other species of the Triticum genus, which had significantly contributed to the world’s food basket for millennia, are nowadays very marginally grown and used [2]. The increasing trend for species and genetic homogeneity in global food production is especially problematic for the challenge of improving agricultural sustainability. In fact, current major staple crops have been largely bred for intensive agriculture with management practices designed to maximize outputs via high inputs [1], and as such, may not intrinsically be the best-suited crops for marginal and organic or low-input environments. This is why the selection and breeding of underutilized species, which have been developed in past, largely low-input agricultural systems, can play a crucial role for future agriculture [3]. The use of the term “underutilized species” defines those non-commodity crops, which are part of a larger agrobiodiversity portfolio, and are often widespread in the past and currently neglected for a variety of agronomic, genetic, economic, social, and cultural factors as part of the sudden transformation of agriculture in the second half of the 20th century [4]. To successfully promote the use of underutilized species, two hypotheses need addressing.
The first hypothesis concerns the potential of underutilized crops to improve cropping systems sustainability and resilience. To this end, diversity between and within species must be assessed in terms of agronomic performance, including local adaptation, disease tolerance, and productive potential under modern, mechanized production methods has to be assessed.
The second concerns the potential of underutilized crops to improve food systems and nutrition. As a matter of fact, trendy consumer requests are to identify products by utilizing crops that are not intensively bred and/or produced on a large scale but focusing on local values, indigenous knowledge, and uses. More specifically, the demand for underutilized grains is based on the assumption that they are ‘natural’ and healthy, which is also due to their common use as whole grains and their consequent higher micronutrient contents [5]. The interest for underutilized grains is also associated with the fact that some of them are reported to be better tolerated by individuals that suffer from intolerance or allergies to modern wheat [6,7]. However, these assumptions need to be investigated and substantiated by building a larger body of evidence [8].
The strategic way forward to foster cultivation and the use of underutilized crops is to embed them in low-input cropping systems, as e.g., under organic conditions, characterized by greater environmental heterogeneity where modern cultivars have often shown suboptimal performance [9]. The problem is not restricted to organic farming, as the whole agriculture is moving toward a reduced use of inputs, and therefore greater exposure to environmental stresses and variability in a path toward greater sustainability. The debate about whether ‘old’ wheat varieties can have better performances, in terms of productivity and quality, than ‘modern’ varieties (where ‘old’ and ‘modern’ may be interpreted as ‘before’ and ‘after’ the widespread diffusion of dwarfing genes [10]), still seems to yield contradictory results [11,12]. These issues can be extended to the broader Triticum genus, to investigate whether other wheat species can prove as an alternative to modern wheat varieties in low-input systems.
Alongside the reduction of chemical inputs, less invasive soil management is a key requirement for the better preservation of soil organic matter, fertility, and cost reduction. Reducing tillage can lead to soil carbon stock increases and hence an improvement in the sustainability of agricultural systems. In low-input systems, the tillage management is moreover strategic for short-term weed control and nitrogen availability [13].
The present study investigated various underutilized wheat species with respect to agronomic performance and nutritional composition. Einkorn (Triticum monococcum ssp. monococcum) [14], emmer (Triticum turgidum ssp. dicoccum) [15], and rivet wheat (Triticum turgidum ssp. turgidum) [16] are underutilized cereal that may prove to be a good alternative to winter wheat (Triticum aestivum L.) growing in the UK, especially in marginal arable lands and organic farming. In fact, unlike spelt (Triticum spelta), which has a small but growing market (2000 tonnes/year [17]), these species have a very limited market in the United Kingdom. This is particularly true for rivet wheat that, despite having been widespread in the British Isles until the first half of the 20th century, is virtually not cultivated at present.
As part of the H2020 DIVERSIFOOD project, this study was part of a work package dedicated to a “participatory on-farm evaluation of underutilized genetic resources”, and as such, has explored modern and ancient genetic resources of these three species as embedded into a path of dialogue with interested organic farmers and supply chain players. Whilst there are studies that relate tillage system with the nutritional and nutraceutical quality of the grain for bread wheat [18], to the best of our knowledge, this study is the first that started exploring the agronomic, nutritional, and nutraceutical properties of these three species in response to different rotational positions and tillage systems.

2. Materials and Methods

2.1. Field Trials

Five einkorn, three emmer, and three rivet wheat entries (Table 1) were tested in three plot-scale experiments conducted over three growing seasons from October 2015 to August 2018. In 2015/16 and 2016/17 experiments were run on a commercial organic farm in Wiltshire (51.367414; −1.529842) and in 2017/18 at the University of Reading’s Crop Research Unit, Sonning Farm, Berkshire (51.481328; −0.898953).
In year one, the crops were drilled on 27 October 2015. The einkorn and emmer were drilled at 15 g/m2 while the rivet was drilled at 400 seeds/m2 and followed a two-year grass ley. Plots were drilled by a plot drill and were 1.85 m wide by 6 m long. Einkorn entries were drilled by species in a randomized complete block (RCB) design with four replicates. Emmer and Rivet entries were drilled according to species in a completely randomized (CR) design. The soil was sampled at drilling and was loam with pH 7.7, NO3—N 15.60 mg kg−1 soil, P 33.6 mg L−1 (index 3), K 136 mg L−1 (index 2), and Mg 82 mg L−1 (index 2). The trial was harvested on 8 September 2016. The average temperature and total precipitation for the growing season were 10.8 °C and 535 mm, respectively. The average soil temperature was 11.26 °C, and the average solar radiation was 8.9 MJ/m².
In year two, the same accessions (except for the Mv Menket) were drilled on 14 October 2016 on a loamy soil with pH 6.4, P 23.2 mg L−1 (index 2), K 109 mg L−1 (index 1), Mg 59 mg L−1 (index 2), following a one-year grass ley. Plots were drilled by a plot drill and were 1.85 m wide by 7 m long. The entries were drilled by species in a three-replicate randomized complete block (RCB) design, using the same seed density of the first year. The trial was harvested on 20 September 2017. The average temperature and total precipitation for the growing season were 10.4 °C and 573 mm, respectively. The average soil temperature was 10.81 °C, and the average solar radiation was 9.6 MJ/m².
The potential performance of these species and entries and their role in current cropping systems was discussed in a meeting with farmers in July 2017. The main interest emerged was to understand whether these crops could successfully fit in rotational position or management systems that would appear to be suboptimal, such as rotational position following a cereal or non-ploughed soils. Following this expression of interest, in year three, the same accessions of einkorn, emmer, and rivet (Table 1) were drilled on 26 October 2017 at Sonning Farm across two rotational positions defined as first and second cereal within an organically managed rotation on a sandy-loamy soil with pH 6.43, P 33.6 mg L−1, K 207 mg L−1, and Mg 59.3 mg L−1. The first cereal position was following two-year grass-legume ley comprising cocksfoot (Dactylis glomerata), red clover (Trifolium pretense), white clover (Trifolium repens), and black medic (Medicago lupulina), in turn following a crop of barley. The second cereal position was following a spring oat crop, in turn following the first cereal position.
Within each rotational position, the field was divided in two blocks. Each block was divided lengthwise in two halves, one ploughed and the other prepared with shallow-non-inversion tillage (SNIT). The ploughed system consisted of vegetation of the previous crop topped close with a flail mower, then ploughed to 250 mm with a Lemken two-furrow reversible plough, immediately before drilling, followed by one pass with the Lely power harrow to complete the seedbed. The final operation was rolling with a ring roller following drilling. The SNIT system had roots of previous vegetation cut just below the surface using a shallow pass with a tractor mounted rotovator (50–75 mm), followed by a shallow pass with a power harrow (Lely) and finally one deeper pass with the power harrow (125 mm) immediately prior to drilling completed the seedbed, with a ring-roll following drilling. Each of the four blocks (two per rotational position), which were lengthwise divided between ploughed and SNIT, was then divided widthwise in three positions so that in each block, entries of each species were sown across the ploughed and the SNIT in the same position in the field. Crops were harvested on 3 August 2018 in the second cereal field, and on 21 August in the first cereal field.
The average temperature and total precipitation for the growing season were 10.1 °C and 484.4 mm, respectively, with a markedly dry and warm late spring and early summer. The average soil temperature was 10.41 °C and the average solar radiation was 10.05 MJ/m². All the climatic data were obtained from the weather station at the Sonning Farm, which is approximately 40 km west of the experimental site of the first and second year.

2.2. Samplings and Assessments

Core morphological and agro-ecosystem performance assessments were performed on all entries in all three years of the experiment, as described below. Crop phenology was monitored according to the BBCH growth scale [20]. The percentage of crop ground cover was visually assessed at the beginning of tillering (BBCH GS22) and at the beginning of stem extension (BBCH GS31) on two 50 × 50 cm quadrates in each plot. Diseases were assessed at full anthesis (BBCH GS 65) and reported as an overall percentage of leaf area affected. Crop height was measured in centimeters once the final height had been reached post-anthesis. Ear number was counted in two 50 × 50 cm quadrates in each plot. When occurred, lodging was assessed before harvest as a sum of different severity classes (angle from the vertical) as follows (l.a. = lodged plot area in the given angle range (%)):
l o d g i n g   s e v e r i t y = ( l . a .   20 ° ÷ 50 ° ) + 2 ( l . a .   50 ° ÷   80 ° ) + 3 ( l . a .   w i t h   f l a t   c r o p   ) 3
Plots were harvested using a Sampo plot combine to provide grain yield in kg per plot. These figures were converted to grain yield in t/ha at 15% moisture content. Yields are reported as hulled grain.

2.3. Quality and Nutritional Characterization

Whole wheat grains of each variety were stone milled (Billy 200, Hawos Mulini, Bad Homburg, Germany), and the nutrient composition was analyzed as outlined below. All determinations were replicated two times, and the results are expressed on a whole flour dry weight basis. Folin–Ciocalteu, gallic acid, and catechin reagent were purchased from Sigma-Aldrich (St. Louis, MO, USA). All reagents were analytical grade unless otherwise stated.
Protein content was determined using a Foss Infratec 1229 NIT spectrophotometer (Global calibration No. WH000003). Lipid analysis was carried out according to the AOAC method [21] using chloroform:methanol (2:1, v/v) for the extraction. The total dietary fiber determination, including the extraction of the soluble and insoluble fibers, was performed according to the enzymatic–gravimetric procedure previously described by Prosky et al. [22] using a Megazyme assay kit (Megazyme International Ireland Ltd., Wicklow, Ireland). The extraction of phenolic acids was performed following the method described by Dinelli et al. [23]. After the extraction of free phenolic acids, the residue was subjected to alkaline and acid hydrolysis to recover the bound phenolic acids. Free and bound phenolic extracts were filtered through a 0.20-μm filter and used for the subsequent analyses. The polyphenol content of each grain sample was determined using the Folin–Ciocalteu procedure described by Singleton et al. [24]. Gallic acid was used as the standard and polyphenol content was expressed as milligrams of gallic acid equivalent (GAE) per 100 g of dry weight. Flavonoids were quantified using catechin standards and the content was expressed as milligrams of catechin equivalent (CE) per 100 g of dry weight. Antioxidant activity was determined using two different analytical methods (DPPH and FRAP assays). The DPPH test was performed following the procedure described by Brand-Williams et al. [25]. Appropriate dilutions of the free and bound phenolic extracts were mixed with 2 mL of DPPH solution, vortexed, and kept in the dark at room temperature for 30 min. Each sample was tested in triplicate and the absorbance was recorded at 517 nm, along with control and blank test tubes. The Trolox calibration curve was plotted as a function of the percentage of DPPH radical scavenging activity, and the final results were expressed as micromoles of Trolox equivalents (TE) per gram of whole-wheat flour (μmol TE g−1). The FRAP test was carried out according to Benzie and Strain [26], with minor modifications. The absorbance values were compared with those of ferric sulfate (FeSO4.7H2O) (0.1–1 mmol L−L) and results were expressed as mmol Fe2+ 100 g−1 of whole-wheat flour.

2.4. Statistical Analysis

In 2015/16 and 2016/17, the data from each species were analyzed through a linear model accounting for the effect of entry and (in 2016/17) of block. Least significant differences between entries were calculated through Tukey’s test.
In 2017/18, data were analyzed by linear mixed-effect models reflecting the nesting structure of the experimental design, with entries nested into species, which were in turn nested into tillage, and afterwards blocks, with two blocks into each of the two rotational positions (hereinafter fields). Analysis by species was run through linear mixed-effect models assuming, as random intercept, the position in the field within tillage and within each block. Keeping the same random effect structure, we constructed a series of six models progressively adding fixed effects respecting the order of nesting as follows: (1) a null model with no fixed effect; (2) a model accounding for field; (3) a model accounting for field and tillage; (4) a model accounting for field, tillage, and species; (5) a model accounting for field, tillage, species, and field-by-species interaction; and (6) a model accounting for field, tillage, species, field-by-species interaction, and tillage-by-species interaction. Homoscedasticity and normality were checked by visual inspection of residual Q-Q plots, and when apparent deviations were detected, data were transformed.
To obtain the significance of each fixed effect, models 1 to 6 were compared by the likelihood ratio test, thereby highlighting the significance of ‘model n’, containing the fixed term of interest, against ‘model n-1’, not accounting for the fixed term of interest. When the difference between a pair of models was significant, the best-fitting model was identified as the one having lowest Akaike’s Information Criterion (AIC) and Bayesian Information Criterion (BIC). In case of significant field-by-species interaction, the same series of models excluding ‘field’ as a fixed term, were applied to the first and second cereal separately. In case of significant tillage-by-species interaction, the same series of models, with ‘position in the field’ within ‘block’ only as a random intercept and excluding the ‘tillage’ fixed term, were applied to the ploughed and SNIT separately. In case both the interaction terms were significant, each of the four field–tillage combinations was analyzed separately, only accounting for ‘position in the field’ as a random intercept.
Based on the best-fitting model, estimated marginal means, related standard errors, and p-values of pairwise comparisons were calculated with Tukey adjustment and the Kenwar–Roger method for degrees of freedom, for the fixed term of interest. Analysis within each species was run with the same approach, excluding ‘position in the field’ from the random effect structure (as it overlaps with the species) and substituting the fixed effect of species with the fixed effect of entry.
To visualize relationships between the tested variables, principal component analysis was run for each species in two steps. First, an interim PCA was run with all the variables included, and the quality of representation (Cos2) of each variable was checked. Second, a definitive PCA was run with those variables with a quality of representation higher than 0.4.
We used R version 3.6.1 “Action of the Toes” on a platform: x86_64-w64-mingw32/x64 (64-bit) [27]. The package ‘agricolae’ was used for post-hoc tests after linear models [28]. The package ‘lme4’ was used for mixed-effect models [29]. The package ‘emmeans’ was used to calculate estimated marginal means [30]. Principal component analyses were visualized through the package ‘factoextra’ [31].

3. Results and Discussion

3.1. Agro-Ecosystem and Productive Performance in 2015/16 and 2016/17

The crop yield of the selected entries was much higher in 2016/17 (2.83 t ha−1) than in 2015/16 (0.90 t ha−1), showing very different growing conditions in the two seasons (Table 2). In the first year, einkorn recorded the highest yield among the three species, with a mean of 1.28 ± 0.12 t ha−1, whereas emmer and rivet yielded less, with 0.59 ± 0.04 t ha−1 and 0.67 ± 0.09 t ha−1, respectively (Table 2). In 2016/17, einkorn recorded the highest yields again, on average 3.13 ± 0.17 t ha−1, followed by rivet, with 2.91 ± 0.30 t ha−1 and emmer with 2.24 ± 0.25 t ha−1. Einkorn entries were significantly differentiated by height at maturity and grain yield in both years, by canopy cover at the onset of stem extension and by ear density in the first year only and for foliar diseases in the second year only. Emmer entries showed differentiated cover at the onset of stem extension in the first year, and by diseases severity and height in the second year. Rivet entries were differentiated by height in the first year and by disease severity in the second (Table 2).
In 2016/17, lodging was observed in all einkorn and rivet entries, except for Mv Menket, with a median severity of 35% in Col 122, and the einkorn CCP, with a median severity of 23% in Mv Alkor and of 18% in Nödik Alakor, for einkorn, and a median severity of 40% for all the three rivet entries.
The most remarkable within-species difference was within einkorn: the modern, dwarf einkorn variety Mv Menket performed consistently worse than the other non-dwarf entries in both years. In fact, it yielded 0.67 ± 0.12 t/ha in 2016/17 and 2.23 ± 0.34 t/ha in 2016/17, whereas the other four, medium-to-tall strawed entries yielded on average 1.43 ± 0.10 t/ha and 3.38 ± 0.13 t/ha in the first and second year, respectively (Table S1). Its remarkably shorter straw, which was significantly shorter than all the other entries by 31% in both years, is useful against lodging. In fact, in 2016/17, lodging was observed in all einkorn and rivet entries except for Mv Menket, with a median severity of 35% in Col 122, and the einkorn CCP, with a median severity of 23% in Mv Alkor and of 18% in Nodik Alakor, for einkorn, and a median severity of 40% for all the three rivet entries. However, shorter straw in Mv Menket was also associated with lower canopy cover at BBCH GS31 (30% and 36% less than the other entries in the first and second year, respectively) and ear density (40% and 24% less than the other entries in the first and second year, respectively).

3.2. Agro-Ecosystem and Productive as Affected by Species, Rotational Position, and Tillage in 2017/18

In 2017/18, all three species were yielding much less than in 2016/17, which was probably due to their growing in lighter soils and to the unusually dry late spring and summer. However, the effects of rotational position (first cereal after a grass–legume ley or second cereal after spring oats), tillage (plough or shallow non-inversion), entry, and their possible interactions were observed with differing patterns along the growing season (Table 3).

3.2.1. Canopy Cover During Vegetative Growth Stages

During BBCH GS22, canopy cover was not affected by the rotational position, but showed a slightly significant effect of tillage, with an overall reduction in the SNIT (31.4 ± 0.8%) compared to the ploughed system (35.1 ± 1.1%) (Figure 1). Species was highly significant, with the highest cover in rivet (38.3 ± 1.3%), following by emmer (33.8 ± 1.3%) and einkorn (29.0 ± 1.3%).
At BBCH GS31, canopy cover was significantly affected by rotational position and by species, and maintained a slightly significant effect of tillage. Canopy cover was higher in the first (59.4 ± 1.8%) than in the second cereal position (50.6 ± 1.8%), and in the ploughed (57.6 ± 1.8%) than in the SNIT system (52.3 ± 1.8%) (Figure 1). Unlike during BBCH GS22, einkorn showed the highest ground canopy cover (59.9 ± 2.1%), with rivet and emmer covering 4.7% and 10.1% less, respectively.

3.2.2. Crop Height at Maturity

A significant reduction in crop canopy height was observed in the second cereal position compared to the first one (respectively 107 ± 2.2 cm and 115 ± 2.2 cm). This result might be linked to lower fertility in the crop following spring oats than that following the grass–legume ley. In fact, a less vigorous growth in the second cereal position can be possibly mediated by lower available N than in a crop following a grass–legume ley. This is commonly found when comparing wheat crops growing in a rotational cropping system with wheat continuous cropping [32]. However, this might have a positive implication for these notoriously tall and lodging-prone crops [33,34].
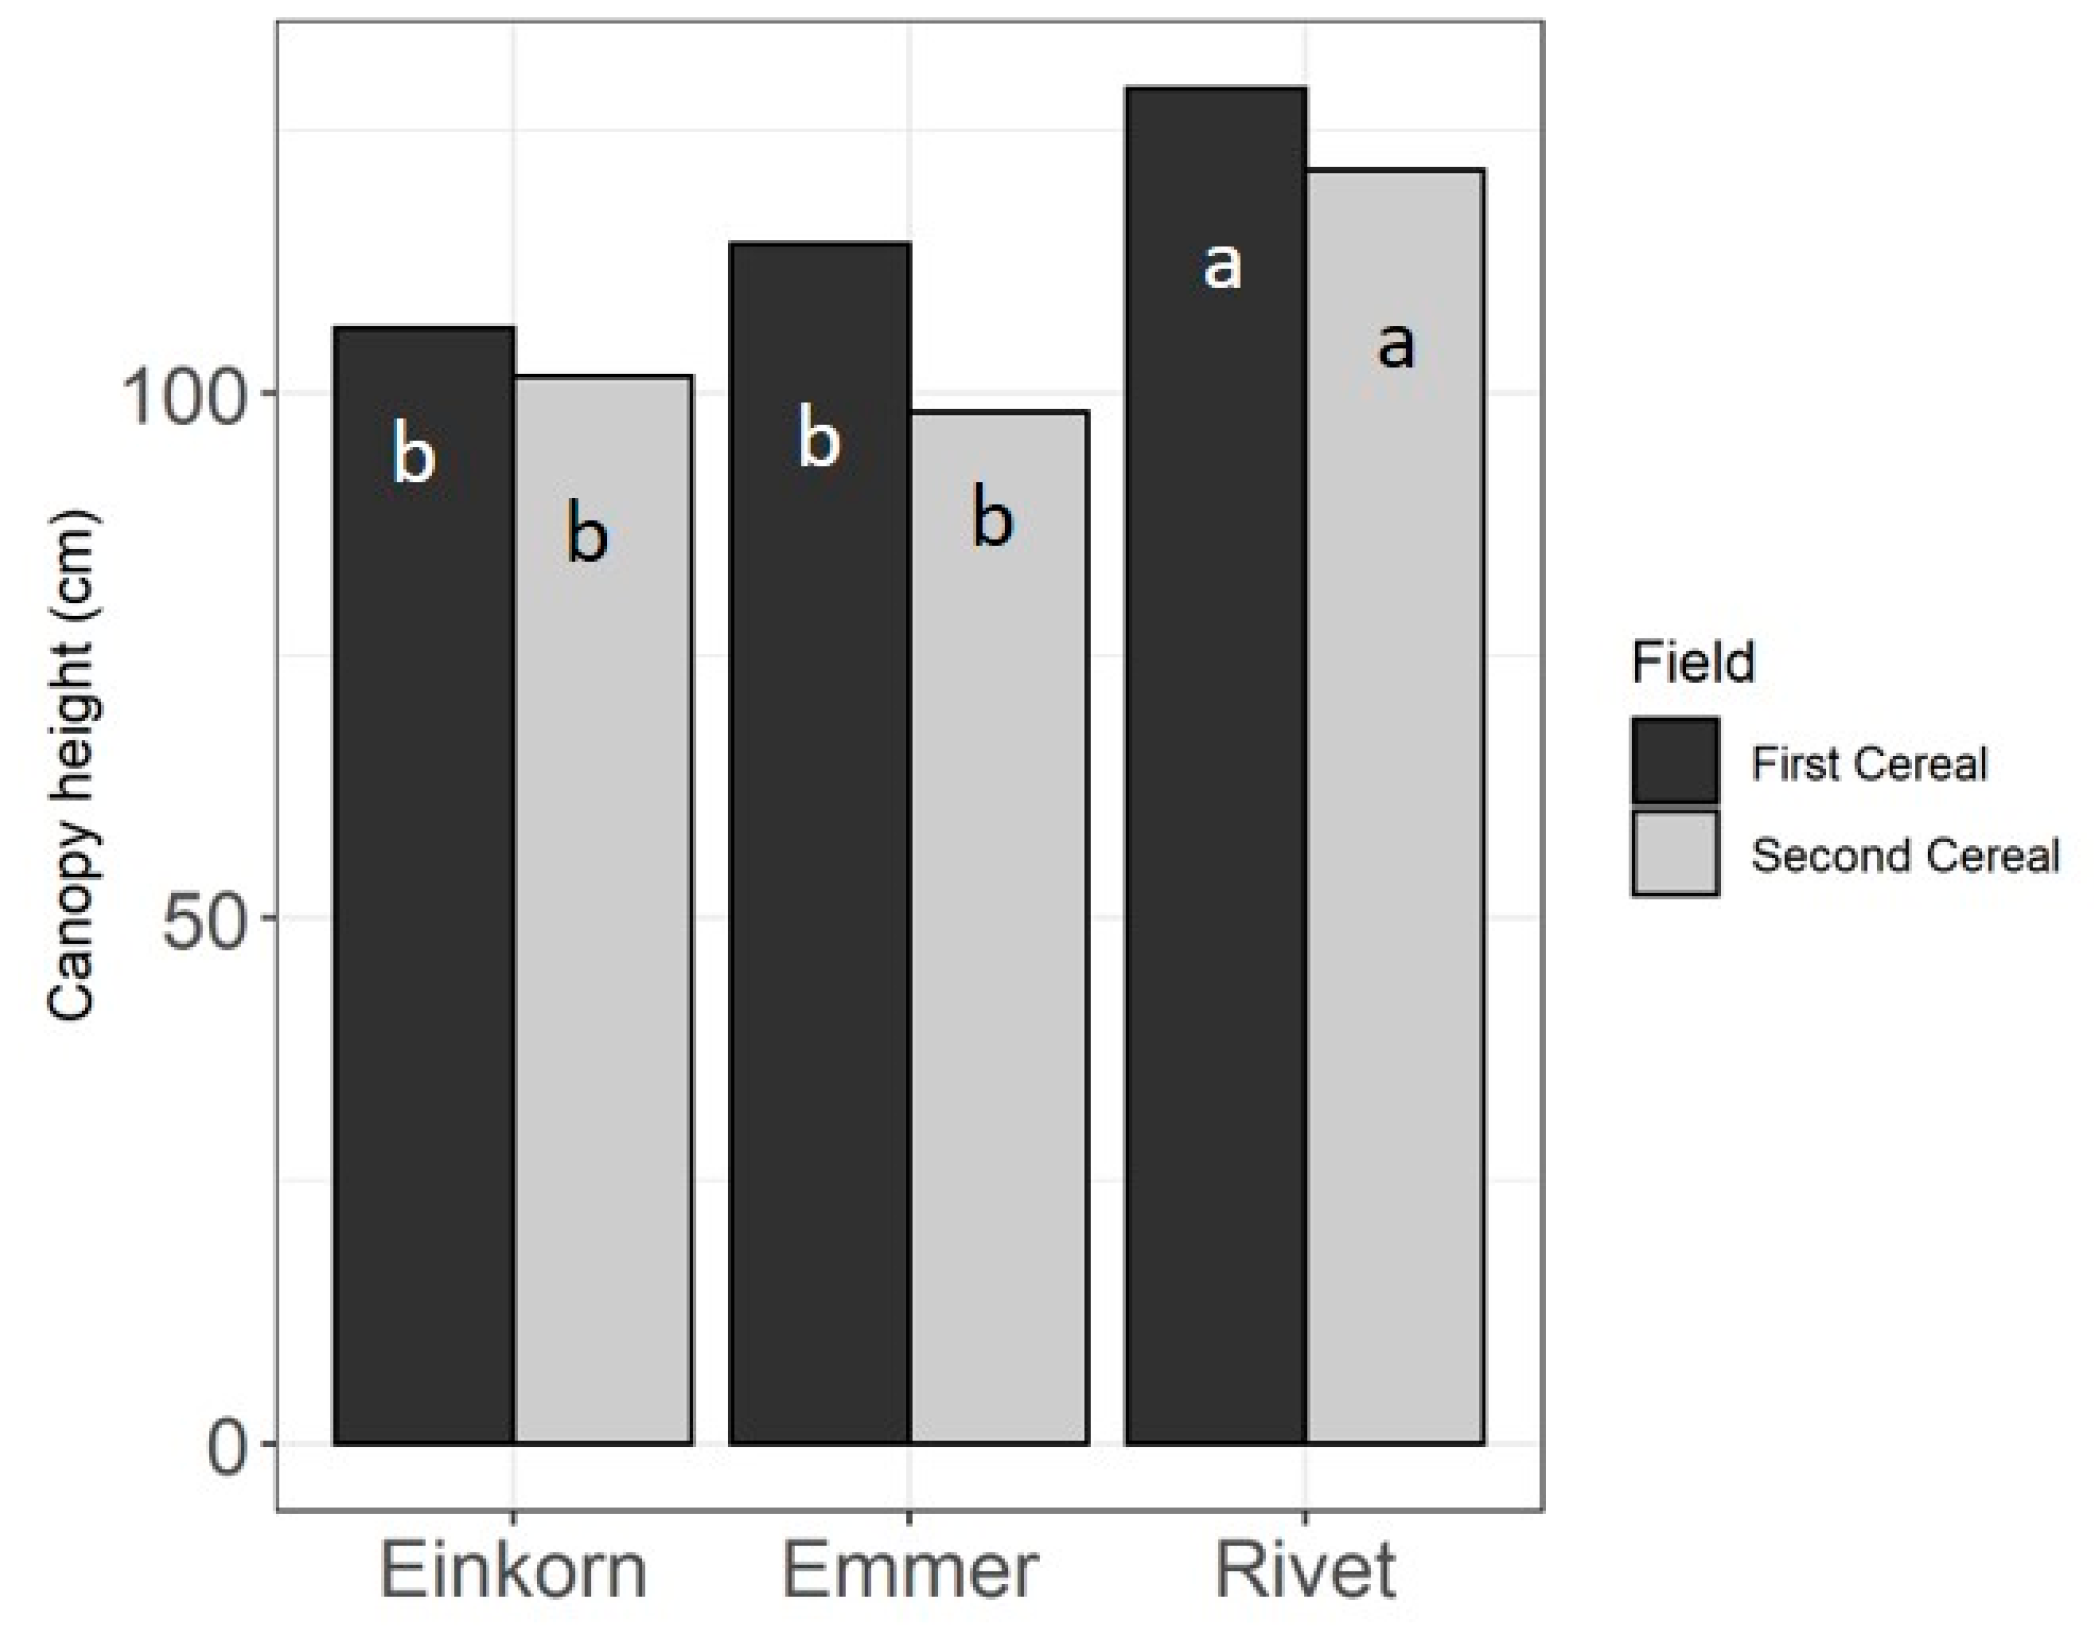
Overall, rivet was the tallest crop, followed by emmer, and in turn followed by einkorn. However, a significant species-by-field interaction was found. In the first cereal position, rivet was tall on average (129 ± 2.7 cm), with emmer and einkorn 14.8 cm and 22.9 cm shorter. In the second cereal position, rivet was 121.2 ± 2.3 cm, 19.6 cm, and 23.0 cm taller than einkorn and emmer, respectively (Figure 2). Significant species-by-field interaction did not reveal different patterns in the two rotational positions. However, in the second cereal field, the effect of tillage was also significant (X2 = 4.113 (1 df), p = 0.0426), with the crops grown on the ploughed areas 9 cm taller than those grown on the SNIT plots, which reinforces the idea that low fertility rotational position and SNIT might be a suitable option to grow tall species.

3.2.3. Foliar Diseases Severity

The severity of foliar diseases showed a slightly significant effect of rotational position. It averaged 6.66 ± 0.2% in the first cereal, and was 98.7% higher in the second cereal position, which was possibly an effect of accumulated inoculum after a previous cereal, although oats should not be a host of wheat parasites [35]. Differences between species followed the trends observed in the previous years, with emmer being by far the most affected by foliar diseases, with an average of 27.7 ± 0.05%. In einkorn and rivet, disease severity was 81.7% and 85.3% lower than that in emmer, respectively. The top disease severity in emmer is a highlight of the three years of trial. Emmer is known to show high variation in resistance to fungal diseases (stripe rust, Septoria) [36]. Having mostly evolved in drier climatic regions [15], it might have been overly exposed to disease pressure in the wetter British climate, and/or to specific strains of the main diseases. On the other hand, einkorn confirms quasi-immunity to many fungal diseases across the three years of field trials [14].

3.2.4. Ear Density and Grain Yield

Ear density was on average 275 ± 8.6 ears/m2. Differences by species followed the trends observed in the previous years, with maximum ear density in einkorn (336 ± 11.3 ears/m2). Compared to einkorn, ear density was 34.8% and 25.0% lower in rivet and in emmer. The difference between emmer and rivet was not significant (p = 0.163). Grain yield was significantly affected by rotational position, with 1.48 ± 0.06 t/ha in the second cereal position and 1.32 ± 0.06 t/ha in the first cereal position, respectively. No effect of tillage was observed. As far as species were concerned, with 1.49 ± 0.06 t/ha, einkorn yielded 0.24 t/ha more than emmer (p = 0.0321). Rivet yielded 1.42 ± 0.07 t/ha with no significant differences with the two other hulled species. No interaction between species and field and/or tillage were observed.

3.3. Quality and Nutritional Performance as Affected by Species, Rotational Position, and Tillage in 2017/18

Similar to what was observed with agronomic variables, different effects of rotational position and tillage were also observed for grain protein content and other nutritional and nutraceutical variables. A significant effect of field-by-species interaction occurred more often than in agronomic variables, and a tillage-by-species interaction was also found for only one parameter (Table 4). This could suggest that the rotational position and soil management can affect metabolic pathways differentially by species and, within-species, by genotype (Table S3).

3.3.1. Nutritional Content

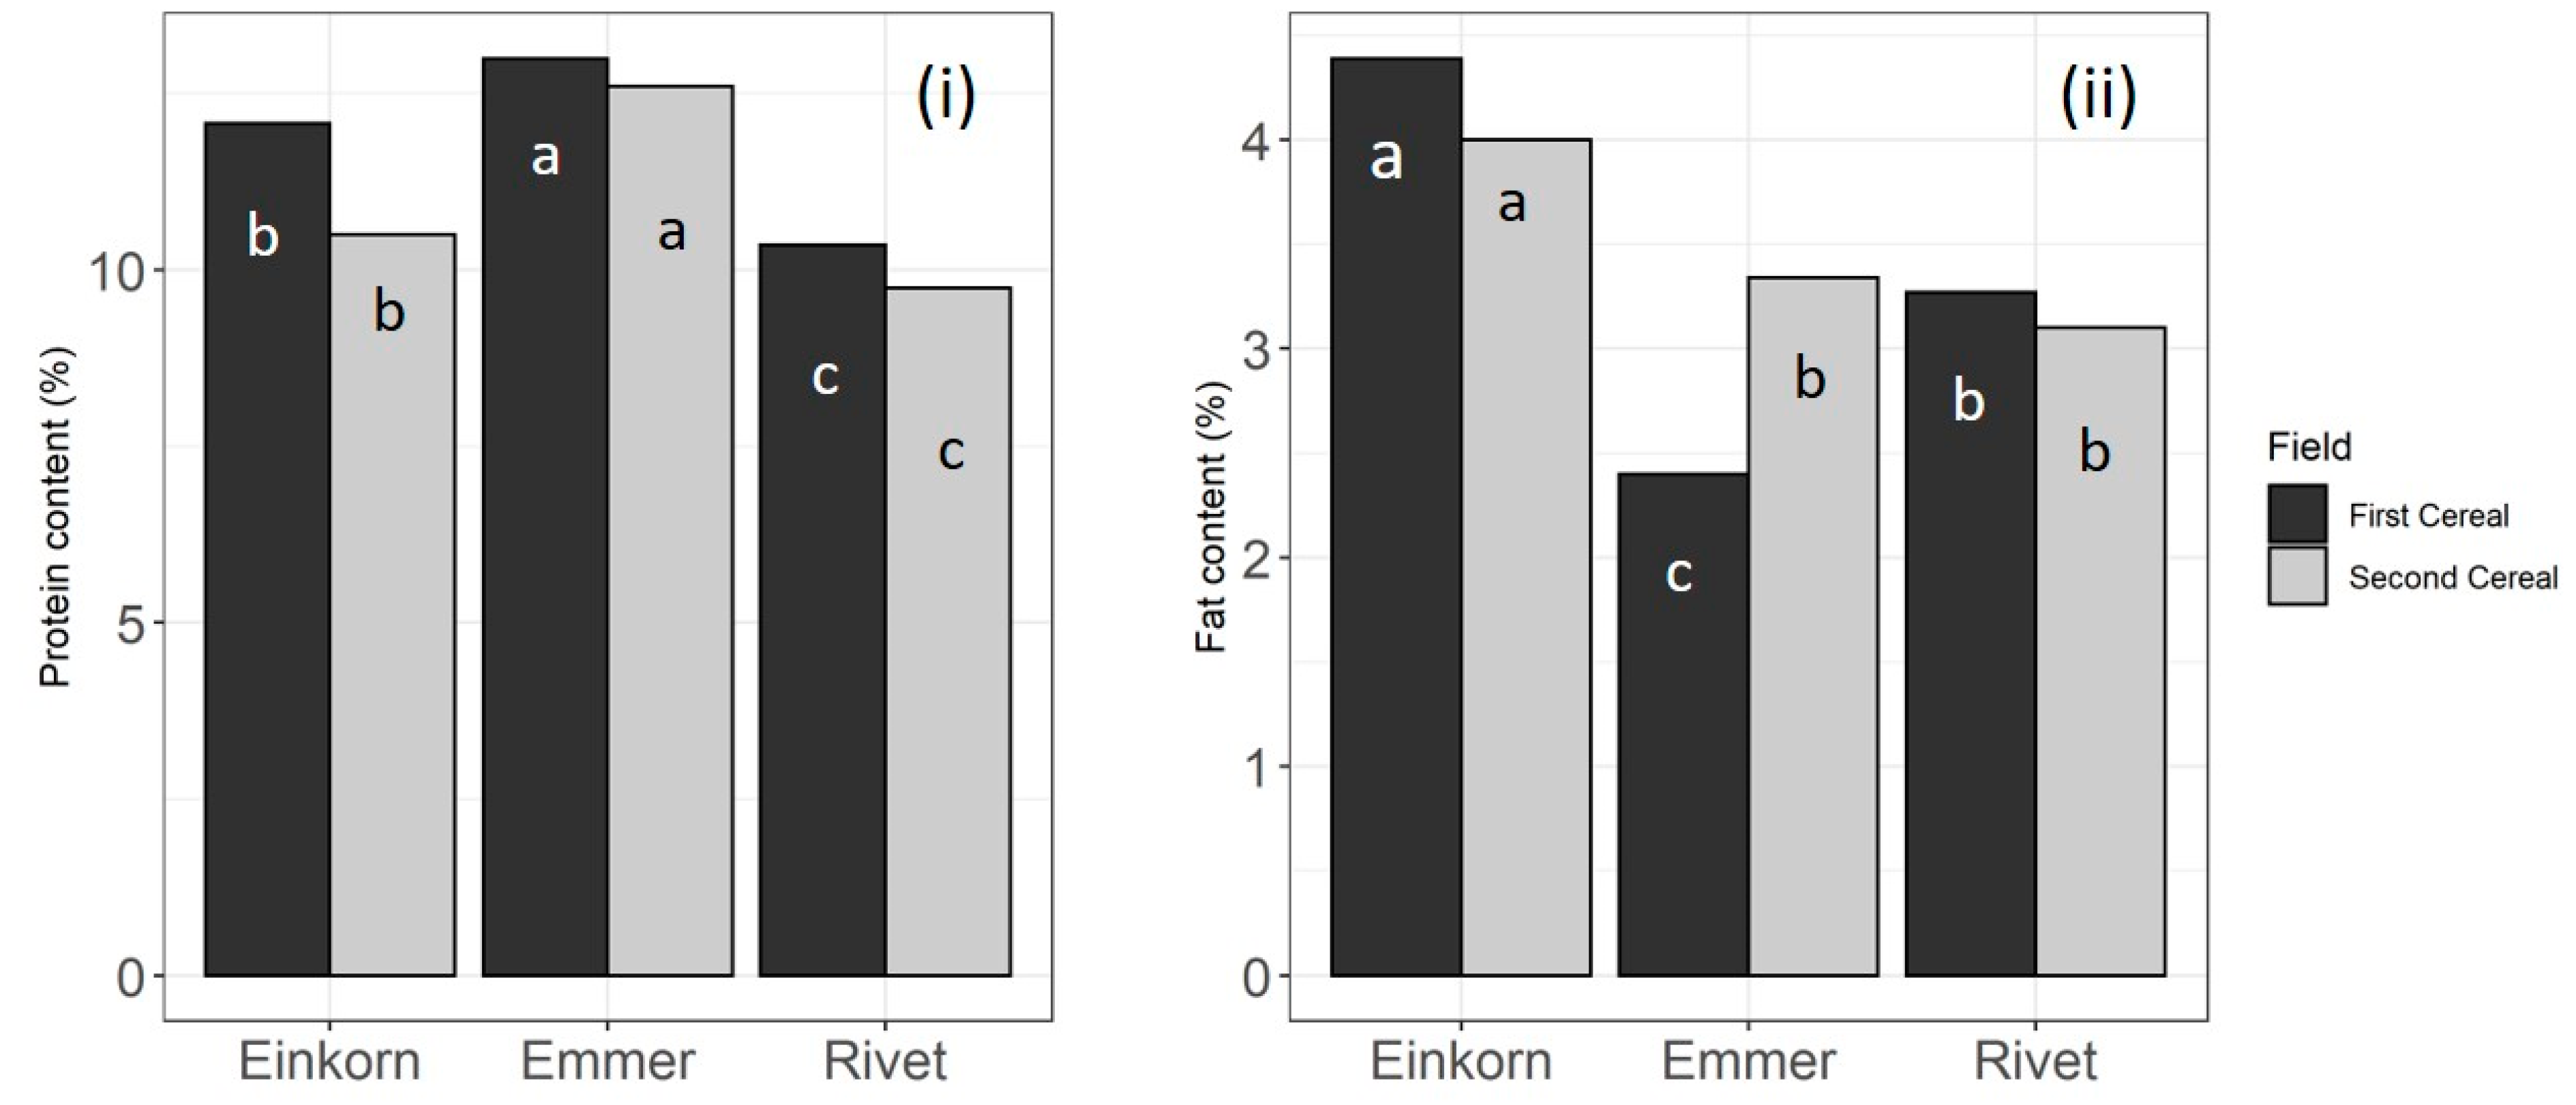
Field-by-species interaction had a strong effect on protein content. In the first cereal position, species effect was highly significant (X2 = 34.819 on 2 df, p = 2.75 × 10⁻⁸) with the highest protein content in emmer (12.9 ± 0.20%), followed by einkorn (12.0 ± 0.19%) and rivet (10.4 ± 0.20%). Despite the significant interaction, in the second cereal position, the effect of species was also significant (X2 = 40.864 on 2 df, p = 1.34 × 10⁻⁹), with top values in emmer (12.6 ± 0.15%), intermediate values in einkorn (10.5 ± 0.13), and the lowest values in rivet (9.75 ± 0.15%) (Figure 3 (i)). Total dietary fiber appeared to be only affected by rotational position, averaging 19.5 ± 0.28% in the first cereal position and 18.7 ± 0.28% in the second one. No effects of tillage, species, or interaction was observed. Conversely, fat content was significantly affected by species and by field-by-species interaction. In the first cereal position, top values were observed in einkorn (4.39 ± 0.14%), intermediate values were observed in rivet (3.27 ± 0.16%), and the lowest values were observed in emmer (2.40 ± 0.16%) (Figure 3 (ii)). In the second cereal position, a similar trend was also observed. In fact, the highest fat content was detected for einkorn (4.00 ± 0.10%), followed by emmer and rivet (0.66% and 0.90% respectively lower than einkorn) (Figure 3 (ii)). Even though the proportions of einkorn, emmer, and rivet wheat germs are similar, the fat content is different between species and appreciably higher than those reported in the literature for common wheat, especially in einkorn, confirming and being in accordance with previous scientific evidences [37,38].

3.3.2. Phenolics Content and Antioxidant Activities

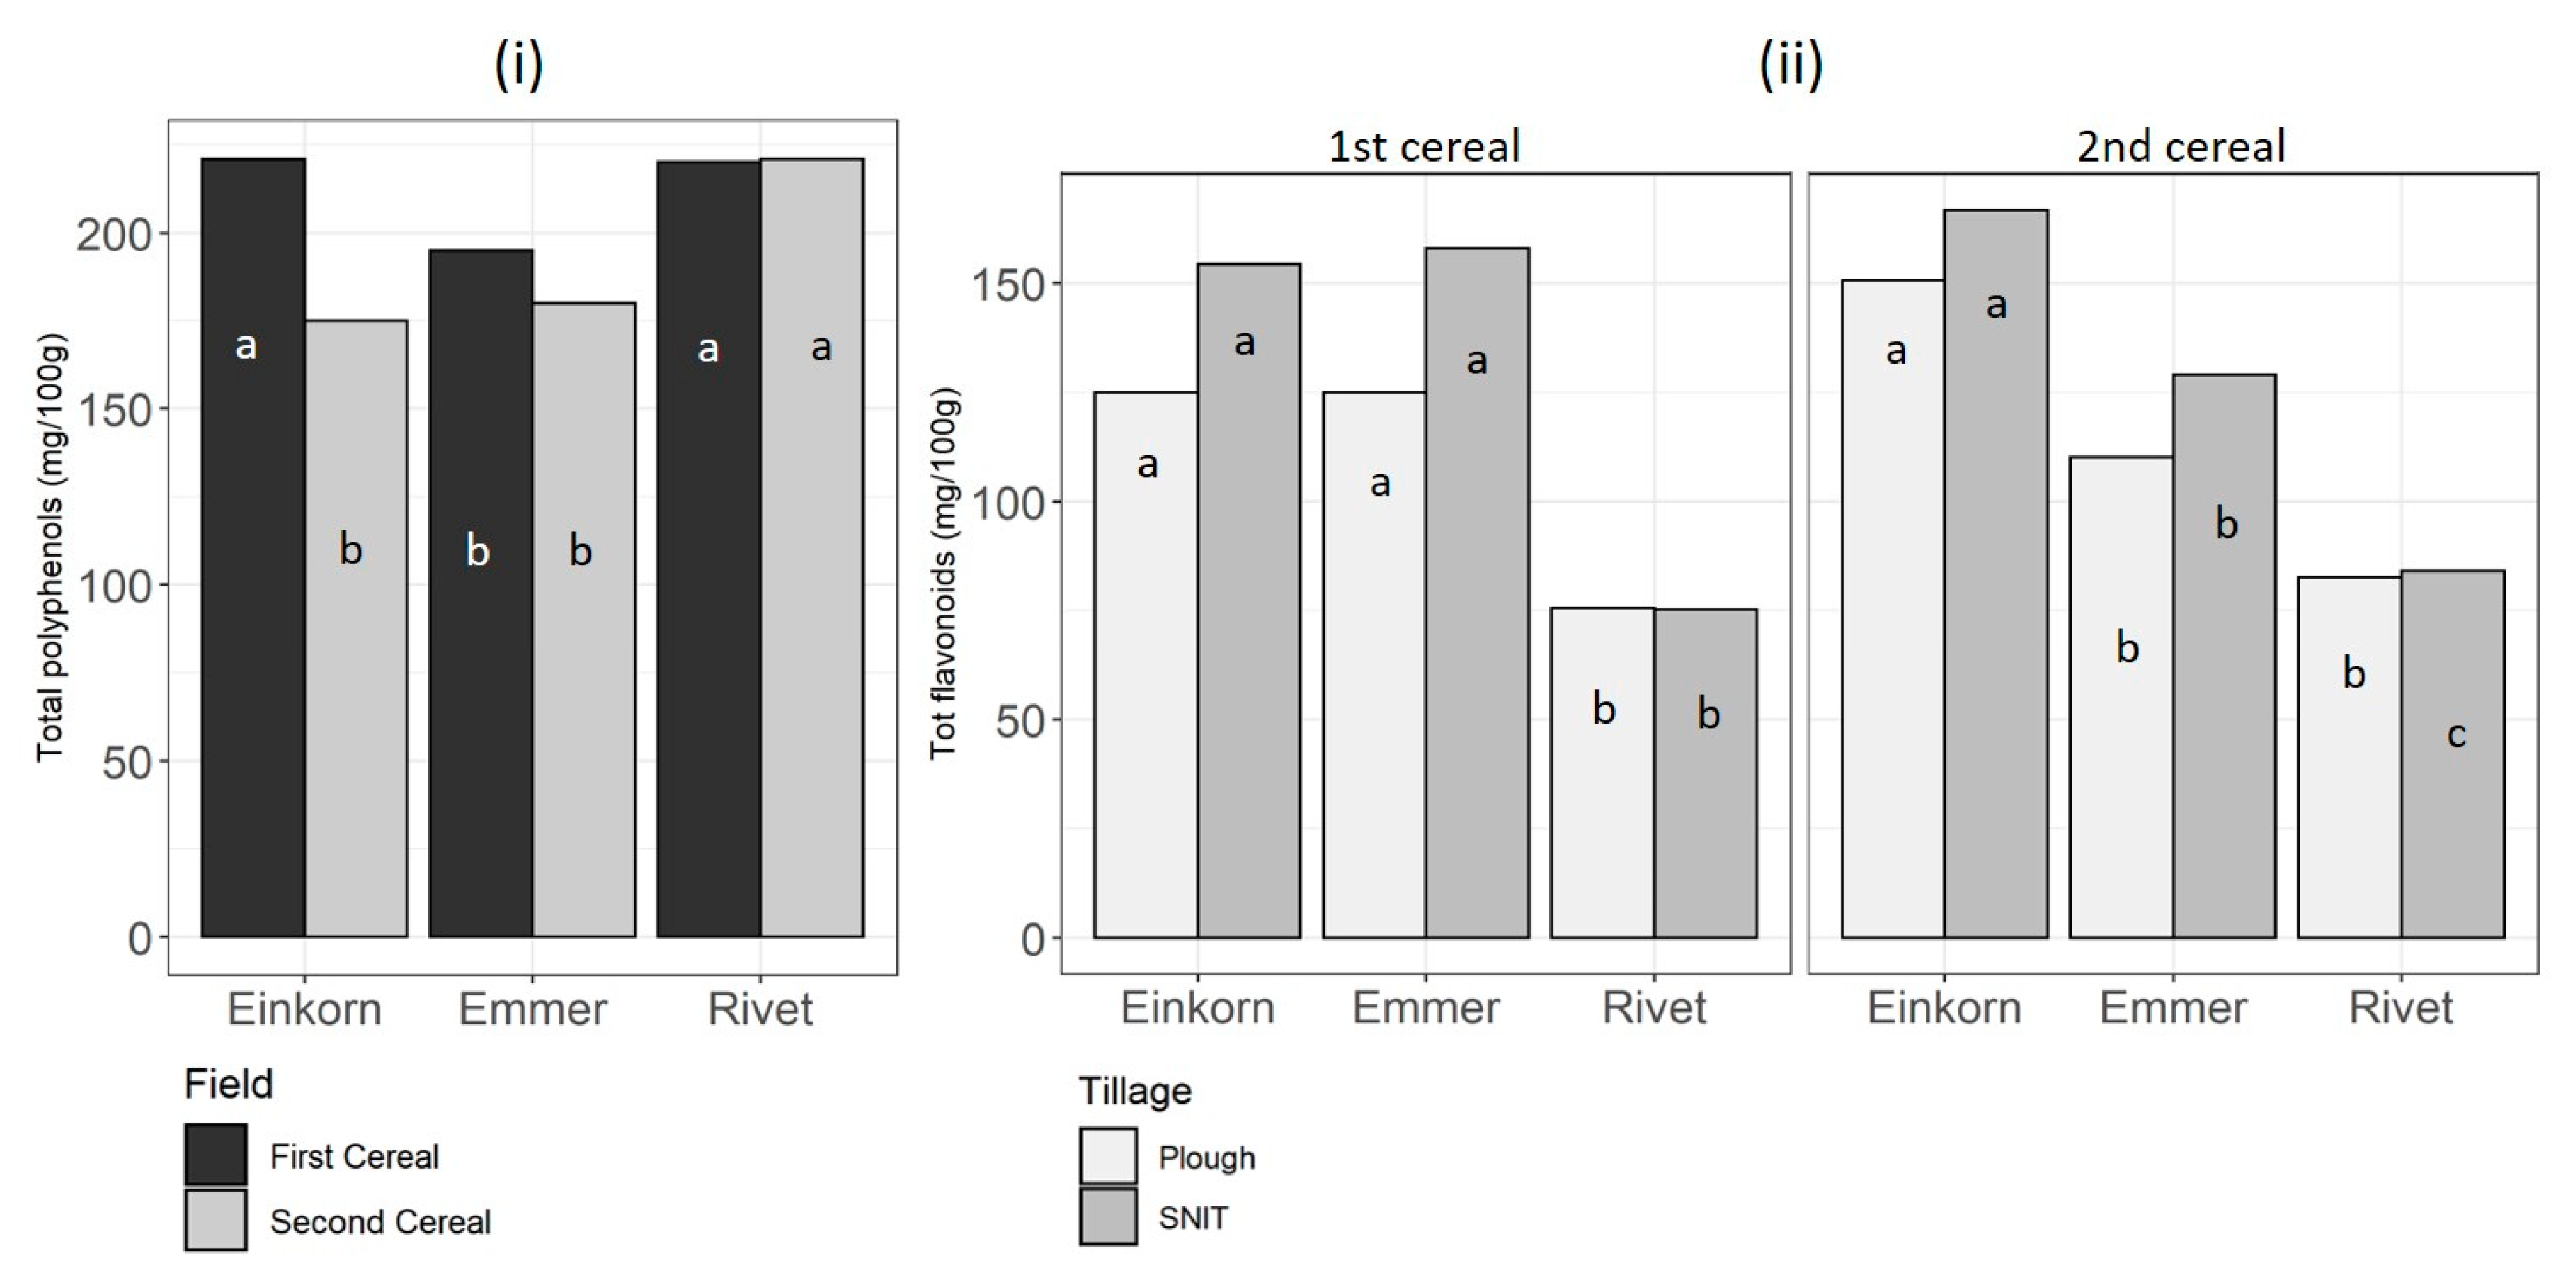
Phenolics are the ecological response of the plant to biotic and abiotic factors. The main interest for these compounds is related to their role in the prevention of several chronic diseases, due to their ability to act as radical scavengers [39]. The total polyphenol content was significantly affected by rotational position, with mean values of 213 ± 3.9 mg 100 g−1 in the first cereal position and 190 ± 3.9 mg 100 g−1 in the second one. In the first cereal position, no effect of tillage was detected, whereas species effect was significant (X2 = 17.4533 (2 df), p = 0.0002). Top values were found in einkorn (221.0 ± 4.2 mg 100 g−1) and in rivet (220.0 ± 4.8 mg 100 g−1), which were both significantly higher than that in emmer (195.0 ± 4.8 mg 100 g−1). Species effect was highly significant also in the second cereal position (X2 = 31.553 (2 df), p = 1.41 × 10⁻⁷), but with a different trend between species. In fact, whilst rivet still had high values (221.0 ± 5.7 mg 100 g−1), which were significantly higher than emmer (180.0 ± 5.7 mg 100 g−1), einkorn showed the lowest value, with 175.0 ± 4.9 mg 100 g−1 (Figure 4 (i)).
Total flavonoid content was not affected by rotational position or tillage. However, species, field-by-species, and tillage-by-species interaction were significant. In the first cereal position, the effect of species was highly significant (X2 = 51.47 (2 df), p = 6.66 × 10⁻¹²), with top levels in emmer (141.5 ± 5.6 mg 100 g−1) and einkorn (139.7 ± 4.9 mg 100 g−1), and the lowest levels in rivet (75.5 ± 5.6 mg 100 g−1). In the second cereal position, species was also highly significant (X2 = 51.852 (2 df), p = 5.50 × 10⁻¹²) but, in this case, einkorn showed a higher value than emmer (150.6 ± 5.9 mg 100 g−1 and 119.5 ± 5.1 mg 100 g−1, respectively), whilst rivet still had the lowest values (83.3 ± 5.0 mg 100 g−1) (Figure 4 (ii)). Tillage-by-species interaction was also significant. In the plough system, there was no effect of rotational position and a species differentiation (X2 = 37.005 (2 df), p = 9.22 × 10⁻⁹), with top levels in einkorn (137.9 5.2 g 100 g−1), intermediate levels in emmer (117.6 6.0), and the lowest levels in rivet (79.1 6.0), which were all three significantly different from one another. In the SNIT system, species were highly differentiated (X2 = 54.59 (2 df), p = 1.4 × 10⁻¹²) with the same trend observed in the ploughed species. Rivet had lower values than both emmer and einkorn (p = 0.0001) but, unlike in the ploughed system, einkorn and emmer were not significantly different (p = 0.104).
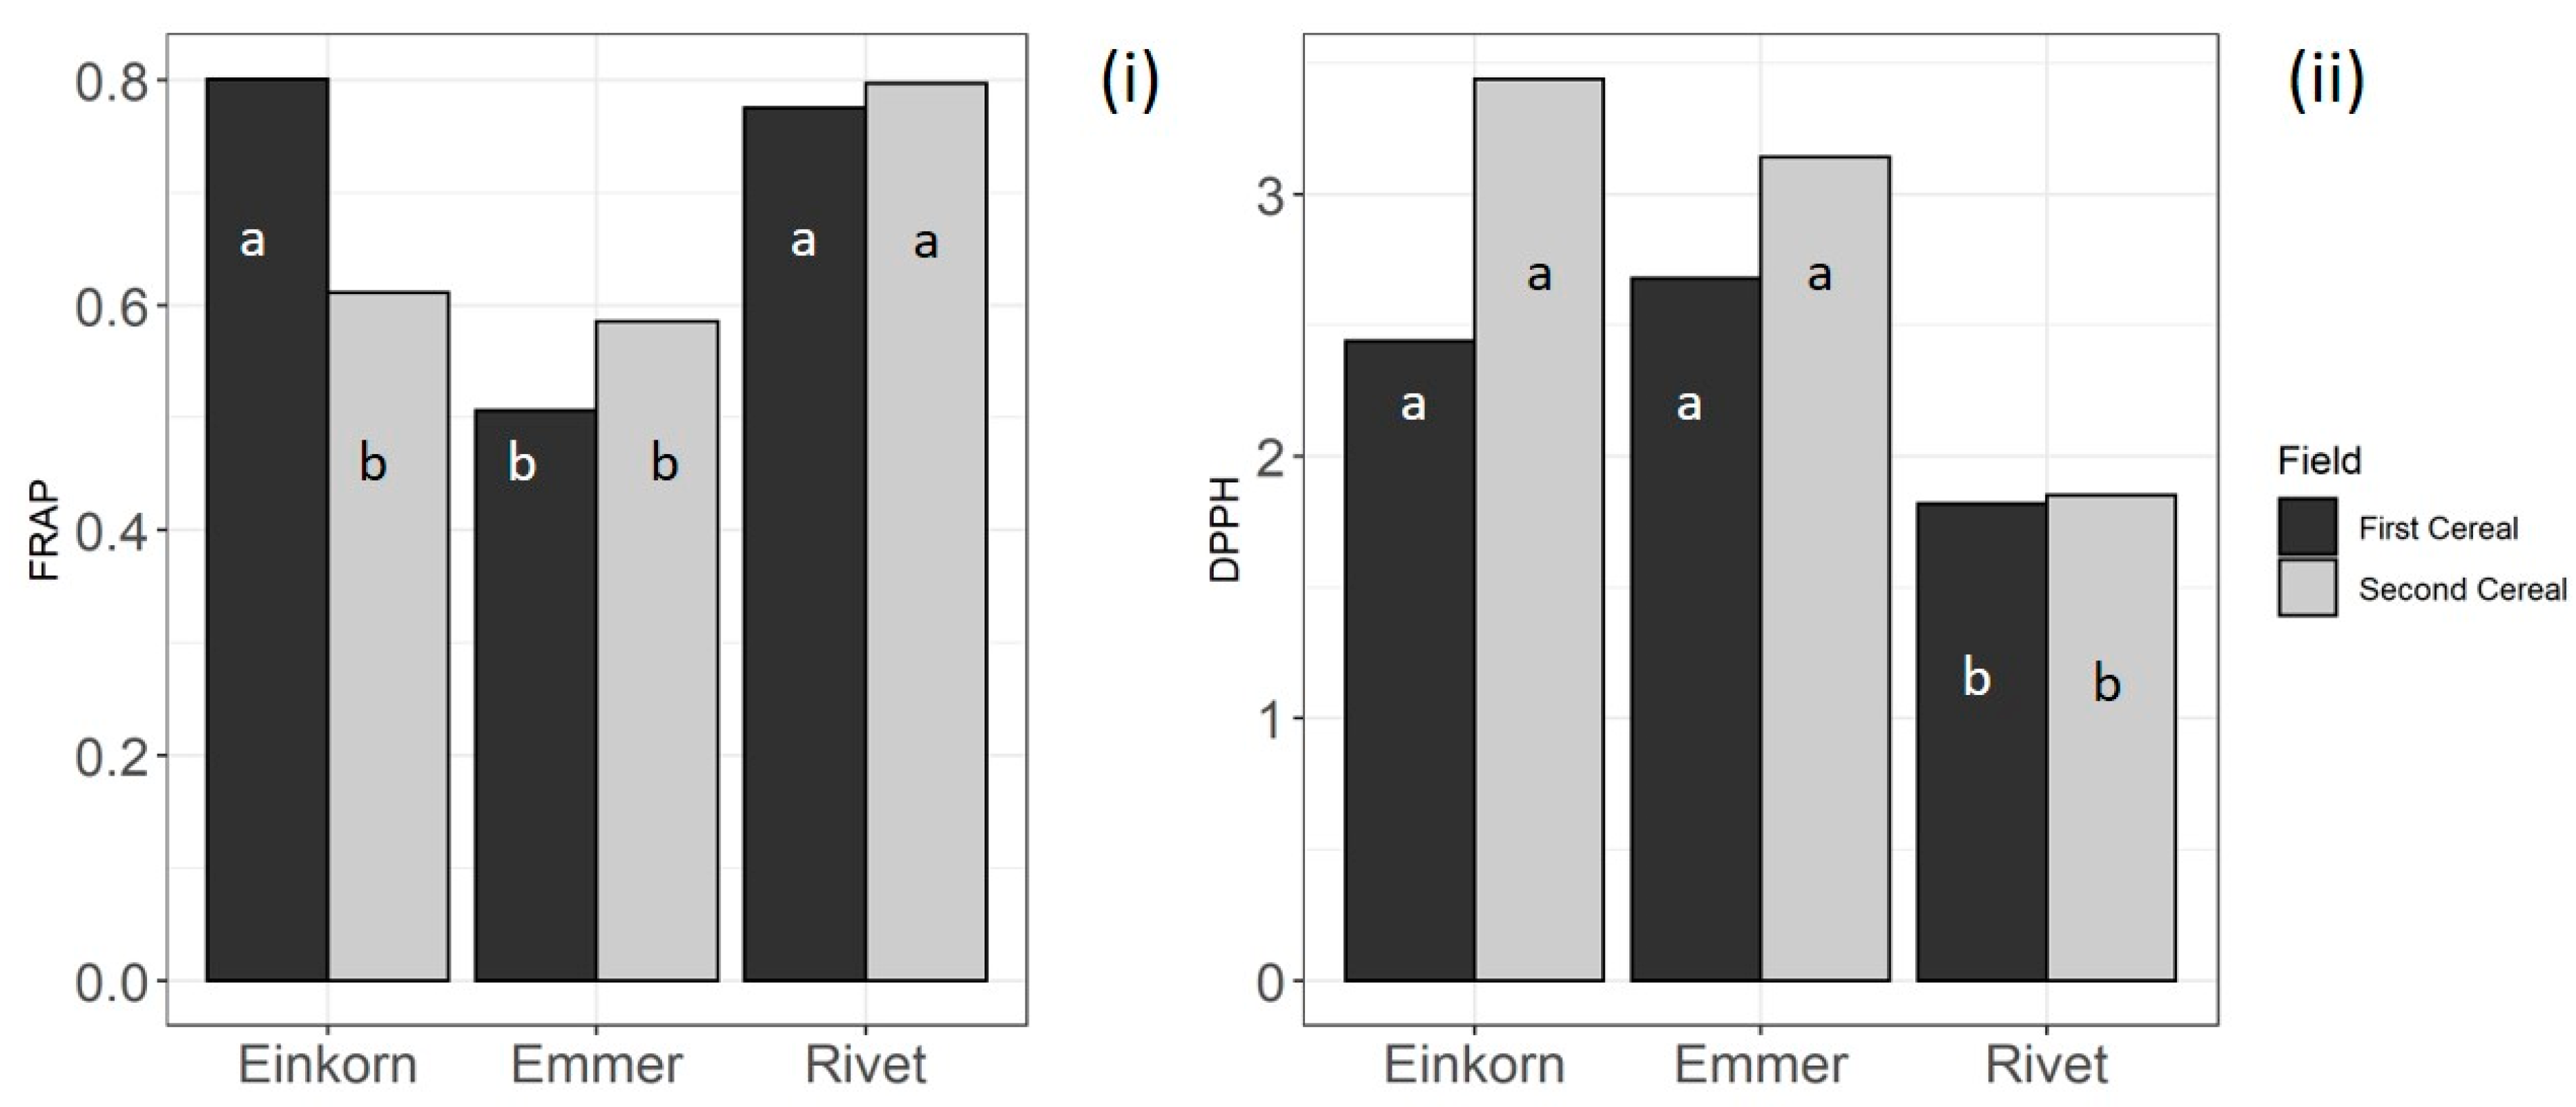
The antioxidant activity of the investigated wheat varieties was comparatively evaluated using two different in vitro tests (DPPH and FRAP assays). The DPPH assay allowed the assessment of antiradical potential through the proton exchange, while the FRAP assay measuring the reduction of ferrous ions Fe(III) to ferric ions Fe(II) operated by antioxidant compounds through the electron exchange [23,24]. FRAP was affected by field-by-species interaction in both rotation positions (X2 = 52.876 (2 df), p = 3.297 × 10⁻¹², for the first cereal position and X2 = 22.936 (2 df), p = 1.05 × 10⁻⁵ for the second one). In the first cereal position, einkorn and rivet showed the highest values of FRAP activity (0.801 ± 0.021 and 0.775 ± 0.024 mmol Fe g−1, respectively), while emmer showed the lowest value (0.506 ± 0.024 mmol Fe g−1). Unlike in the first cereal position, in the second position, rivet showed the highest values of FRAP activity (0.797 ± 0.032 mmol Fe g−1), which was significantly higher than einkorn (0.611 ± 0.027 mmol Fe g−1) and emmer (0.585 ± 0.032 mmol Fe g−1) (Figure 5 (i)).
Unlike FRAP, DPPH was significantly affected by rotational position with higher values in the second cereal position (2.87 ± 0.12 μmol TE g−1) than in the first one (2.32 ± 0.12 μmol TE g−1). Species-by-field interaction was also significant. In the first cereal position, species was the only significant effect (X2 = 21.317 (2 df), p = 2.349 × 10⁻⁵), with einkorn and rivet showing similar values (2.44 ± 0.11 μmol TE g−1 and 2.68 ± 0.13 μmol TE g−1, respectively). With 1.82 ± 0.13 μmol TE g−1, the DPPH activity in emmer was significantly lower than that in either einkorn (p = 0.0019) and rivet (p = 0.0001). In the second cereal position, again, species was the only significant effect (X2 = 37.454 (2 df), p = 7.36 × 10⁻⁹). In addition, in this case, the results followed the trend seen in the first cereal field, with einkorn (3.44 ± 0.14 μmol TE g−1) and rivet (3.14 ± 0.17 μmol TE g−1) showing the highest activity, and emmer showing the lowest values (1.85 ± 0.17 μmol TE g−1) (Figure 5 (ii)).

3.4. Within-Species Patterns

3.4.1. Einkorn

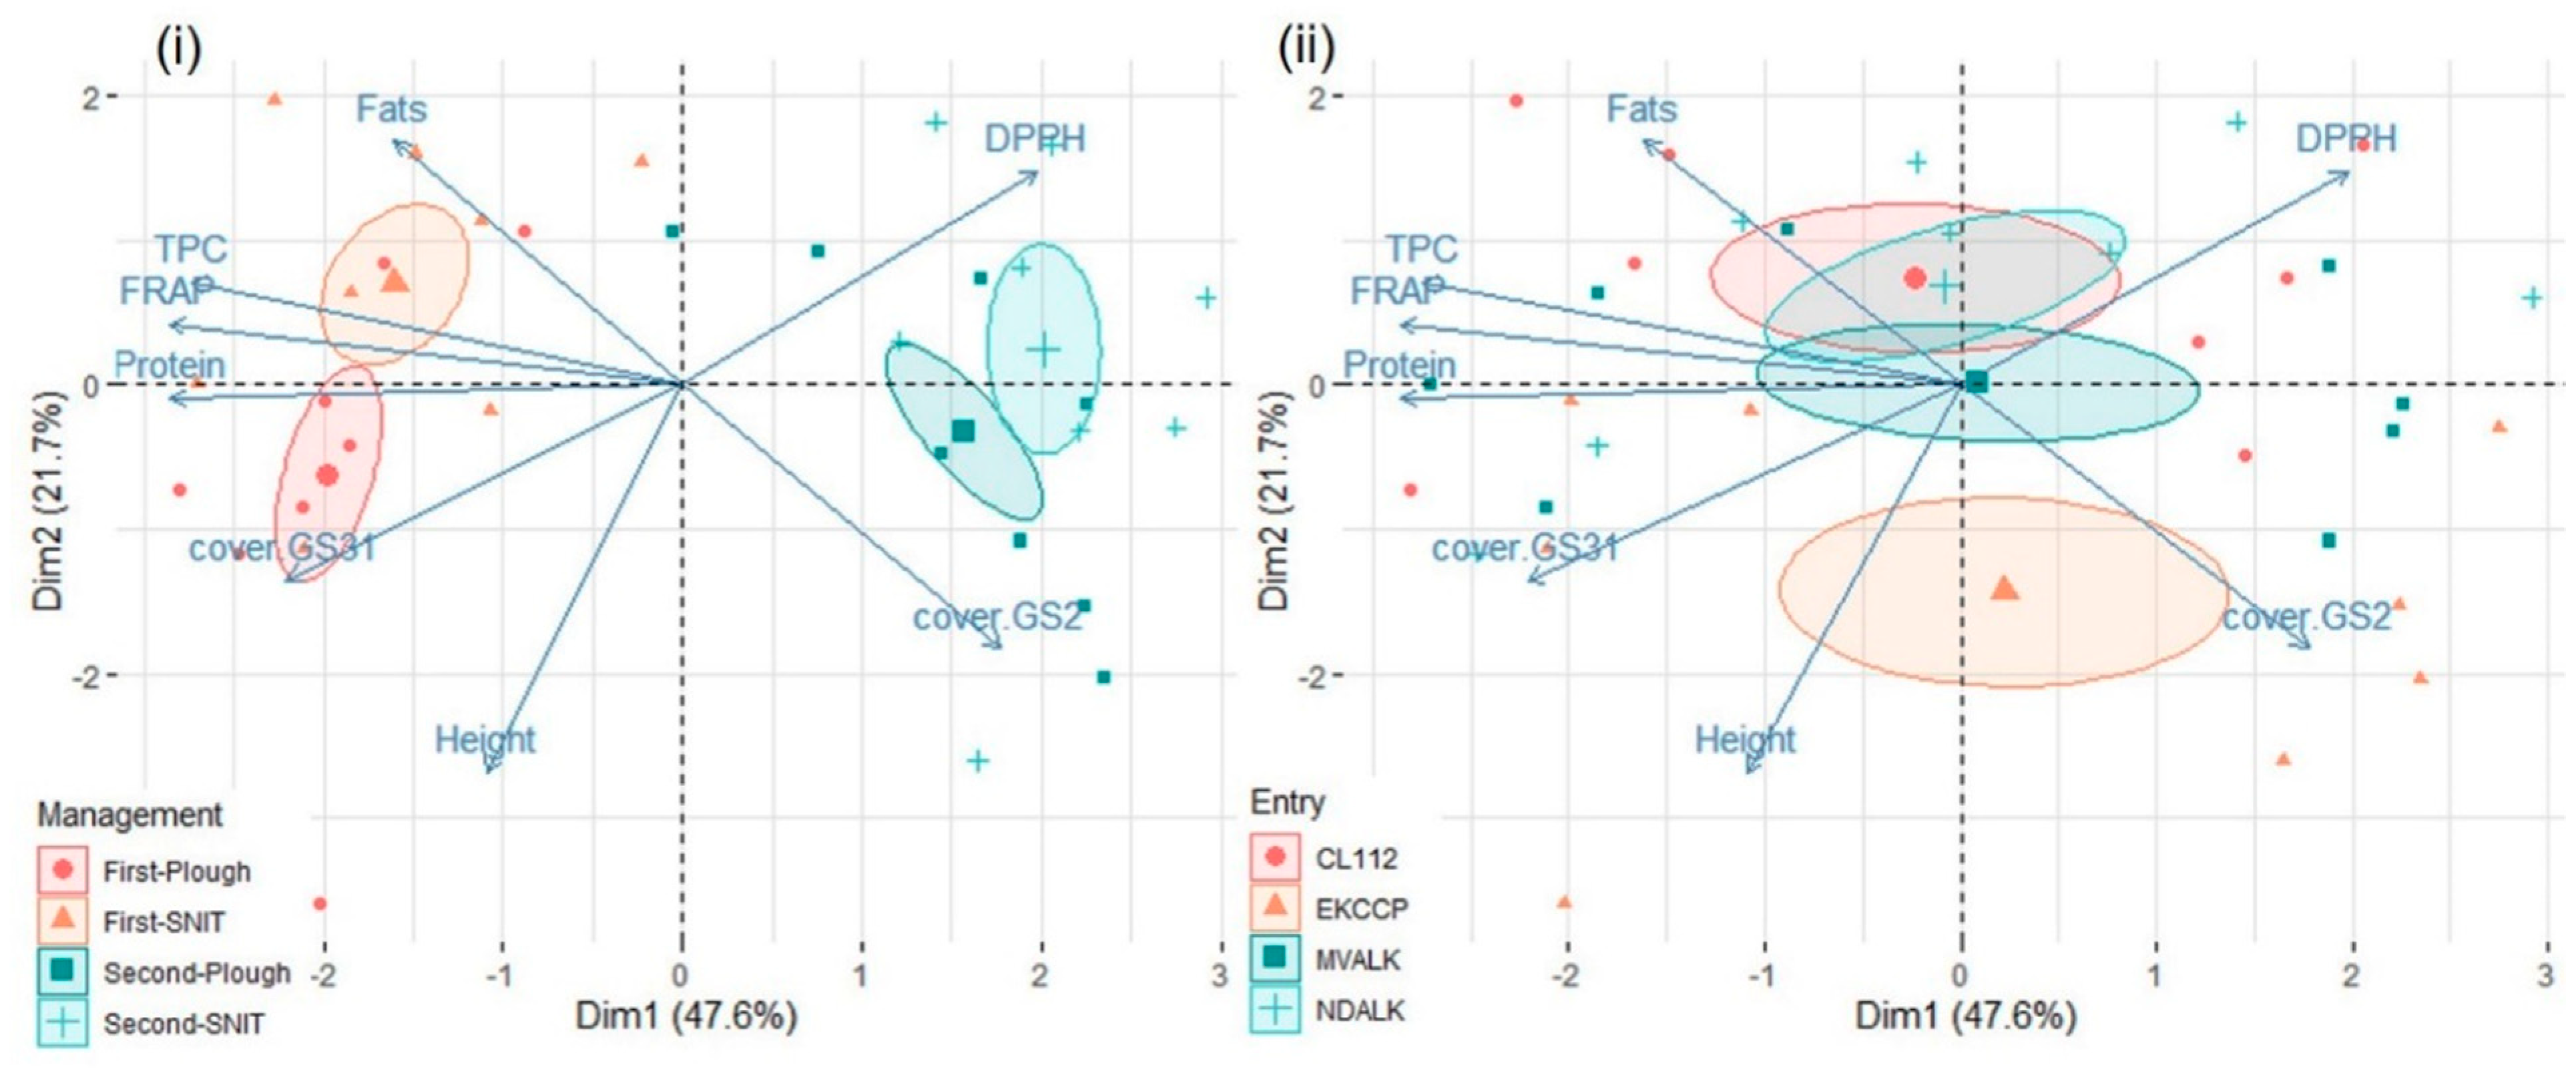
With four entries, comprising a commercial variety, a CCP, a line selected from a CCP, and a landrace (Table 1), einkorn response to rotational position and tillage was aligned to the general patters described above. In fact, there was a significant reduction of cover during BBCH GS22 and BBCH GS31, ear density, and foliar diseases severity in the second cereal position compared to the first one. Cover at BBCH GS31 was also reduced by the SNIT compared to the ploughed system. A similar, slightly significant pattern was also found for ear density (p = 0.0733) and height at maturity (p = 0.0901). Besides the field and tillage effects, cover during BBCH GS22 and height at maturity were also strongly differentiated by entry, with the Einkorn CCP showing the highest values in both cases, but not the other variables. No significant pattern of field-by-entry or tillage-by-entry interaction was found. Protein content, fat content, and FRAP were significantly reduced in the second compared to the first cereal position, whereas DPPH showed a significant, opposite pattern. FRAP was also affected by a strong tillage-by-entry interaction. The total flavonoid content was higher in the SNIT than in the ploughed system.
The observed data suggests that, for all the accessions of einkorn, the second cereal position caused a detrimental effect on vegetative growth (cover at BBCH GS31). Nutritional parameters (protein and fat content), total polyphenol content, and FRAP activity also appeared to be stimulated by better growing conditions. Vice versa, a higher value of DPPH activity in the second cereal position could be linked to other environmental factors related to soil fertility [40] (Figure 6).

3.4.2. Emmer

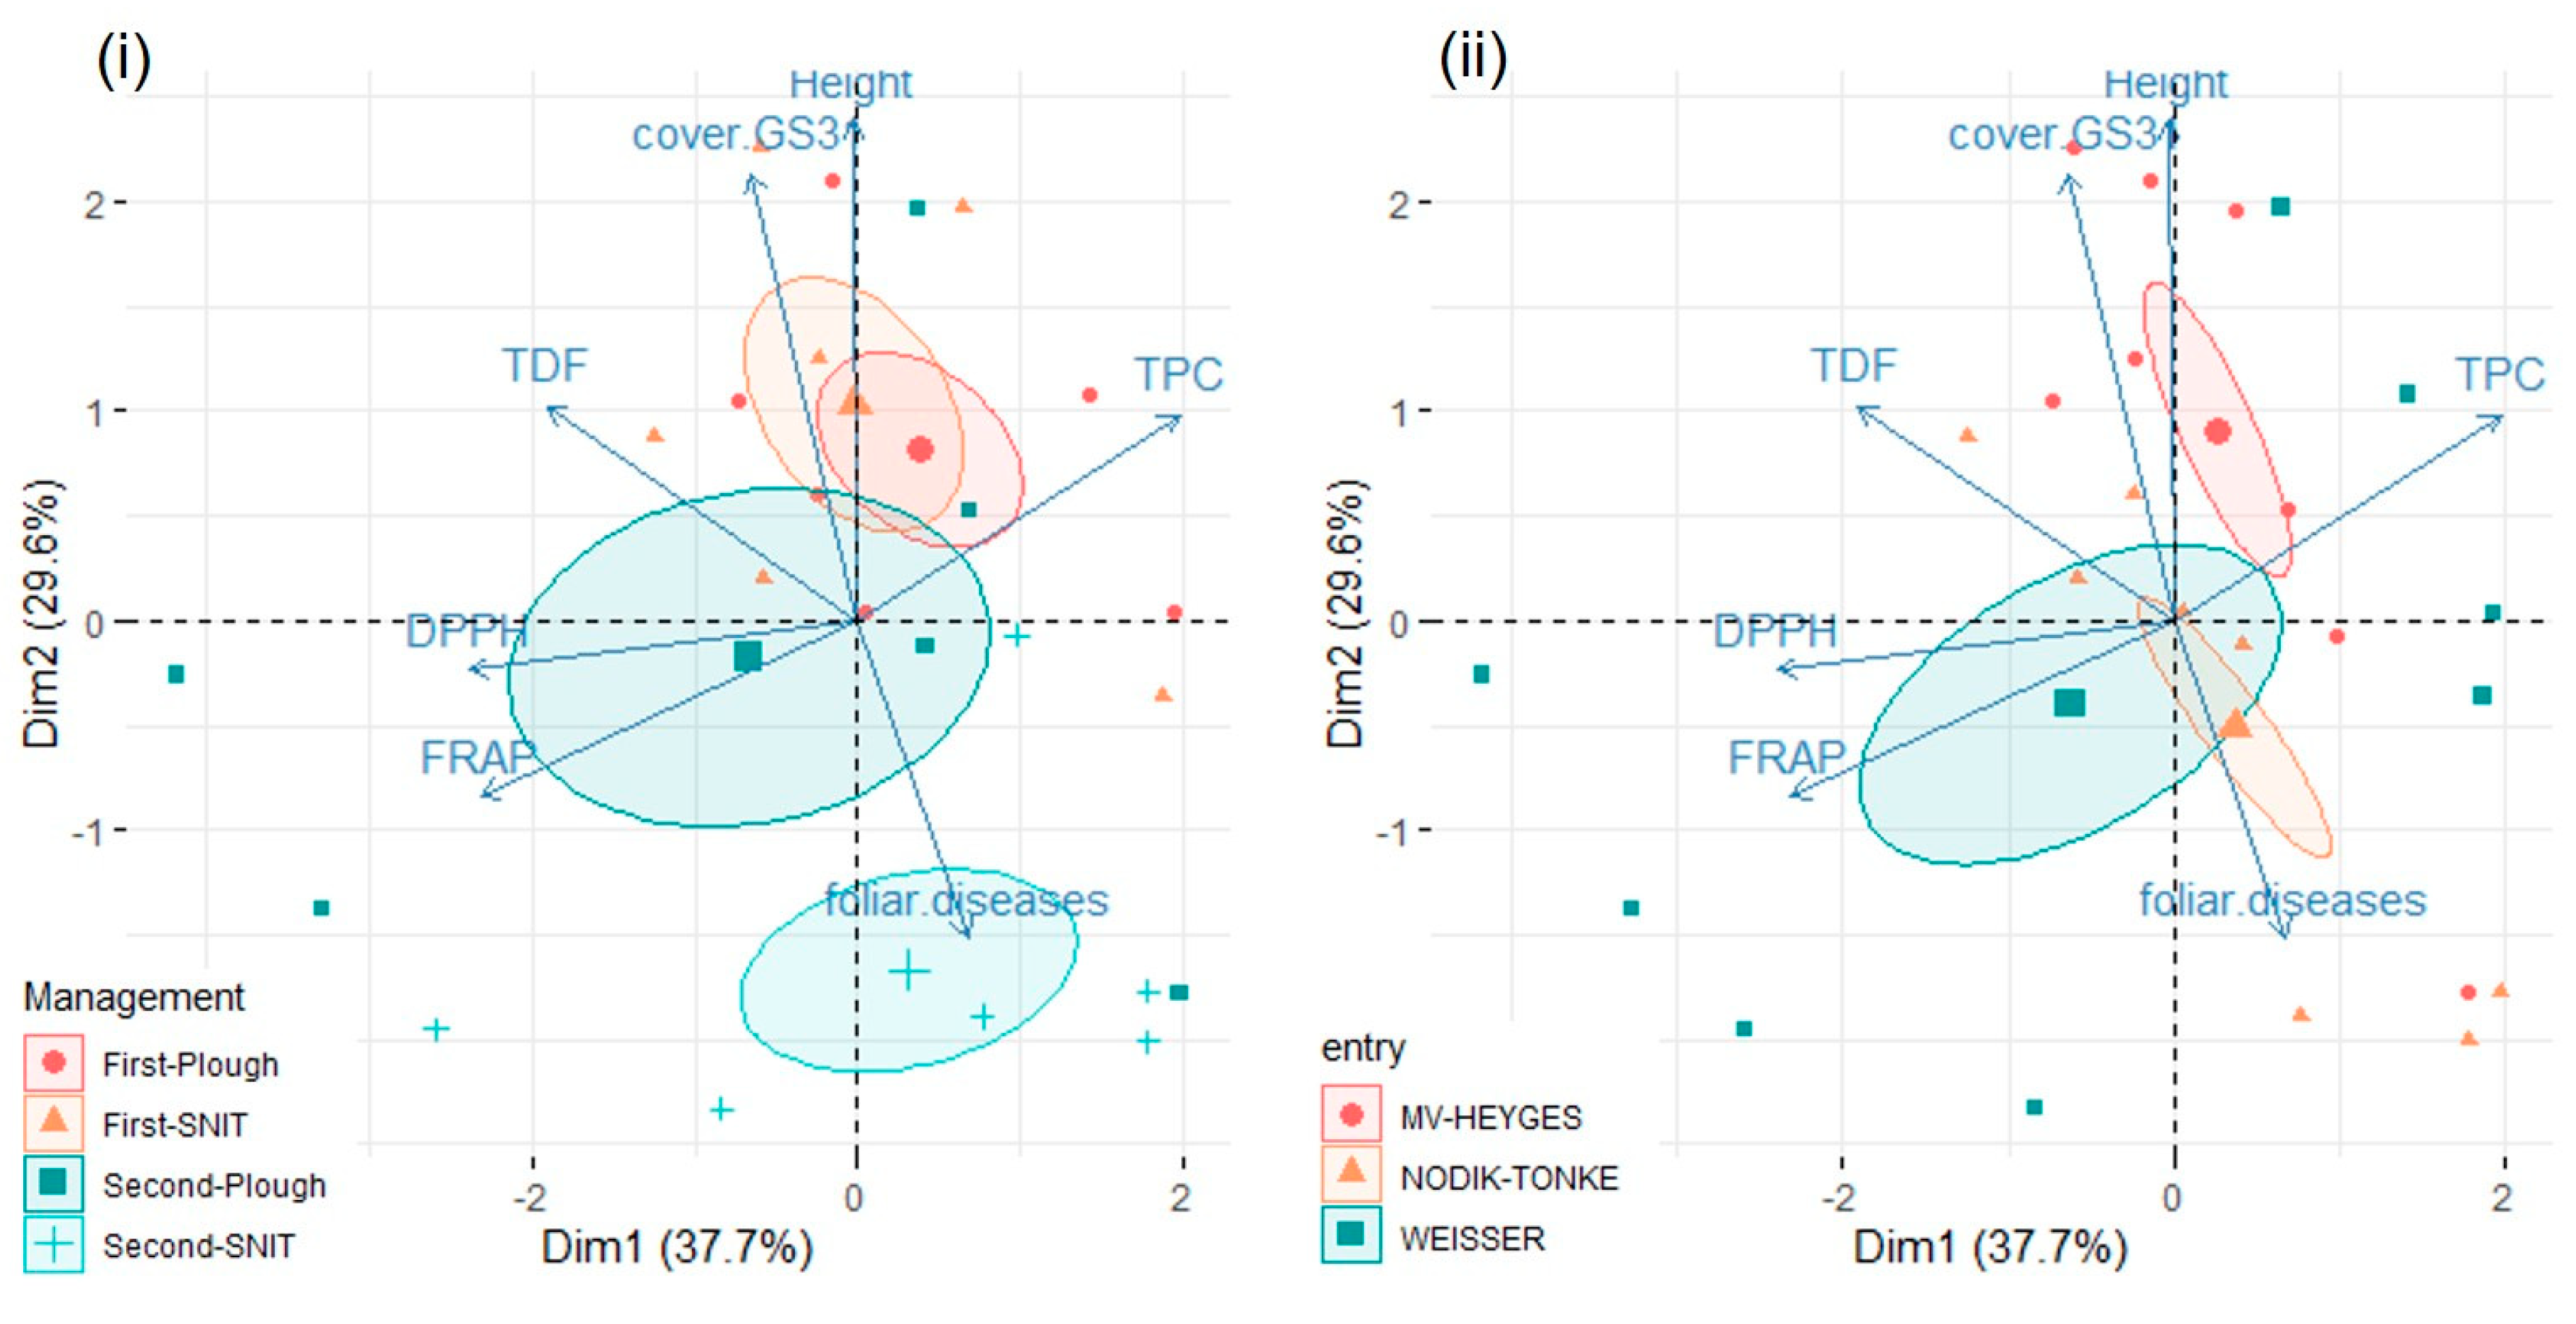
In emmer, the effect of rotational position was especially found with a decrease in height, and increase in foliar diseases, in the second cereal position compared to the first one. A decrease in height in the SNIT compared to the ploughed system was also found. Entry effect was significant for cover at BBCH GS31 and crop height, with Mv Heyges showing the highest value in both cases. Cover at BBCH GS22 was affected by a significant entry-by-tillage interaction: in both tillage systems, Mv Heyges showed the highest values, although this was only significant in the SNIT. No significant patterns were found for grain yield. Unlike einkorn, emmer did not show a specific metabolic response to either rotational position or tillage system, which may probably be linked to a low differentiation in the agronomical performances (Figure 7).

3.4.3. Rivet

In rivet, the rotational position only caused a slightly significant (p = 0.068) reduction of cover at BBCH GS31 in the second cereal position compared to the first one, whereas tillage caused a reduction in cover at BBCH GS22 in the SNIT compared to the ploughed system. Entry effect was significant for cover at BBCH GS31 and ear density, with Gigante Lampiño de Najera showing lower values than the British entries, and for foliar disease severity, with Gigant Lampiño de Najera showing higher values than the British entries. Crop height was affected by tillage-by-entry interaction. Whilst in the ploughed system no significant differences were found, in the SNIT system, the Percival’s Blue Cone was significantly taller than the Gigante Lampiño de Najera (p = 0.0393).
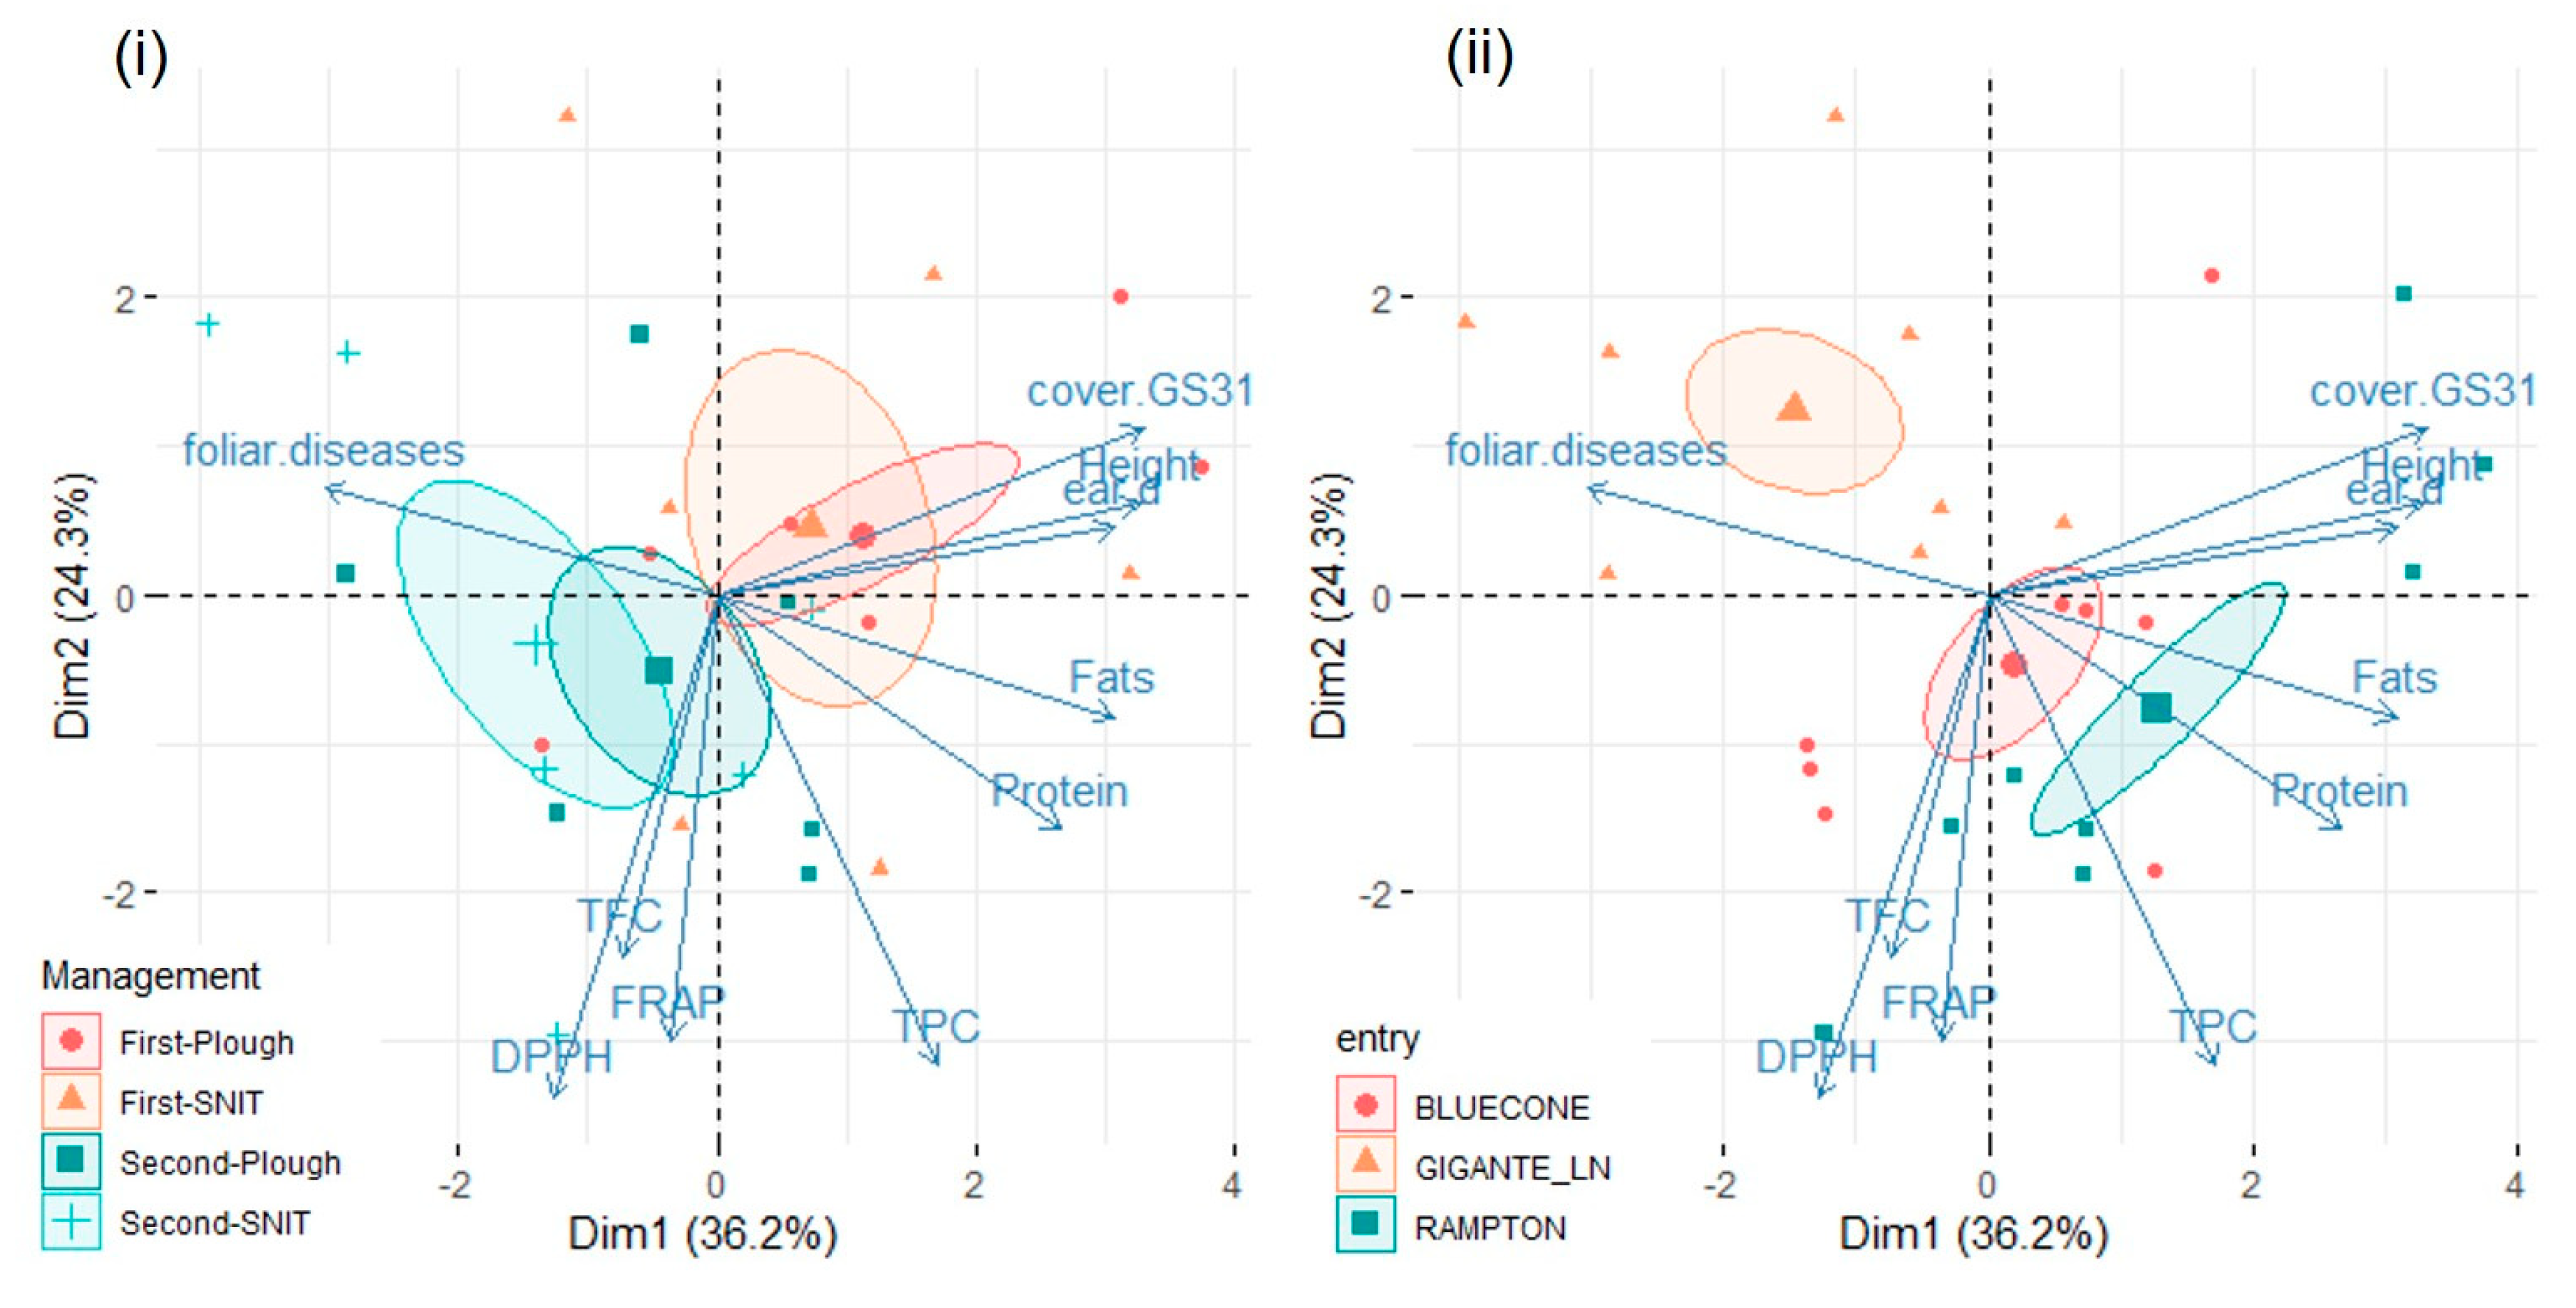
In rivet, a positive correlation between total polyphenol content and protein content (r = 0.442; p < 0.05) was observed. Overall, the total flavonoid content in rivet was positively linked with FRAP and DPPH activities. As represented in Figure 8, whilst management environments were mostly overlapping and did not explain any particular trend, there was a clearer distinction among entries. The main evidence visible through the PCA analysis was the lower adaptability of Gigante Lampino de Najera to the British environment, highlighting the need for these underutilized species to be properly evaluated in terms of agronomic performances of different genotypes, especially considering resistance to pathogens and adaptation to specific climatic environments.

4. Conclusions

Our results contribute to understanding the impact of the local pedoclimatic conditions on agronomic performances and the main nutritional traits of three underutilized cereal species. The factorial experiment of 2017/18 suggests that einkorn, emmer, and rivet wheat can be well suited to exploit lower-fertility positions in rotations and lower tillage intensity, such as shallow-non-inversion tillage, which can be critical in ensuring more sustainable carbon cycling.
As far as nutritional quality is concerned, many of the observed variables were affected by interactions between species and management. For instance, Shewry et al. [5] showed significant correlations between the contents of bioactive components and environmental factors, such as precipitation and temperature. Although the literature is relatively deficient in this field, the current study confirms that also rotational position and tillage can affect the total polyphenol and flavonoid content differently, depending on the species (or entry) examined. These aspects and the results of this study are even more relevant for the organic sector, as well as low-input agricultural systems or for agriculture in marginal areas. The 2017/18 results suggest that the main drawbacks—extreme straw length and lodging susceptibility—of these wheat species can potentially be counteracted, without severe yield and quality losses, by positioning such crop in lower-fertility rotational sequences and, especially, shallow-non-inversion tillage, therefore enabling a win–win strategy between crop production and soil conservation.
This work can be a starting point for future scientific projects on the breeding and cultivation of these species. Whilst acknowledging that plot-scale experimentation might yield results of limited transferability to real-farm conditions, especially in organic and low-input systems [41], we would encourage the use of plot-scale, factorial trials to further characterize the response of einkorn, emmer, and rivet wheat genotypes to different low-input management systems, and to evaluate additional quality traits, such as micronutrients content and rheological parameters, once the better adapted genotypes are identified and can be grown at a field scale in the target environments.

Supplementary Materials

The following are available online at https://www.mdpi.com/2071-1050/11/22/6304/s1, Table S1. Mean values and standard error of the means of einkorn, emmer and rivet entries in 2016/17 and 2017/18. Cover at GS31 = crop canopy cover at the onset of stem extension; Foliar diseases = severity of foliar diseases at full anthesis (BBCH GS65); Height = canopy height after full anthesis. LSD = Tukey’s honestly significant difference based on linear model accounting for the effect of entry over the variable of interest. Table S2. Linear mixed-effect model analysis of the effect of rotational position (Field), tillage system, entry, field-by-entry and field-by-tillage interaction over agronomic parameters in 2017-18 for einkorn, emmer and rivet wheat. (Cover at GS22 = canopy cover during tillering; Cover at GS31 = canopy cover at the onset of stem extension). Chi-square (X2) and p-values are obtained through the likelihood ratio test between models with and without the effect of interest. Individual fixed effects were progressively added in the other they appear. Table S3. Linear mixed-effect model analysis of the effect of rotational position (Field), tillage system, entry, field-by-entry and field-by-tillage interaction over grain quality parameters in 2017/18 for einkorn, emmer and rivet wheat. Chi-square (X2) and p-values are obtained through the likelihood ratio test between models with and without the effect of interest. Individual fixed effects were progressively added in the other they appear. Figure S1. Quality of representation (Cos2) of tested variables in principal component analyses for Einkorn, Emmer and Rivet wheat. Variables with Cos2 ≥ 0.4 were included in the PCAs presented in the paper.

Author Contributions

Conceptualization, A.C.; Data curation, A.C. and S.B.; Formal analysis, A.C., D.C.A., R.E.S., G.A., and S.B.; Funding acquisition, A.C. and G.D.; Investigation, D.C.A., R.E.S, G.A., L.N., and S.B.; Methodology, A.C. and S.B.; Supervision, G.D.; Writing – original draft, review and editing A.C., S.B.; L.N.

Funding

This research was funded by the EU H2020 DIVERSIFOOD project (“Embedding crop diversity and networking for local high quality food systems”), grant number 733571.

Acknowledgments

Special thanks to Michael Marriage and Darren Pettit, farmer and farm manager at Doves Farm, for their support in managing the trial in 2015/16 and 2016/17; to Richard Casebow and Caroline Hadley from the Sonning Farm, Crop Research Unit at the University of Reading for their support in managing the trial in 2017/18; and to Charlotte Bickler, Alexandre Duclouet, Michel Turbet Delof and Tegan Gilmore for their help with field samplings. We are grateful to three anonymous reviewer for their contribution to the improvement of the paper.

Conflicts of Interest

The authors declare no conflict of interest about any content of this paper.

References

  1. Massawe, F.; Mayes, S.; Cheng, A. Crop Diversity: An Unexploited Treasure Trove for Food Security. Trends Plant Sci. 2016, 21, 365–368. [Google Scholar] [CrossRef] [PubMed]
  2. Friedrich, C.; Longin, H. Back to the Future—Tapping into Ancient Grains for Food Diversity. Trends Plant Sci. 2016, 21, 731–737. [Google Scholar]
  3. Serpolay, E.; Dawson, J.C.; Chable, V.; Lammerts Van Bueren, E.; Osman, A.; Pino, S.; Silveri, D.; Goldringer, I. Diversity of different farmer and modern wheat varieties cultivated in contrasting organic farming conditions in western Europe and implications for European seed and variety legislation. Org. Agric. 2017, 1, 127–145. [Google Scholar] [CrossRef]
  4. Padulosi, S.; Hoeschle-Zeledon, I. Underutilized plant species: What are they? Leisa Leusden 2004, 20, 5–6. [Google Scholar]
  5. Shewry, P.R. Do ancient types of wheat have health benefits compared with modern bread wheat? J. Cereal Sci. 2018, 79, 469–476. [Google Scholar] [CrossRef] [PubMed]
  6. Molberg, Ø.; Uhlen, A.K.; Jensen, T.; Flæte, N.S.; Fleckenstein, B.; Arentz–Hansen, H.; Raki, M.; Lundin, K.E.A.; Sollid, L.M. Mapping of gluten T-cell epitopes in the bread wheat ancestors: Implications for celiac disease. Gastroenterology 2005, 128, 393–401. [Google Scholar] [CrossRef] [Green Version]
  7. Dinu, M.; Whittaker, A.; Pagliaia, G.; Benedettelli, S.; Sofi, F. Ancient wheat species and human health: Biochemical and clinical implications. J. Nutr. Biochem. 2018, 52, 1–9. [Google Scholar] [CrossRef]
  8. Sacchi, G.; Cei, L.; Stefani, G.; Lombardi, G.V.; Rocchi, B.; Belletti, G.; Padel, S.; Sellars, A.; Gagliardi, E.; Nocella, G.; et al. A Multi-Actor Literature Review on Alternative and Sustainable Food Systems for the Promotion of Cereal Biodiversity. Agriculture 2018, 8, 173. [Google Scholar] [CrossRef]
  9. Wolfe, M.S.; Baresel, J.; Desclaux, D.; Goldringer, I.; Hoad, S.; Kovacs, G.; Löschenberger, F.; Miedaner, T.; Østergård, H.; Lammerts van Bueren, E. Developments in breeding cereals for organic agriculture. Euphytica 2008, 163, 323–346. [Google Scholar] [CrossRef] [Green Version]
  10. Milach, S.C.K.; Federizzi, L.C. Dwarfing genes in plant improvement. Adv. Agron. 2001, 73, 35–63. [Google Scholar]
  11. Guarda, G.; Padovan, S.; Delogu, G. Grain yield, nitrogen-use efficiency and baking quality of old and modern Italian bread-wheat cultivars grown at different nitrogen levels. Eur. J. Agron. 2004, 21, 181–192. [Google Scholar] [CrossRef]
  12. Stagnari, F.; Onofri, A.; Codianni, P.; Pisante, M. Durum wheat varieties in N-deficient environments and organic farming: A comparison of yield, quality and stability performances. Plant Breed. 2013, 132, 266–275. [Google Scholar] [CrossRef]
  13. Cooper, J.; Baranski, M.; Stewart, G.; Nobel-de Lange, M.; Bàrberi, P.; Fließbach, A.; Peigné, J.; Berner, A.; Brock, C.; Casagrande, M.; et al. Shallow non-inversion tillage in organic farming maintains crop yields and increases soil C stocks: A meta-analysis. Agron. Sustain. Dev. 2016, 36, 1–20. [Google Scholar] [CrossRef]
  14. Zaharieva, M.; Monneveux, P. Cultivated einkorn wheat (Triticum monococcum L. subsp. monococcum): The long life of a founder crop of agriculture. Genet. Resour. Crop Evol. 2014, 61, 677–706. [Google Scholar]
  15. Zaharieva, M.; Ayana, N.G.; Hakimi, A.A.; Misra, S.C.; Monneveux, P. Cultivated emmer wheat (Triticum dicoccon Schrank), an old crop with promising future: A review. Genet. Resour. Crop Evol. 2007, 57, 937–962. [Google Scholar] [CrossRef]
  16. Zeven, A.C. Classification of landraces and improved cultivars of rivet wheat (Triticum turgidum) and bread wheat (T. aestivum) from Great Britain and described in 1934. Euphytica 1990, 47, 249–258. [Google Scholar]
  17. Sellars, A.; Trump, A.; Growing organic Spelt and ensuring a market. Cerere Practice Abstract #7. November 2018. Available online: www.cerere2020.eu (accessed on 15 October 2019).
  18. Park, E.Y.; Baik, B.; Machado, S.; Gollany, H.T.; Fuers, E.P. Functional and Nutritional Characteristics of Soft Wheat Grown in No-Till and Conventional Cropping Systems. Cereal Chem. 2015, 92, 332–338. [Google Scholar] [CrossRef] [Green Version]
  19. SOLIBAM Project. Progress Report from all WP3 partners on 3.1, 3.2 and 3.3 from trial work completed up to M39, Including Initial Results and Review of Progress of Tasks. Deliverable 3.3. EU FP7 SOLIBAM (Strategies for Organic and Low-Input Integrated Breeding and Management) Project, FP7- KBBE-245058. 2014. Available online: www.solibam.eu (accessed on 15 October 2019).
  20. Meier, U. Growth Stages of Mono- and Dicotyledonous Plants. BBCH Monograph; Julius Kühn-Institut: Quedlinburg, Germany, 2001. [Google Scholar] [CrossRef]
  21. AOAC. Approved Methods of Association of Official Analytical Chemists, 5th ed.; AOAC: Arlington, VA, USA, 1990. [Google Scholar]
  22. Prosky, L.; Asp, N.G.; Scheweizer, T.F.; de Vries, J.W.; Furda, I. Determination of insoluble, soluble, and total dietary fiber in foods and food products: Interlaboratory study. J. Assoc. Off. Anal. Chem. 1988, 71, 1017–1023. [Google Scholar]
  23. Dinelli, G.; Segura-Carretero, A.; Di Silvestro, R.; Marotti, I.; Fu, S.; Benedettelli, S.; Ghiselli, L.; Fernandez-Gutierrez, A. Profiles of phenolic compounds in modern and old common wheat varieties determined by liquid chromatography coupled with time-of-flight mass spectrometry. J. Chromatogr. A 2011, 1218, 7670–7681. [Google Scholar] [CrossRef]
  24. Singleton, V.L.; Orthofer, R.; Lamuela–Raventos, R.M. Analysis of total phenols and other oxidation substrates and antioxidants by means of Folin–Ciocalteu reagent. Methods Enzym. 1999, 299, 152–178. [Google Scholar]
  25. Brand-Williams, W.; Cuvelier, H.E.; Berset, C. Use of a free radical method to evaluate antioxidant activity. Food Sci. Technol. 1995, 28, 25–30. [Google Scholar] [CrossRef]
  26. Benzie, I.F.F.; Strain, J.J. Ferric Reducing Ability of Plasma (FRAP) as a Measure of “Antioxidant Power”: The FRAP Assay. Anal. Biochem. 1996, 239, 70–76. [Google Scholar] [CrossRef] [PubMed]
  27. R Core Team. A Language and Environment for Statistical Computing; R Foundation for Statistical Computing: Vienna, Austria, 2017; Available online: https://www.R-project.org/ (accessed on 15 October 2019).
  28. De Mendiburu, F.; Package ‘Agricolae’. CRAN R Project. 2019. Available online: https://cran.r-project.org/web/packages/agricolae/agricolae.pdf (accessed on 15 October 2019).
  29. Bates, D.M.; Maechler, M.; Bolker, B.; Walker, S.C. Fitting Linear Mixed-Effects Models Using lme4. J. Stat. Softw. 2015, 67. [Google Scholar] [CrossRef]
  30. Length, R.; Singmann, H.; Love, J.; Buerkner, P.; Herv, M.; Package ‘emmeans’. CRAN R Project. 2019. Available online: https://cran.r-project.org/web/packages/emmeans/emmeans.pdf (accessed on 15 October 2019).
  31. Kassambara, A.; Mundt, F. factoextra: Extract and Visualize the Results of Multivariate Data Analyses. 2017. Available online: https://cran.r-project.org/web/packages/factoextra/index.html (accessed on 15 October 2019).
  32. Agenbag, G.A. Growth, yield and grain protein content of wheat (Triticum aestivum L.) in response to nitrogen fertiliser rates, crop rotation and soil tillage. S. Afr. J. Plant Soil 2012, 29. [Google Scholar] [CrossRef]
  33. Bilalis, D.; Karkanis, A.; Patsial, S.; Agriogianni, M.; Konstantas, A.; Triantafyllidis, V. Performance of Wheat Varieties (Triticum aestivum L.) under Conservation Tillage Practices in Organic Agriculture. Not. Bot. Horti Agrobot. 2011, 39, 28–33. [Google Scholar] [CrossRef]
  34. Woźniak, A. Effect of Crop Rotation and Cereal Monoculture on the Yield and Quality of Winter Wheat Grain and on Crop Infestation with Weeds and Soil Properties. Int. J. Plant Prod. 2019, 13, 177–182. [Google Scholar] [CrossRef] [Green Version]
  35. Dinelli, G.; Di Silvestro, R.; Marotti, I.; Bosi, S.; Bregola, V.; Di Loreto, A.; Nipoti, P.; Prodi, A.; Catizone, P. Agronomic traits and deoxynivalenol contamination of two tetraploid wheat species (Triticum turgidum spp. durum, Triticum turgidum spp. turanicum) grown strictly under low input conditions. Ital. J. Agron. 2014, 9, 127–135. [Google Scholar] [CrossRef]
  36. Angus, J.F.; Kirkegaard, J.A.; Hunt, J.R.; Ryan, M.H.; Ohlander, L.; Peoples, M.B. Break crop and rotation for wheats. Crop Pasture Sci. 2015, 66, 523–552. [Google Scholar] [CrossRef]
  37. Huang, L.; Feng, L.; He, Y.; Tang, Z.; He, J.; Sela, H.; Krugman, T.; Fahima, I.; Liu, D.; Wu, B. Variation in Stripe Rust Resistance and Morphological Traits in Wild Emmer Wheat Populations. Agronomy 2019, 9, 44. [Google Scholar] [CrossRef]
  38. Hidalgo, A.; Brandolini, A.; Pompei, C. Kinetics of tocols degradation during the storage of einkorn (Triticum monococcum L. ssp. monococcum) and breadwheat (Triticum aestivum L. ssp. aestivum) flours. Food Chem. 2009, 116, 821–827. [Google Scholar]
  39. Dhanavath, S.; Rao, U.J.S.P. Nutritional and Nutraceutical Properties of Triticum dicoccum Wheat and Its Health Benefits: An Overview. J. Food Sci. 2017, 82, 2243–2250. [Google Scholar] [CrossRef] [PubMed]
  40. Di Silvestro, R.; Din Loreto, A.; Bosi, S.; Bregola, V.; Marotti, I.; Benedettelli, S.; Segura-Carretero, A.; Dinelli, G. Environment and genotype effects on antioxidant properties of organically grown wheat varieties: A 3-year study. J. Sci Food Agric. 2016. [Google Scholar] [CrossRef] [PubMed]
  41. Kravchenko, A.N.; Snapp, S.S.; Robertson, G.P. Field-scale experiments reveal persistent yield gaps in low-input and organic cropping systems. Proc. Natl. Acad. Sci. USA 2017, 114, 921. [Google Scholar] [CrossRef] [PubMed]
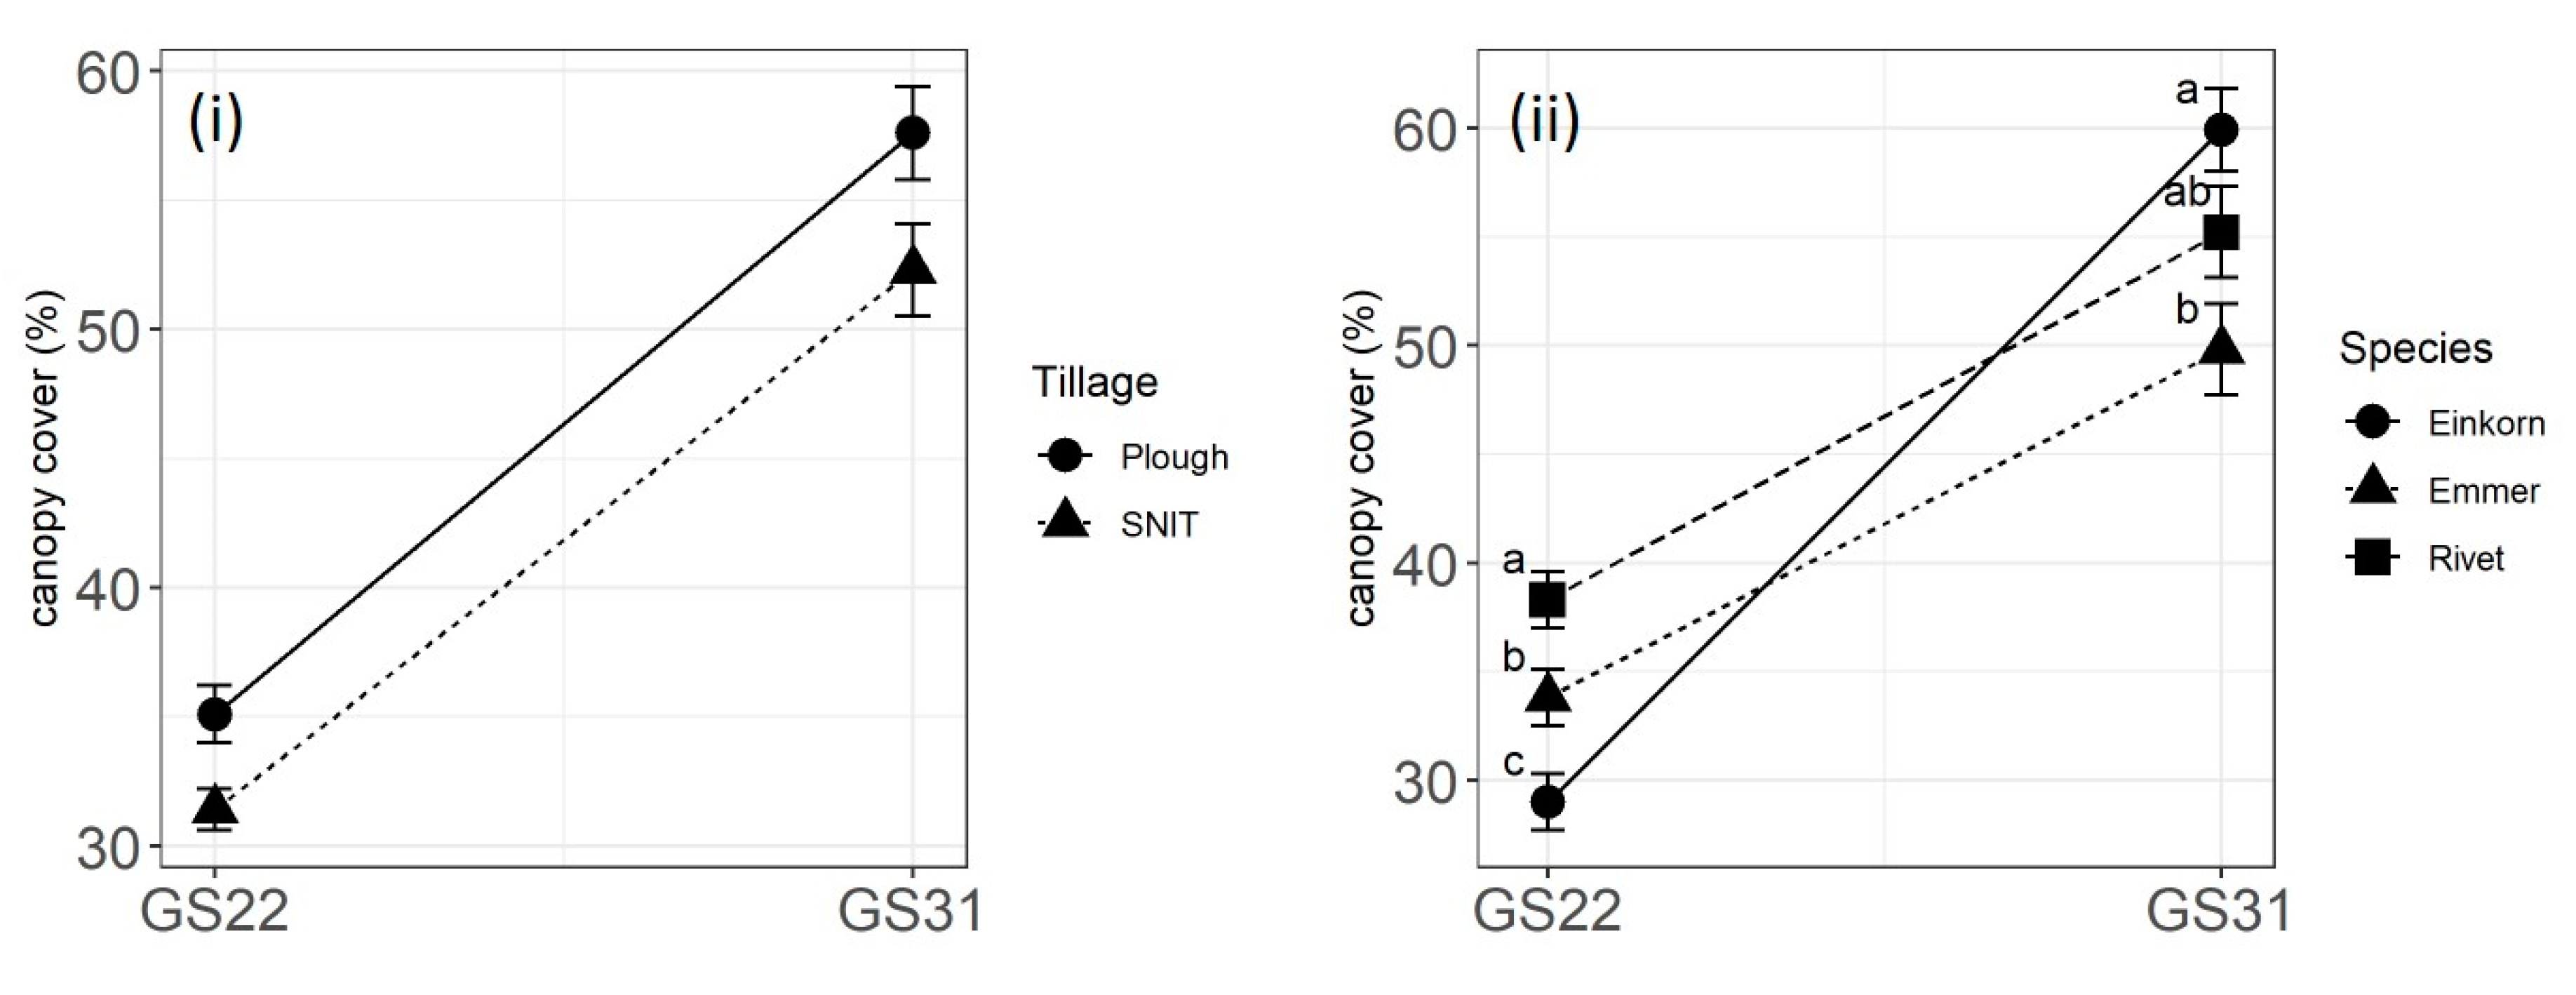
Figure 1. Crop canopy cover at BBCH GS22 and at BBCH GS31 as affected (i) by tillage and (ii) by species. Points are estimated marginal means ± standard errors. Within each growth stage, values with the same letter are not significantly different.
Sustainability 11 06304 g001
Figure 2. Canopy height at maturity as affected by rotational position (field) and species. Bars are estimated marginal means. Within each ‘field’, bars with the same letter are not significantly different.
Sustainability 11 06304 g002
Figure 3. Grain protein content (i) and fat content (ii) as affected by rotational position (field) and species. Bars with the same letter, within each field, represent not different estimated marginal means.
Sustainability 11 06304 g003
Figure 4. (i) Total polyphenol content (mg 100 g−1) as affected by species and rotational position, and (ii) total flavonoid content (mg 100 g−1) as affected by species, tillage and rotational position. Bars are estimated marginal means. Within each ‘field’ in (i) and ‘tillage’ in (ii), bars with the same letter are not significantly different.
Sustainability 11 06304 g004
Figure 5. FRAP (mmol Fe g−1) (i) and DPPH (μmol TE g−1) (ii) as affected by rotational position (field) and species. Bars with the same letter, within each field, represent not different estimated marginal means.
Sustainability 11 06304 g005
Figure 6. Einkorn: principal component analysis of the variables with quality of representation (Cos2) ≥0.4, with observations grouped by management (i) and by entry (ii). Ellipses represent confidence ellipses around group mean points. Management: First-Plough = first cereal position, ploughed; First-SNIT = First cereal position, shallow non-inversion tillage; Second-Plough = second cereal position, ploughed; Second-SNIT = second cereal position, shallow non-inversion tillage. Entry: CL 112 = Col 112; EK CCP = Einkorn CCP; MVALK = Mv Alkor; NDALK = Nodik Alakor. Variables: ‘cover.GS2’ = crop canopy cover during tillering; ‘ear.d’ = ear density’.
Sustainability 11 06304 g006
Figure 7. Emmer: principal component analysis of the variables with quality of representation (Cos2) ≥0.4, with observations grouped by management (i) and by entry (ii). Confidence ellipses around group mean points are shown. Management: First-Plough = first cereal position, ploughed; First-SNIT = First cereal position, shallow non-inversion tillage; Second-Plough = second cereal position, ploughed; Second-SNIT = second cereal position, shallow non-inversion tillage.
Sustainability 11 06304 g007
Figure 8. Rivet wheat: principal component analysis of the variables with quality of representation (Cos2) ≥0.4, with observations grouped by management (i) and by entry (ii). Confidence ellipses around group mean points are shown. Management: First-Plough = first cereal position, ploughed; First-SNIT = First cereal position, shallow non-inversion tillage; Second-Plough = second cereal position, ploughed; Second-SNIT = second cereal position, shallow non-inversion tillage. Entries: BLUECONE = Percival’s Blue Cone; GIGANTE_LN = Gigante Lampiño de Najera; RAMPTON = Rampton’s Rivet.
Sustainability 11 06304 g008
Table 1. Einkorn, emmer, and rivet wheat entries tested
Entry NameOrigin of the Seed Used in the TrialsFurther Information
Einkorn (Triticum monococcum ssp. monococcum)
Col 122Saved seed from Wakelyns Agroforestry farm, United KingdomLine selected from the Einkorn CCP as part of the FP7 SOLIBAM EU project (2010–2015) [19]
Einkorn CCPSaved seed from Wakelyns Agroforestry farm, Fressingfield, Eye IP21 5SD, Suffolk, United KingdomComposite cross population originated from crossing seven lines and reproduced organically in Wakelyns Agroforestry since 2011/2012 as part of the FP7 SOILBAM EU Project (2010–2015) [19]
Mv AlkorHungarian Academy of ScienceCommercial, organically bred Hungarian pure line einkorn variety for brewing
Mv MenketHungarian Academy of ScienceCommercial Hungarian short-strawed einkorn variety for brewing. Not included in 2017/18
Nödik AlakorNödik Centre for Plant Diversity (Hungary)Landrace of German origin
Emmer (Triticum turgidum ssp. dicoccum)
Mv HeygesHungarian Academy of ScienceCommercial, organically bred Hungarian pure line emmer variety
Nödik TonkeNödik Centre for Plant Diversity (Hungary)Landrace of Moroccan origin
Weisser Pro Specie Rara (Switzerland)Spring cultivar originally from France, kept at the ProSpecieRara seed bank under entry code AZ-1971—prospecierara.ch/pflanzen/sortenfinder/
Rivet wheat (Triticum turgidum ssp. turgidum)
Gigante Lampiño de NajeraInstitut Technique de l’Agriculture Biologique (ITAB), FranceTraditional cultivar from la Rioja province, Spain, kept at the INIA genebank under entry code BGE013089—webx.inia.es/web_coleccionescrf/PasaporteCRF.asp
Percival’s Blue ConeSaved seed from Wakelyns Agroforestry farm, United KingdomSingle-ear selection from a traditional English landrace, kept at the John Innes Centre Genetic Resources Unit (GRU) with a store code W1022—seedstor.ac.uk/search-infoaccession.php?idPlant=14581
Rampton’s RivetSaved seed from Wakelyns Agroforestry farm, United KingdomEnglish selection, kept at the John Innes Centre Genetic Resources Unit (GRU) with store code W0508—seedstor.ac.uk/search-infoaccession.php?idPlant=14092
Table 2. Crop canopy cover at BBCH GS31 stage, severity of foliar diseases, canopy height, ear density, and grain yield of einkorn, emmer, and rivet wheat in 2015/16 and 2016/17: mean values, standard error of the mean, F-value (numerator and denominator degrees of freedom), and p-values of linear models accounting for entry effect.
Cover at BBCH GS31Foliar Diseases SeverityHeightEar DensityGrain Yield
Einkorn%% cmears/m2t/ha
2015/16
mean47 ± 31.4 ± 0.190.9 ± 3.2349.6 ± 24.31.28 ± 0.11
entry effectF = 17.9 (4;15)F = 1.89 (4;15)F = 48.39 (4;15)F = 5.05 (4;15)F = 9.26 (4;15)
p = 1.36 × 10⁻⁵***p = 0.163p = 2.12 × 10⁻⁸***p = 0.0089**p = 0.0006***
2016/17
mean27 ± 36.0 ± 1.1114.9 ± 4.6400.4 ± 29.53.13 ± 0.17
entry effectF = 0.57 (4;10)F = 18.2 (4;10)F = 344 (4;10)F = 0.51 (4;10)F = 3.31 (4;10)
p = 0.687p = 0.0001***p = 1.17 × 10⁻¹⁰***p = 0.732p = 0.0569*
Emmer
2015/16
mean31 ± 235.4 ± 2.093.92 ± 2.33147.4 ± 12.00.59 ± 0.04
entry effectF = 5.664 (2;7)F = 0.129 (2;7)F = 1.10 (2;7)F = 0.982 (2;7)F = 1.078 (2;7)
p = 0.034*p = 0.881p = 0.384p = 0.421p = 0.391
2016/17
mean46 ± 116.5 ± 3.3129.5 ± 1.45220.4 ± 17.12.23 ± 0.24
entry effectF = 0.1 (2;6)F = 7.098 (2;6)F = 9.995 (2;6)F = 3.424 (2;6)F = 2.438 (2;6)
p = 0.906p = 0.0262*p = 0.0123*p = 0.102p = 0.168
Rivet
2015/16
mean35 ± 56.0 ± 0.894.7 ± 9.1n.a.0.67 ± 0.13
entry effectF = 19.05 (2;4)F = 0.581 (2;4)F = 24.87 (2;4)n.a.F = 2.249 (2;4)
p = 0.009**p = 0.601p = 0.0055**n.a.p = 0.222
2016/17
mean59 ± 42.6 ± 0.2137.3 ± 1.9206.7 ± 17.72.91 ± 0.30
entry effectF = 1.25 (2;6)F = 6.868 (2;6)F = 1.729 (2;6)F = 2.375 (2;6)F = 1.896 (2;6)
p = 0.352p = 0.0281*p = 0.255p = 0.174p = 0.230
Note: Significance level: , p < 0.05; ∗∗, p < 0.01; ∗∗∗, p < 0.001.
Table 3. Effects of rotational position (field), tillage, species, field-by-species, and tillage-by-species interaction on agronomic variables: result of mixed-effect model analysis comparison with maximum likelihood estimate
Variable FieldTillageSpeciesField-by-SpeciesTillage-by-Species
(df)(1)(1)(2)(2)(2)
Cover at BBCH GS22X20.52033.520323.0363.6071.401
p-value0.4710.0605(*)9.95 × 10⁻⁶***0.16480.496
Cover at BBCH GS31X27.5283.32912.3894.97814.623
p-value0.0061**0.0681(*)0.002***0.083*0.1
Height at maturityX23.99741.79541.74056.52170.2107
p-value0.0456*0.18048.63 × 10−10***0.0384*0.8999
Ear densityX22.6330.980132.74574.16921.4919
p-value0.10460.32227.75 × 10−8***0.12440.4743
Leaf severity (sqrt transf.)X23.0120.09955.7743.7973.448
p-value0.08250.75317.74 × 10−13***0.14980.1784
Grain YieldX23.83551.1286.80680.9191.9386
p-value0.0502(*)0.2880.03326*0.6320.3794
Note: Significance level: , p < 0.05; ∗∗, p < 0.01; ∗∗∗, p < 0.001.
Table 4. Effects of rotational position (field), tillage, species, field-by-species, and tillage-by-species interaction on grain quality and nutritional variables: X2 and p-values of mixed-effect models comparison with maximum likelihood estimate are indicated.
Variable FieldTillageSpeciesField-By-SpeciesTillage-By-Species
(df)(1)(1)(2)(2)(2)
Protein contentX22.46550.415559.109715.883.965
p-value0.11640.51921.46 × 10−13***0.0004***0.1377
Total dietary fiberX24.80580.09580.77250.66051.162
p-value0.0284*0.75690.67960.71880.5593
Fat content (sqrt transf.)X20.15210.094535.435426.7532.4797
p-value0.69650.75862.02 × 10−8***1.55 × 10⁻⁶***0.2894
Total polyphenolsX27.28150.192122.507823.660.6434
p-value0.007**0.66031.30 × 10−5***7.28 × 10⁻⁶***0.7249
Total flavonoidsX20.05451.456.85414.95146.7078
p-value0.8150.23594.51 × 10−13***0.0006***0.0349*
FRAPX20.65480.001229.206326.4942.4665
p-value0.41840.974.54 × 10−7***1.77 × 10⁻⁶***0.2913
DPPHX23.91320.2373.5.396412.71071.2426
p-value0.0479*0.6262.06 × 10−8***0.0017**0.5373
Note: Significance level: , p < 0.05; ∗∗, p < 0.01; ∗∗∗, p < 0.001.