Article

Exploring the Relationship between Urbanization and the Eco-Environment: A Case Study of Beijing

1
School of Geography, Nanjing Normal University, Nanjing 210023, China
2
Key Laboratory of Virtual Geographic Environment (Nanjing Normal University), Ministry of Education, Nanjing 210023, China
3
Jiangsu Center for Collaborative Innovation in Geographical Information Resource Development and Application, Nanjing 210023, China
4
School of Economic, Political, and Policy Sciences, University of Texas at Dallas, Richardson, TX 75080, USA
5
Jiangsu Province Surveying & Mapping Engineering Institute, Nanjing 210013, China
*
Author to whom correspondence should be addressed.
Sustainability 2019, 11(22), 6298; https://doi.org/10.3390/su11226298
Submission received: 7 October 2019 / Revised: 5 November 2019 / Accepted: 6 November 2019 / Published: 9 November 2019

Abstract

:
Beijing is one of the most developed cities in China and has experienced a series of environmental problems. In accordance with the Major Function Zone planning, Beijing is divided into four zones in an attempt to coordinate development between urban areas and the eco-environment. Classic coupling model uses statistical data to evaluate the interactions of these two subsystems; however, it lacks the capability to express dynamic changes to land cover. Thus, we extracted land cover data from Landsat images and examined the urbanization and eco-environment level as well as the coupling coordination in Beijing and its functional zones. The main conclusions are as follows. (1) Between 2001 and 2011, both urbanization and the eco-environment level in Beijing and its functional zones grew steadily. Different zones coordinated together according to their own characteristics, and the overall coupling coordination of the city transformed from the “basically balanced” to the “superiorly balanced” stage of development. (2) After 2011, the condition of the eco-environment worsened in Beijing and in most of the function zones, while the coordination between increased urbanization and the worsened eco-environment may be a result of environmental lag. This study integrated land cover data into the coupling mode and fully utilized the advantages of spatiotemporal analysis and the coupling model. In other words, the spatiotemporal analysis explains the land cover changes visually over the research period, while the coupling model explores the interaction mechanisms between urbanization and the eco-environment. The land cover data enriches the coupling theory and provides a reference for evaluating the effectiveness of local development policy.

1. Introduction

There is always a contradiction between urbanization and the eco-environment. Expanding cities have brought more opportunities and substantial economic growth to the human society, but also pushed their limits to affect the natural environment in many ways [1,2,3]. Such an issue has aroused widespread investigations on how urbanization interacts with the environment (including water system, land resource, atmospheric environment, etc.) [4,5,6]. At present, due to the prominent occurring of urbanization processes, developing countries are facing greater challenges than developed counties [7]. Thus, different governments are dedicated to balance the development of these two aspects, and have proposed various strategies according to their local characteristics. It is essential to examine the effectiveness of some typical strategies, which can be future references, by analyzing the relationship between urbanization and the eco-environment.
China, as the world’s largest developing country, has made considerable progress in economy [8,9,10]. At the meantime, the rapid urban expansion has imposed significant ecological pressures on the environment and has led to imbalanced regional development [11,12,13]. To address these problems, the Chinese government proposed the Major Function Zone (MFZ) planning strategy at the beginning of the new century, with the aim of coordinating urban development with the eco-environment based on local characteristics [14,15]. This planning divided the city into several zones, and each zone has a clearly development orientation. Beijing was used as the pilot city for the implementation of MFZ planning in 2005, which has transformed industry structures and environmental quality over the past decade. Therefore, when researching the developing trends and interaction mechanisms between urbanization and the eco-environment in Beijing, it is necessary to examine the effectiveness of MFZ planning. Doing so will also provide valuable information and guidance for the future developments of other cities. A better understanding of the global coupling relationship between the urbanization–environment system is therefore of profound significance.
Research on urbanization and the eco-environment originated with the garden city movement proposed by Howard [16], who idealized a future city that combined the advantages of both rural and urban spaces. After that, various thinking have been proposed focusing on this compound system, such as the Ville Radieuse [17], Broadacre City [18], etc. All this thinking can arouse a strong interest in the integration of urban and rural development and further deepen our understanding of the natural environment. Thus, research has become increasingly diversified on kinds of influences urbanization may have on the eco-environment and the interaction mechanisms between these two subsystems [19]. Various models have then been proposed to explore these relationships. The environmental Kuznets curve (EKC) is first proposed by Grossman and Krueger [20], and has become one of the most employed model to study the relationships between urbanization and environment [21,22,23]. Moreover, the grey system model and double exponential model have been used to examine how industrialization pushes negative effects on the environment quality [24,25]. In recent years, researches on interactive coercing model and coupling model are conducted to explain the nonlinear evolution of the urbanization–environment system [26,27]. These models have proven to be effective in dealing with complex relationships with statistical data [28,29]. However, since the statistical data are updated periodically and hard to be spatialized at a more flexible scale, the coupling model is insufficient in researching the dynamic relationships between urbanization and the eco-environment. To fill this gap and lead to more in-depth studies, some spatiotemporal analyses have been made during the past decade.
One important approach is to present the urbanization process based on land cover information with the introduction of remote sensing (RS) techniques. Such an approach takes RS images as the source, and extracts the spatiotemporal distribution of land cover to reflect the evolution [4,24,30,31,32]. With the rapid development of RS, image data, unlike the statistical data, can be obtained timely and easily. Therefore, this method has been widely used, and various classification methods have been proposed. However, the evaluation of the urbanization degree as well as the environmental condition is complicated. Single two-dimensional land cover information, although typical, is insufficient to fully present the tetra-dimensional urbanization process [33]. Thus, more indicators are added from different aspects, such as land consumption [34], building and technical infrastructures [35], economic, social and cultural variables [36], etc. Additionally, corresponding multidisciplinary analyses are proposed to make the results closer to the reality, and more practical proposals are performed to keep a sustainable development for the government.
Therefore, we analyze land cover changes in Beijing with time series Landsat images, which provides an initial approach to validate the effectiveness of MFZ planning. The extracted land cover data, as well as other social, economic variables from the statistical data are used to construct the comprehensive evaluation index system. After that, a coupling coordination model is proposed for Beijing and the functional zones to quantify the effectiveness of MFZ planning. From this model, an overall increasing trend of urbanization and the eco-environment in Beijing validates the effectiveness of this planning. It can be a demonstration to prove that the MFZ planning has a potential as the reference of urbanization and eco-civilization construction in other cities.
The rest of this paper is organized as follows. Section 2 focuses on methodologies. The research area, data sources, and preprocessing procedures are illustrated in this section. Section 3 presents the results in which land cover changes are analyzed and the coupling relationship and evolution of the coordination degree are evaluated. Section 4 discusses the result and provides some possible explanations. Section 5 sets out the main conclusions and suggestions.

2. Materials and Methods
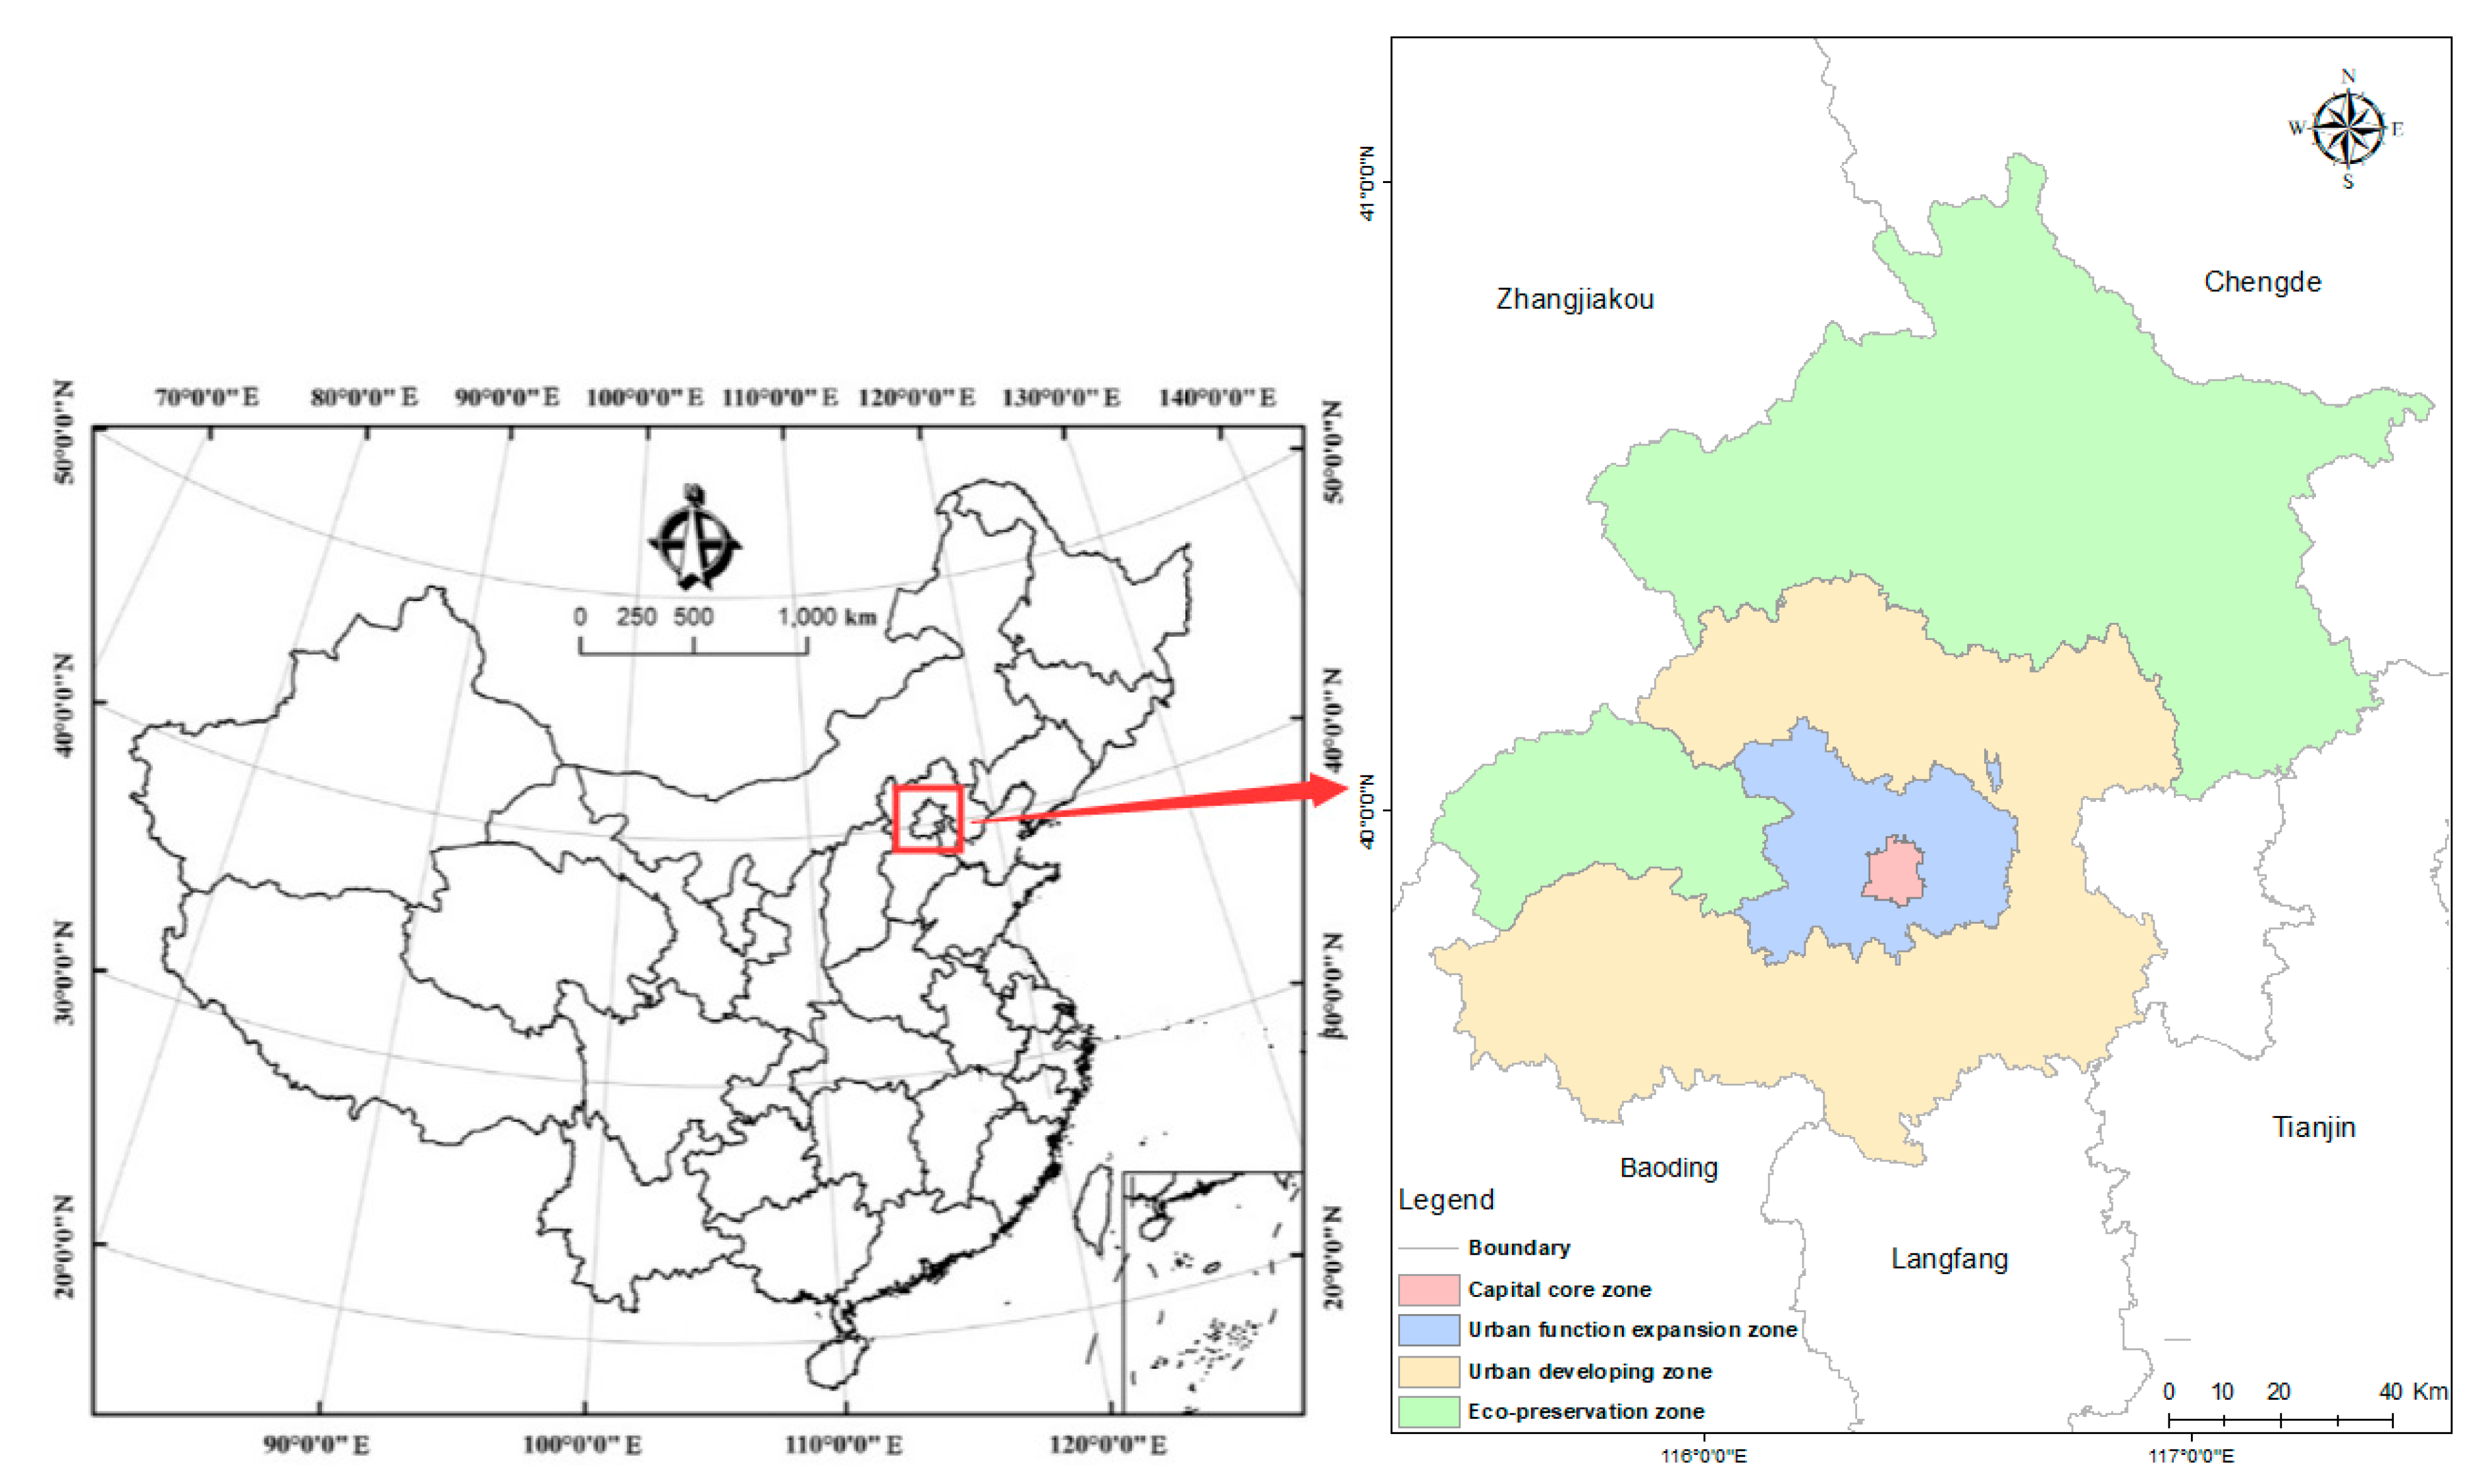
2.1. Study Area

Beijing is the capital city of China, covering 16,400 square kilometers in the northern edge of the North China Plain. As one of the most developed cities in China, it has a large population of 21.15 million and produced 1980 billion Yuan in GDP in 2013. In 2005, Beijing was divided into four main functional zones: the capital core zone, the urban function expansion zone, the urban developing zone, and the eco-preservation zone (Figure 1). The capital core zone aims to optimize the development mode and protect cultural relics such as the Forbidden City. The urban function expansion zone focuses on developing high-end, tertiary industries, such as Zhongguancun Science Park. The urban developing zone is the key development area for modern primary industries such as manufacturing and agriculture. The eco-preservation zone focuses on protecting water sources and restricting the development of high-intensity industries.

2.2. Data Source and Pre-Processing

We took Landsat images, statistical data, and other auxiliary data as our primary sources (Table 1). The Landsat images are originally from the United States Geological Survey (http://glovis.usgs.gov/) and provide land cover information. To ensure the quality and consistency of the data, we found clear, cloud-free images from August to September every two years for 12 years. For all selected images, radiometric techniques, atmospheric calibration, image registration, and mosaic were conducted with ENVI 5.1 and ERDAS 2015. The statistical data were obtained from the Beijing Environment Bulletin and statistic yearbooks of Beijing and different districts. We standardized this data through the range normalization method and calculated all values between a range of 0 and 1 [19]. Both the Landsat images and statistical data were used for constructing the index system of urbanization and eco-environment. Other auxiliary data included images from Google Earth and monitoring data from the Geographic Condition Monitoring Project in the Beijing–Tianjin–Hebei Region, which helped to verify the accuracy of land cover classification.

2.3. Methods

2.3.1. Hierarchical-Based Classification for Time Series Landsat Images

The hierarchical-based classification method has been widely used for time series remote sensing images [37,38,39]. It can overcome the deficiencies of traditional supervised and unsupervised classification methods and fully utilizes experimental knowledge [39,40]. Therefore, the hierarchical-based methods was selected for use in this study with a combination of the iterative self-organizing data analysis technique (ISODATA) algorithm [39,41] and several indexes such as Modification of normalised difference water index (MNDWI), Normalized difference vegetation index (NDVI), and Normalized difference built-up index (NDBI) [42,43,44]. The order for the extraction of the data was water, forests, impervious surfaces, grasslands, cultivated land, and then bare land. After the data was extracted, post-processing work was conducted to eliminate pseudo changes and obtain the final classification results by comparing the data to the Geographic Condition Monitoring Project and Google Earth.
After classification, the results were examined via confusion matrix. The overall annual accuracy was 84.08%, while the annual Kappa index was 0.82, meeting the suggested value by Lucas et al. [45]. The annual producer’s accuracy and user’s accuracy of each category were above 73%. Generally, the classified results were reliable for further analysis. Additionally, both single and synthetic land use dynamic indexes [46,47] were adopted to reflect the changing rate of land use categories over the research periods.

2.3.2. Constructing the Comprehensive Index System of Urbanization and the Eco-Environment

To evaluate the urbanization and eco-environment level of Beijing and its functional zones, this study merged previous index systems of urbanization and the ecosystem used by Wang et al. [19] and Zhou et al. [48]. The comprehensive index system was constructed based on principles of science, comparability, and representativeness to fit the particular situation in Beijing (Table 2).
In processing the weights of the indexes, a subjective weighting method (the analytic hierarchy process, AHP) and an objective weighting method (the entropy method, EM) were selected to reduce the deficiencies of a single method [49,50]. After constructing the comprehensive evaluation index, both urbanization and eco-environment levels were calculated using Equation (1).
F i = W 1 X i 1 + W 2 X i 2 + + W j X i j ,
where, Fi represents the urbanization level f(U) or its eco-environment level g(E) at the ith year, W j is the comprehensive weight of the jth evaluation index, and X i j is the standard value for the jth index in the ith year.

2.3.3. Constructing the Coupling Model of Urbanization and the Eco-Environment

The relationship between urbanization and the eco-environment follows the general system theory, in which both elements interact with each other to form a cohesive system [52]. As an integrated whole, the eco-environment has a considerable influence on, and can be a driver of, urbanization. At the same time, the urbanization process has a tremendous impact on the eco-environment, which may trigger its self-regulating mechanism [53,54,55,56]. To measure such a complex non-linear relationship, several models were introduced, and the coupling model is expressed below:
C = { f ( U ) g ( E ) / [ ( f ( U ) + g ( E ) ) / 2 ] 2 } 1 2 ,
where C indicates the coupling degree of urbanization and the eco-environment. f(U) and g(E) represent the urbanization and eco-environment subsystems, respectively. The coupling coordination model of urbanization and the eco-environment was constructed as follows:
T = f ( U ) + g ( E ) ,   D = C T ,
where D is the coupling coordination degree, and T is the degree of coordination between urbanization and the eco-environment. α and β denote the contribution of urbanization and eco-environment, respectively, to the comprehensive system.
To express the coupling coordination degree in a straightforward manner, we classified it into different stages (Table 3).

3. Results

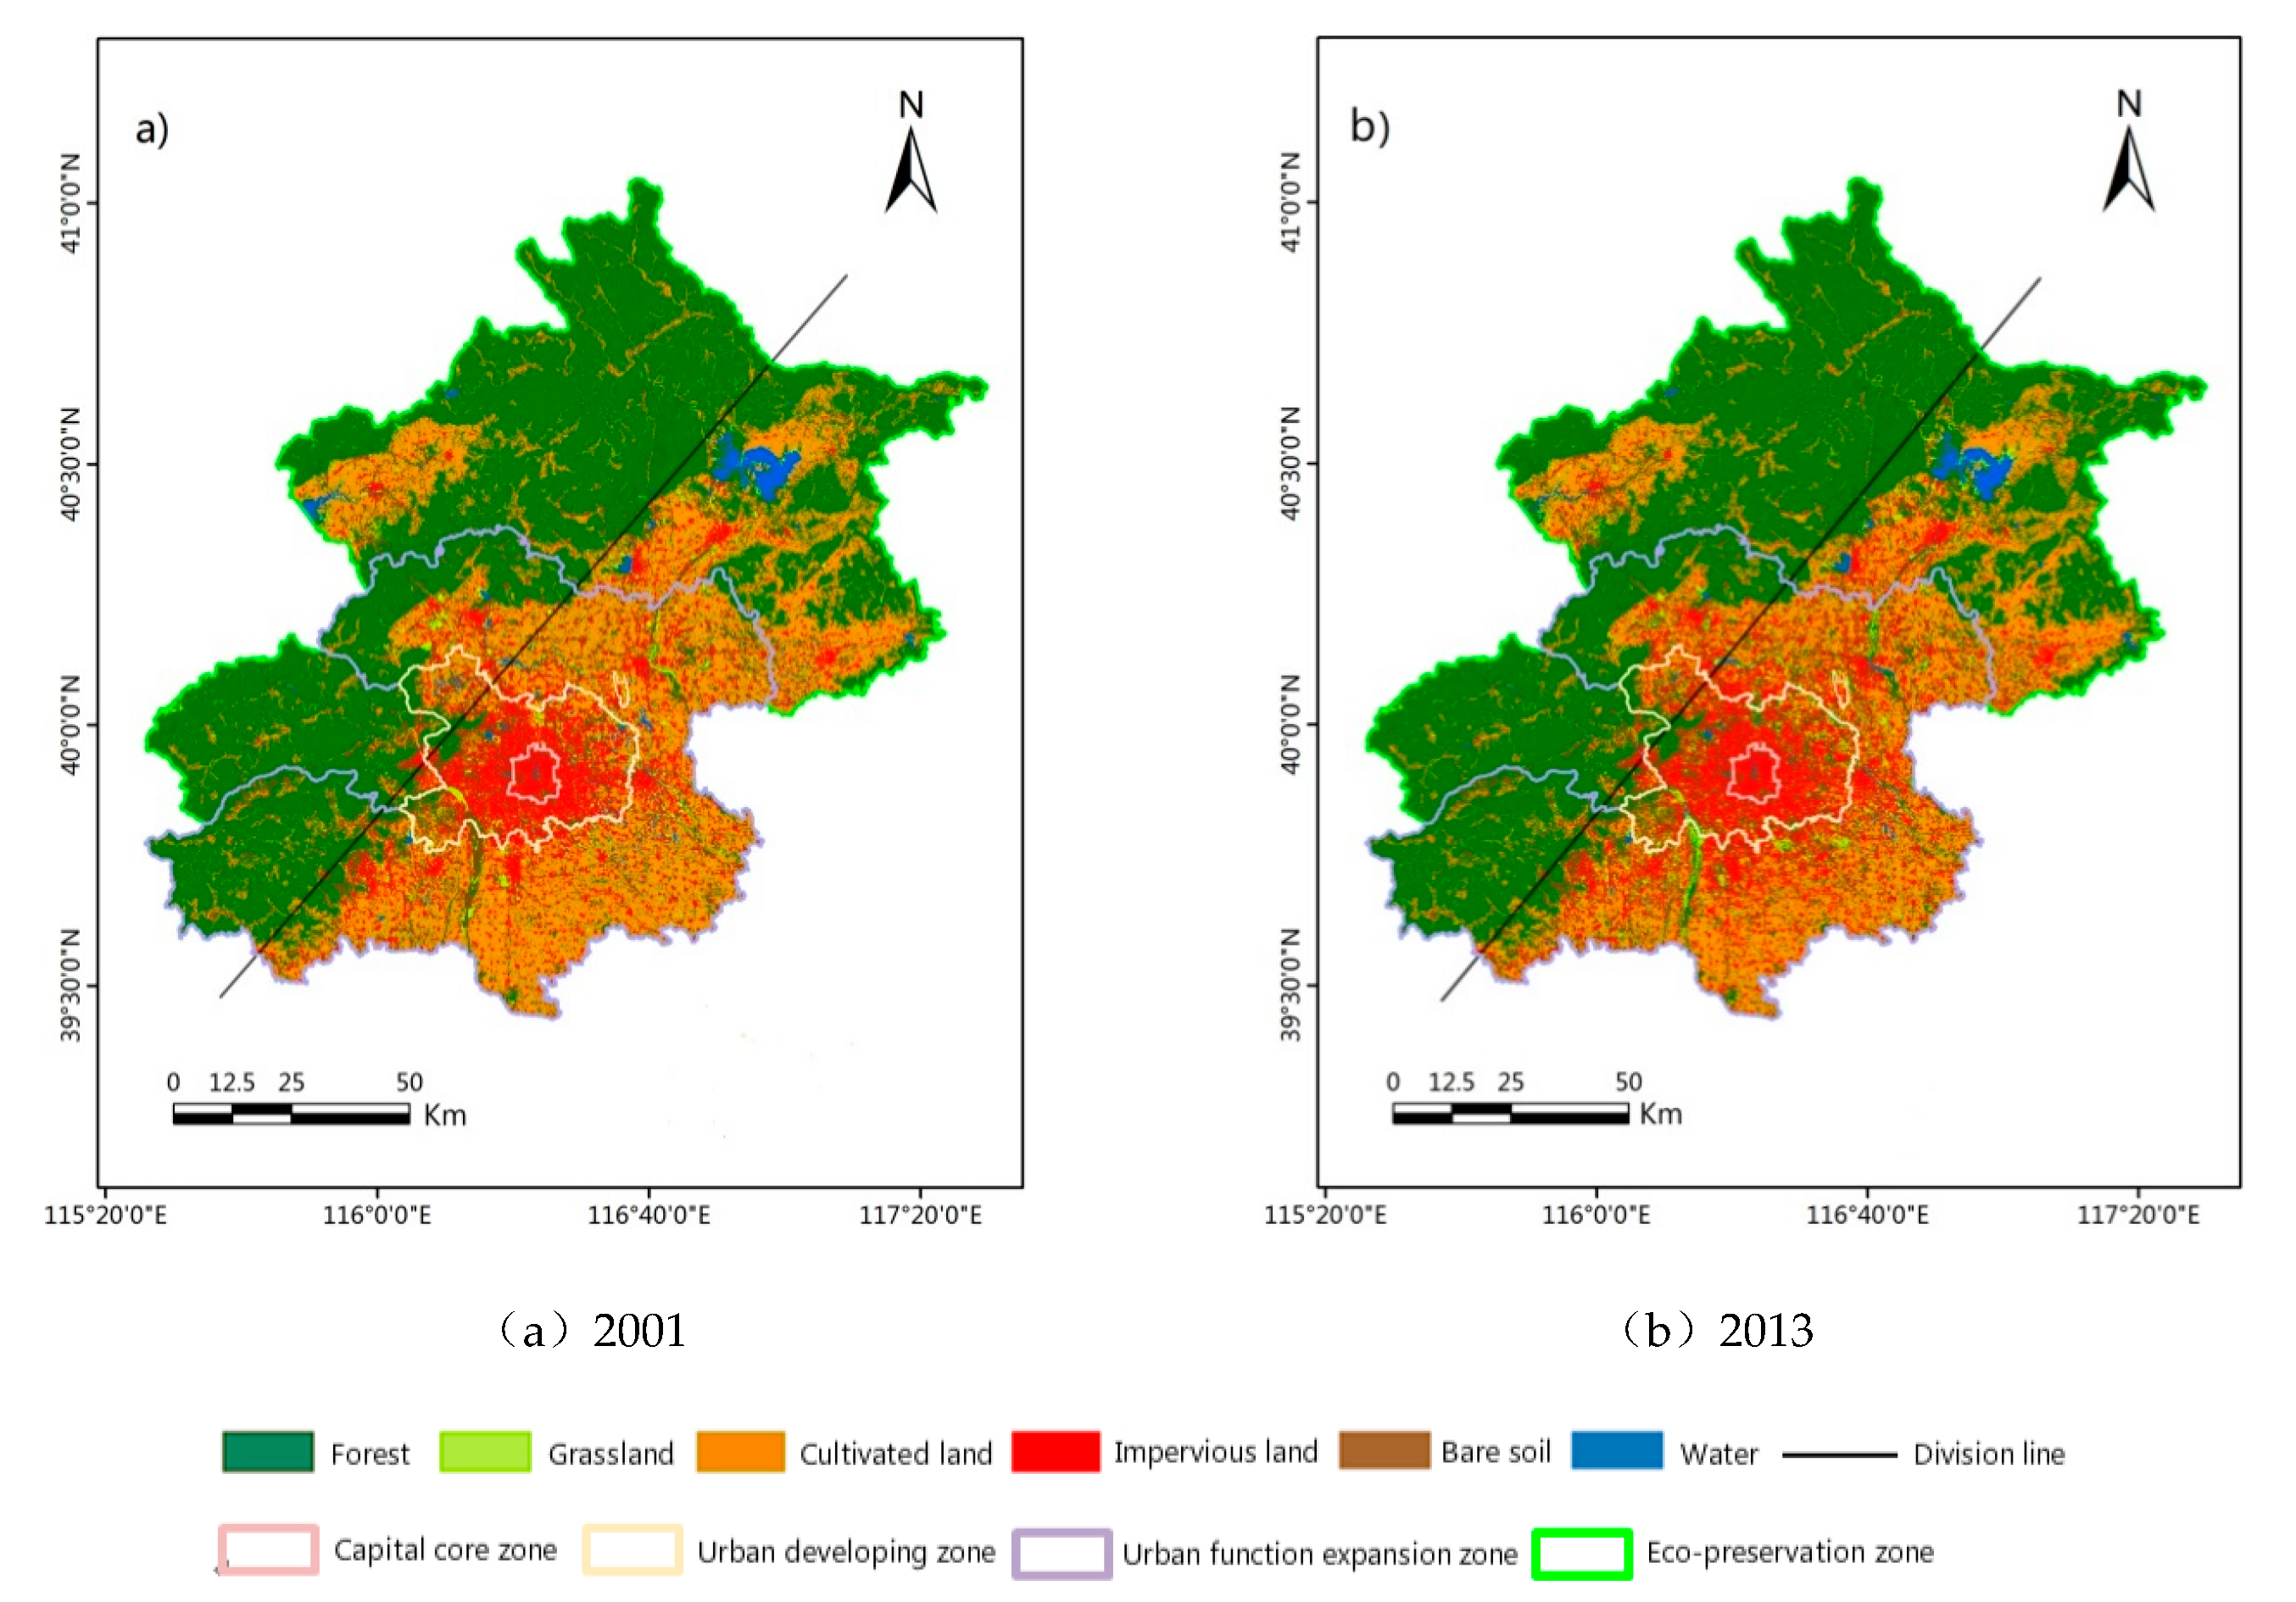
3.1. Land Cover Change Analyses

To analyze the coupling coordination degree better, we conducted spatiotemporal analyses as the secondary research. It can facilitate the coupling analysis with the extracted land cover data, and provide an intuitive sense for the basic urbanization and environmental condition of Beijing. The land cover classification results of Beijing in 2001 and 2013 are shown in Figure 2. This figure shows a highly developed region in the center, mostly surrounded by cultivated land. Moreover, more than fifty percent of the total area is covered by forests, with a polarized distribution pattern segmented by a 45-degree line. The region northwest of the 45-degree line is mountainous area, while the southeast region is the urban space of Beijing.
To explore the characteristics of land cover variation in depth, we shifted the focus from Beijing as a whole to each function zone by calculating its land use dynamic indexes (Table 4, Figure 3) and comparing the land cover changes (Figure 2). The results can be summarized as follows:
(a) The capital core zone was mostly comprised of impervious surfaces, with the smallest synthetic land use dynamic degree of 0.11%. Moreover, urban green land (forest and grassland) increased to some extent in this region.
(b) Around half of the land in the urban function expansion zone was covered by impervious land. The land use in this zone changed significantly during the research period, with the largest synthetic land use dynamic degree of 1.63%. Specifically, the land use dynamic degree of this zone increased sharply from 2005 to 2011 (0.18% to 0.45%). The drastic shift was consistent with the orientation of this zone, where former cultivated land and bare land were changed to the urban area.
(c) In the urban developing zone, cultivated land and forests occupied more than 35% of land, and the synthetic land use dynamic index was 1.39%. The impervious land increased most significantly of all the zones, while the cultivated land and bare land decreased.
(d) The eco-preservation zone was mostly covered by forests (70%) and cultivated land (19%). From both land cover change and the dynamic land use degree, we could find that the eco-preservation zone performed well in adjusting the overall eco-environment level of Beijing.

3.2. Calculation and Evaluation of the Coupling Coordination Degree

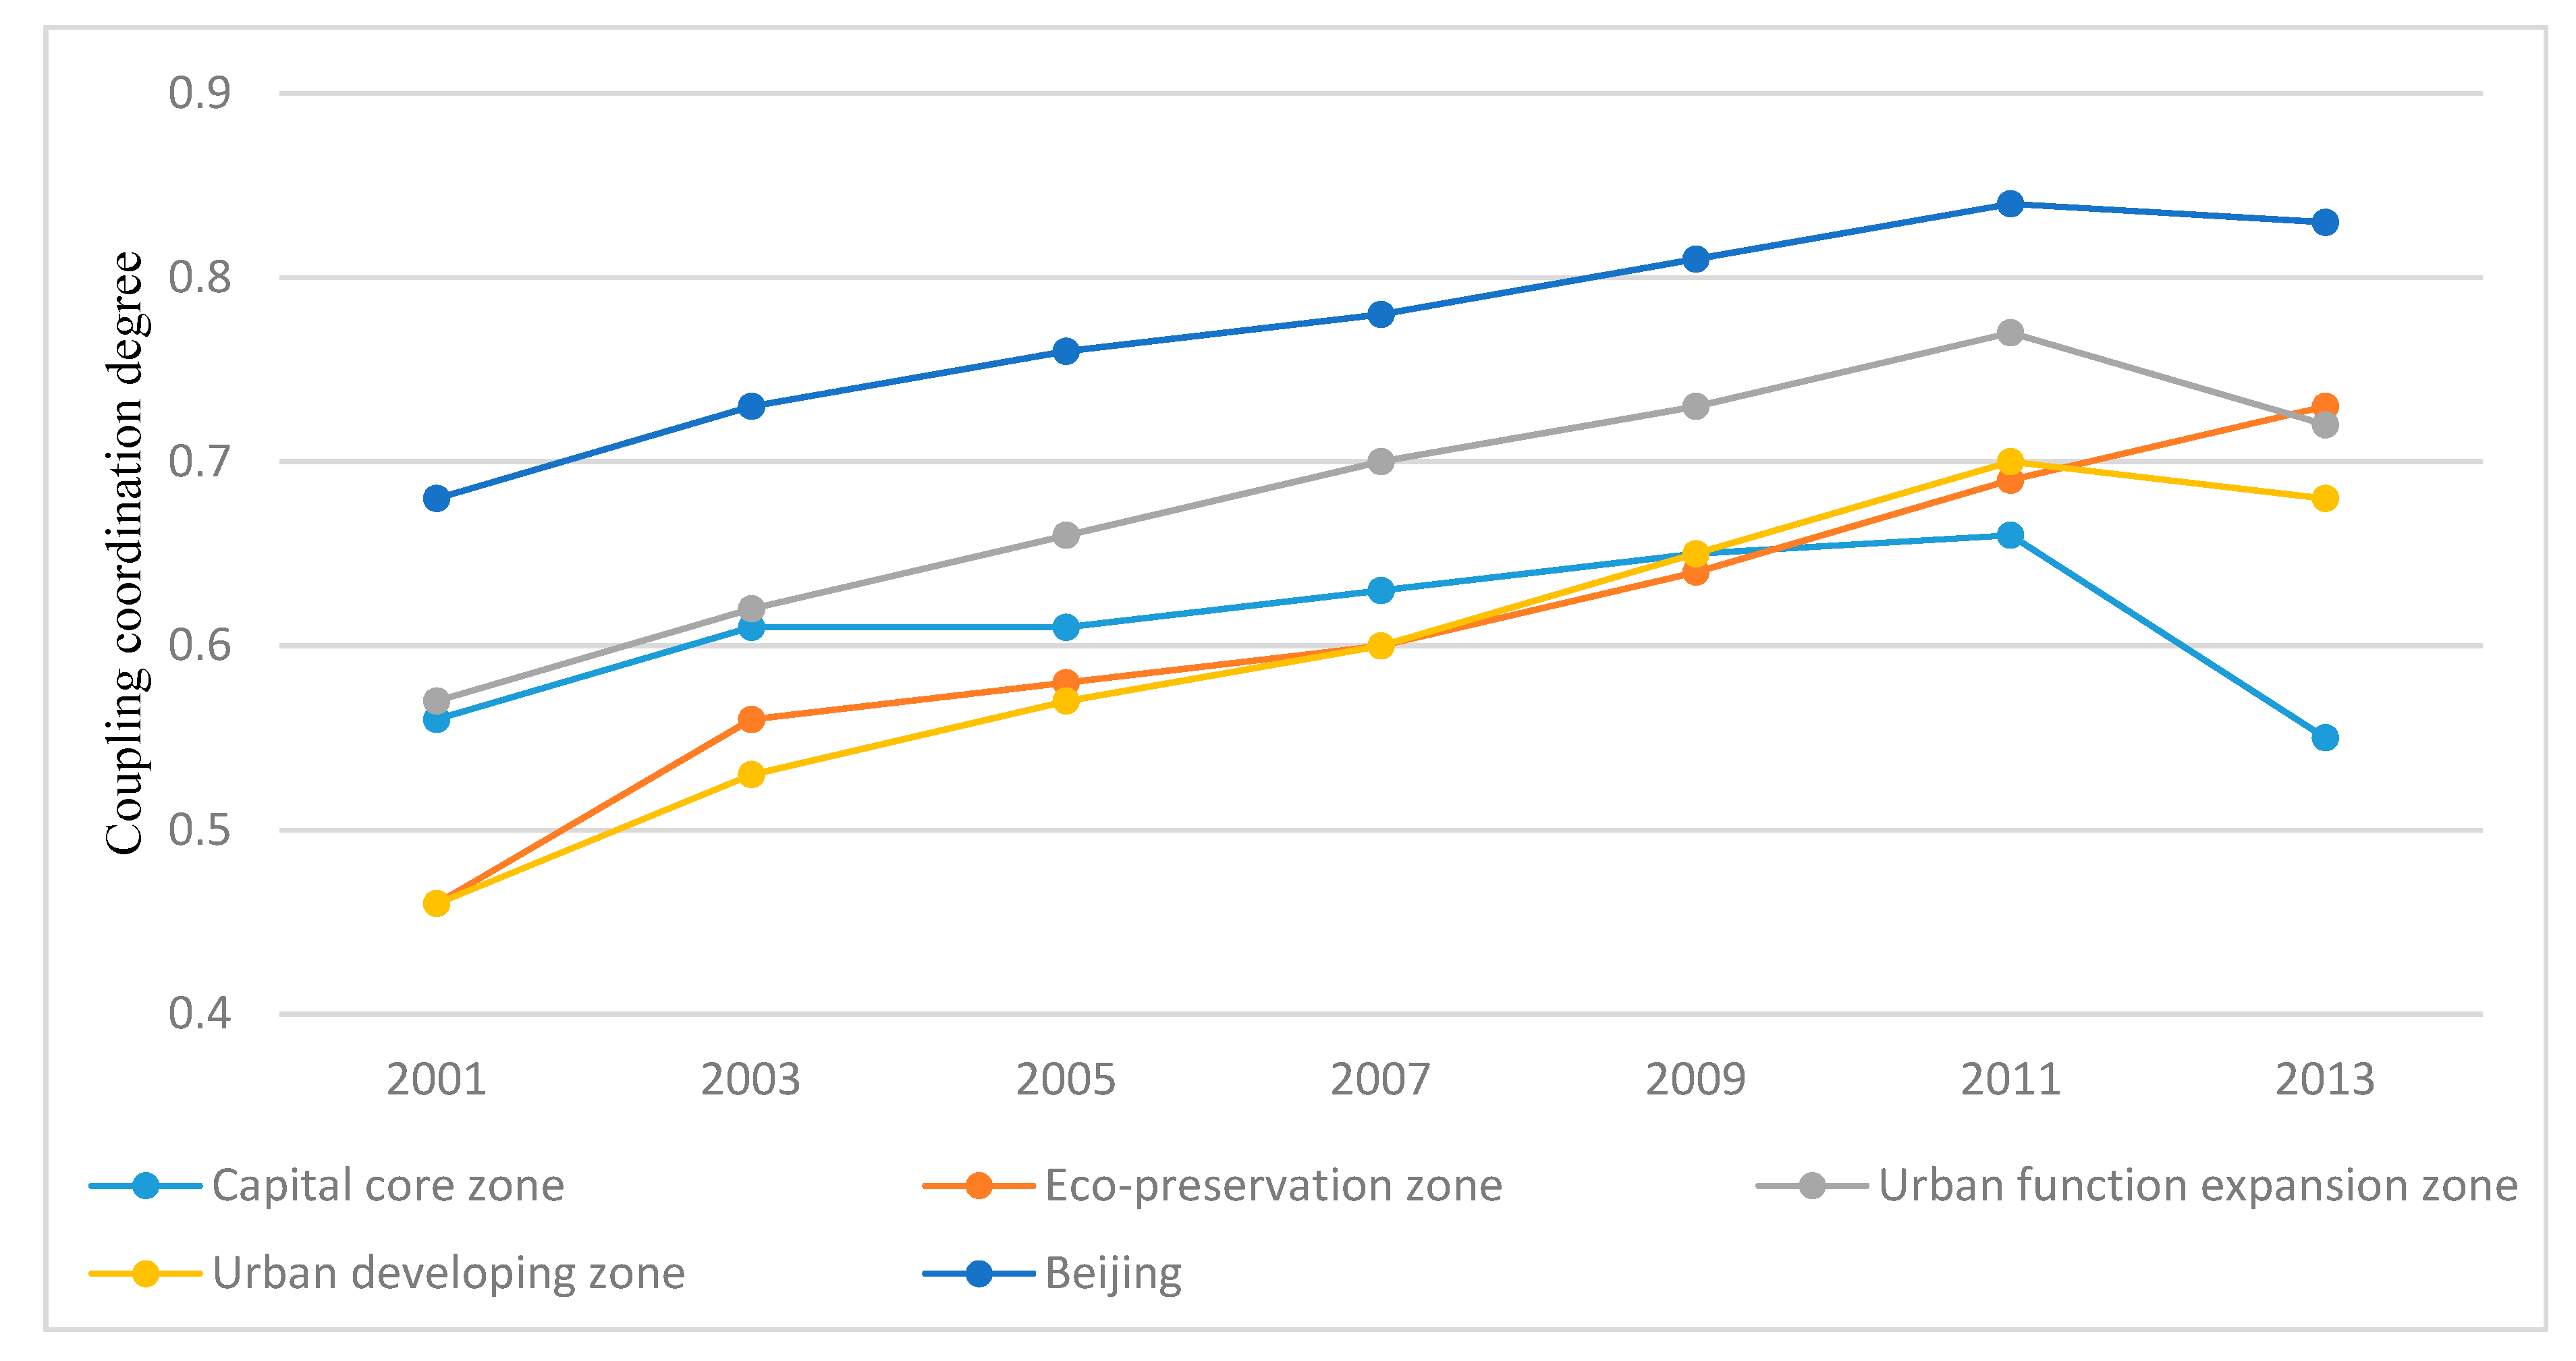
3.2.1. The Coupling Coordination Degree in Beijing

In this section, the coupling coordination degrees of Beijing and its functional zones are presented in Figure 4 and classified in Table 5 (α = 0.5, β = 0.5). As with the eco-environment level, coupling coordination degrees can be divided into two periods, increasing before 2011 and decreasing after 2011. From 2001 to 2011, the coupling coordination degree in Beijing increased from 0.68 to 0.84 and transformed from transitional development to balanced development. The urbanization process was accelerated by urban afforestation as well as the reconfiguration of the secondary and tertiary industries (e.g., the local government encouraged the development of more environmental protection industries).
From 2011 to 2013, the coupling coordination degree decreased by 0.01, moving from “superiorly balanced” development to “superiorly balanced development with environment lagged” stage. Although the urbanization level continued increasing, the eco-environment degree worsened. This decrease mainly came from the gradual reopening of heavily polluting industries after 2008 Beijing Olympics, negatively affecting air quality. Severe haze occurred frequently during this period, and the environmental condition of the entire city (except for the eco-preservation zone) became worse.

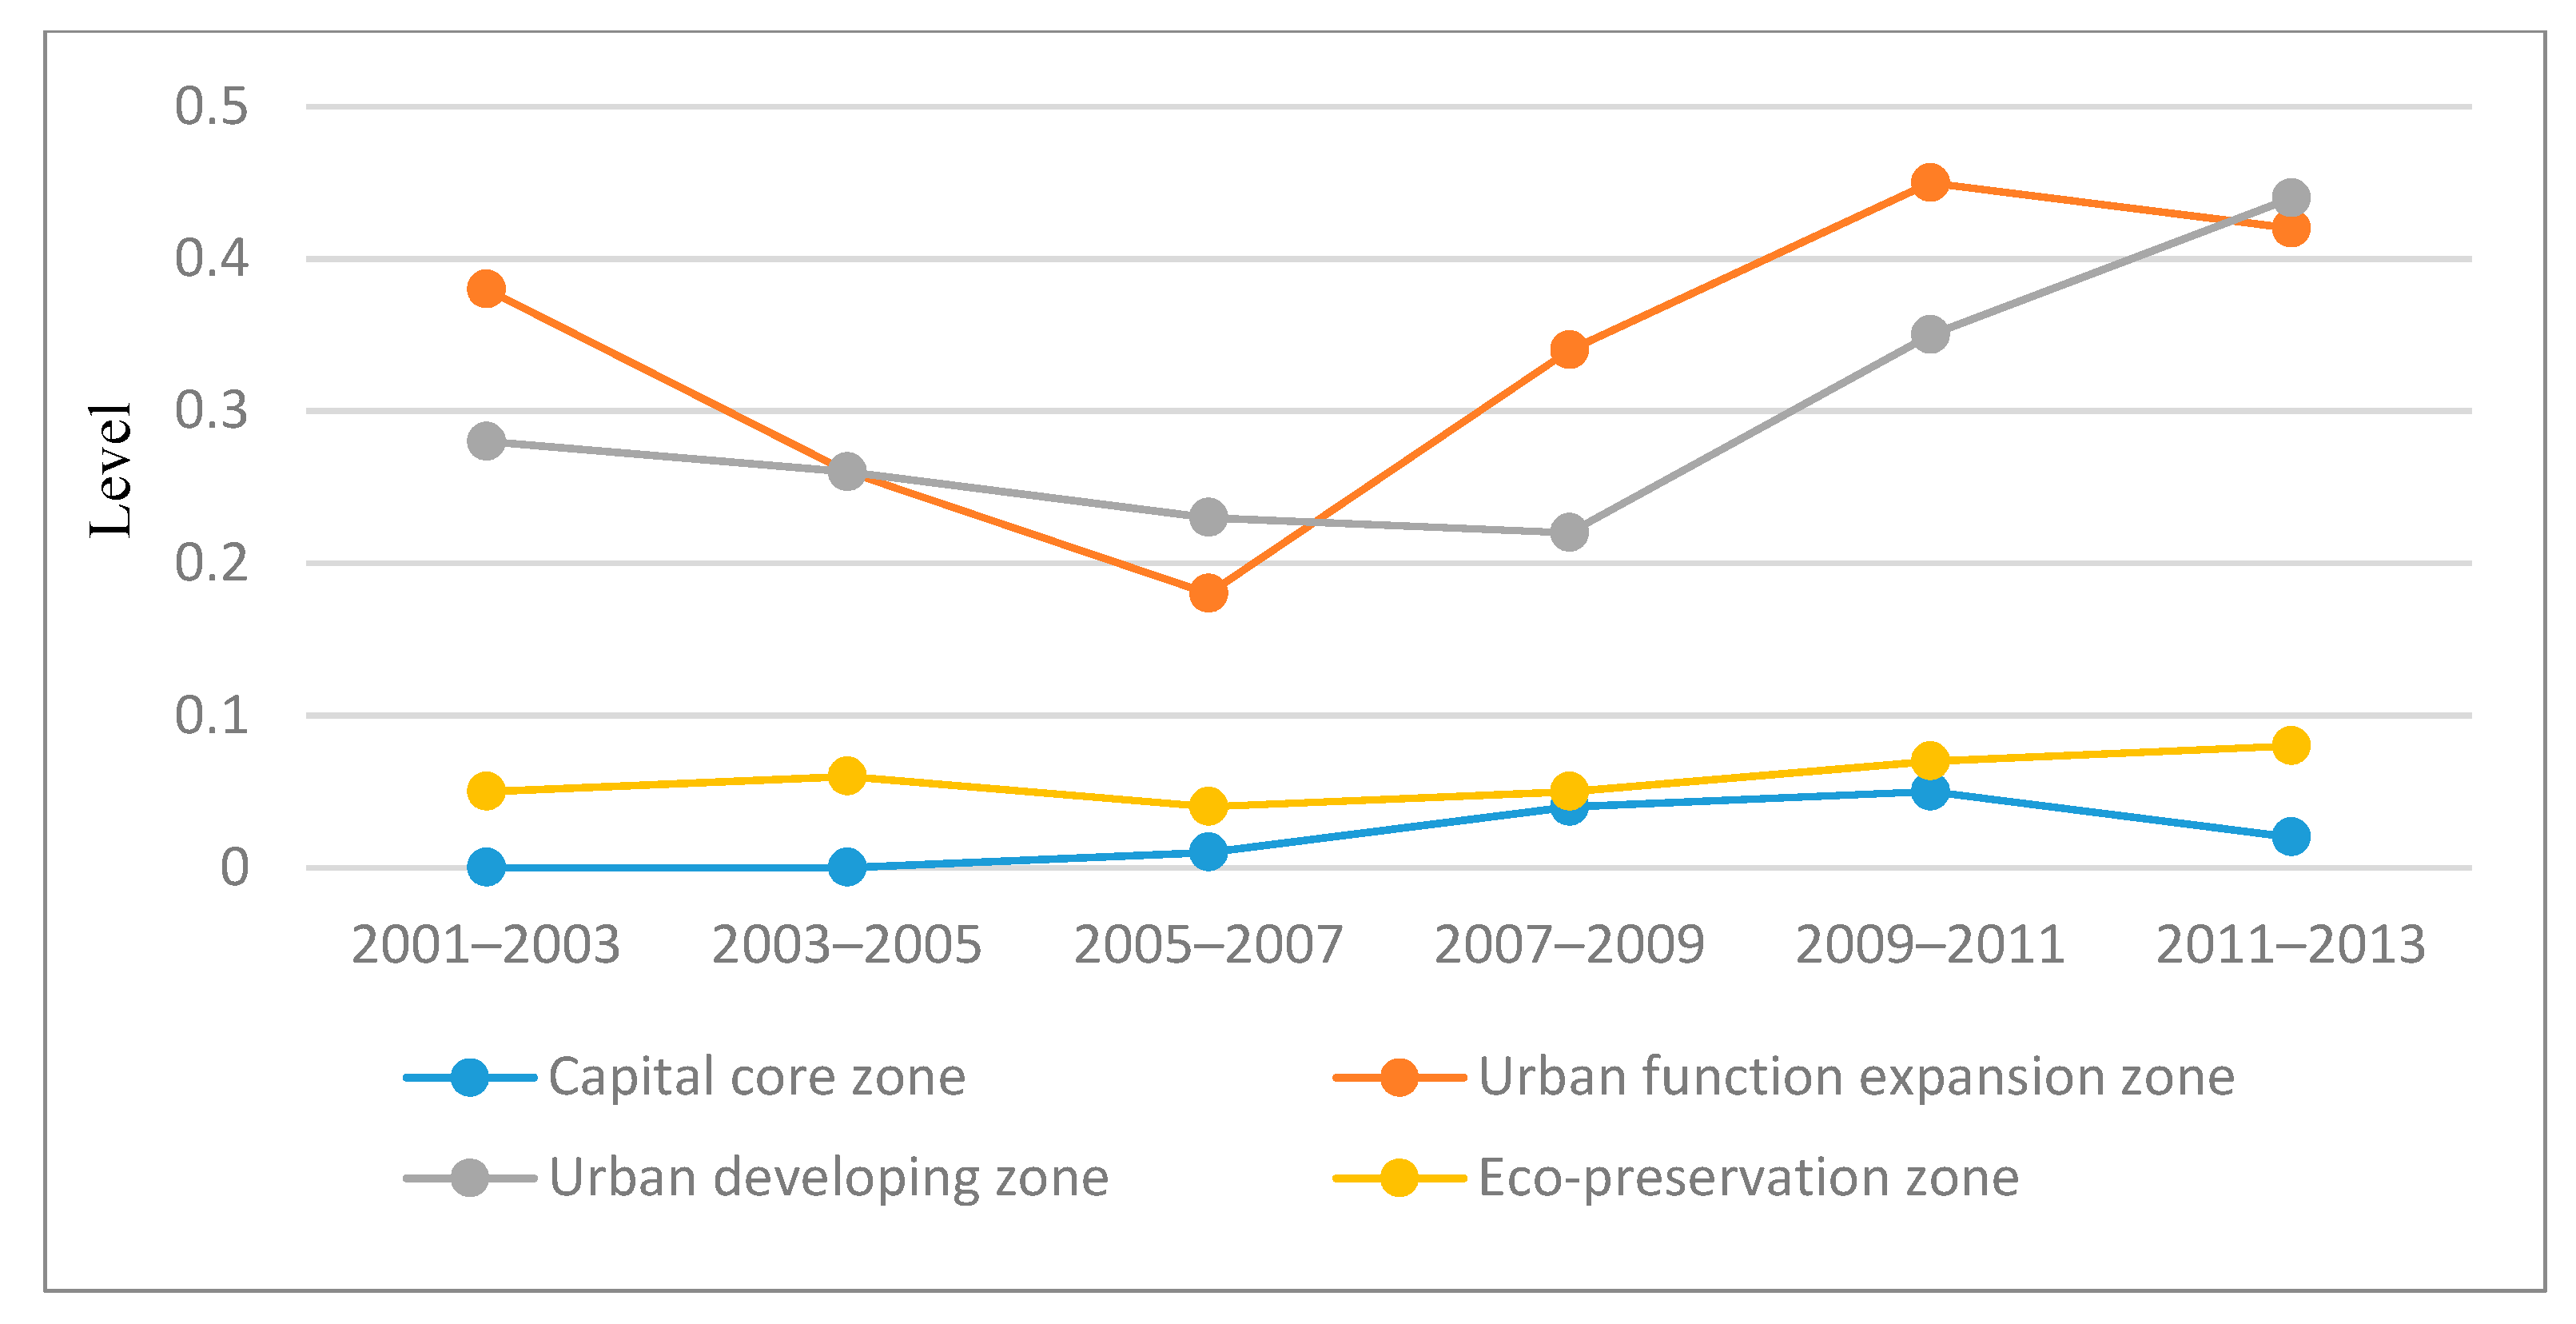
3.2.2. The Coupling Coordination Degree in Functional Zones

The developing patterns of coupling coordination degree were different among four function zones. Thus, to understand the change of coupling coordination degree of each zone, we investigated the trend of urbanization and eco-environment levels with the primary indexes proposed in Table 2.
Since the decrease of coupling coordination degree in Beijing after 2011 was explained above, we only analyzed the trend of each zone during 2001–2011. In this period, the coupling coordination degree of capital core zone first increased (2001–2003) and then decreased (2003–2005) and finally increased again (2005–2011). Figure 5 can help to explain this phenomenon. The first increasing stage mainly came from the rising economic factor and eco-status; the subsequent decrease can be illustrated by the spatial indicator and eco-pressure; while the final increase related to the social factor and eco-status. Moreover, because of the high densities of population and impervious land, this zone maintained at the stage of “basically balanced development with environment lagged”.
A steady increase of the coupling coordination degree occurred in the urban function expansion zone from 2001 to 2011. From Figure 6, it is obvious to find that all indexes from both subsystems were generally increasing. The overall stage of this zone shifted from “basically balanced development of urbanization and environment” to “basically balanced development with environment lagged”. This transition was likely a result of the implementation of MFZ planning in 2005, in which this zone became the major developing area in Beijing, and many cultivated lands were replaced by high tech companies and tertiary industries.
The degree of coupling coordination of the urban developing zone increased rapidly from 0.46 to 0.70. From Figure 7, the fast growing economic and social factors, as well as the eco-status and eco-response boosted such continuously increase. This region went through four development stages from “slightly imbalanced with urbanization lagged” to “basically balanced with urbanization lagged,” then improved to “basically balanced of urbanization and environment”, and eventually to “basically balanced with environment lagged”. Additionally, the eco-environment maintained a relative high level due to the large amount of cultivated lands.
As the eco-protective and water conservation area of Beijing, the eco-preservation zone was mostly covered by forests, grasslands, and water. Thus, the degree of coupling coordination remained at the “basically balanced development with urbanization lagged” stage from 2003. However, this zone was the only region where the coupling coordination increased consistently during the entire research period. It indicated a reasonable development between urbanization and environmental protection. From the perspective of index system (Figure 8), economic index and eco-response led to the growth in this zone.

4. Discussion

This research examined the urbanization and eco-environment condition of Beijing from spatiotemporal analysis and the coupling model. The results can be useful for urban planners or decision makers to form a basic understanding for the development pattern of Beijing, and recognize the effectiveness of MFZ planning. However, there are still some issues remained for further discussion of this compound system.
The results of spatiotemporal analysis provide an intuitive explanation on how the urbanization and eco-environment were affected. During the research period, the cultivated land in Beijing was replaced by the impervious surface and urban green land. It was a direct reflection of the urbanization process and the implementation of urban afforestation strategy proposed after Beijing won the Olympic bid in 2001. Moreover, the impervious land expanded outward to the urban fringes (urban developing zone and urban function expansion zone), and took over large amounts of the cultivated land. Such changes can present the industrial transformation of Beijing from primary industries to secondary and tertiary industries. Additionally, the land use dynamic degrees of each functional zone are consistent with the requirements proposed by the MFZ planning. For instance, the stability of capital core zone chiefly came from two reasons. First, as the most developed area of the city, limited space was left for further expansion. Second, according to the planning, this zone aimed to protect the culture relics, which means that most land in this region cannot be changed. Furthermore, urban function expansion zone, as the key development region of Beijing, had a significant increase for its synthetic land use dynamic degree after 2005 (the year when MFZ planning was put into practice). The high dynamic index of impervious surface indicated a rapid expansion in this zone, while such an expansion was very likely to disrupt the ecological balance.
The results of coupling coordination degree quantify the sustainable development of Beijing, and reveal the distinctive characteristics of each functional zone. The development pattern of functional zones can be generally classified into three categories: a relative environmental lagged condition for the central area (capital core zone and urban function expansion zone), an increasing urbanization condition of urban developing zone, and a continuously urbanization lagged condition for the eco-preservation zone. Different patterns interacted together to maintain the balance in Beijing. Moreover, all functional zones increased both their urbanization and eco-environment level. It was a high-quality and efficient development pattern, and can indicate the rationality of MFZ planning.
Further analyses on the comprehensive index system of urbanization and the eco-environment, expressed the hidden mechanism for the above development pattern. For the urbanization subsystem of Beijing, demographic urbanization was the decisive index. It could be explained by the high population density. Moreover, different trend lines for the urbanization level of each zone were closely related to their functional orientation proposed by the MFZ planning. For instance, the influence of economic urbanization was approaching to demographic urbanization in the capital core zone, and was likely to become the dominant factor in the future. Since the eco-preservation zone was also mostly covered by forest and cultivated land, we could infer that this zone was dominated by primary industries; while the secondary and tertiary industries were supporting industries for the regional urbanization. The eco-environment levels were completely opposite from the urbanization levels. Some information may be explored by carefully checking the index system. To be specific, although the overall environmental condition had become better for all zones, the eco-pressure index of capital core zone kept decreasing. Considering the secondary indexes, this phenomenon was related to the large consumption of energy and high building density. The secondary index also explained the decreasing trend of eco-pressure for the eco-preservation zone, since the expansion of impervious surface, and energy consumption were strictly controlled in this area.

5. Conclusions

In the context of rapid urbanization, Chinese government announced the MFZ planning for a sustainable development between urbanization and the eco-environment. To examine the effectiveness of this planning, this study first conducted a spatiotemporal analysis for land cover changes in Beijing and its four functional zones. As the above research shows, different land uses were distributed unevenly in the city, however each functional zone has their unique characteristics. These characteristics followed the guidance of the MFZ planning, and maintained an overall balanced development between urbanization and the eco-environment.
To evaluate the specific urbanization and eco-environment level, a comprehensive evaluation index system is constructed in this paper by integrating both land cover data and the statistical data. The calculated results are then used to construct the coupling coordination model, which represent the development patterns in Beijing and its functional zones. According to the results, the overall upward trends indicated that the eco-environment condition could be improved during the progression of urbanization. However, some remaining issues, such as deterioration of air quality and a mismatch in the distribution of green space and residential areas, still require more.
To sum up, this study demonstrated that the MFZ planning had made significant progress in maintaining a coordinated development of Beijing and provided a useful reference for urbanization and eco-civilization construction in other cities. Additionally, it enriched the coupling theory by considering the spatial distribution data and provided methods and ideas for future researches. There are several areas for further research. Although the research objects (Beijing and its functional zones) have distinct regional characteristics, the proposed comprehensive evaluation index system may lack pertinence for different regions and could affect the accuracy of evaluated results. Moreover, redundant information still exists between some indexes due to the restrictions of statistical data. Thus, a deeper discussion on selecting more suitable indexes can be conducted. Furthermore, after the research period, the Beijing government announced a new policy in 2014 to further adjust the structure of industries, and established the Xiongan District in 2017. Therefore, the economic structure and spatial pattern will change in the future. Researches can be made to explore the sustainable developing mode based on our research, which can provide much collaborative information for the decision-makers.

Author Contributions

Conceptualization, Y.H. and Q.Q.; Methodology, Y.H.; Formal analysis, Y.H. and Q.Q.; Investigation, Y.H. and Q.Q.; Data Curation, X.M. and Y.C.; Writing-Original Draft Preparation, Y.H.; Writing-Review & Editing, Y.S.; Supervision, Y.S.; Funding Acquisition, Y.S.

Funding

This research was funded by the Key Fund of National Natural Science Foundation of China, grant number 41631175; the National Key Research and Development Program of China, grant number 2017YFB0503500.

Acknowledgments

The authors express their gratitude towards the journal editors and the reviewers, whose thoughtful suggestions played a significant role in improving the quality of this paper.

Conflicts of Interest

The authors declare no conflict of interest.

References

  1. Zhao, Y.; Wang, S.; Ge, Y.; Liu, Q.; Liu, X. The spatial differentiation of the coupling relationship between urbanization and the eco-environment in countries globally: A comprehensive assessment. Ecol. Modell. 2017, 360, 313–327. [Google Scholar] [CrossRef]
  2. Riley, S.P.D.; Busteed, G.T.; Kats, L.B.; Vandergon, T.L.; Lee, L.F.S.; Dagit, R.G.; Kerby, J.L.; Fisher, R.N.; Sauvajot, R.M. Effects of urbanization on the distribution and abundance of amphibians and invasive species in southern California streams. Conserv. Biol. 2005, 19, 1894–1907. [Google Scholar] [CrossRef]
  3. Kumazawa, N. A Study of Impact of Urbanization on Ephemeral Streams in Headwater Watersheds in Eastern Pima County, AZ; The University of Arizona: Tucson, AZ, USA, 2004. [Google Scholar]
  4. Singh, P.; Kikon, N.; Verma, P. Impact of land use change and urbanization on urban heat island in Lucknow city, Central India. A remote sensing based estimate. Sustain. Cities Soc. 2017, 32, 100–114. [Google Scholar] [CrossRef]
  5. Hall, R.I.; Leavitt, P.R.; Quinlan, R.; Dixit, A.S.; Smol, J.P. Effects of agriculture, urbanization, and climate on water quality in the northern Great Plains. Limnol. Oceanogr. 1999, 44, 739–756. [Google Scholar] [CrossRef] [Green Version]
  6. Paul, M.J.; Meyer, J.L. Streams in the urban landscape. Annu. Rev. Ecol. Syst. 2001, 32, 333–365. [Google Scholar] [CrossRef]
  7. Lederbogen, F.; Kirsch, P.; Haddad, L.; Streit, F.; Tost, H.; Schuch, P.; Wüst, S.; Pruessner, J.C.; Rietschel, M.; Deuschle, M.; et al. City living and urban upbringing affect neural social stress processing in humans. Nature 2011, 474, 498–501. [Google Scholar] [CrossRef]
  8. Service, C.R. China’s Economic Rise: History, Trends, Challenges, and Implications for the United States. 2019. Available online: https://fas.org/sgp/crs/row/RL33534.pdf (accessed on 7 November 2019).
  9. Chow, G.C.; Li, K. China’s Economic Growth. Ecomonic Dev. Cult. Chang. 2002, 51, 247–256. [Google Scholar] [CrossRef]
  10. Ai, J.; Feng, L.; Dong, X.; Zhu, X.; Li, Y. Exploring coupling coordination between urbanization and ecosystem quality (1985–2010): a case study from Lianyungang City, China. Front. Earth Sci. 2016, 10, 527–545. [Google Scholar] [CrossRef]
  11. Bao, C.; Fang, C.-L. Water resources constraint force on urbanization in water deficient regions: A case study of the Hexi Corridor, arid area of NW China. Ecol. Econ. 2007, 62, 508–517. [Google Scholar] [CrossRef]
  12. Jaeger, J.A.G.; Bertiller, R.; Schwick, C.; Kienast, F. Suitability criteria for measures of urban sprawl. Ecol. Indic. 2010, 10, 397–406. [Google Scholar] [CrossRef]
  13. Lu, Q.; Liang, F.; Bi, X.; Duffy, R.; Zhao, Z. Effects of urbanization and industrialization on agricultural land use in Shandong Peninsula of China. Ecol. Indic. 2011, 11, 1710–1714. [Google Scholar] [CrossRef]
  14. Fan, J.; Tao, A.; Ren, Q. On the Historical Background, Scientific Intentions, Goal Orientation, and Policy Framework of Major Function-Oriented Zone Planning in China. J. Resour. Ecol. 2010, 1, 289–299. [Google Scholar]
  15. Gu, A.; Teng, F.; Wang, Y. China energy-water nexus: Assessing the water-saving synergy effects of energy-saving policies during the eleventh Five-year Plan. Energy Convers. Manag. 2014, 85, 630–637. [Google Scholar] [CrossRef]
  16. Howard, E. To-Morrow: A Peaceful Path to Real Reform; Swan Sonnenschein: London, UK, 1898. [Google Scholar]
  17. Corbusier, L. La Ville Radieuse. In Proceedings of the Editions de l’Architecture d’Aujourd’hui; Editions de l'Architecture D'aujourd'hui: Boulogne, France, 1935. [Google Scholar]
  18. Wright, F.L. The Disappearing City; W.F. Payson: New York, NY, USA, 1932. [Google Scholar]
  19. Wang, S.; Ma, H.; Zhao, Y. Exploring the relationship between urbanization and the eco-environment—A case study of Beijing-Tianjin-Hebei region. Ecol. Indic. 2014, 45, 171–183. [Google Scholar] [CrossRef]
  20. Grossman, G.M.; Krueger, A.B. Economic Growth and the Environment Author (s): Gene M. Grossman and Alan B. Krueger Reviewed work (s): Published by: Oxford University Press. Q. J. Econ. 1995, 110, 353–377. [Google Scholar] [CrossRef]
  21. Ozatac, N.; Gokmenoglu, K.K.; Taspinar, N. Testing the EKC hypothesis by considering trade openness, urbanization, and financial development: the case of Turkey. Environ. Sci. Pollut. Res. 2017, 24, 16690–16701. [Google Scholar] [CrossRef]
  22. Saboori, B.; Sulaiman, J. Environmental degradation, economic growth and energy consumption: Evidence of the environmental Kuznets curve in Malaysia. Energy Policy 2013, 60, 892–905. [Google Scholar] [CrossRef]
  23. Kijima, M.; Nishide, K.; Ohyama, A. Economic models for the environmental Kuznets curve: A survey. J. Econ. Dyn. Control 2010, 34, 1187–1201. [Google Scholar] [CrossRef]
  24. Nonomura, A.; Kitahara, M.; Masuda, T. Impact of land use and land cover changes on the ambient temperature in a middle scale city, Takamatsu, in Southwest Japan. J. Environ. Manag. 2009, 90, 3297–3304. [Google Scholar] [CrossRef]
  25. Vargo, J.; Habeeb, D.; Stone, B. The importance of land cover change across urban-rural typologies for climate modeling. J. Environ. Manag. 2013, 114, 243–252. [Google Scholar] [CrossRef]
  26. Fang, C.; Wang, J. A theoretical analysis of interactive coercing effects between urbanization and eco-environment. Chinese Geogr. Sci. 2013, 23, 147–162. [Google Scholar] [CrossRef]
  27. Yin, K.; Wang, R.; An, Q.; Yao, L.; Liang, J. Using eco-efficiency as an indicator for sustainable urban development: A case study of Chinese provincial capital cities. Ecol. Indic. 2014, 36, 665–671. [Google Scholar] [CrossRef]
  28. Li, Y.; Li, Y.; Zhou, Y.; Shi, Y.; Zhu, X. Investigation of a coupling model of coordination between urbanization and the environment. J. Environ. Manag. 2012, 98, 127–133. [Google Scholar] [CrossRef] [PubMed]
  29. He, J.; Wang, S.; Liu, Y.; Ma, H.; Liu, Q. Examining the relationship between urbanization and the eco-environment using a coupling analysis: Case study of Shanghai, China. Ecol. Indic. 2017, 77, 185–193. [Google Scholar] [CrossRef]
  30. Patra, S.; Sahoo, S.; Mishra, P.; Mahapatra, S.C. Impacts of urbanization on land use /cover changes and its probable implications on local climate and groundwater level. J. Urban Manag. 2018, 7, 70–84. [Google Scholar] [CrossRef]
  31. Mantas, V.M.; Marques, J.C.; Pereira, A.J.S.C. A geospatial approach to monitoring impervious surfaces in watersheds using Landsat data (the Mondego Basin, Portugal as a case study). Ecol. Indic. 2016, 71, 449–466. [Google Scholar] [CrossRef]
  32. Gu, W.; Guo, J.; Fan, K.; Chan, E.H.W. Dynamic Land Use Change and Sustainable Urban Development in a Third-tier City within Yangtze Delta. Procedia Environ. Sci. 2016, 36, 98–105. [Google Scholar] [CrossRef] [Green Version]
  33. Wurm, M.; D’Angelo, P.; Reinartz, P.; Taubenböck, H. Investigating the applicability of Cartosat-1 DEMs and topographic maps to localize large-area urban mass concentrations. IEEE J. Sel. Top. Appl. Earth Obs. Remote Sens. 2014, 7, 4138–4152. [Google Scholar] [CrossRef]
  34. García-Ayllón, S. Retro-diagnosis methodology for land consumption analysis towards sustainable future scenarios: Application to a mediterranean coastal area. J. Clean. Prod. 2018, 195, 1408–1421. [Google Scholar] [CrossRef]
  35. Inostroza, L.; Hamstead, Z.; Spyra, M.; Qhreshi, S. Beyond urban–rural dichotomies: Measuring urbanisation degrees in central European landscapes using the technomass as an explicit indicator. Ecol. Indic. 2019, 96, 466–476. [Google Scholar] [CrossRef]
  36. Stylianidis, E.; Karanikolas, N.; Kaimaris, D. A GIS for urban sustainability indicators in spatial planning. Int. J. Sustain. Dev. Plan. 2012, 7, 1–13. [Google Scholar] [CrossRef]
  37. Chen, Y.; Su, W.; Li, J.; Sun, Z. Hierarchical object oriented classification using very high resolution imagery and LIDAR data over urban areas. Adv. Sp. Res. 2009, 43, 1101–1110. [Google Scholar] [CrossRef]
  38. Dinis, J.; Navarro, A.; Soares, F.; Santos, T. Hierarchical object-based classification of dense urban areas by integrating high spatial resolution satellite images and lidar elevation data. Int. Arch. Photogramm. Remote Sens. 2010, 38. [Google Scholar]
  39. Lu, D.; Hetrick, S.; Moran, E.; Li, G. Application of Time Series Landsat Images to Examining Land-use/Land-cover Dynamic Change. Photogramm. Eng. Remote Sens. 2012, 78, 747–755. [Google Scholar] [CrossRef] [Green Version]
  40. Lu, D.; Li, G.; Moran, E.; Hetrick, S. Spatiotemporal analysis of land-use and land-cover change in the Brazilian Amazon. Int. J. Remote Sens. 2013, 34, 5953–5978. [Google Scholar] [CrossRef] [Green Version]
  41. Jensen, J.R. Introductory Digital Image Processing: A Remote Sensing Prospective, 2nd ed.; Prentice Hall, Inc.: Upper Saddle River, NJ, USA, 1996. [Google Scholar]
  42. Rouse, J.W.; Hass, R.H.; Schell, J.A.; Deering, D.W. Monitoring vegetation systems in the great plains with ERTS. In Third Earth Resources Technology Satellite (ERTS) Symposium; NASA: Washington, DC, USA, 1974; Volume 1, p. 309. [Google Scholar]
  43. Zha, Y.; Gao, J.; Ni, S. Use ofnormalized difference built-up index in automatically mapping urban areas from TM imagery. Int. J. Remote Sens. 2003, 24, 583–594. [Google Scholar] [CrossRef]
  44. Xu, H. Modification of normalised difference water index (NDWI) to enhance open water features in remotely sensed imagery. Int. J. Remote Sens. 2006, 27, 3025–3033. [Google Scholar] [CrossRef]
  45. Lucas, L.; Janssen, F.; Vanderwel, F.J.M. Van Der Accuracy Assessment of Satellite Derived Land-Cover Data: A review. Photogramm. Eng. Remote Sens. 1994, 60, 419–426. [Google Scholar]
  46. Zhang, H.; Zhou, L.G.; Chen, M.N.; Ma, W.C. Land use dynamics of the fast-growing Shanghai Metropolis, China (1979–2008) and its implications for land use and urban planning policy. Sensors 2011, 11, 1794–1809. [Google Scholar] [CrossRef]
  47. Zhao, Y.; Zhang, K.; Fu, Y.; Zhang, H. Examining land-use/land-cover change in the lake dianchi watershed of the Yunnan-Guizhou plateau of Southwest China with remote sensing and GIS techniques: 1974-2008. Int. J. Environ. Res. Public Health 2012, 9, 3843–3865. [Google Scholar] [CrossRef]
  48. Zhou, D.; Tian, Y.; Jiang, G. Spatio-temporal investigation of the interactive relationship between urbanization and ecosystem services: Case study of the Jingjinji urban agglomeration, China. Ecol. Indic. 2018, 95, 152–164. [Google Scholar] [CrossRef]
  49. Chen, Y.; Yu, J.; Khan, S. The spatial framework for weight sensitivity analysis in AHP-based multi-criteria decision making. Environ. Model. Softw. 2013, 48, 129–140. [Google Scholar] [CrossRef]
  50. Hernández, S.; Baldomir, A.; Díaz, J.; Pereira, F. An enhanced formulation of the maximum entropy method for structural optimization. Comput. Mater. Contin. 2012, 32, 219–239. [Google Scholar]
  51. Feng, Z.; Zhang, J.; Wei, H.; Zhai, L. Dynamic changes of hemeroby degree based on the land cover classification: A case study in Beijing. Chinese J. Ecol. 2017, 36, 508–516. [Google Scholar]
  52. Bertalany, L. General System Theory: Foundations, Development, Applications; George Braziller, Inc.: New York, NY, USA, 1969. [Google Scholar]
  53. Chisholm, M. General Systems Theory and Geography. Trans. Inst. Br. Geogr. 1967, 42, 45–52. [Google Scholar] [CrossRef]
  54. Strahler, A.N. Systems theory in physical geography. Phys. Geogr. 1980, 1, 1–27. [Google Scholar] [CrossRef]
  55. Haigh, M.J. Geography and general system theory, philosophical homologies and current practice. Geoforum 1985, 16, 191–203. [Google Scholar] [CrossRef]
  56. Jiang, B.; Gimblett, H.R. An agent-based approach to environmental and urban systems. In Integrating Geographic Information Systems and Agent-Based Techniques for Simulating Social and Ecological Processes; Oxford University Press: New York, NY, USA, 2002; pp. 171–189. [Google Scholar]
Figure 1. Function zones of Beijing.
Sustainability 11 06298 g001
Figure 2. Land cover classification of Beijing in 2001 (a) and 2013 (b).
Sustainability 11 06298 g002
Figure 3. Synthetic land use dynamic index in different periods.
Sustainability 11 06298 g003
Figure 4. Trend for the coupling coordination degree in Beijing.
Sustainability 11 06298 g004
Figure 5. Urbanization (left) and eco-environment (right) levels of capital core zone.
Sustainability 11 06298 g005
Figure 6. Urbanization (a) and eco-environment (b) levels of urban function expansion zone.
Sustainability 11 06298 g006
Figure 7. Urbanization (a) and eco-environment (b) levels of urban developing zone.
Sustainability 11 06298 g007
Figure 8. Urbanization (a) and eco-environment (b) levels of eco-preservation zone.
Sustainability 11 06298 g008
Table 1. Data summary.
DataTimeFormat
Landsat5 TM2001.08.31–2003.09.17
2005.08.06–2007.08.28
2009.09.02–2011.08.26
Raster
Landsat8 OLI2013.09.01Raster
Administrative boundary2015Vector
Beijing Statistic Yearbook2001–2013Document
District Statistic Yearbook2001–2013Document
Beijing Environment Bulletin2001–2013Document
Google Earth Image2007Raster
Geographic Condition Monitoring data (Beijing–Tianjin–Hebei)2007/2015Vector
Table 2. Index system on urbanization and the eco-environment level and their weights.
Primary IndexFAFA1FA2FA3FA4Secondary IndexFAFA1FA2FA3FA4
Demographic urbanization0.330.360.350.310.30Population density (persons/km2)0.310.440.280.310.27
Percentage of non-agriculture households (%)0.290.100.270.300.27
Percentage of urban employed units (%)0.400.460.450.390.46
Spatial urbanization0.220.240.200.250.26Percentage of impervious surfaces (%)0.490.57550.410.43
Percentage of commercial housing among impervious surfaces (%)0.510.430.450.590.57
Economic urbanization0.280.250.290.290.29GDP per capita (Yuan)0.230.240.290.250.29
Average investment in fixed assets (100 million)0.280.290.260.310.23
Average industrial output (Yuan)0.220.250.200.200.30
Proportion of the added value of the tertiary industry to GDP (%)0.270.220.250.240.18
Social urbanization0.180.160.160.160.16Disposal income per capita (Yuan)0.230.260.290.220.22
Number of health institutions per 10, 000 people0.310.260.220.300.32
Average retail sales of consumer goods per capita (Yuan)0.280.270.260.280.28
Number of PCs per 100 households0.180.210.230.200.18
Eco-pressure0.29 0.31 0.30 0.25 0.27 Human disturbance index0.35 0.38 0.40 0.33 0.35
Percentage of impervious surfaces (%)0.30 0.29 0.23 0.33 0.31
Energy consumption per capita (t)0.39 0.37 0.41 0.38 0.38
Eco-status0.49 0.45 0.49 0.50 0.47 Percentage of forests (%)0.25 0.29 0.27 0.26 0.24
Percentage of grasslands (%)0.18 0.17 0.15 0.17 0.20
Habitat quality index0.30 0.31 0.32 0.30 0.30
Days for air quality better than the second level (days)0.27 0.25 0.27 0.27 0.28
Eco-response0.22 0.24 0.21 0.25 0.26 Growth rate of green areas (%)0.58 0.53 0.58 0.55 0.54
Decontamination rate of urban refuse (%)0.42 0.47 0.43 0.45 0.46
Note: In Table 2, the zones are represented as follows: FA: Beijing; FA1: capital core zone; FA2: functional expansion zone; FA3: urban developing zone; FA4: eco-preservation zone. The human disturbance index reflects the impact intensities of human activities [51]. The habitat quality index evaluates the quality of the eco-environment based on the land cover condition.
Table 3. Development stages of coupling coordination degree.
Primary Division Secondary Division Tertiary Division
Balanced development0.8 < D ≤ 1Superiorly balanced developmentg(E)–f(I) > 0.1Superiorly balanced development with urbization lagged
f(I)–g(E) > 0.1Superiorly balanced development with environment lagged
0 ≤ f(I)–g(E) ≤ 0.1Superiorly balanced development of urbanization and environment
Transitional development0.5 < D ≤ 0.8Basically balanced developmentg(E)–f(I) > 0.1Basically balanced development with urbanization lagged
f(I)–g(E) > 0.1Basically balanced development with environment lagged
0 ≤ f(I)–g(E) ≤ 0.1Basically balanced development of urbanization and environment
Imbalanced development0.3 < D ≤ 0.5Slightly imbalanced developmentg(E)–f(I) > 0.1Slightly imbalanced development with urbanization hindered
f(I)–g(E) > 0.1Slightly imbalanced development with environment hindered
0 ≤ f(I)–g(E) ≤ 0.1Slightly imbalanced development of urbanization and environment
0 <D ≤ 0.3Seriously imbalanced developmentg(E)–f(I) > 0.1Seriously imbalanced with urbanization hindered
f(I)–g(E) > 0.1Seriously imbalanced with environment hindered
0 ≤ f(I)–g(E) ≤ 0.1Serious imbalance of urbanization and environment
Table 4. Dynamic degree of land use in each functional zone from 2001 to 2013.
Dynamic IndexKLC
Land CoverForestsGrasslandsCultivated LandImpervious SurfacesBare LandWater-
Capital core zone0.320.920.00−0.070.00−0.160.11
Urban function expansion zone2.242.29−4.540.24−7.76−2.691.63
Urban developing zone0.793.87−2.262.65−5.27−1.521.39
Eco-preservation zone0.091.21−0.701.35−1.52−0.760.26
Where K is the single land use dynamic index, LC is the synthetic land use dynamic index.
Table 5. The degree of coupling coordination between urbanization and the eco-environment.
YearFAFA1FA2FA3FA4
2001BBBB-ELBB-ELSU-ULSU-UL
2003BBBB-ELBB-ELBB-ULBB-UL
2005BBBB-ELBB-ELBB-ULBB-UL
2007BBBB-ELBB-ELBBBB-UL
2009SBBB-ELBB-ELBBBB-UL
2011SBBB-ELBB-ELBBBB-UL
2013SB-ELBB-ELBB-ELBB-ELBB-UL
In Table 5, the zones are represented as follows: FA: Beijing; FA1: capital core zone; FA2: functional expansion zone; FA3: urban developing zone; FA4: eco-preservation zone. SB represents superiorly balanced development of urbanization and environment. SB-EL represents superiorly balanced development with environment lagged. BB represents basically balanced development of urbanization and environment. BB-UL represents basically balanced development with urbanization lagged. BB-EL represents basically balanced development with environment lagged. SU-UL represents slightly imbalanced development with urbanization lagged.

