Article

Consumption-Based Carbon Emissions of Tianjin Based on Multi-Scale Input–Output Analysis

1
School of Economics and Management, China University of Geosciences, Beijing 100083, China
2
Key Laboratory of Carrying Capacity Assessment for Resource and Environment, Ministry of Land and Resource, Beijing 100083, China
3
Huaxin Research Institute, Publishing House of Electronics Industry, Beijing 10036, China
4
Department of Civil, Environmental and Construction Engineering, University of Central Florida, Orlando, FL 32816, USA
*
Author to whom correspondence should be addressed.
Sustainability 2019, 11(22), 6270; https://doi.org/10.3390/su11226270
Submission received: 12 September 2019 / Revised: 26 October 2019 / Accepted: 1 November 2019 / Published: 8 November 2019
(This article belongs to the Section Sustainable Urban and Rural Development)

Abstract

:
Cities are a major source of carbon emissions and should play an important role in reducing carbon emissions. This study applies the method of multi-scale input–output analysis (MSIO) to analyze the consumption-based carbon emissions of Tianjin in 2012. This method can estimate the carbon emissions embodied in imported products. The results reveal that the production-based carbon emissions of Tianjin were 1.52 × 10⁸ tonnes CO2 in 2012, which had increased over 50% since 2007. Meanwhile, the consumption-based carbon emissions of Tianjin city were 2.55 × 10⁸ tonnes CO2, 1.71 times higher than those in 2007 and 1.67 times the amount of production-based carbon emissions in 2012. Regarding the total embodied carbon emissions involved in the Tianjin economy in 2012, about 6% were from foreign countries, over 60% were from other regions of China, and only one-third were territorial-based or production-based carbon emissions. Correspondingly, Tianjin respectively exported 11% and 34% of the total embodied carbon emissions to foreign countries and other regions in China, while over half were embodied in the local final demand. Tianjin was a carbon budget importer in domestic trade and an exporter in international trade in both 2007 and 2012. However, when both domestic and international trades are considered, Tianjin had shifted from a carbon budget exporter in 2007 to an importer in 2012. Since 2007, the carbon nexus between Tianjin and other regions in China had become much closer (carbon emissions embodied in domestic trade increased 103.47%), but the connection with foreign countries became looser (carbon emissions embodied in international trade decreased 21.96%). Compared to Beijing in 2012, it is evident that there were less carbon emission transfer issues for Tianjin city.

1. Introduction

Urbanization has developed rapidly in China since 1978. China’s urbanization rate increased from 17.92% in 1978 to 57.35% in 2016 [1]. The rapidly growing urban population brought in a lot of carbon emissions, which had increased 190% from 1996 to 2012 [2]. China’s target for carbon reduction is to decrease the carbon emissions per unit GDP by 60 to 65% of 2005 levels by 2030 [3]. In addition, the central government declared to reach peak carbon emissions by 2030. As one of China’s four directly controlled municipalities, Tianjin is a traditional industrial city and a major seaport in the north of China [4]. It is necessary to study Tianjin’s carbon emissions to help share its responsibility to achieve the goal of carbon reduction in China.
Recording the carbon emissions of a city and clarifying the responsibilities of carbon emissions are important criteria for reducing carbon emissions [5,6]. In earlier times, scholars were mainly concerned about the direct carbon emissions of a region originating from fossil fuel combustion, industrial process, and so on, i.e., the production-based carbon emissions under the Intergovernmental Panel on Climate Change (IPCC) guide [7,8,9]. Guo et al. applied the carbon emission coefficient of energy consumption recommended by the IPCC to analyze the carbon emissions of Tianjin during the period 1999–2009 [9]. In order to precisely distribute the responsibility, scholars began to pay attention to consumption-based carbon emissions a few years ago [6,10]. The main methods applied were single-regional input–output analysis (SRIO) [11] and multi-regional input-output analysis (MRIO) [4,12,13,14]. Mi et al. used the SRIO method to calculate the consumption-based carbon emissions of thirteen cities in China [6]. They concluded that the most developed cities tend to be consumption-based cities, which means that these cities not only lead to carbon emissions in their own territory but also promote emissions in other regions by means of domestic trade, such as Beijing, Shanghai, and Tianjin. In addition, production-based cities tend to become consumption-based cities as they undergo further socioeconomic development. The SRIO method requires a small amount of data, but some assumptions have to be made. For example, Chen et al. assumed that the embodied resources and emission intensities were equal to all commodities from the same industrial sectors, imported commodities had the same embodied resources and emission intensities as domestic ones, and storage from earlier years had the same embodied resources and emission intensities as productions from the current year in one of their SRIO studies [11]. Such assumptions will lead to deviations in calculating the carbon emissions of a city’s imports.
MRIO is superior to SRIO in the treatment of imported products [12]. It uses the multi-regional input–output table to carry out a comprehensive analysis of all regions simultaneously. It can accurately analyze the carbon emissions driven by the local final demand of an economy and can provide the spatial linkages of all sectors among all regions [14]. Based on an MRIO study of 30 Chinese provincial-level regions, Feng et al. found that consumptions in the four Chinese megacities (Beijing, Tianjin, Shanghai, and Chongqing) not only cause CO2 emissions within their own jurisdictional boundaries, but also make carbon exports to other regions via interregional supply chains [10]. Despite its solid theoretical basis, MRIO needs a huge amount of trade data among all sectors of all regions to support its use, which are hard to obtain for a single city [15].
The method of multi-scale input–output analysis (MSIO) has been proposed to calculate the carbon emissions of a region as a compromise of SRIO and MRIO [16,17,18]. MSIO can distinguish the differences between the embodied carbon emissions of local products and internationally/domestically imported products by using the average carbon emissions intensities for the world and national economies [16]. Compared to the SRIO method, it is more superior. Meanwhile, the MSIO method requires much less data than a complete MRIO analysis [18]. In the absence of accurate MRIO data for Chinese regions, the MSIO method is suitable for a Chinese city to calculate its consumption-based carbon emissions.
Based on the discussions above, this study applies the MSIO method to analyze the consumption-based carbon emissions of Tianjin. The carbon emissions’ results of Tianjin in 2012 are compared to those of Tianjin in 2007 and Beijing in 2012 [16]. Some strategies for reducing Tianjin’s carbon footprint are then proposed to achieve the goal of low-carbon development.

2. Methodology and Materials

2.1. Multi-Scale Input–Output (MSIO) Analysis

According to basic environmental input–output theory [19,20], the consumption-based carbon emissions (E) of Tianjin’s local final demand can be calculated as follows:
E = ε L X = ε L ( I A ) 1 Y .
where X is the diagonalized matrix of the output column vector in Tianjin’s input–output table. ( I A ) 1 is the Leontief inverse matrix, where Ι is an identity matrix and A is the technical coefficient matrix. Y represents final demand matrix. The vector ε L means the direct carbon emission coefficients of all sectors in traditional input–output analysis, which equals F X 1 . F represents the carbon emission vector emitted directly by local sectors, and X 1 is the inverse matrix of the diagonalized output matrix. In the MSIO method developed by Chen and his team [16,18,21,22], ε L was expanded to include coefficients that originate from external carbon emission imports as well (the detailed algorithm can be found in [16]). Therefore, Equation (1) can be rewritten into
E = ε L ( I A ) 1 Y = ( F X 1 + ε D Z D X 1 + ε M Z M X 1 ) ( I A ) 1 Y
L, D, and M are used to denote the local system of Tianjin, the domestic system, and the foreign system, respectively. ε D = [ ε 1 D , ε 2 D ε n D ] is a vector of embodied carbon emission intensities for domestically imported products from economic sectors of other Chinese regions. ε M = [ ε 1 M , ε 2 M ε n M ] is a vector of embodied carbon emission intensities for foreign-imported products from economic sectors of foreign countries. Z D and Z M are economic flow matrices of domestic imports and foreign imports that are used as the intermediate inputs of local economic sectors. It is indicated that the carbon emission intensity vector for the local product ( ε L ) includes not only the local direct carbon emission intensity ( F X 1 ), but also carbon emission intensities caused by domestic and international material imports ( ε D Z D X 1 and ε M Z M X 1 ). As long as the carbon emissions intensities of local products in Tianjin are multiplied by the corresponding economic flow, the carbon emissions transfer along with the flow can be obtained.

2.2. Data Sources

As illustrated in the last section, the data needed by the MSIO analysis of Tianjin are: (a) the local carbon emissions of Tianjin’s economy, which have been derived from China Emission Accounts and Datasets [23]; (b) the economic flow data of Tianjin, which have been obtained from the official input–output table of Tianjin [24] (the unit is Chinese Yuan, which is referred to as Yuan hereafter; the sectors are shown in Appendix A Table A1); (c) the embodied carbon emission intensity databases of the world (excluding China) and China, which have been cited from Shao et al. [16] (The corresponding sectors of Tianjin’s economic input–output sectors in the global and Chinese carbon emission intensity database are also shown in Appendix A Table A1). The official input–output table of Tianjin does not distinguish between foreign imports and domestic imports. The method in Shao et al. has been applied to obtain the domestic and foreign import matrices of Tianjin [16].

3. Results

3.1. Embodied Carbon Emissions Intensities of Tianjin in 2012

Embodied carbon emissions intensity is defined as the total carbon emissions driven per unit of product output. The embodied carbon emissions intensities of the world (except China), China, and Tianjin for 42 sectors in 2012 are illustrated in the Figure 1. The averaged embodied carbon emissions intensities of the world (except China), China, and Tianjin were 0.72, 2.05, and 1.96 tonnes CO2/104 Yuan, respectively. Tianjin’s average embodied carbon emissions intensity was a little lower than that of China, but nearly treble that of the world economy (except China), which suggests that Tianjin triggered much more carbon emissions than the world’s average level when outputting the same amount of value. Technological progress and economic growth usually lead to a decrease in the embodied carbon emissions intensity. While pursuing GDP growth, the government should also promote the development of low-carbon technologies.
The output-weighted embodied carbon emissions intensities of Tianjin’s 42 sectors in 2012 are shown in Figure 1, too. The sectors belonging to the second industry (from Sector 2 to Sector 30) have higher embodied carbon emission intensities than those of the other two industries. As a modern industrial city, Tianjin relies heavily on secondary industry. It has been reported that secondary industry had contributed over 50% of Tianjin’s total output in 2012 [25]. Therefore, it is important to develop low-carbon technologies for secondary industry to reduce the carbon emissions of Tianjin. Sector 25 (Electricity, Heat Production, and Supply) had the highest local carbon emissions intensity of 15.83 tonnes CO2/104 Yuan. Sector 27 (Water Production and Supply) ranked second with an embodied intensity of 6.99 tonnes CO2/104 Yuan. Chen et al. also found that energy- or resource-intensive industries had the highest carbon emission intensities in their study on Beijing 2007 [21]. The embodied carbon intensities of Sector 12 (Recycling), Sector 20 (Manufacture of Communication Equipment, Computer and Other Electronic Equipment), and Sector 30 (Transportation, Storage, Posts, and Telecommunications) are significantly magnified, indicating that these sectors are key industries to reduce Tianjin’s carbon emissions.

3.2. Carbon Emissions Embodied in the Local Final Demands of Tianjin in 2012

The production-based carbon emissions of Tianjin in 2012 were 1.52 × 10⁸ tonnes CO2. Among the 42 sectors, Sector 25 (Electricity, Heat Production, and Supply) ranked first with 7.58 × 10⁷ tonnes CO2 carbon emissions (49.90%), which was followed by Sector 14 (Metal Smelting and Rolling Processing) with 4.14 × 10⁷ tonnes CO2 carbon emissions (27.25%). The consumption-based carbon emissions embodied in the local final demands of Tianjin in 2012 were 2.55 × 10⁸ tonnes CO2, which was 1.67 times the production-based carbon emissions. Therefore, if the study only takes the production-based carbon emissions into consideration, it would lead to an underestimation of Tianjin’s carbon emission footprint.
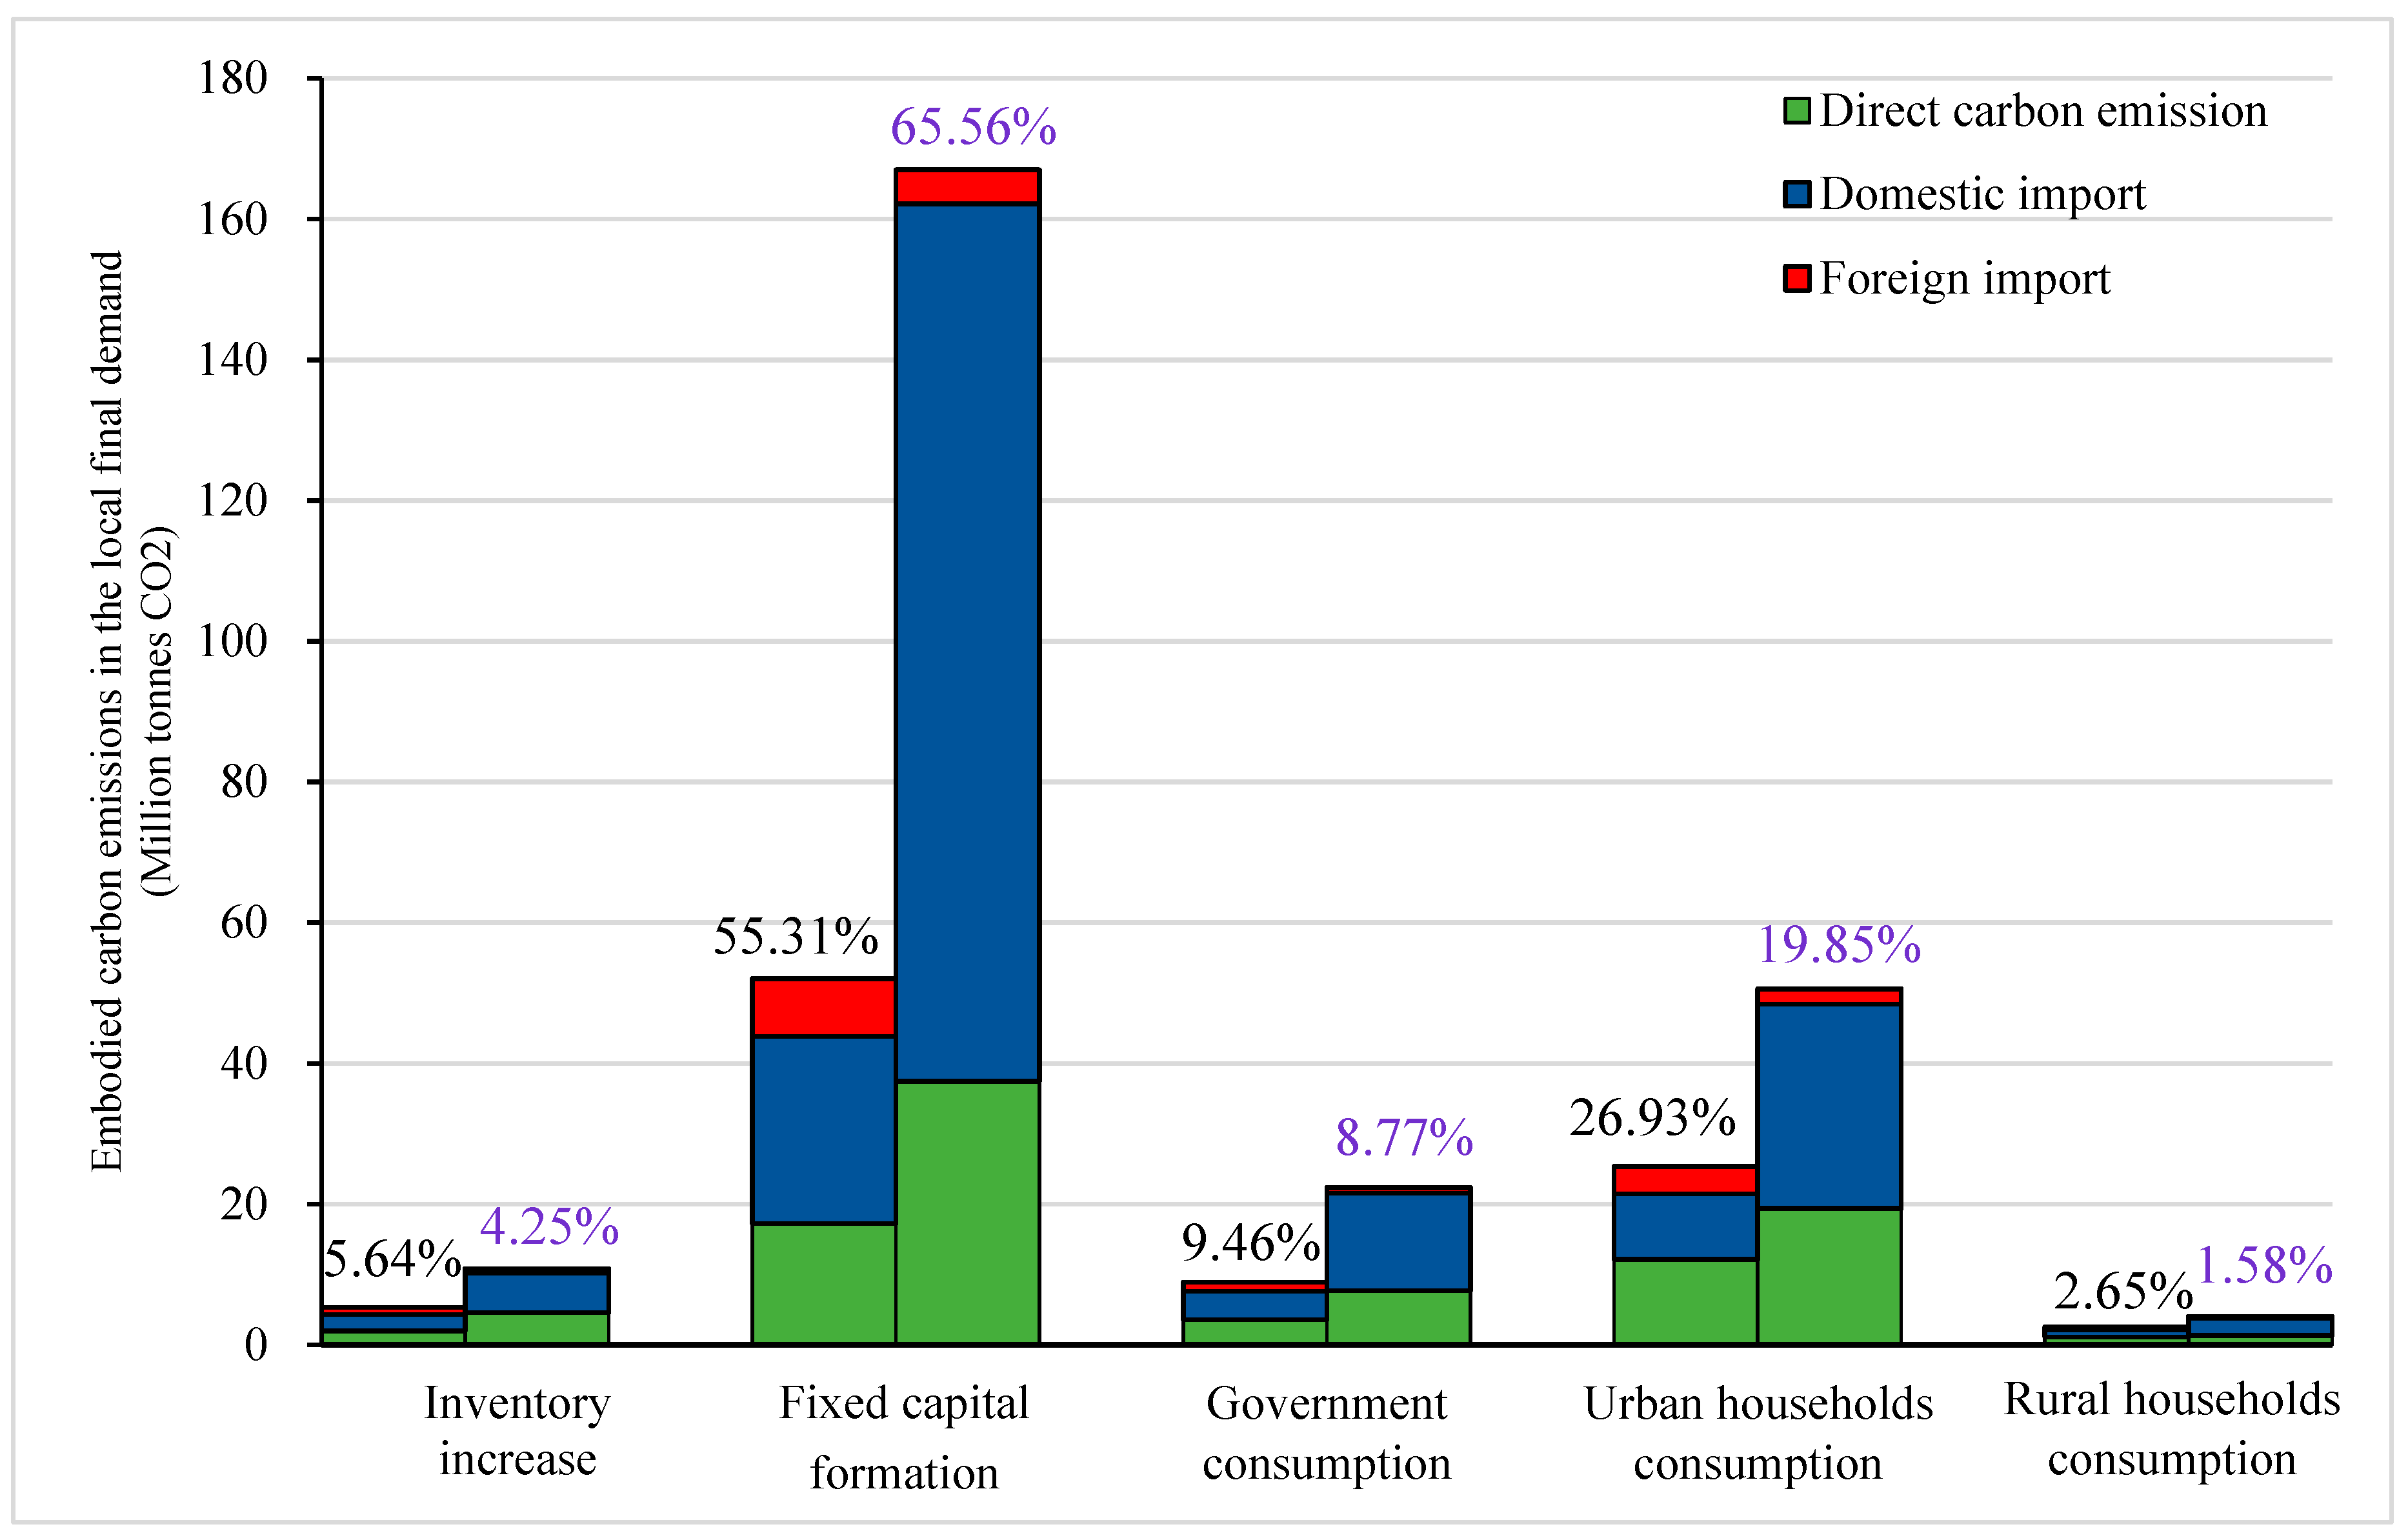
According to the input–output table, local final demands of Tianjin are divided into rural household consumption, urban household consumption, government consumption, fixed capital formation, and inventory increase, respectively. Their embodied carbon emissions are from three sources: direct carbon emission, domestic import, and foreign import. As is shown in Figure 2, the carbon emissions driven by gross fixed capital formation held the top proportion (65.56%), and urban household consumption ranked second (19.85%), followed by government consumption (8.77%), inventory increase (4.25%), and rural household consumption (1.58%). This is partially due to the rapid development of Tianjin’s city construction in 2012. Tianjin had put great efforts in developing Binhai New Area, where 135 major urban infrastructure projects were completed throughout the whole year [26].
In 2012, the urban population was 2.75 times larger than the rural population of Tianjin, and the per capita disposable income of urban residents was 2.19 times that of rural residents [1]. However, the ratio of carbon emissions embodied in urban household consumption to rural household consumption was as high as 12.56. It can be known that the residents in the urban area of Tianjin caused much more carbon emissions compared to people living in the rural area. Scholar Dhakal got a similar result in his research, showing that highly urbanized and economically important cities had merely 18% the population of China, but produced 41% of the GDP and contributed 40% of CO2 emissions in 2006 [27].

3.3. Carbon Emissions Embodied in Domestic and Foreign Trades of Tianjin in 2012

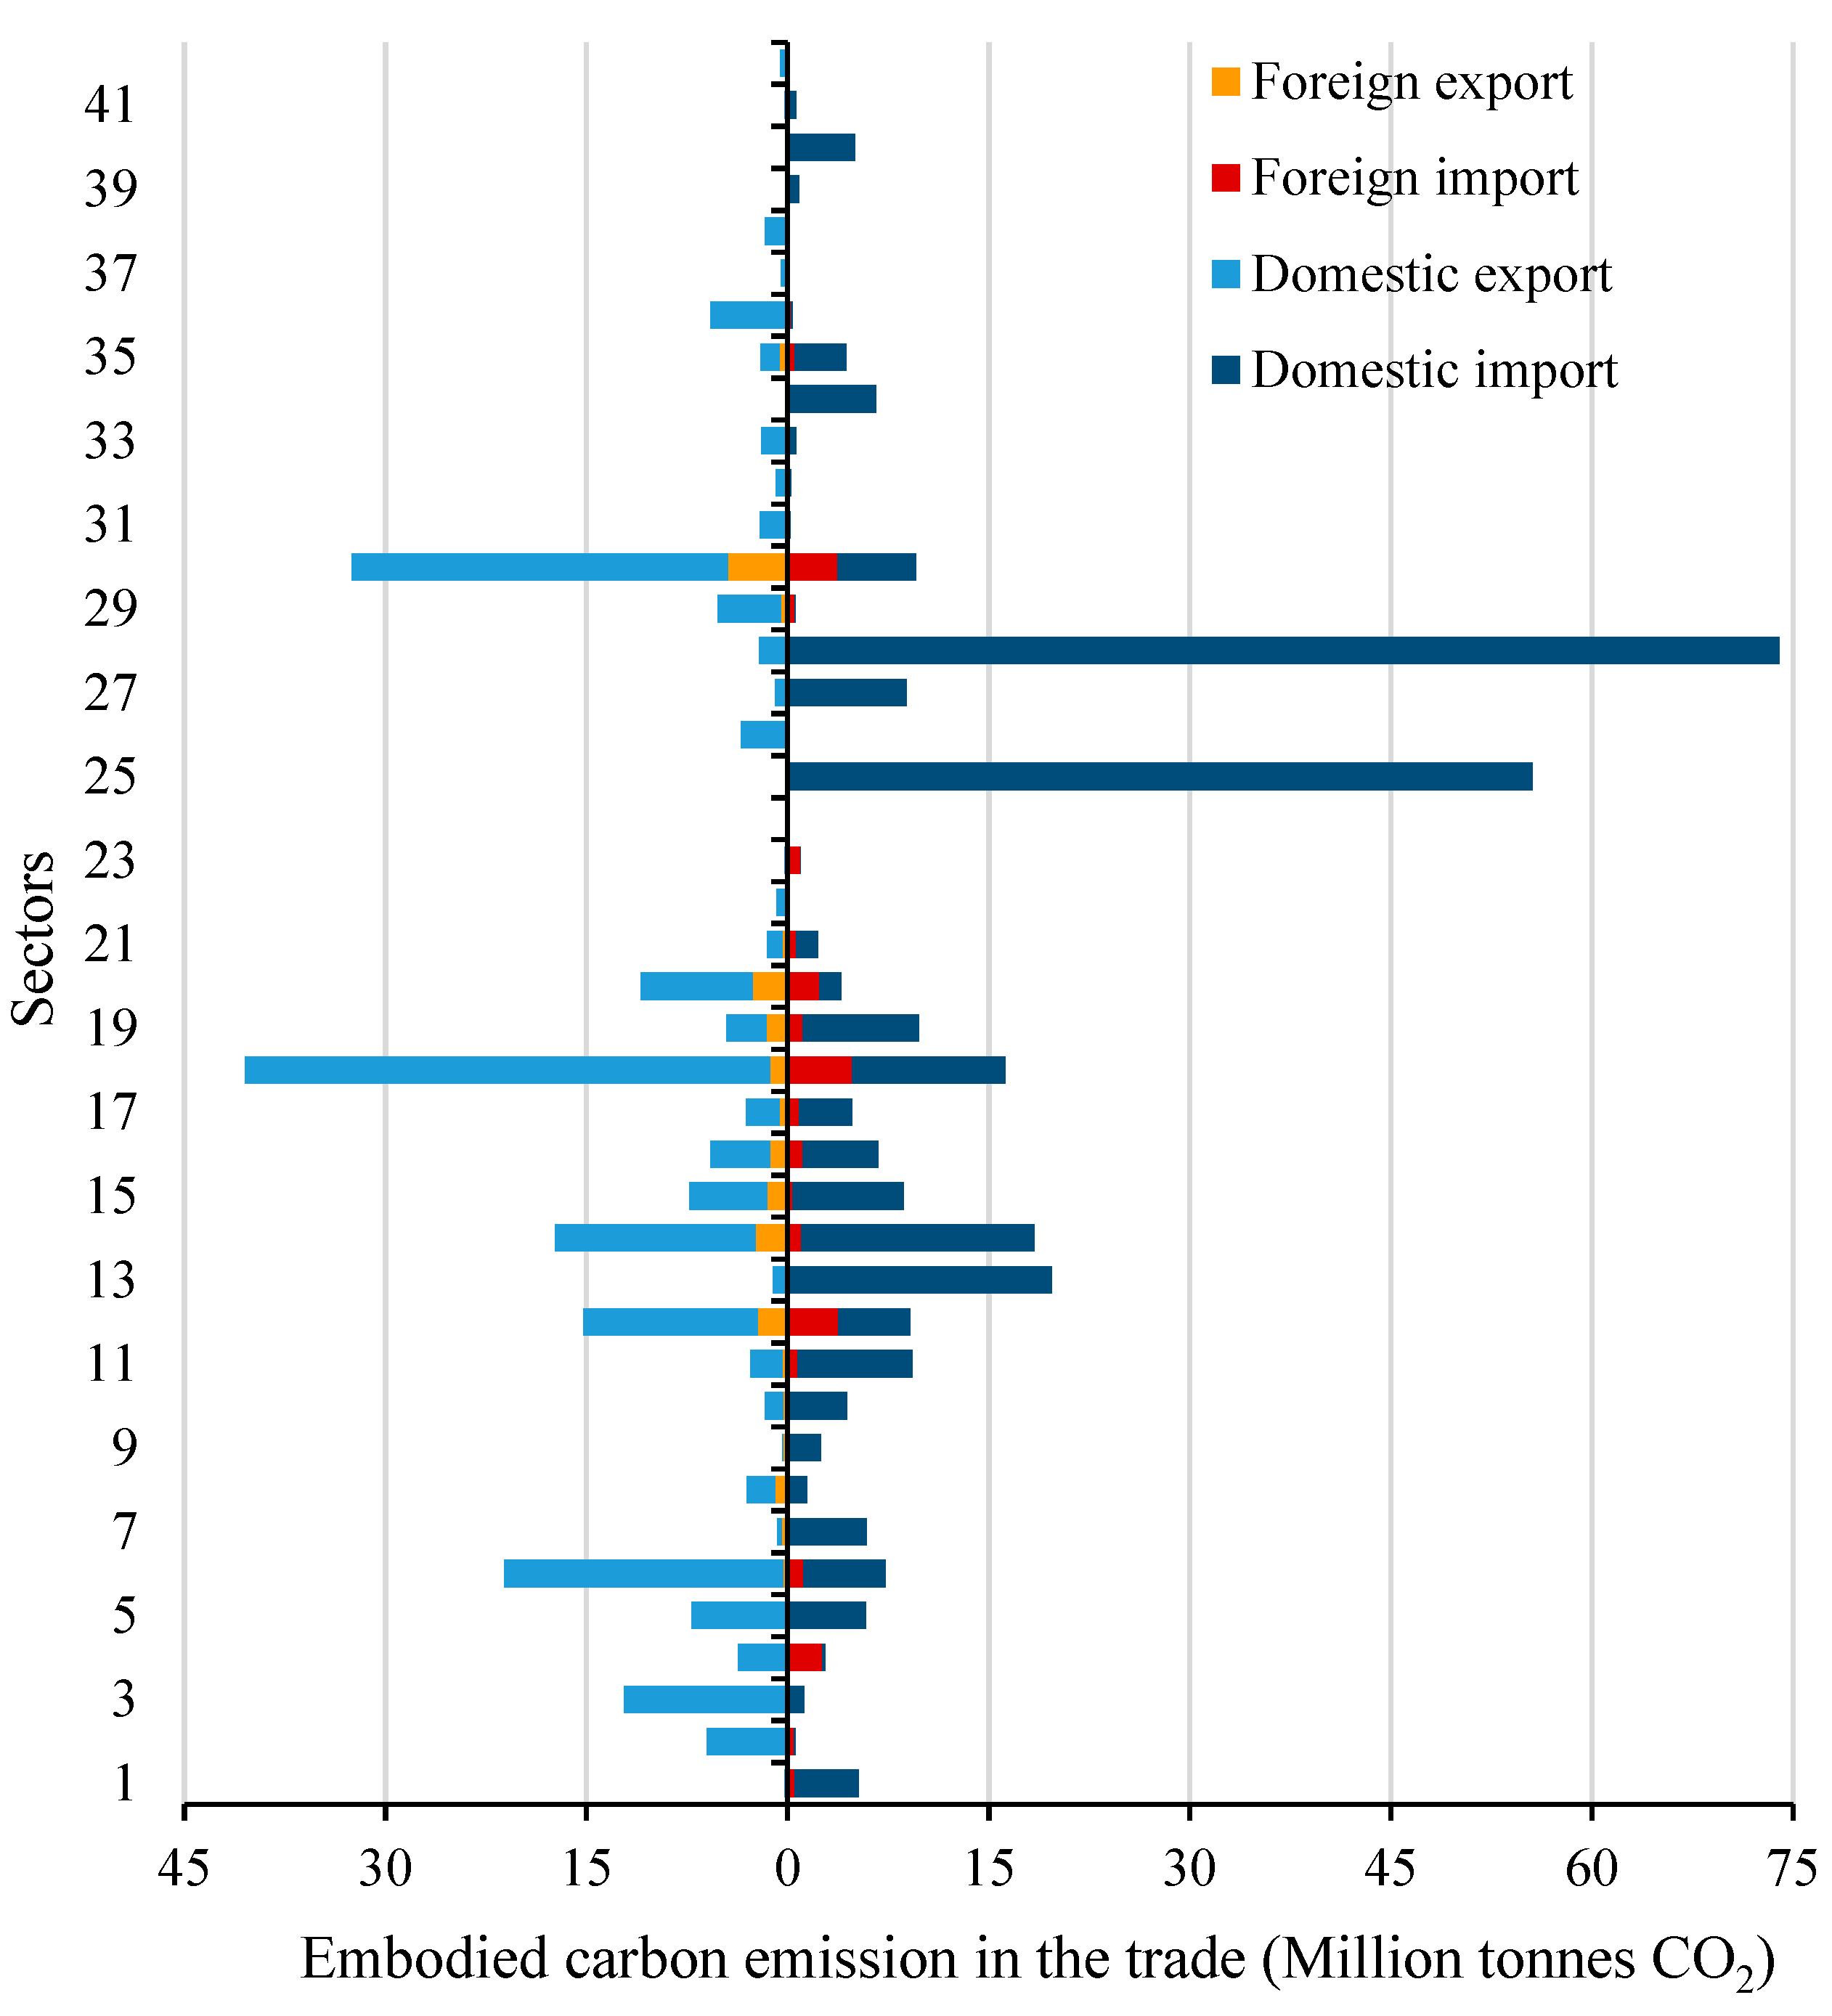
Figure 3 shows the carbon emissions imports and exports of 42 sectors of Tianjin in 2012. Tianjin was a net carbon budget exporter in international trade in 2012. The total foreign-imported carbon emissions were 2.87 × 10⁷ tonnes CO2, while the total foreign-exported carbon emissions were 5.27 × 10⁷ tonnes CO2. On the contrary, Tianjin was a carbon budget importer concerning domestic trade with other Chinese regions. In 2012, Tianjin domestically imported 2.87 × 10⁸ tonnes CO2 from other regions in China, but only exported 1.60 × 10⁸ tonnes CO2 to other Chinese regions.
Among 42 sectors, Sector 18 (Manufacture of Transport Equipment) had the largest foreign-exported and foreign-imported carbon emissions. At the same time, its domestic exports embodied the largest carbon emissions. Sector 30 (Transportation, Storage, Posts, and Telecommunications) also had a close carbon emission relationship with other regions, which ranked second in both domestic- exported and foreign-imported carbon emissions. Both Sectors 18 and 30 are transportation-related industries. Tianjin Port is China’s third largest port and one of the most important transportation hubs in northern China. Tianjin city undertakes many transportation tasks every year. In 2012, Tianjin had transferred over 280 million passengers and 477 million tonnes of cargo [28], which were accompanied by massive virtual carbon emission flows. As Tianjin becomes an important node in the Belt and Road Initiative, the carbon emissions trade of the transportation-related sector would be expected to increase. Sector 28 (Construction Industry) has domestically imported the most carbon emissions (7.39 × 10⁷ tonnes CO2) from other regions in China. Sector 25 (Electricity, Heat Production, and Supply) ranks second (5.56 × 10⁷ tonnes CO2). Tianjin has imported a large amount of electricity from Inner Mongolia, Shaanxi, and other western provinces through the national West–East Power Transmission Project, which triggered a large amount of carbon emissions transfer.

4. Discussions

4.1. Comparison of Embodied Carbon Emissions Flows of Tianjin in 2007 and 2012

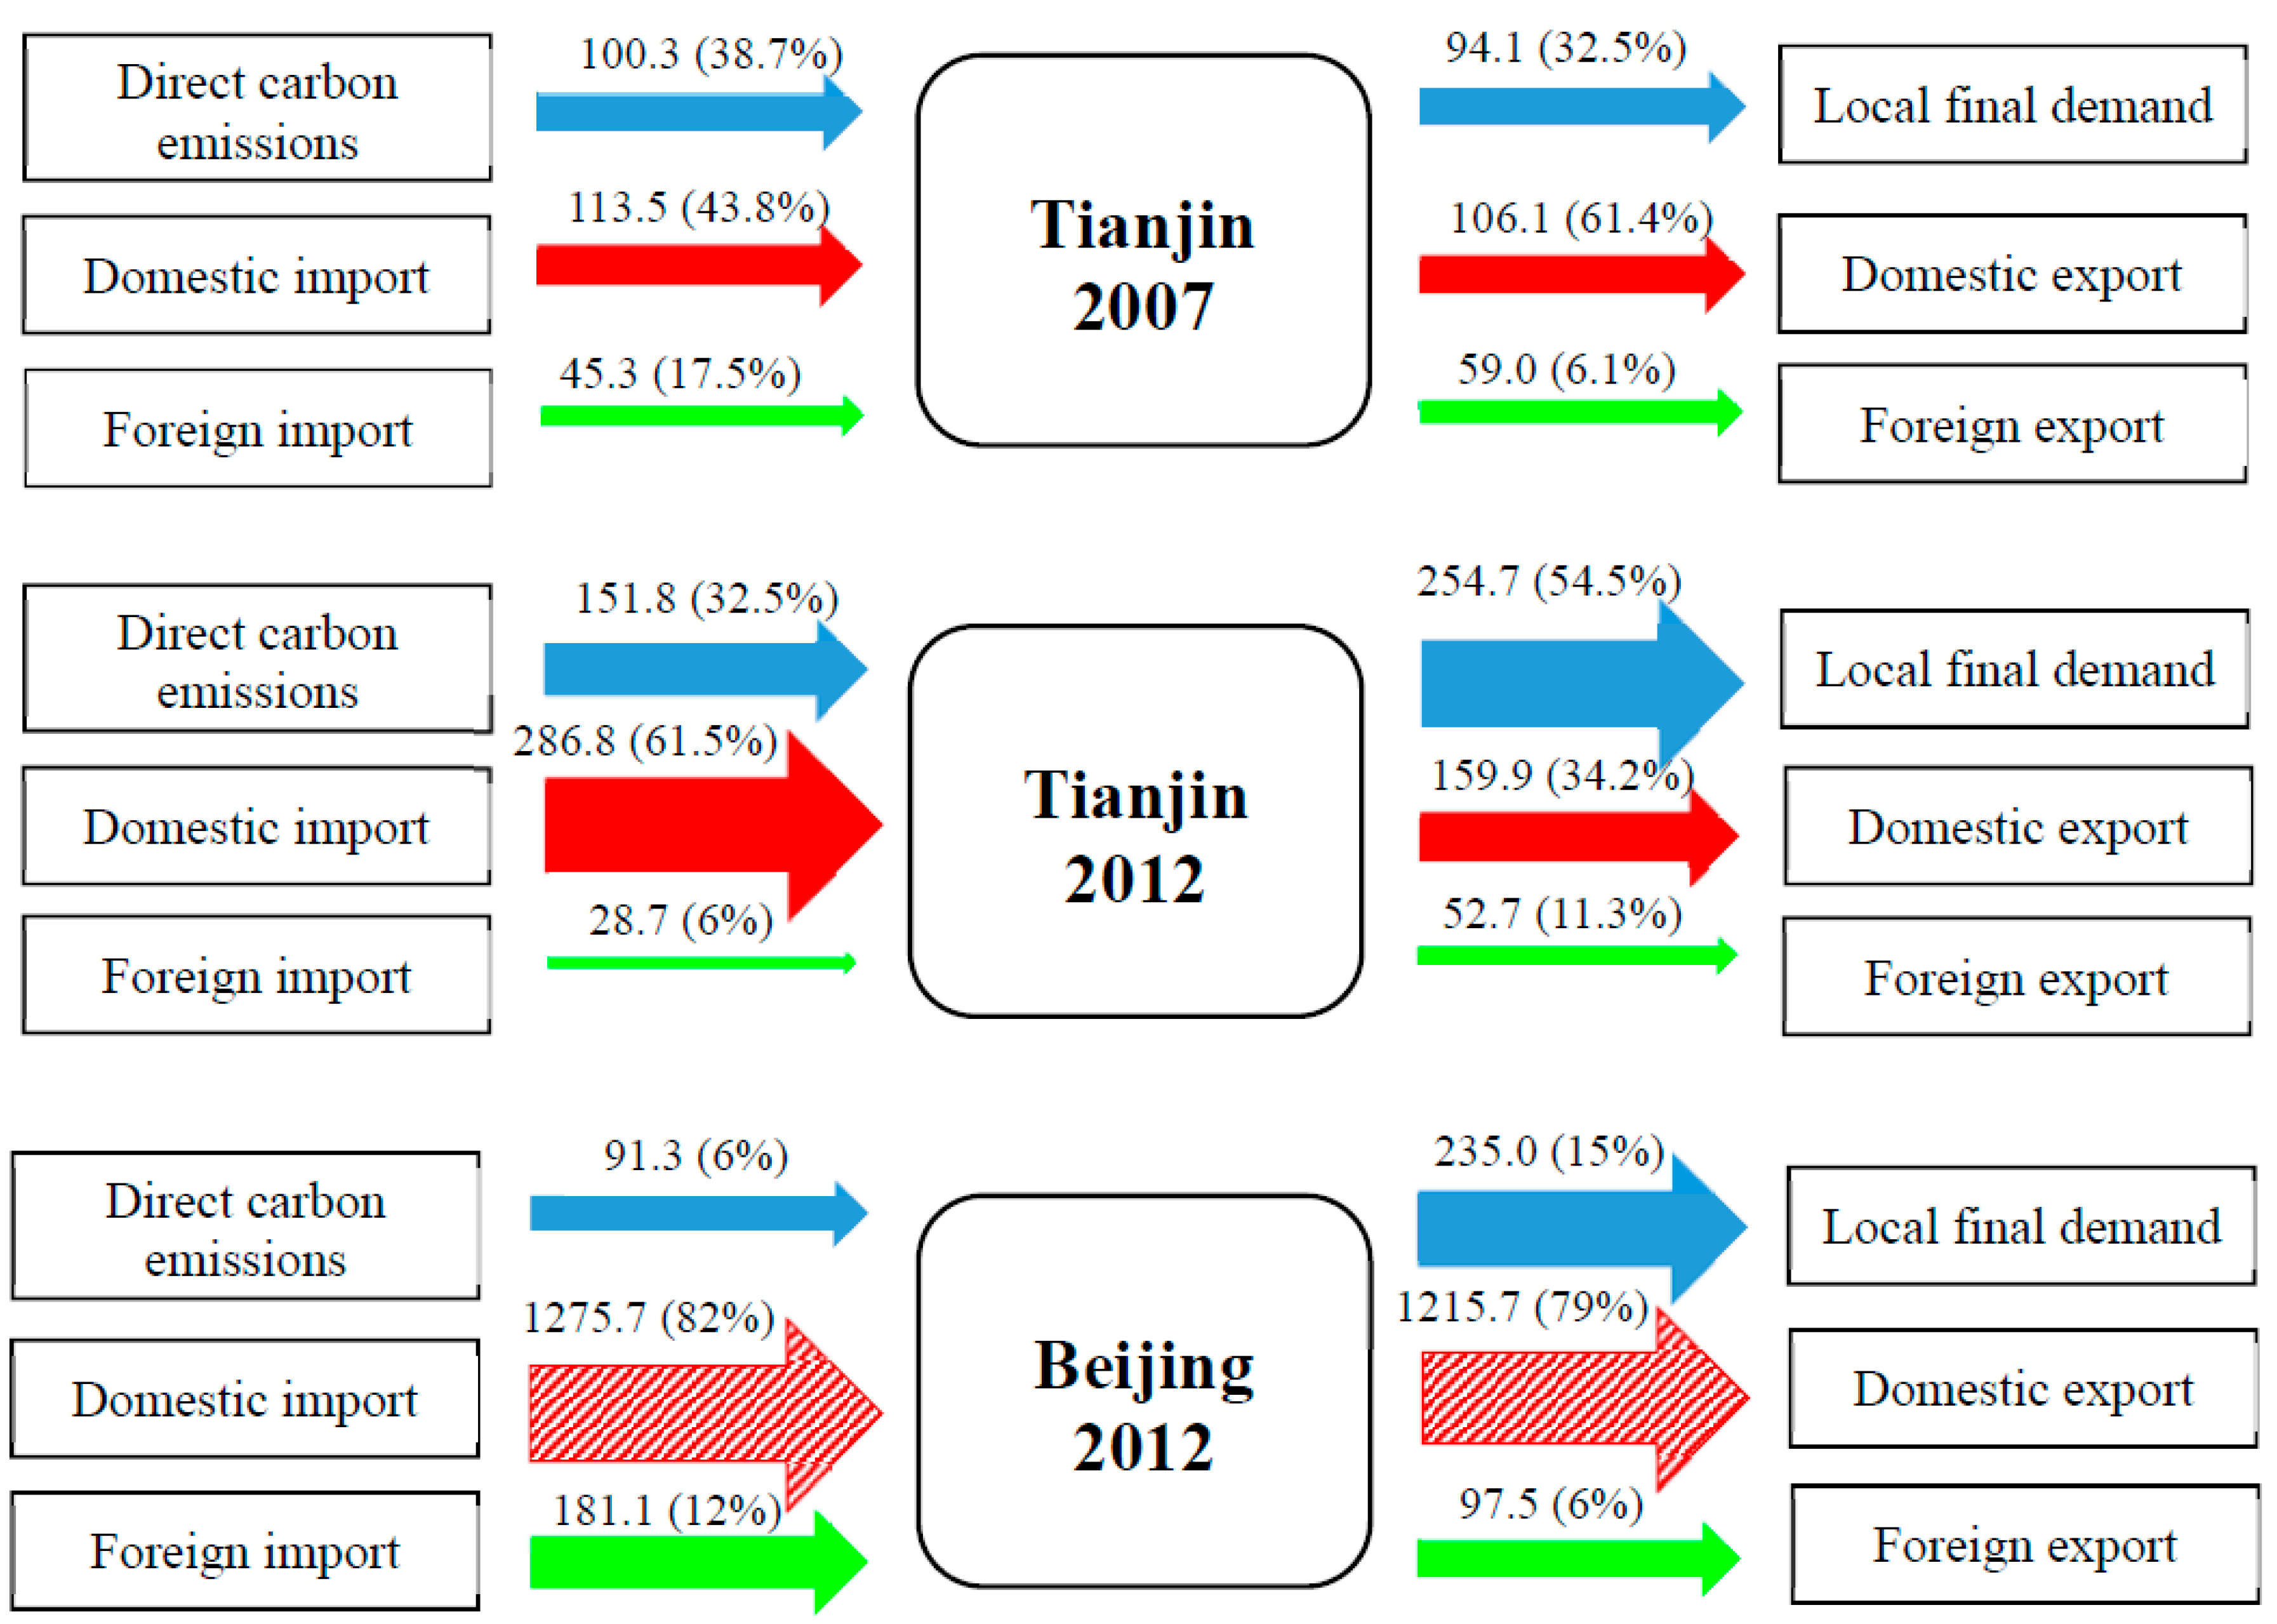
As shown in Figure 4, the production-based carbon emissions of Tianjin in 2012 had increased 51.37% since 2007 while the consumption-based carbon emissions had increased 170.78%. It is revealed that the consumption-based carbon emissions grew much faster than the production-based carbon emissions in Tianjin. The production-based carbon emissions of Tianjin (1.00 × 10⁸ tonnes CO2) were a little higher than the consumption-based carbon emissions (9.41 × 10⁷ tonnes CO2) in 2007. However, the consumption-based carbon emissions (2.55 × 10⁸ tonnes CO2) of Tianjin were 1.67 times the production-based carbon emissions (1.52 × 10⁸ tonnes CO2) in 2012. According to Mi et al.’s theory [6], Tianjin had become a consumption-based city.
As for carbon emissions embodied in local final demands of Tianjin (see Figure 2), the carbon emissions embodied in gross fixed capital formation in 2012 were 3.21 times as high as those in 2007. In 2012, Tianjin’s construction industry output and annual building construction area had increased by 275.10% and 48.07% since 2007, respectively. Meanwhile, Tianjin’s total fixed asset investment in 2012 was 3.71 times that in 2007. All these have contributed to the rapid increase in the embodied carbon emissions of gross fixed capital formation.
The carbon emissions embodied in urban household consumption and rural household consumption had increased by 99.54% and 60.76% during 2007–2012, respectively. Despite the growths in both Tianjin’s urban and rural households’ carbon footprints, the gap between per capita carbon emissions of urban households and rural households in Tianjin became even larger (from 3.71 to 7.14 tonnes CO2). China is promoting urbanization nationwide, and the urban population will be increasing fast in the near future. In addition, the Chinese government is trying their best to reduce the urban–rural gap through a series of favorable agricultural measures, and the living standards of rural residents are gradually improving. These would further enlarge the carbon footprint for Tianjin. Therefore, green lifestyle and energy-saving technology should be promoted in Tianjin to achieve low-carbon development.
The carbon emissions embodied in domestic trade were 2.20 × 10⁸ tonnes CO2 in 2007, which had increased by 103.47% by 2012. The carbon emissions embodied in international trade had decreased by 21.96% from 1.04 × 10⁸ tonnes CO2 in 2007 to 8.14 × 10⁷ tonnes CO2 in 2012. The results show that the carbon nexus between Tianjin and other regions in China became much closer and the carbon connection of Tianjin with other foreign countries became looser. Tianjin was a carbon budget importer in domestic trade and a carbon budget exporter in international trade in both 2007 and 2012. However, as for the total carbon emission trade, Tianjin has gone from a net exporter to a net importer. The carbon emissions embodied in the domestically imported trade of Tianjin in 2012 was 17.11 times those of 2007, indicating that Tianjin had transferred much more carbon emissions to other Chinese regions. Meanwhile, the carbon budget exported by Tianjin in 2012 had only increased by 75.67% since 2007, indicating that the fast-growing domestic carbon emission import was mainly driven by strong local consumption.

4.2. Comparison of Embodied Carbon Emissions Flows of Beijing and Tianjin in 2012

As Beijing is one of the most developed cities in China, a comparison is made between Beijing and Tianjin to see if Tianjin could learn something from Beijing (see Figure 4). The carbon emissions data of Beijing are from one of our previous studies [16]. The consumption-based carbon emissions of Beijing in 2012 were 2.35 × 10⁸ tonnes CO2, roughly the same as those of Tianjin (2.55 × 10⁸ tonnes CO2). However, Beijing’s consumption-based carbon emissions were 2.50 times the production-based carbon emissions, while the ratio in Tianjin was only 1.67. This shows that Beijing had more carbon emission transfer issues compared to Tianjin.
This paper has also compared the carbon emission inflows and outflows of Beijing and Tianjin in 2012. According to the results, the total carbon emissions related to Tianjin in 2012 were 4.67 × 10⁸ tonnes CO2. As for the carbon emissions inflows, the embodied carbon emissions from local, domestic-imported, and foreign-imported products were respectively sharing 32.49%, 61.37%, and 6.15% of total carbon emissions. For carbon emissions outflows, 54.51% were embodied in the local final demand, 34.22% were exported to other regions in China, and 11.27% were exported to other countries in the world. Direct carbon emissions from local sources in the inflows of Tianjin (1.52 × 10⁸ tonnes CO2) were 1.66 times those of Beijing (9.13 × 10⁷ tonnes CO2), which means that Tianjin had emitted more carbon emissions than Beijing during the production process. Beijing obviously had much larger embodied carbon emissions in domestic trade than Tianjin. The carbon emissions embodied in the domestically imported and exported trade of Beijing were 4.38 and 7.63 times those of Tianjin, respectively. This indicates that Beijing had a closer carbon relationship with other Chinese regions than Tianjin.

5. Conclusions

This work used the MSIO method to analyze the carbon emissions inflows and outflows of Tianjin in 2012 and compared the results to those of Tianjin in 2007. In 2007, Tianjin’s production-based carbon emissions were a little larger than its consumption-based carbon emissions. However, as the consumption-based carbon emissions grew much faster than the production-based carbon emissions since 2007, the consumption-based carbon emissions of Tianjin in 2012 were 1.67 times the production-based carbon emissions. As for the five kinds of local final demands of Tianjin, gross fixed capital formation contributed the most carbon emissions in both 2007 and 2012. The per capita carbon emissions of urban and rural households had increased by 87.88% (from 4.37 to 8.20 tonnes CO2) and 61.59% (from 0.66 to 1.07 tonnes CO2) during 2007–2012, respectively. It can be seen that the carbon emissions gap between urban and rural residents in Tianjin was very huge, which became even larger during 2007–2012.
In the total amount of carbon emissions related to Tianjin in 2012 (4.67 × 10⁸ tonnes CO2), 32.49% were from local emissions, and 61.37% and 6.15% carbon emissions were respectively from domestic imports and foreign imports. Approximately half of the total amount of CO2 had been embodied in the local final demand, one-third of carbon emissions were exported to other regions in China, and about 11% carbon emissions had been exported to other countries. By comparing to the results of Tianjin in 2007, the carbon nexus between Tianjin and other regions in China had become much closer, and the connection of Tianjin with other foreign countries became looser.
Although Tianjin was a carbon budget importer in domestic trade and a carbon budget exporter in international trade in both 2007 and 2012, carbon trades of Tianjin had changed significantly. The carbon emissions embodied in domestic imports and exports had respectively increased by 152.69% and 50.71%. As for foreign trades, internationally imported and exported carbon emissions had respectively decreased by 36.64% and 10.68%. Transportation and resources-related sectors such as Sector 30 (Transportation, Storage, Posts, and Telecommunications) and Sector 25 (Electricity, Heat Production, and Supply) had embodied large amounts of carbon emissions trade.
Tianjin plays an important role in integrating the Bohai Economic Belt and the Beijing–Tianjin–Hebei region. It is also projected as a key area in the Belt and Road Initiative. When compared to Beijing’s carbon flows in 2012, it can be seen that Beijing contacts more with other regions in China than Tianjin. Tianjin should seize the historical opportunity to expand communication with other Chinese regions and foreign countries. However, at the same time, Tianjin should pay attention to carbon emissions embodied in transportation-related industries and the virtual carbon emission transfer embodied in trade. To promote energy conservation and emission reduction technology or green transports in the transportation sector, increasing imports from economies with a low carbon emission intensity would be helpful to reduce Tianjin’s carbon footprint.

Author Contributions

All authors make significant contributions to this article. Methodology, L.S.; Formal analysis, P.X., L.S., Z.W. (Zijun Wei) and Z.W. (Zi Wu); Data curation, P.X., Z.G. and M.G.; Writing-original draft preparation, P.X.; Writing-review and editing, L.S.

Funding

This research was funded by the Natural Science Foundation of China, grant number 71503236; Social Science Foundation of Beijing, grant number 16LJC013; Fundamental Research Funds for the Central Universities, grant number 2652018249.

Conflicts of Interest

The authors declare no conflict of interest.

Appendix A

Table A1. Sectors in economic input–output table of Tianjin economy in 2012 and their corresponding sectors in global and Chinese carbon emission intensity database.
No.SectorCorresponding Sector in Global (Excluding China) and Chinese Carbon Emission Intensity Database
1Farming, Forestry, Animal Husbandry and Fishery1 (Agriculture)
2 (Fishing)
2Mining and Washing of Coal3 (Mining and Quarrying)
3Extraction of Petroleum and Natural Gas3
4Mining and Processing of Metal Ores3
5Mining and Processing of Nonmetal Ores and Other Ores3
6Manufacture of Foods and Tobacco4 (Food & Beverages)
7Manufacture of Textile5 (Textiles and Wearing Apparel)
8Manufacture of Textile Wearing Apparel, Footwear, Caps, Leather, Fur, Feather(Down) and Its products5
9Processing of Timbers and Manufacture of Furniture6 (Wood and Paper)
10Papermaking, Printing and Manufacture of Articles for Culture, Education and Sports Activities6
11Processing of Petroleum, Coking, Processing of Nuclear Fuel7 (Petroleum, Chemical and Non-Metallic Mineral Products)
12Chemical Industry7
13Manufacture of Nonmetallic Mineral Products7
14Smelting and Rolling of Metals8 (Metal Products)
15Manufacture of Metal Products8
16Manufacture of General Purpose Machinery11 (Other Manufacturing)
17Manufacture of Special Purpose Machinery11
18Manufacture of Transport Equipment10 (Transport Equipment)
19Manufacture of Electrical Machinery and Equipment9 (Electrical and Machinery)
20Manufacture of Communication Equipment, Computer and Other Electronic Equipment9
21Manufacture of measuring instrument and meter11
22Other manufacturing11
23Scrap and Waste12 (Recycling)
24Repair of fabricated metal products, machinery and equipment15 (Maintenance and Repair)
25Production and Supply of Electric Power and Heat Power13 (Electricity, Gas and Water)
26Production and Distribution of Gas13
27Production and Distribution of Water13
28Construction14 (Construction)
29Wholesale and Retail Trades16 (Wholesale Trade)
17 (Retail Trade)
30Transportation, Storage, Posts and Telecommunications19 (Transport)
31Hotels and Catering Services18 (Hotels and Restaurants)
32Information transmission, software and information technology services20 (Post and Telecommunications)
33Finance21 (Financial Intermediation and Business Activities)
34Real Estate Trade21
35Tenancy and Commercial Services21
36Scientific research and development, technical services23 (Education, Health and Other Services)
37Water, Environment and Municipal Engineering Conservancy23
38Resident services, repair and other services24 (Private Households)
39Education23
40Health care and social works23
41Culture, Art, Sports and Recreation23
42Public administration, social security and social organizations22 (Public Administration)

References

  1. National Bureau of Statistics China (NBSC). Available online: http://data.stats.gov.cn/easyquery.htm?cn=C01&zb=A0301&sj=2016 (accessed on 24 October 2019).
  2. Jiang, J. China’s urban residential carbon emission and energy efficiency policy. Energy 2016, 109, 866–875. [Google Scholar] [CrossRef]
  3. Department of Climate Change, National Development and Reform Commission, People’s Republic of China. Enhanced Actions on Climate Change: China’s Intended Nationally Determined Contributions; Department of Climate Change, National Development and Reform Commission, People’s Republic of China: Beijing, China, 2015. (In Chinese)
  4. Zhang, B.; Qiao, H.; Chen, B. Embodied energy uses by China’s four municipalities: A study based on multi-regional input–output model. Ecol. Model. 2015, 318, 138–149. [Google Scholar] [CrossRef]
  5. Shao, L.; Li, Y.; Feng, K.; Meng, J.; Shan, Y.; Guan, D. Carbon emission imbalances and the structural paths of Chinese regions. Appl. Energy 2018, 215, 396–404. [Google Scholar] [CrossRef] [Green Version]
  6. Mi, Z.; Zhang, Y.; Guan, D.; Shan, Y.; Liu, Z.; Cong, R.; Yuan, X.-C.; Wei, Y.-M. Consumption-based emission accounting for Chinese cities. Appl. Energy 2016, 184, 1073–1081. [Google Scholar] [CrossRef] [Green Version]
  7. Zhang, L.X.; Wang, C.B.; Yang, Z.F.; Chen, B. Carbon emissions from energy combustion in rural China. Procedia Environ. Sci. 2010, 2, 980–989. [Google Scholar] [CrossRef] [Green Version]
  8. Shao, L.; Chen, B.; Gan, L. Production-based and Consumption-based Carbon Emissions of Beijing: Trend and Features. Energy Procedia 2016, 104, 171–176. [Google Scholar] [CrossRef]
  9. Guo, C.X.; Shao, C.F.; Ju, M.T. Carbon emission accounting and decomposition analysis of energy consumption in the industrial sub-sectors of Tianjin City. Res. Environ. Sci. 2012, 25, 232–239. (In Chinese) [Google Scholar]
  10. Feng, K.; Hubacek, K.; Sun, L.; Liu, Z. Consumption-based CO2 accounting of China’s megacities: The case of Beijing, Tianjin, Shanghai and Chongqing. Ecol. Indic. 2014, 47, 26–31. [Google Scholar] [CrossRef]
  11. Chen, Z.M.; Chen, G.Q.; Zhou, J.B.; Jiang, M.M.; Chen, B. Ecological input–output modeling for embodied resources and emissions in Chinese economy 2005. Commun. Nonlinear Sci. Numer. Simul. 2010, 15, 1942–1965. [Google Scholar] [CrossRef]
  12. Su, B.; Ang, B.W. Multi-region input–output analysis of CO2 emissions embodied in trade: The feedback effects. Ecol. Econ. 2011, 71, 42–53. [Google Scholar] [CrossRef]
  13. Ward, H.; Burger, M.; Chang, Y.-J.; Fürstmann, P.; Neugebauer, S.; Radebach, A.; Sproesser, G.; Pittner, A.; Rethmeier, M.; Uhlmann, E.; et al. Assessing carbon dioxide emission reduction potentials of improved manufacturing processes using multiregional input output frameworks. J. Clean. Prod. 2017, 163, 154–165. [Google Scholar] [CrossRef] [Green Version]
  14. Wiedmann, T. A review of recent multi-region input–output models used for consumption-based emission and resource accounting. Ecol. Econ. 2009, 69, 211–222. [Google Scholar] [CrossRef]
  15. Wiedmann, T.; Wilting, H.C.; Lenzen, M.; Lutter, S.; Palm, V. Quo Vadis MRIO? Methodological, data and institutional requirements for multi-region input–output analysis. Ecol. Econ. 2011, 70, 1937–1945. [Google Scholar] [CrossRef]
  16. Shao, L.; Guan, D.; Zhang, N.; Shan, Y.; Chen, G.Q. Carbon emissions from fossil fuel consumption of Beijing in 2012. Environ. Res. Lett. 2016, 11, 114028. [Google Scholar] [CrossRef] [Green Version]
  17. Chen, G.; Chen, H.; Chen, Z.; Zhang, B.; Shao, L.; Guo, S.; Zhou, S.; Jiang, M. Low-carbon building assessment and multi-scale input–output analysis. Commun. Nonlinear Sci. Numer. Simul. 2011, 16, 583–595. [Google Scholar] [CrossRef]
  18. Shao, L.; Guan, D.; Wu, Z.; Wang, P.; Chen, G.Q. Multi-scale input-output analysis of consumption-based water resources: Method and application. J. Clean. Prod. 2017, 164, 338–346. [Google Scholar] [CrossRef] [Green Version]
  19. Leontief, W. Quantitative Input-Output Relations in the Economic System of the United States. Rev. Econ. Stat. 1936, 18, 105–125. [Google Scholar] [CrossRef]
  20. Miller, R.E.; Blair, P. Input-Output Analysis: Foundations and Extensions; Cambridge University Press: Cambridge, UK, 1985. [Google Scholar]
  21. Chen, G.Q.; Guo, S.; Shao, L.; Li, J.S.; Chen, Z.-M. Three-scale input–output modeling for urban economy: Carbon emission by Beijing 2007. Commun. Nonlinear Sci. Numer. Simul. 2013, 18, 2493–2506. [Google Scholar] [CrossRef]
  22. Guo, S.; Chen, G. Multi-scale input-output analysis for multiple responsibility entities: Carbon emission by urban economy in Beijing 2007. J. Environ. Account. Manag. 2013, 1, 43–54. [Google Scholar] [CrossRef]
  23. China Emissions Accounts and Datasets. Available online: http://www.ceads.net/data/inventory-by-sectoral-approach/ (accessed on 24 October 2017).
  24. Input-Output Table 2012 in China; Beijing, China Statistical Publishing House: Beijing, China, 2012. (In Chinese)
  25. Tianjin Statistical Yearbook 2013; Tianjin bureau of statistics: Tianjin, China; Beijing, China Statistical Publishing House: Beijing, China, 2013. (In Chinese)
  26. Statistical Communique of National Economic and Social Development of Tianjin Binhai New Area in 2012; Binhai New Area People’s Government: Tianjin, China, 2012; (In Chinese). Available online: http://www.tjbh.gov.cn/contents/468/45631.html (accessed on 24 October 2018).
  27. Dhakal, S. Urban energy use and carbon emissions from cities in China and policy implications. Energy Policy 2009, 37, 4208–4219. [Google Scholar] [CrossRef]
  28. Statistical Communique of the National Economic and Social Development of Tianjin in 2012; Tianjin Statistics Bureau & National Bureau of Statistics Tianjin Survey Corps: Tianjin, China, 2013. (In Chinese)
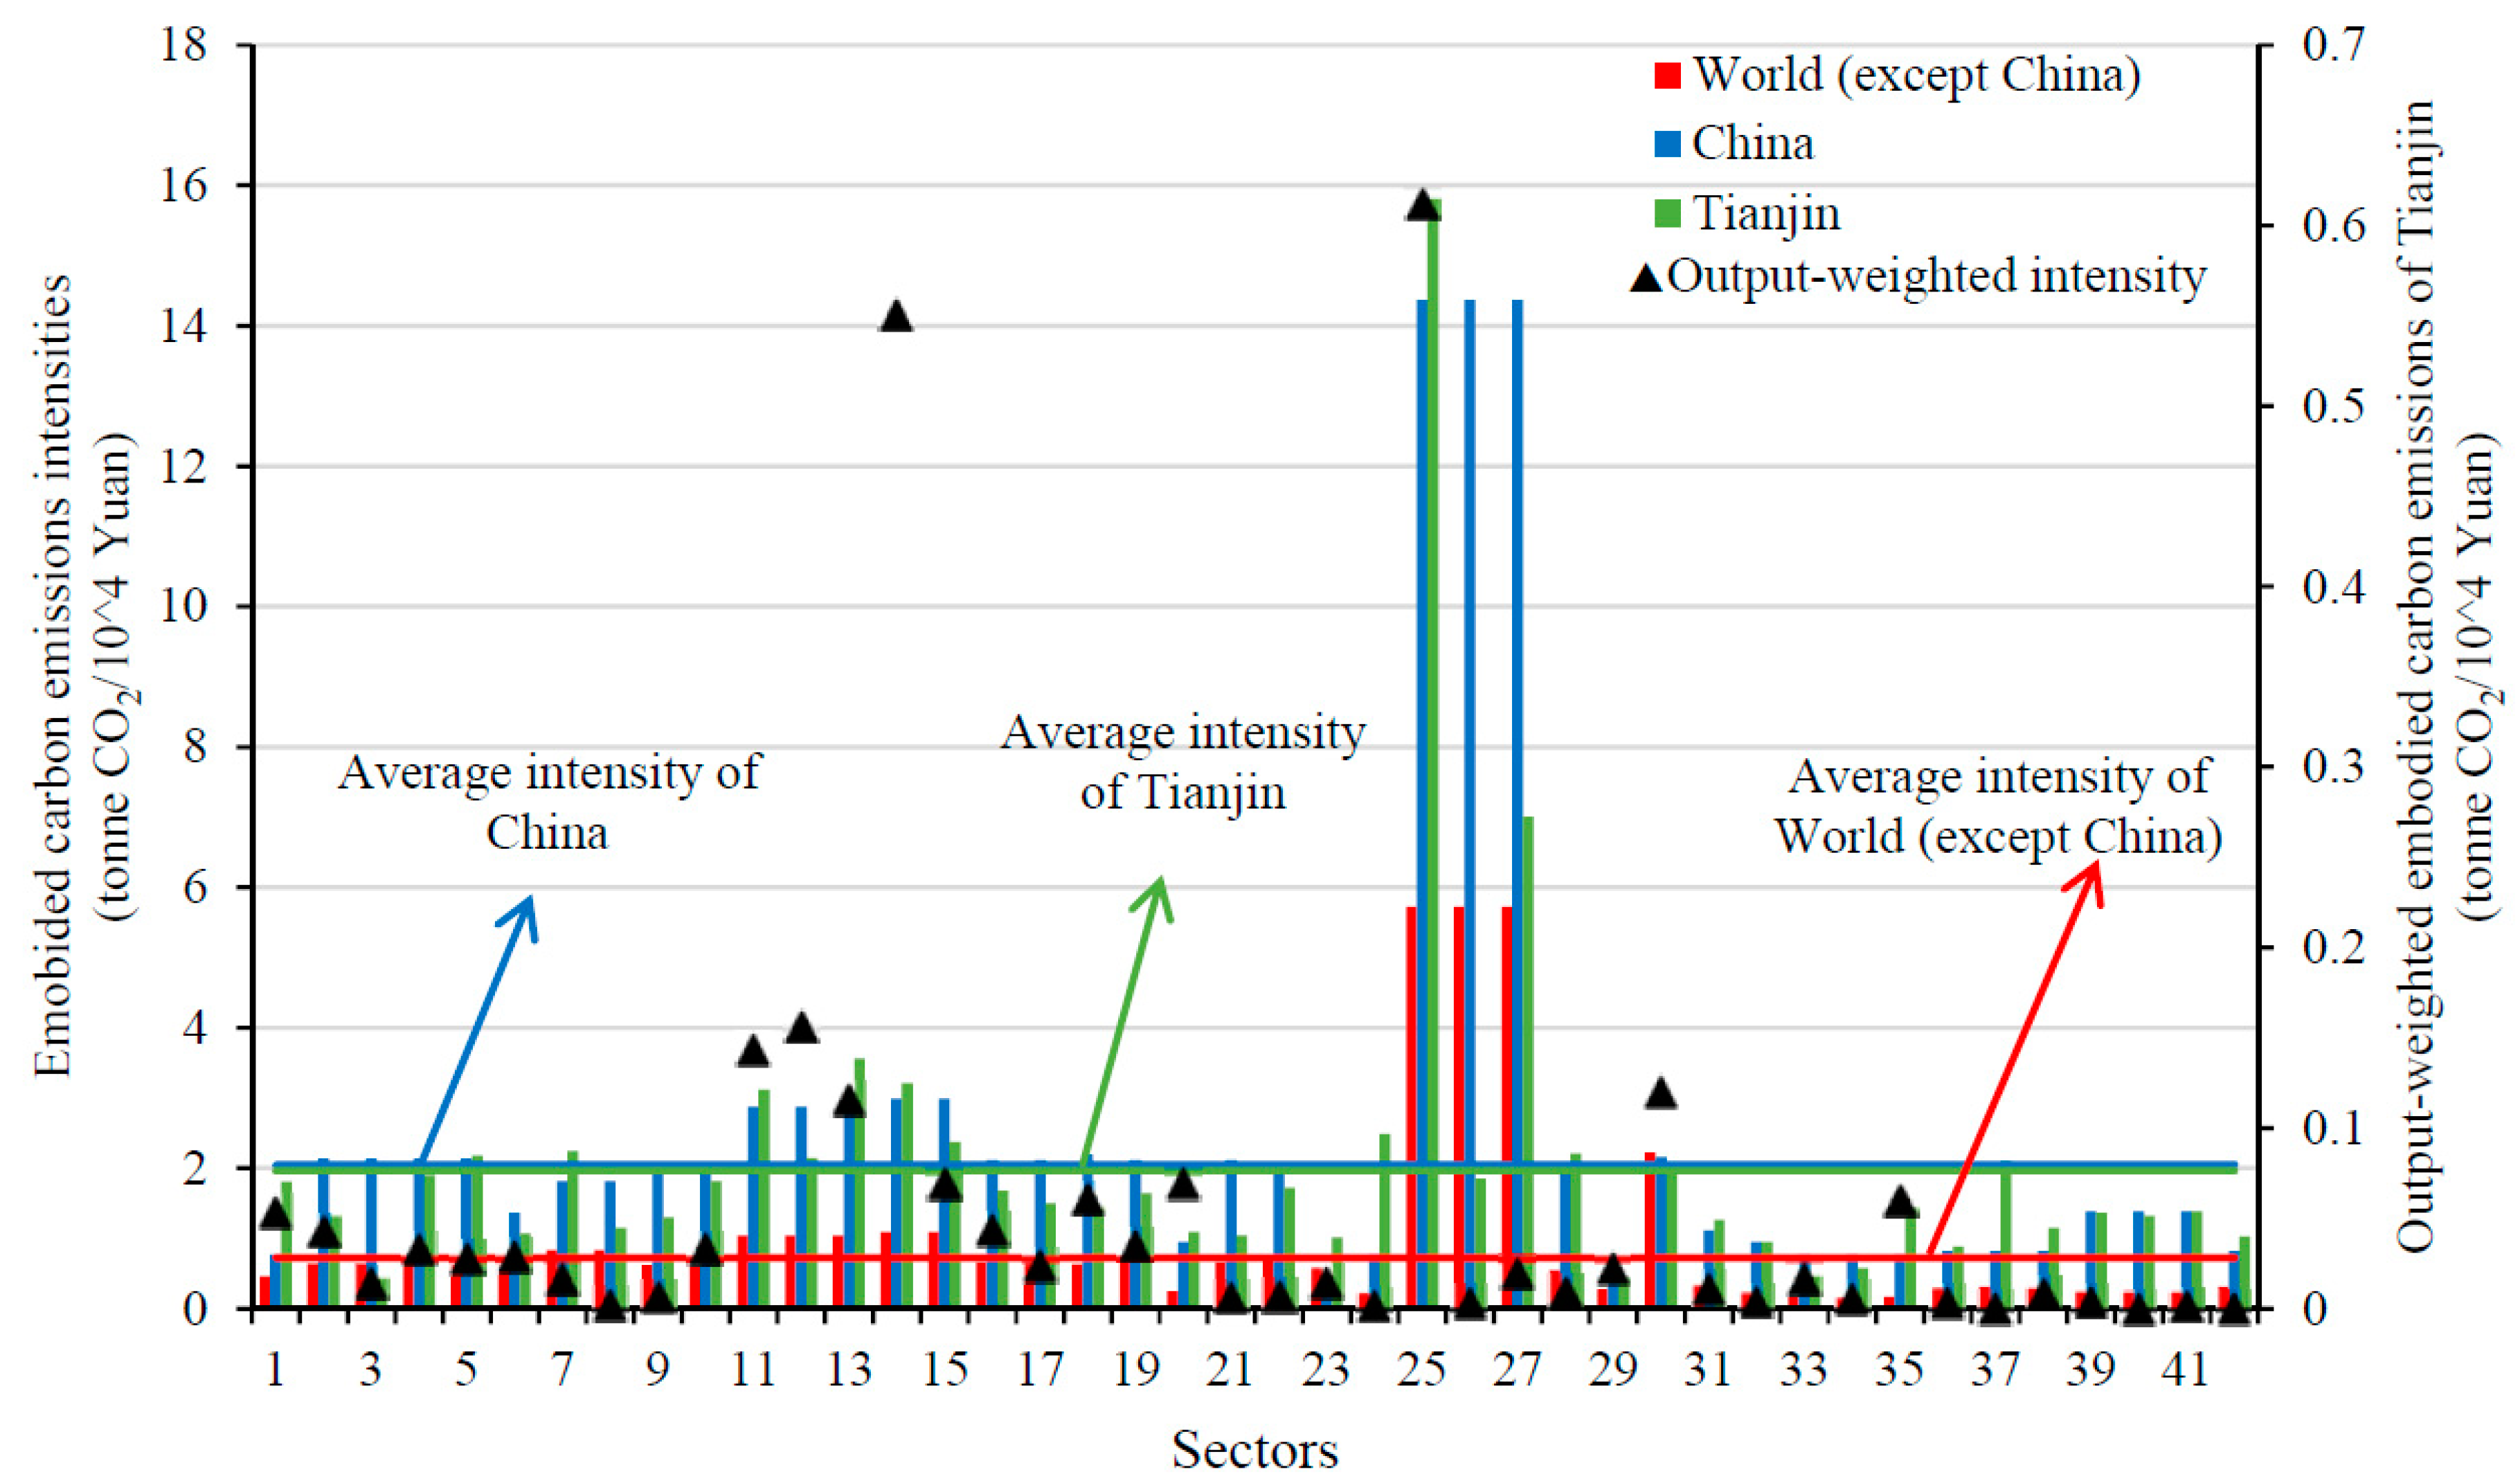
Figure 1. Embodied carbon emissions intensities of the world (except China), China, and Tianjin in 2012 (the names for 42 sectors can be found in Appendix A Table A1).
Sustainability 11 06270 g001
Figure 2. Embodied carbon emissions in local final demands of Tianjin in 2007 (left column) and in 2012 (right column).
Sustainability 11 06270 g002
Figure 3. Embodied carbon emissions in the trade of Tianjin in 2012.
Sustainability 11 06270 g003
Figure 4. Tianjin’s and Beijing’s carbon emission flows in 2007 and 2012 (units: million tonnes CO2; percentages in parentheses represent the proportions of total inflow or outflow; the values of carbon emissions embodied in the domestic import and export of Beijing 2012 were much larger than the others and could not be presented according to the scale, which are schematically indicated by shaded arrows).
Sustainability 11 06270 g004