Article

Somatotype, BMI, and Sexual Dimorphism in Adolescent School Sports Players in Peru

by
Marta Linares-Manrique
1,
Damaris Hernández-Gallardo
2,
Ricardo Arencibia-Moreno
3,
Miguel Rojas-Cabrera
4,
Julio Macedo-Figueroa
4 and
Daniel Linares-Girela
5,*
1
Departamento de Enfermería, Facultad de Ciencias de la Salud de Melilla, Universidad de Granada, Granada 52071, Spain
2
Facultad de Ciencias de la Educación, Universidad Laica Eloy Alfaro de Manabí, Manta 130802, Ecuador
3
Facultad de Ciencias de la Salud, Universidad Técnica de Manabí, Portoviejo 130108, Ecuador
4
Facultad de Ciencias de la Educación, Universidad Nacional José Faustino Sánchez Carrión, Huacho 15135, Peru
5
Laboratorio de Antropología Física, Facultad de Medicina. Universidad de Granada, Granada 18071, Spain
*
Author to whom correspondence should be addressed.
Sustainability 2019, 11(22), 6224; https://doi.org/10.3390/su11226224
Submission received: 30 September 2019 / Revised: 31 October 2019 / Accepted: 5 November 2019 / Published: 7 November 2019
(This article belongs to the Special Issue Education for Sustainability in Physical Education)

Abstract

:
Introduction and objectives (1): It is currently important to be able to establish logical plans for physical work and/or nutrition aimed at achieving optimal levels of performance and wellbeing. To achieve this, it is crucial to understand anthropometric data and how they relate to body type and, above all, how they associate with parameters linked to health. The present study, therefore, proposed to examine intersexual morphological differences and to determine the existing relationship between somatotype and BMI in a sample of school sports players from Huacho (Peru). Material and methods (2): A descriptive, comparative, correlational, and transversal study was delivered within a sample of 294 students (165 males and 129 females). Participants were aged between 12–16 years and regularly participated in team sports at competitive school level. All participants took part in the anthropometric examination in order to determine their somatotype and body mass index (BMI). Results (3): Significant differences were found to exist between the sexes in practically all of the anthropometric measures. The data demonstrated a high index of overweight and obesity. Further, the zones of occupation of the somatochart for both populations showed a displacement towards endomorphism, and that the level of typological similarity between populations was 30.54%. Conclusions (4): Results indicate a serious need for training so that adolescent students acquire healthy habits and lifestyles.

1. Introduction

Generally speaking, reviewing the main literature in relation to the study topic points to a scarcity of anthropometric studies carried out within adolescent school populations. The few studies that were found referred to aspects related to body composition and/or body mass index (BMI).
As has been noted by Lozano and collaborators [1], this type of work is very scarce in Peru, even when considering studies focused on the problem of obesity and overweight. When enquiring about somatotype, research studies were even more difficult to find, particularly those that refer to typological aspects in general populations in Peru [2]. The Latin American country Chile is highlighted as having produced the majority of relevant work [3,4,5]. This type of research is starting to emerge in other countries, but almost always, studies tend to refer to sportspeople from various specialities [6,7,8] or even to those who participate in artistic specialities [9]. In the majority of cases, these tend to be centred on older ages, with very few studies found using adolescents or younger children [10].
It is also important to indicate that although body mass index and somatotype are considered as two universally accepted indicators, and have shown associations in studies of growth and development, no studies examining Peruvian populations have been found that incorporate these elements. On the other hand, it should be noted that BMI is considered to be a simple and quick indicator for determining the nutritional status of an individual or population. Normally, this has been considered as an instrument for use almost exclusively within adults. This puts into doubt its effectiveness in studies of adolescent and child populations. Currently, the World Health Organisation (WHO) recommends that reference charts be developed and that BMI be utilised when studying adolescent populations [11].
Cabañas [12] points to somatotype as an indicator of health, given that it describes both the physical state and its variation over time, characterising structural changes throughout different life stages. Its use is also recommended for psychological studies. Further, other authors describe aspects of the somatotype that are not only related with sporting performance, but also with diseases linked to nutrition. For this reason it could be a useful instrument for disease detection [13].
In this sense, and keeping in mind what has previously been discussed, it is of vital importance to collect first order anthropometric data from different school populations. These data should refer to their typology and, above all, how these relate to parameters linked with health. This will enable logical work plans for physical work and/or nutrition to be established that are aimed at achieving optimal wellbeing levels.
Thus, the present study proposed, as its general research objective, an examination of the intersexual morphological differences. Further, it determined the existing relationship between somatotype elements and BMI in school sports players from Huacho (Peru).

2. Materials and Methods

2.1. Design

The present study was descriptive, transversal, comparative, and correlational in nature.

2.2. Participants

When determining the sample, the latest information published by the Ministry of Education of Peru was considered. This detailed that the secondary school population of Huacho comprised 6163 students. This was determined using a 5% error rate, 50% variability, and a confidence level greater than 92%. Finally, the participant sample was composed of a total of 294 individuals, of which 165 were male and 129 female, with self-reported ages of between 12 and 16 years. All students who participated in the study belonged to different schools or academic centres within the locality of Huacho, of which 5 of these centres were private, whilst 4 were public centres.
Students were randomly selected, the number of students in the locality was taken as a reference in order to recruit proportional numbers of males and females who were being schooled at private and public institutions and were regularly engaging in team sports at official school sport competitions at interschool level. Initial screening was used to eliminate students who were not of Peruvian descent or whose parents and grandparents were not natives of the province of Santa Maria, where the city of Huacho is located.
As general exclusion criteria, the presence of malformations or anatomical physiological illnesses was considered. In addition, individuals were excluded if their high obesity index led to insurmountable difficulties when taking certain anthropometric measurements.

2.3. Instruments

In order to evaluate the different anthropometric measurements of individuals participating in the present study, the following instruments were employed: weight (P) was determined using a SECA 869 flat weighing scale (SECA, Germany) with a precision of 100; contracted arm circumference (PB) and thigh circumference (PP) were measured with a Lufkin W606PM fixed measurement tape with the measurement unit set at millimetres (Lufkin, EE.UU.); size (T) was obtained by using a Siber–Hegner anthropometer (GPM, Suiza), with a precision of 0.1 cm; to measure the bicondylar diameter of the femur (DBiFem) and epicondylar humerus width (DBiHum), a curved Siber–Hegner compass (GPM, Suiza) was used with a precision of 1 mm; and for the adipose panicles of the triceps (PT), subscapular region (PSbE), supraspinal region (PSpE), and the thigh (PMP), a Holtain “Tanner/Whitehorse” (Holtain, United Kingdom) adipometer was used with 0.2 mm graduation and 10 gr/mm2 pressure. All of the measurements were taken from the left side of the body with the individual being measured being barefoot and dressed in as little clothing as possible.

2.4. Procedure

Prior to commencing the work, the research was approved by the ethical committee of the José Faustino Sánchez Carrión National University of Huacho. It counted on the participation of researchers at universities in Spain, Ecuador, and Peru. The research complied with all aspects of the Declaration of Helsinki in relation to work with human beings. Further, it received approval from the parents or guardians of the students for their participation in the study.
All variables were obtained following recommendations described by the International Society for the Advancement of Kinanthropometry (ISAK) [14]. Measurements were taken at least twice in order to observe agreement between repeated measures [15]. In cases where the difference found between measures was greater than 1%, the participant was measured again once 30 minutes had passed from the previous measurement.
For the identification of somatotype, and of its endomorph, mesomorph, and ectomorph components, the anthropometric method of Heath and Carter was used. This method was also employed for the graphic representation of data via a somatochart [16]. The method proposed by Duquet and Carter for categorisation of overall somatotype was used [17]. The distance between somatotypes was calculated through the equation proposed by Ross and Wilson [18] and was analysed according to the strategy proposed by Hebbelinck, Carter, and De Garay [19]. BMI was determined following the equation proposed by Quetelet: BMI = weight (kg)/height (m2). In order to calculate the similarity index, proposals described by Ross were utilised [20].
The statistical program SPSS version 22.0 was used for the processing and analysis of data. Various descriptive statistics were analysed and possible significant differences between variables were established according to sex and between groups of different ages. All variables were also examined via the Kolmogorov–Smirnov test, apart from weight, which did not present a normal distribution. In the case of the latter, the Mann–Whitney U and Kruskal–Wallis statistical tests were used. An error of α = 0.05 was applied in order to establish the significance level of the aforementioned comparisons, with which we assumed a 95% confidence interval and a 5% error rate.

3. Results

The means and standard deviations of all variables were recorded as measures of central tendency and dispersion, alongside their minimum and maximum values. Table 1 shows the values obtained both in the male group and the female group, in addition to the results of the comparisons between the populations. In all cases, the differences found were highly significant (p < 0.001), except in the medial calf skinfold measurement, which produced a different significance output (0.01 > p > 0.001).
Average values for height in males increased with age from 153.20 +/− 7.6 cm within the 12 year old group, reaching up to 165.86 +/− 5.5cm within the 16 year old group. Amongst females, height went from 151.25 +/−5.3 cm at 12 years old, to 153.41 +/− 4.84 cm at 16 years old. Though in this case, values corresponding to the intermediate ages remained relatively stable. In the case of weight, minimum values in both males and females corresponded to the 12 year old group and maximum values corresponded to 16 year olds. However, the 13, 14, and 15 year old groups demonstrated relatively stable values (12 year old males: 52.42 +/−13.01 kg; 16 year old males: 63.22 +/− 7.12 kg); (12 year old females: 47.94 +/−11.65 kg; 16 year old females: 52.34 +/− 5.15 kg). Highly significant results were found between all age groups for both height and weight (p < 0.001).
Table 2 offers data relating to body mass index and the three somatotype components (endomorphic, mesomorphic, and ectomorphic), in addition to the coordinates found in the somatochart (X and Y) for the previously mentioned groups. These are presented along with the statistical comparisons made between the overall values of each group.
With regards to BMI, no overall significant differences were found between males and females. None of the individuals within either of the two groups could be classified as “underweight”. Following examination of the individuals classified as “normal weight”, we found that 59.70% of females and 61.82% of males conformed to this description. The remaining 40%, approximately, was unequally distributed amongst males and females. Females were further categorised as 29.46% “overweight” and 10.85% “obese”, in comparison to 18.79% “overweight” and 19.40% “obese” in the case of males.
Following the analysis of somatotype according to its components (Table 2), highly significant differences could be observed to exist when comparing mesomorphy and endomorphy (p < 0.001). When we conducted a comparison with ectomorphy, no differences were observed in this component according to sex (p > 0.05).
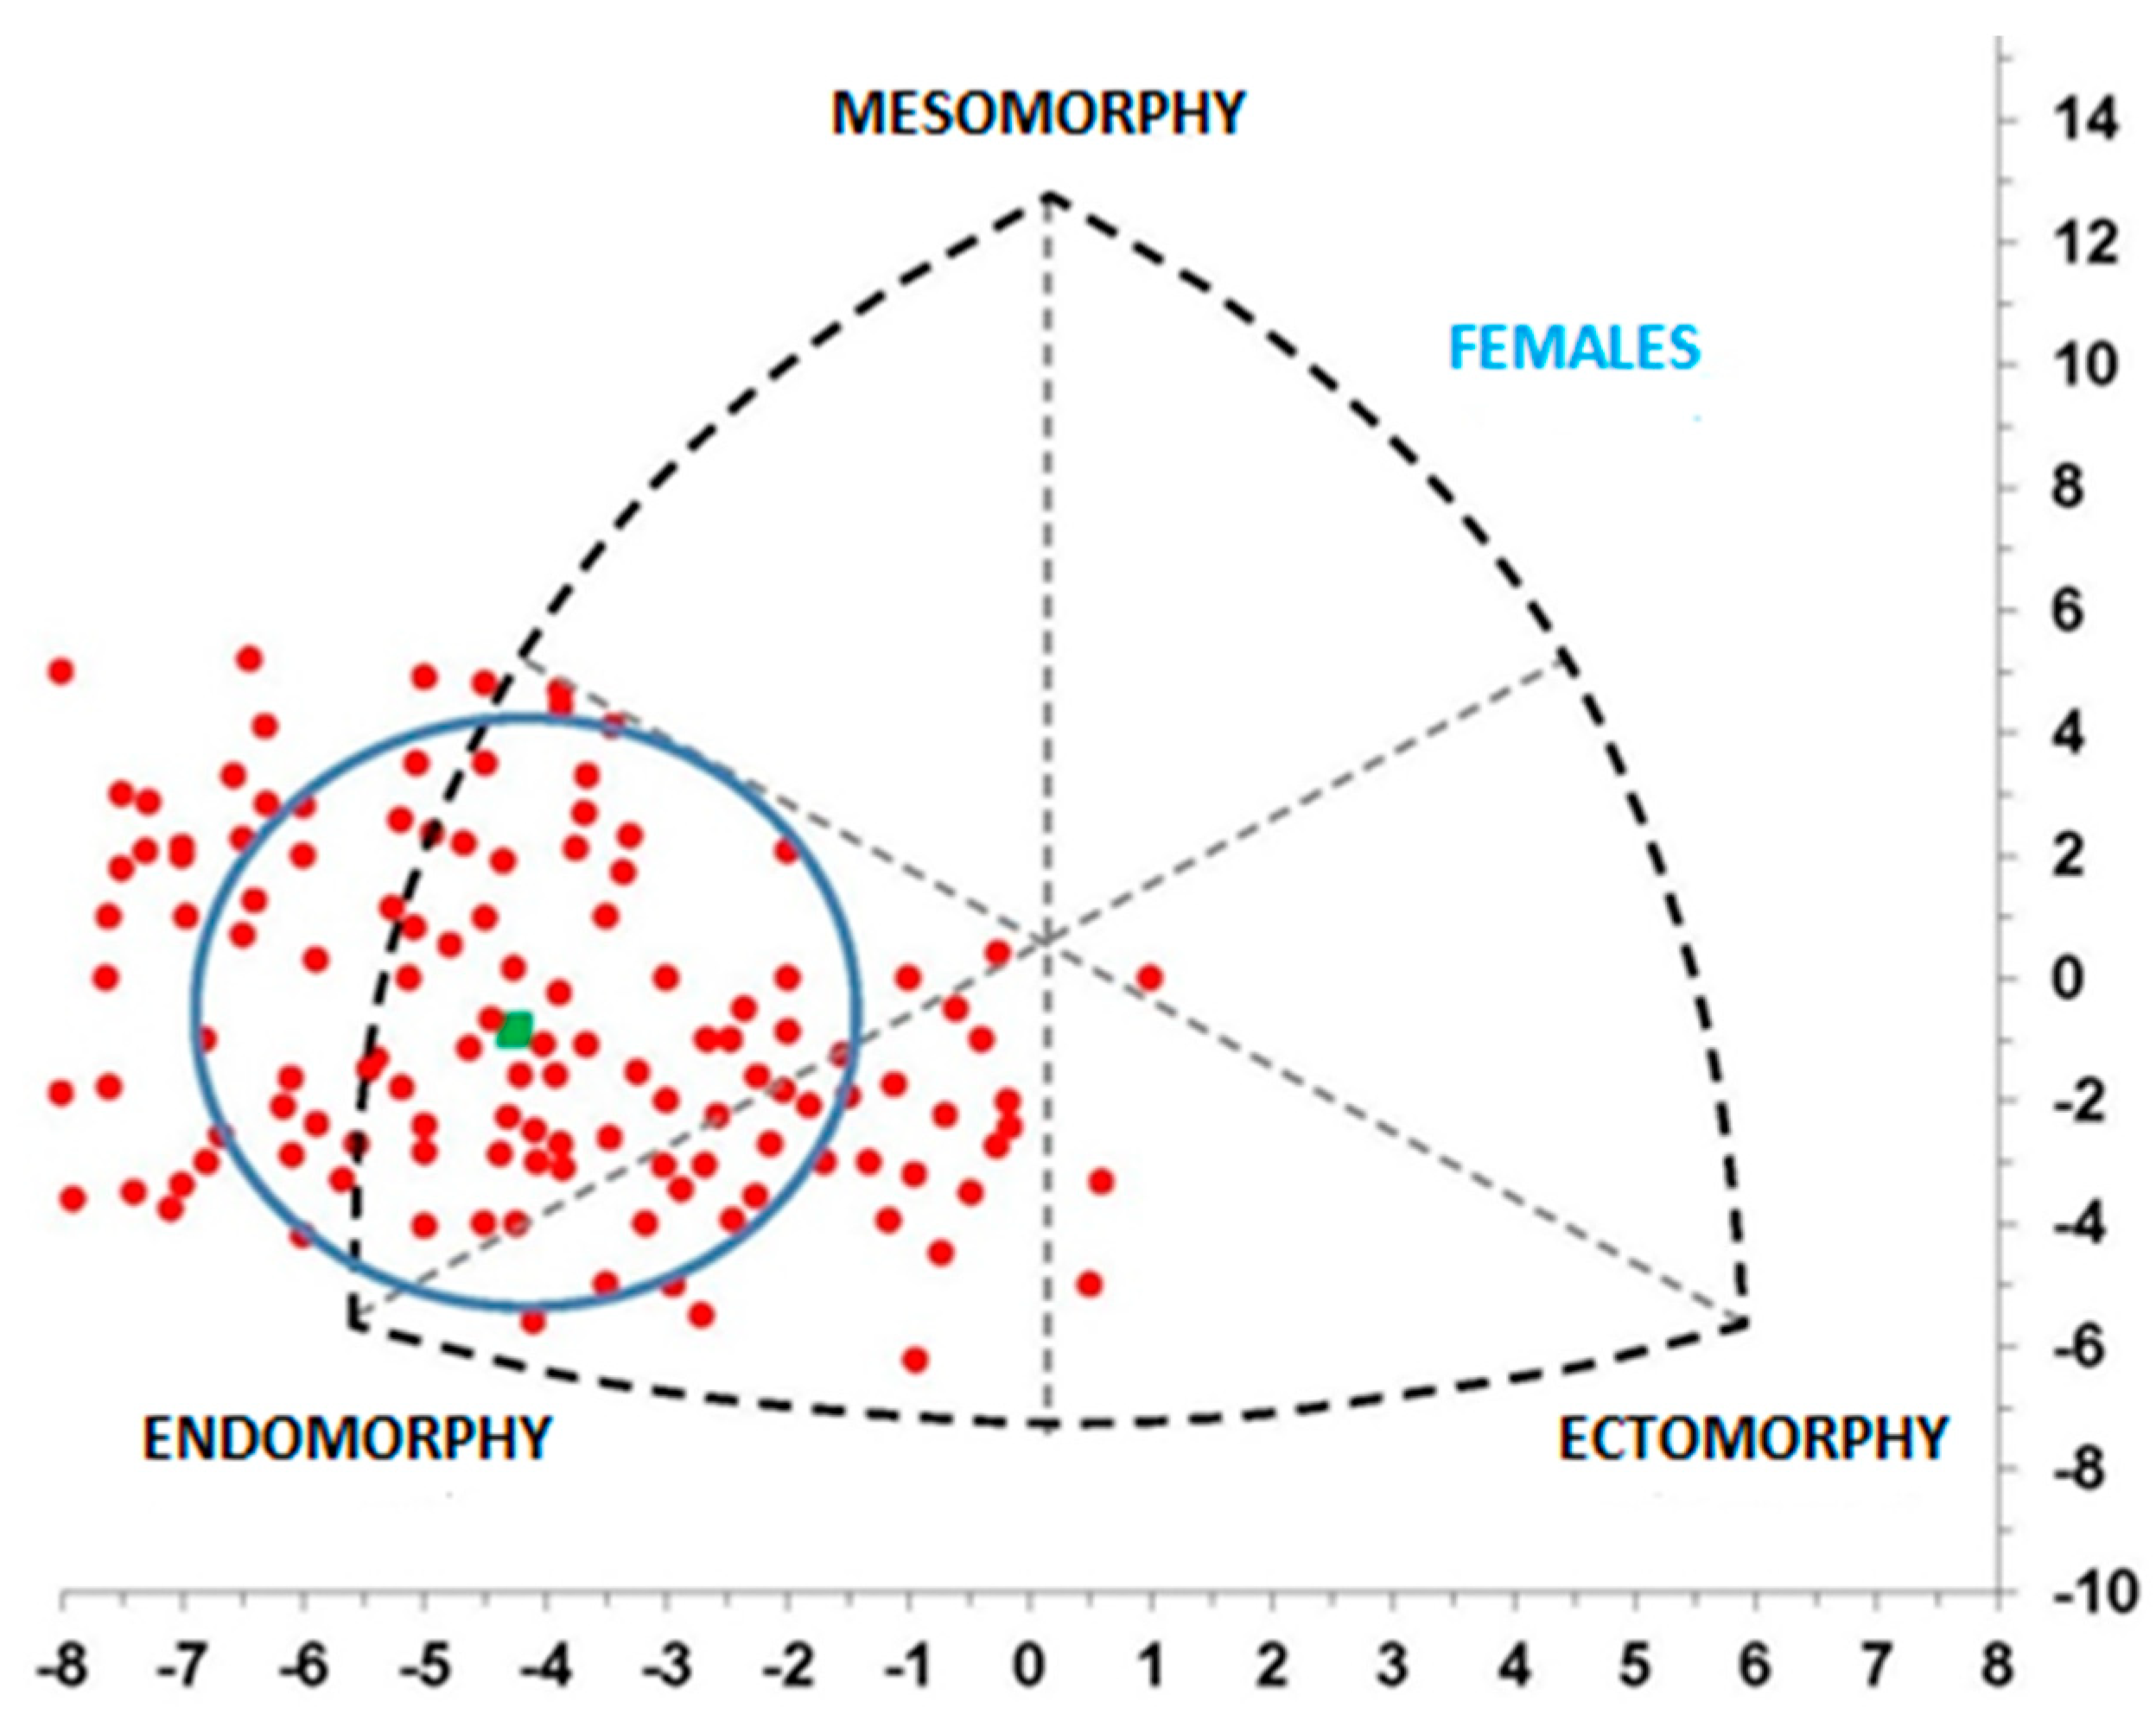
Following the transformation of the three components into X and Y coordinates in order to locate them within the somatochart, we could confirm that the comparison was again highly significant (p < 0.001). We can see that males are generally concentrated within an area that is higher up the chart (mesomorphic and endomorphic components) than the space occupied by females (endomorphic components) (Figure 1 and Figure 2).
When the seven variables defined by Duquet and Carter [17] were utilised as categorical variables, the highest percentage found relating to endomorphy was identified as 83.72% for females compared to 45.45% for males. In the endomorph–mesomorph, mesomorph, and mesomorph–ectomorph categories, females produced a value of 0% for all of these categories. Percentages found for males were 7.27%, 23.03%, and 8.48%, respectively. When considering ectomorphism and ectomorphy–endomorphy, we obtained percentages of 2.32% and 4.65%, relative to 4.24% and 1.82% between females and males, respectively. Finally, we found a similar percentage located in the central zone when comparing females and males: 9.30% and 9.70%, respectively (Table 3).
Table 4 presents the correlations found between BMI and the somatotype of participants. Firstly, correlations obtained between absolute BMI values are presented according to males, females, and the overall population, alongside the absolute values for the somatotype components and the coordinates that correspond to the somatochart.
The values observed can be seen to fall between the positive correlation r = 0.548 for the mesomorphic component in females and r = −0.955 in the ectomorphic component, also in females. With regards to the coordinates, we found a very high correlation between the x-axis and BMI that was always lower than −0.830. This association indicates to us that individuals with a high body mass index are normally situated on the left-hand side of the somatochart, tending towards endomorphic zones. On the other hand, individuals with a low BMI will be situated in zones pertaining to the ectomorphic component.
Also in Table 4, we found results of the Spearman rank correlation relating the BMI categories associated to underweight, normal weight, overweight, and obesity with the seven somatotype categories previously presented in line with Duquet and Carter [17]. In all cases p < 0.001, however males were found to produce somewhat stronger correlations than women between BMI and somatotype categories.
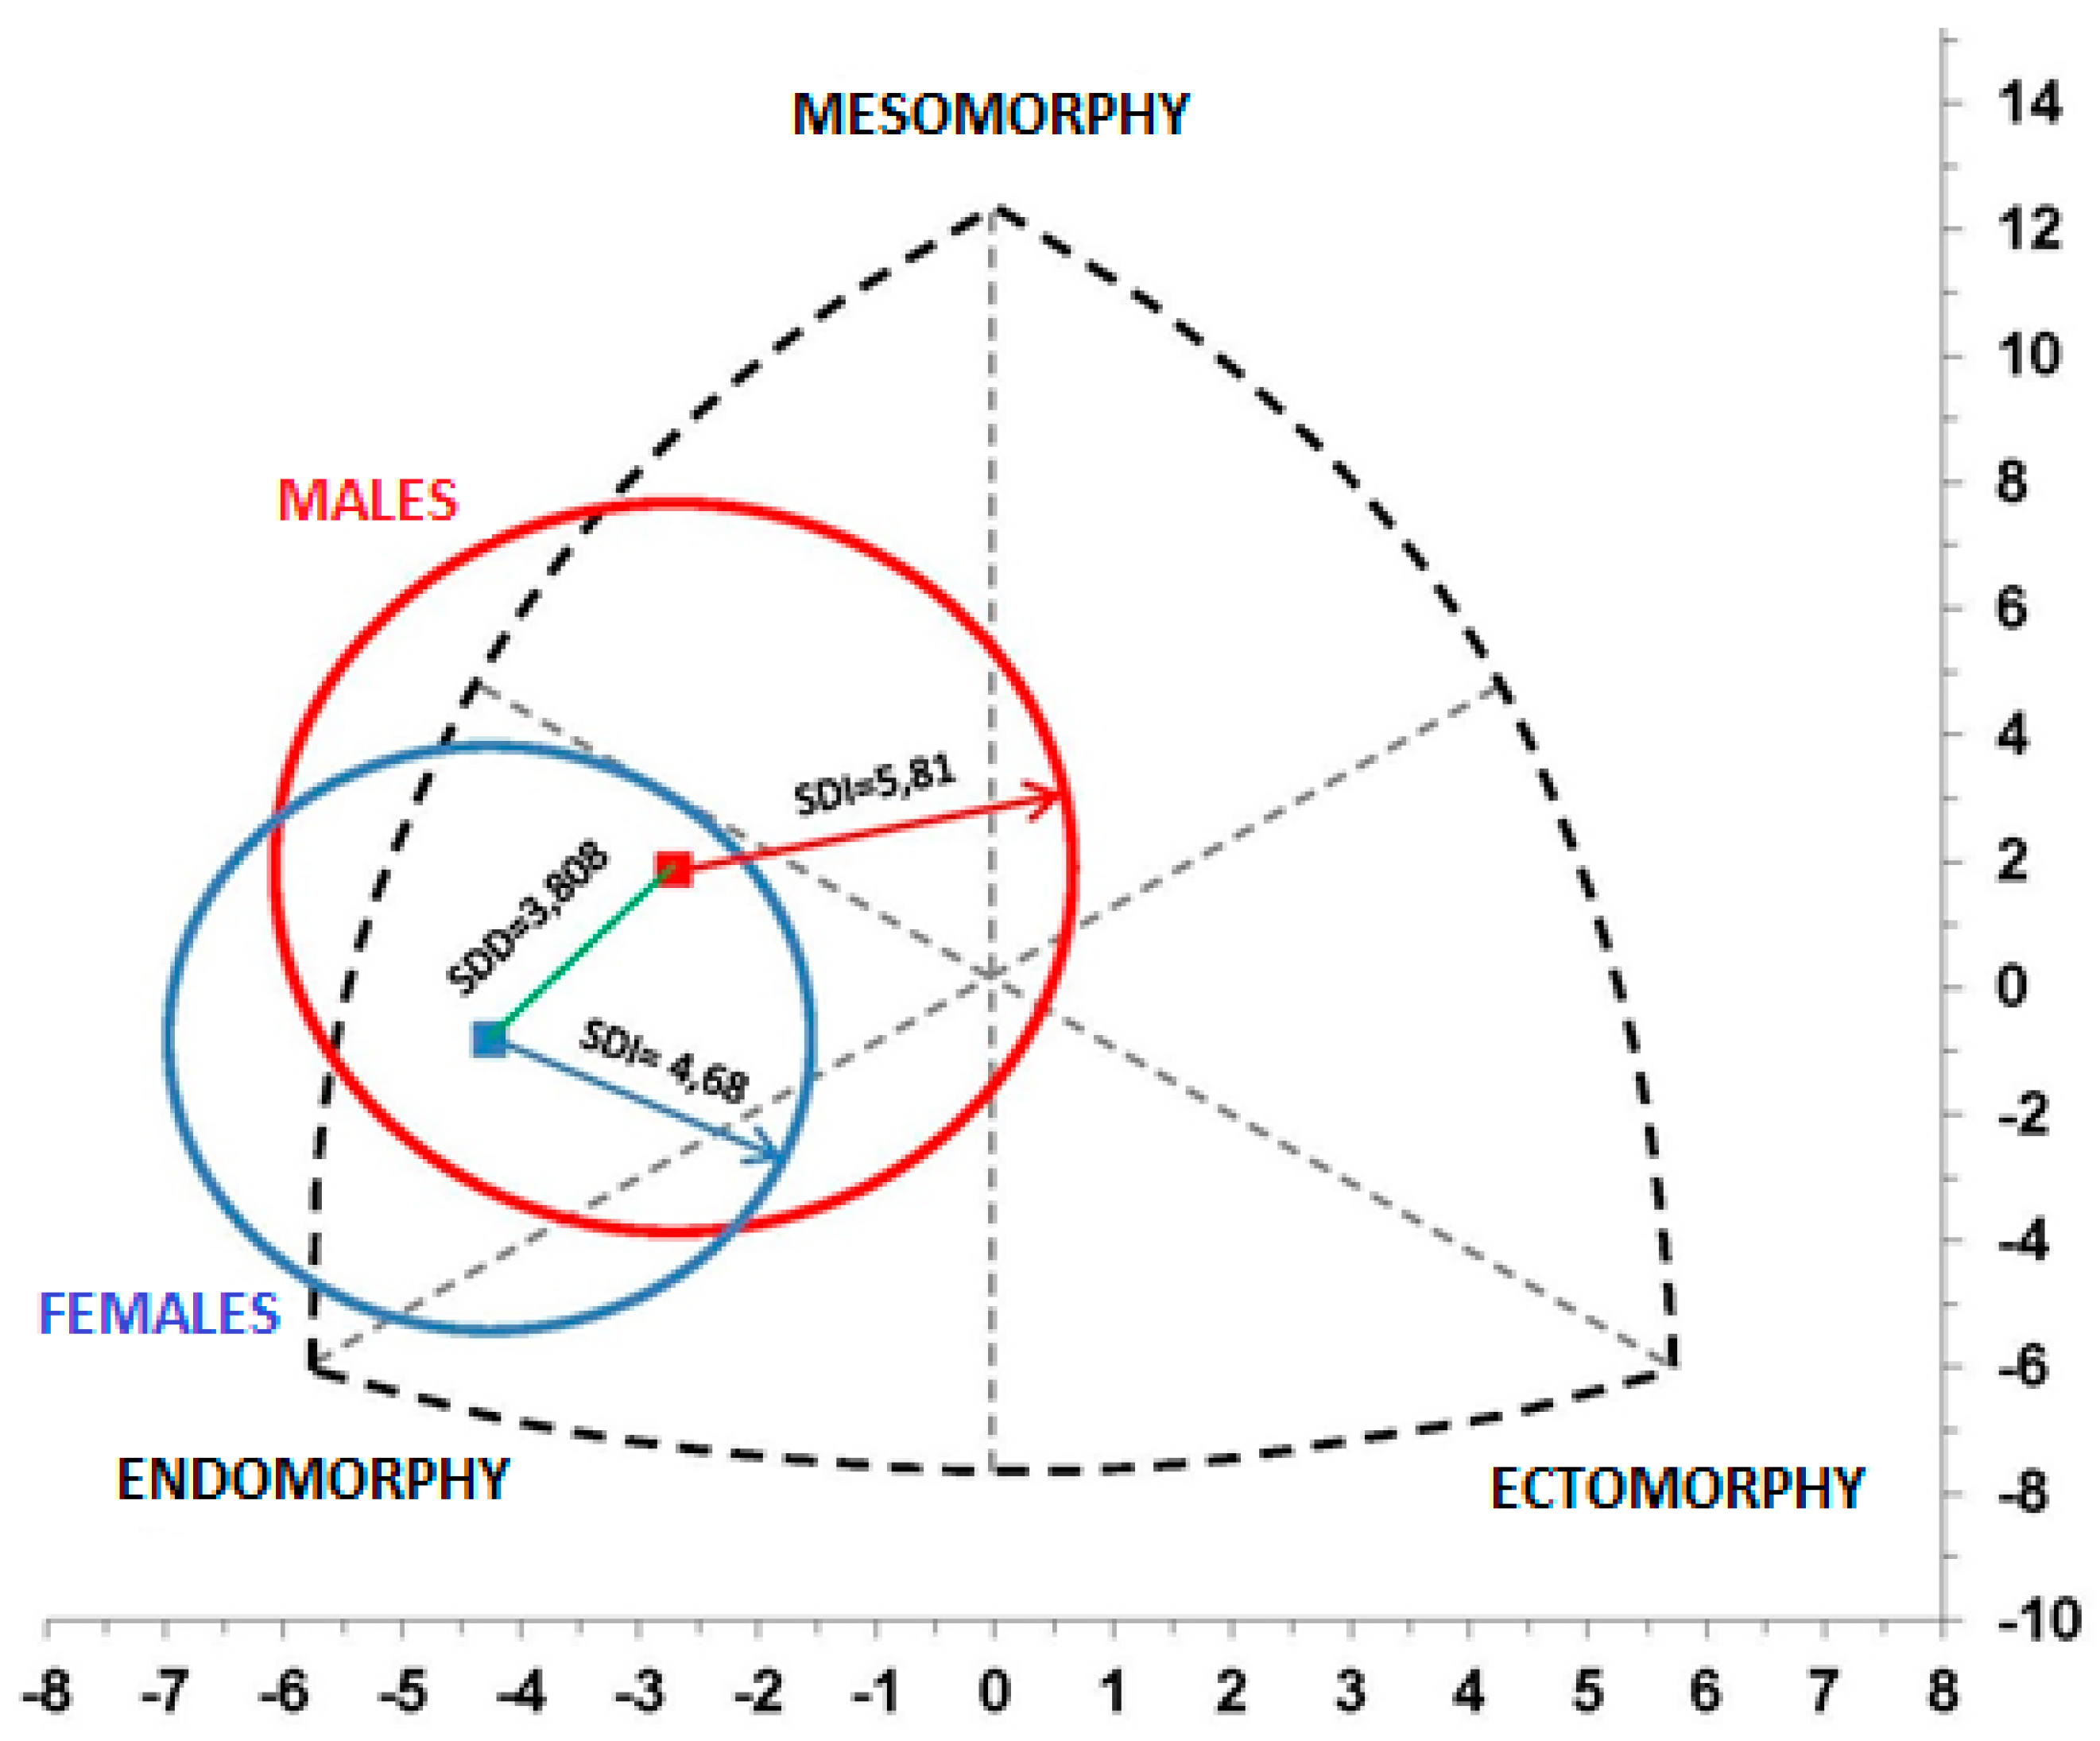
Table 5 shows that the dispersion distance between the average somatotype of the male population and that of the female population was 3.808. Following specifications laid out by Hebbelinck, Carter, and De Garay [19], this difference in distance was significant (p < 0.05) given that it was greater than two. Further in the same table, dispersion indices for both of the populations studied can be observed. This dispersion index is defined as the average distance between the somatotypes of all of the participants of one population in relation to the mean somatotype of the reference population. It has the same meaning as the standard deviation of a population.
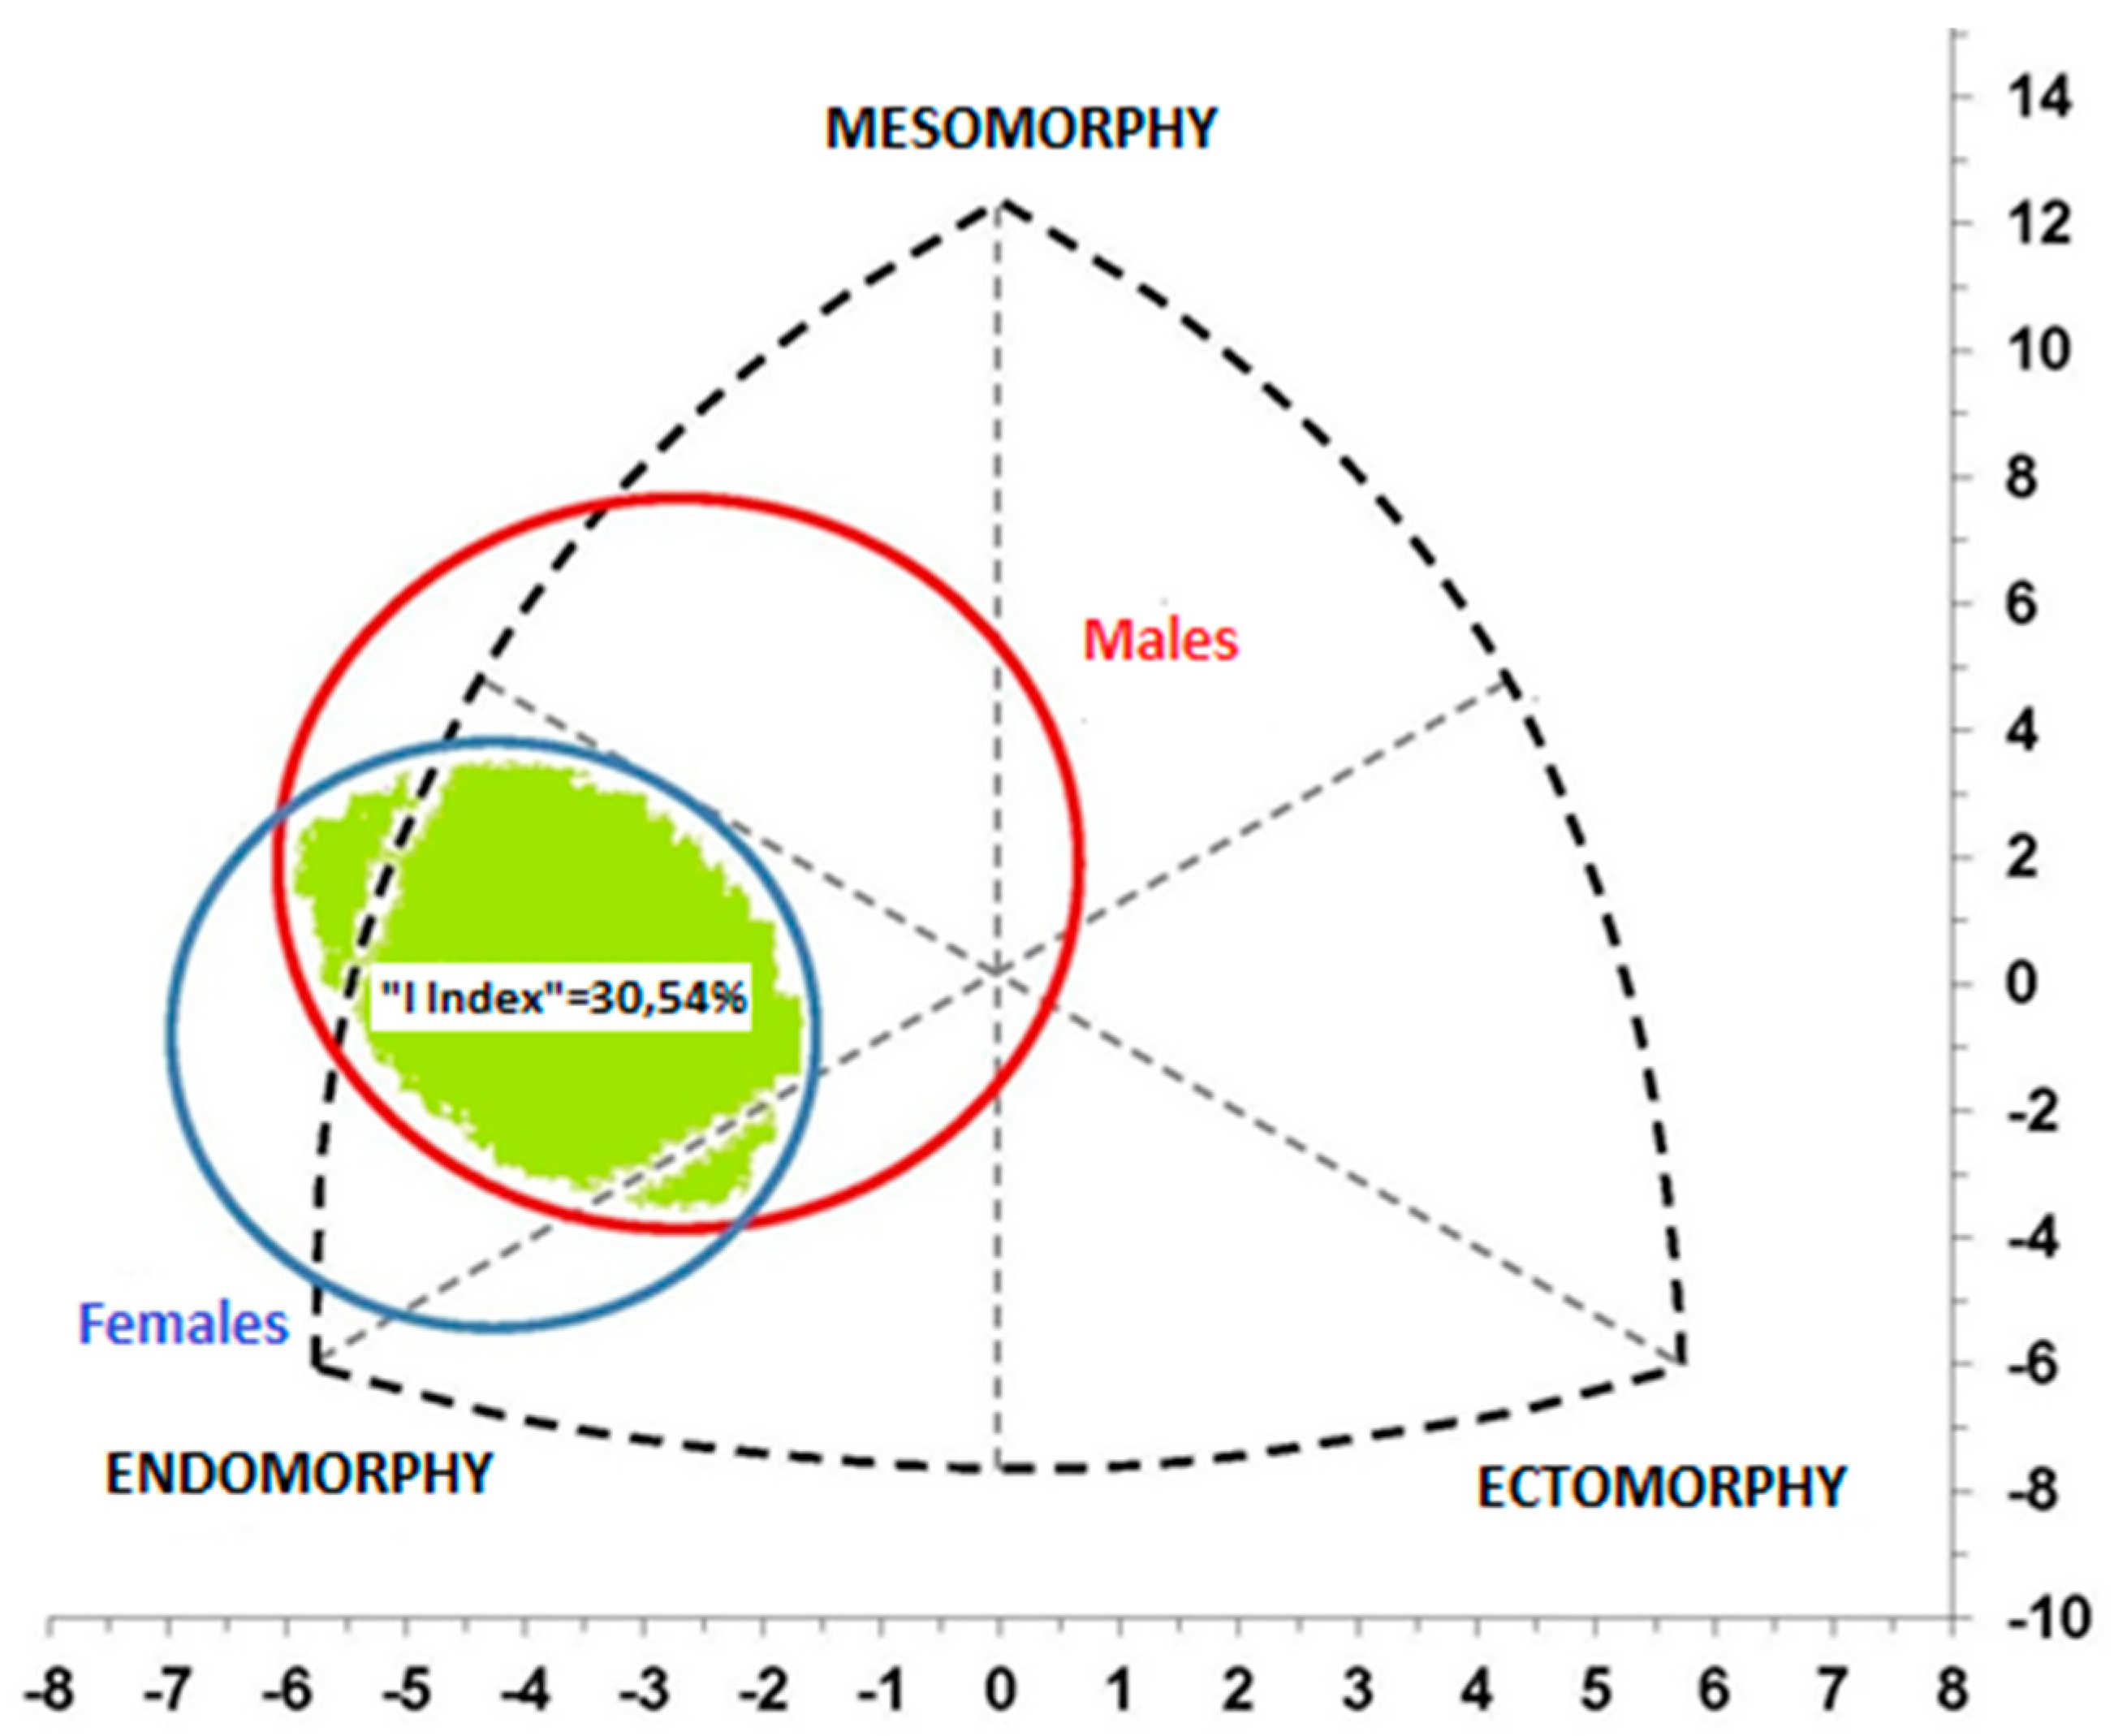
In Figure 3 and Figure 4, following the method proposed by Ross [20], it can be observed that both populations overlap. The area resulting from the intersection is considered as the similarity value between populations and is only 30.54%.

4. Discussion

The BMI values uncovered in our population are not consistent with those presented by Cahuana and collaborators [21], who studied a similarly aged adolescent population in Lima. They found that 22.1% of participants were “underweight”, 38.3% were “normal weight”, 36.7% were “overweight”, and 2.9% were “obese”. However, these authors did not clarify whether the reference they took to make this classification was that of the general BMI or that adapted to this age group by the WHO, as was the case in the present study. These data also differ from those presented by Álvarez and colleagues [22]. Their study indicated that according to the National CENAN-INSOMS study on the nutritional state of schoolchildren and adolescents in Peru, 10.9% of evaluated adolescents aged between 10 and 19 were overweight according to BMI. This equated to 9.6% of males and 12.5% of females. Likewise, obesity at this age was found to be at 3.3%, this being apparent in 3.8% of males and 2.6% of females. The values found in that study for underweight are similar to the values found in the present study, with neither exceeding 1%.
In comparing the BMI results obtained in the present work with other populations of non-Peruvian adolescents, we found varied information. The percentage of global obesity found by researchers at the University of Granada [23] in the south of Spain was similar to that found in Huacho. However, in contrast to the Peruvian population, females in the Spanish sample presented a higher percentage of obesity (males presented 12.6% and females 15.1%). According to data collected by Martínez and their team [24] from the Ministry of Health in Chile, data for overweight and obesity suggest only slightly lower levels than those found in Huacho. In this case, overweight and obesity was found in 33% of pubertal schoolchildren. In Argentina, other authors [25] have described moderate percentages of overweight (20.8%) and obesity (5.4%), with obesity being much less prevalent here than what we uncovered in the present study. Álvarez and their team [22] indicated that overweight and obesity predominate in Metropolitan Lima and along the Peruvian coast. This fact may be at least partly explained by the greater urbanisation and economic development seen in these areas in comparison to the other regions of Peru.
In agreement with that previously presented, it can be said that Peru currently finds itself going through a transitional process characterised by chronic malnutrition, nutritional anaemia, and obesity. The latter is a direct consequence of modernity, which includes sedentary behaviour, sugar-rich foods, sodium, saturated and trans-fats, greater presence of children and young people inside their homes distracting themselves with the TV, internet and videogames, and a physical activity deficit [26]. Likewise and in agreement with various authors, it must be mentioned that this country presents a concerning prevalence for obesity, as do other countries in the region. In fact, only Chile and Mexico exceed Peru with regards to obesity in adolescents, with prevalence also being higher in males than in females [27].
With regards to the status of the population shown by the somatochart, regrettably, practically no research exists on somatotype that has been conducted within adolescent populations. Practically all those that were found refer to elite sportspeople. This means it is not possible to conduct a highly reliable comparison with the population of Huacho that was studied in the present study. The population that we studied came from Peru and was composed of schoolchildren who participated in sport competitively for their school. Gómez and collaborators [28] described a Peruvian population, but one that demonstrates different characteristics to the present sample as they focused on boys and girls living in populations at an altitude higher than 2000 metres. For this reason, their sample logically presents particularities in their growth and body composition [29].
When studying same-sex groups of school sports players, it can be seen that the endomorph component showed greater variability. Variability decreased notably in the mesomorph and ectomorph components, which had much lower indices of variability. This coincides with the results of work conducted by Ruderman and colleagues [29]. Work carried out by Silva and their team [3] did not find any significant differences between males and females. This can be explained by the fact that this previous work was carried out in an academic centre with a high economic status.
On the other hand, multiple studies conducted in India [30,31], Spain [32,33,34], Hungary [35], Argentina [29], and Chile [3] must be referenced. These demonstrated similar dispersion indices to those found in the present work. However, significant differences between average somatotypes, as much for males as for females, tended towards endomorphy in the city of Huacho.
The studied population could be broadened with the aim of being able to establish significant similarities and differences between individuals who occupy different positions and enact, as a result, different tasks during the game (goalkeeper, defender, striker).

5. Conclusions

No cases of underweight were identified in any of the individuals who participated in the present study. A high percentage of overweight and obesity was found in the population studied. Overweight indices were much higher in women, whilst when considering obesity, prevalence was significantly higher amongst males. BMI values did not present significant differences between males and females. However, when the parameters of height and weight were compared separately, these did demonstrate differences. In the somatochart, females clearly occupied zones of strong endomorphic influence, whilst males tended to be positioned in endomorphic and mesomorphic zones. The existing correlation between the somatotype elements and BMI presented highly significant values, with ectomorphism and the X coordinate standing out. In comparison with other populations, the population of Huacho occupied lower zones in the somatochart, this being true as much for males as for females. The results indicate that training that is directed towards adolescent students and the acquisition of healthy habits and lifestyles is necessary.

Author Contributions

Conceptualization, M.L.-M. and D.L.-M.; methodology, R.A.-M.; formal analysis, D.H.-G.; investigation, M.R.-C.; data curation, J.M.-F.; writing—original draft preparation, D.L.-G. and M.L.-M.; writing—review and editing, M.L.-M., D.H.-G., R.A.-M., M.R.-C., J.M.-F. and D.L.-G.

Funding

This research received no external funding.

Acknowledgments

To the Regional Directorate of Education of Santa Maria for having allowed us access to and assisted us at the public and private educational centres in the city of Huacho. To the Research Group of the Council of Andalusia (Spain) HUM-238: “Teacher training as a mediator of knowledge”, which subsidised the research expenses.

Conflicts of Interest

The authors declare no conflict of interest.

References

  1. Lozano-Rojas, G.; Cabello-Morales, E.; Hernández-Díaz, H.; Loza-Munarriz, C. Prevalencia de peso y obesidad en adolescentes de un distrito urbano de Lima. Rev. Peru Med. Exp. Salud Publ. 2014, 31, 494–500. [Google Scholar]
  2. Flores-Rivera, J.A. Perfil cineantropométrico de la selección peruana de judo Infantil, Juvenil, Junior, Mayores; Universidad Nacional Mayor de San Marcos: Lima, Peru, 2009. [Google Scholar]
  3. Silva, H.; Bruneau, J.C.; Reyno, H.P.; Bucarey, S. Somatotipo e índice de masa corporal en una muestra de adolescentes de ambos sexos de la ciudad de Temuco, Chile. Int. J. Morphol. 2003, 21, 309–313. [Google Scholar] [CrossRef]
  4. Silva, M.H.; Collipal, L.E.; Martínez, C.; Torres, I. Análisis del IMC, somatotipo en una muestra de adolescentes con sobrepeso y obesidad en Temuco-Chile. Int. J. Morphol. 2008, 26, 707–711. [Google Scholar] [CrossRef]
  5. Godoy-Cumillaf, E.A.R.; Valdés-Badilla, P.A.; Salvador, S.N.; Carmona-López, M.I.; Fernández, J.J. Anthropometric characteristics of adolescents from different sports training schools. Int. J. Morphol. 2015, 33, 1065–1070. [Google Scholar] [CrossRef]
  6. Irrutia-Amigo, A.; Busquets-Faciaben, A.; Marina-Evrard, M.; Galilea-Ballarini, P.A.; Carrasco-Marginet, M. Talla, peso, somatotipo y composición corporal en gimnastas de elite españoles desde la infancia hasta la edad adulta. Apunts. Medicina de l’Esport 2009, 44, 18–28. [Google Scholar] [CrossRef]
  7. Menezes, L.S.; Novaes, J.; Fernández-Filho, J. Somatotipo de atletas y practicantes de gimnasia rítmica prepubescentes y postpubescentes. Int. J. Morphol. 2014, 32, 968–972. [Google Scholar] [CrossRef]
  8. Torres, F.J.; Lara-Padilla, E.; Sosea-Tattei, G.; Berral, F.J. Análisis de composición corporal y somatotipo de judokas infantiles y cadetes en el campeonato de España 2012. Int. J. Morphol. 2014, 32, 194–201. [Google Scholar] [CrossRef]
  9. De los Santos, J.; Ghioldi, M.; Obeid, M.D.; Schattner, C. Características antropométricas y hábitos alimentarios de estudiantes de danza clásica, Instituto Superior de Arte del Teatro Colón. Apunts. Medicina de l’Esport 2016, 51, 85–92. [Google Scholar] [CrossRef]
  10. Montecinos, R.; Valdés, R.; Guajardo, J. Somatotipo de escolares de 9 a 12 años de edad. Apunts. Medicina de l’Esport 1981, 18, 69–74. [Google Scholar]
  11. De Onis, M.; Onyango, A.W.; Borghi, E.; Siyam, A.; Nashidaa, C.; Siekmanna, J. Elaboración de un patrón OMS de crecimiento de escolares y adolescentes. Bull. World Health Organ. 2007, 85, 660–667. [Google Scholar] [CrossRef]
  12. Cabañas-Armesilla, M.D. Características antropométricas generales. Valoración del tamaño corporal; Cabañas-Armesilla, M.D., Esparza-Ros, F., Eds.; Compendio de Cineantropometría, CTO Editorial: Madrid, Spain, 2009. [Google Scholar]
  13. Valdés-Badilla, P.; Salvador Soler, N.; Godoy-Cumillaf, A.; Carmona-López, M.I.; Fernández, J.J.; Durán-Agüero, S. Somatotipo, estado nutricional y nivel de glucemia de estudiantes de educación física. Nutr. Hosp. 2015, 32, 1261–1266. [Google Scholar] [CrossRef] [PubMed]
  14. Marfell-Jones, M.; Olds, T.; Stewart, A.; Carter, J.E.L. International Standards for Anthropometric Assessment; ISAK: Potchefstroom, South Africa, 2006. [Google Scholar]
  15. Rosique, J. Estudio transversal del crecimiento en escolares vizcaínos. Ph.D. Thesis, Universidad del País Vasco-Euskal Herriko Unibertsitatea, Bilbao, Spain, 1992. [Google Scholar]
  16. Carter, J.E.L.; Heath, B.H. Somatotyping—Development and Applications; Cambridge University Press: Cambridge, UK, 1990. [Google Scholar]
  17. Duquet, W.; Carter, J.E.L. Kinanthropometry and Execirse Physiology Laboratory Manual: Test Procedures and Data, 3rd ed.; Reilly, T., Eston, R.G., Eds.; Routledge: London, UK, 2009; pp. 52–72. [Google Scholar]
  18. Ross, W.D.; Wilson, N.C. A somatotype dispersión index. Res. Quart. 1973, 44, 372–374. [Google Scholar] [CrossRef]
  19. Hebbelinck, M.; Carter, J.E.L.; De Garay, A. Body Built and Somatotipe of Olimpic Swimmers. In Swimmer II; Lewille, L., Clays, J.P., Eds.; University Park: Baltimore, MD, USA, 1975. [Google Scholar]
  20. Ross, W.D. Metaphorical Models in the Study of Human Shape and Proportionality. In Physical Education, Sports and the Sciences; Broekhoeff, J., Ed.; Microcard Publications: La Crosse, WI, USA, 1976; pp. 284–304. [Google Scholar]
  21. Cahuana-Rios, E.; Taipe-Aylas, M. Somatotipo y su relación con el estado nutricional en escolares limeños de 12 a 16 años. Casus. Revista de Investigación y Casos en Salud 2016, 1, 27–33. [Google Scholar]
  22. Álvarez-Dongo, D.; Sánchez-Abanto, J.; Gómez-Guizado, G.; Tarqui-Mamani, C. Sobrepeso y obesidad: Prevalencia y determinantes sociales del exceso de peso en una población peruana 2009–2010. Rev. Peru Med. Exp. Salud Públ. 2012, 29, 303–313. [Google Scholar]
  23. Aguilar-Cordero, M.J.; González-Jiménez, E.; García-García, C.J.; García-López, P.A.; Álvarez-Ferre, J.; Padilla-López, C.A.; González-Mendoza, J.L.; Ocete-Hita, E. Obesidad de una población de escolares de Granada: Evaluación de la eficacia de una intervención educativa. Nutr. Hosp. 2011, 26, 636–641. [Google Scholar] [CrossRef]
  24. Martínez, C.; Silva, H.; Collipal, E.; Carrasco, V. Description of somatotype and BMI the adolescent’s sample to pubic school of the Temuco-Chile. Int. J. Morphol. 2008, 26, 653–657. [Google Scholar] [CrossRef]
  25. Kovalskys, I.; Bay, L.; Rausch Herscovici, C.; Berner, E. Prevalencia de obesidad en una población de 10 a 19 años en la consulta pediátrica. Rev. Chil. Pediatric 2005, 76, 324–325. [Google Scholar] [CrossRef]
  26. Pajuelo-Ramírez, J. La obesidad en el Perú. Fac. Med. 2017, 78, 179–185. [Google Scholar] [CrossRef]
  27. Rivera, J.; González, T.; Pedraza, S.; Aburto, T.; Sánchez, T.; Martorell, R. Childhood and adolescent overweight and obesity in Latin America: Asystematic review. Lancet Diabetes Endocrinol. 2014, 2, 321–332. [Google Scholar] [CrossRef]
  28. Gómez-Campos, R.; Hespanhol, J.E.; Arruda, M.; Abella, C.-P.; Fargueta, M.; Cossio-Bolanos, M.A. Valoración del crecimiento físico por medio de la proporcionalidad corporal en escolares peruanos que viven a moderada altitud. Rev. Bras Cineantropom Desempenho Hum. 2012, 14, 690–703. [Google Scholar]
  29. Ruderman, A.; Navarro, T.; Mangeaud, A.; Cejas, V.; Bajo, J.M. Somatotipo de adolescentes escolarizados de Córdoba (Argentina). Rev. Argent. Antropol. Biológica 2017, 19, 1–11. [Google Scholar] [CrossRef]
  30. Subramanian, S.K.; Vivek-Kumar, S.; Vinayathan, A.; Krishnakumar, R.; Rajendran, R. Somatotyping in adolescents: Stratified by sex and physical activity. Int. J. Anat. Appl. Physiol. 2016, 2, 32–38. [Google Scholar]
  31. Inuka-Gakhar, S. Age changes and sex differences in somatotypes among Jats of Delhi. Anthropol. Spec. 2002, 1, 115–125. [Google Scholar] [CrossRef]
  32. Rebato, E.; Rosique, J. Estudio del somatotipo en la comarca de Busturia. Cuad. Secc. Antrop. 1994, 12, 11–77. [Google Scholar] [CrossRef]
  33. González-Montero, M.; Marrodán-Serrano, M.D. La salud escolar también se mide. Guía práctica para el docente. Cuadernos de innovación; Centro Regional de Innovación y Formación “Las Acacias”: Madrid, Spain, 2007. [Google Scholar]
  34. Rebato, E.; Muñoz-Cañón, M. Influencia del estatus socioeconómico (SES) sobre la variabilidad antropométrica en estudiantes universitarios del país Vasco (España). Rev. Arg. Antropol. Biol. 2016, 18, 1–11. [Google Scholar] [CrossRef]
  35. Bodzsár, É.B.; Susanne, C. Données récentes concernant les variations de somatotypes entre 7 et 18 ans au sein de la population hongroise. Bull. Mém. Soc. Anthropol. Paris 1999, 11, 333–348. [Google Scholar] [CrossRef]
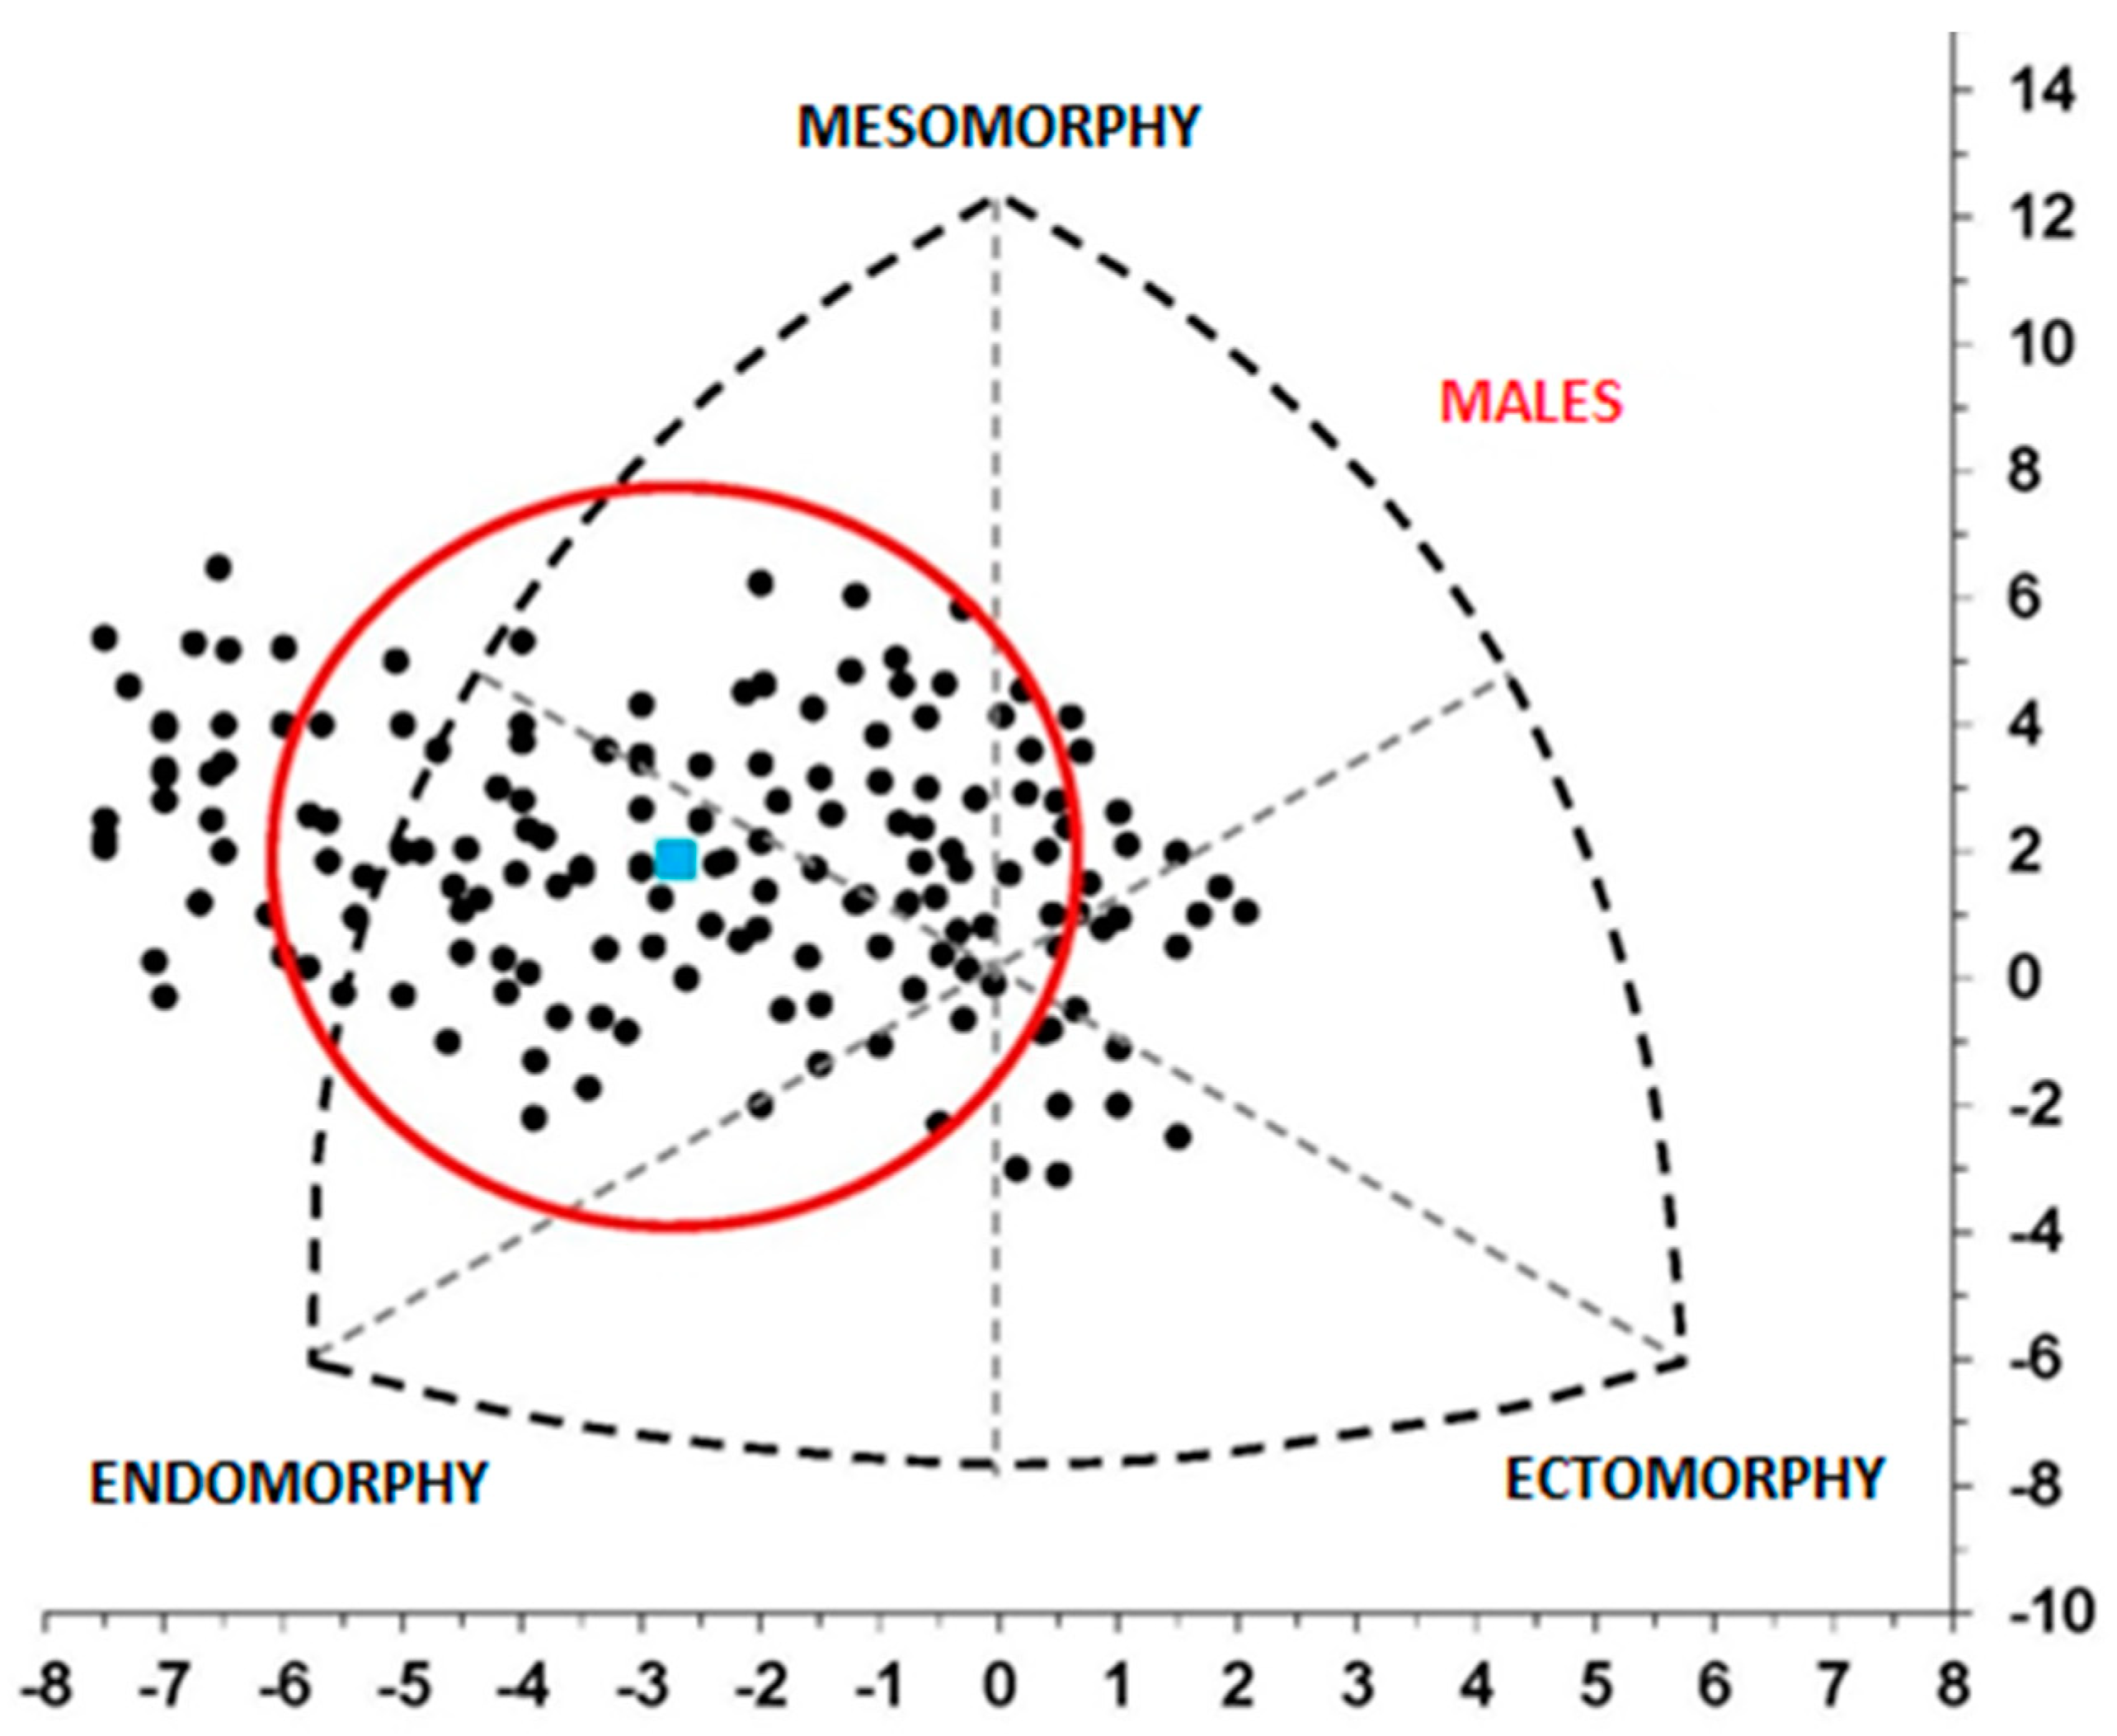
Figure 1. Somatochart providing an overall representation of male participants, mean somatotype, and area of influence of the dispersion index of the population.
Sustainability 11 06224 g001
Figure 2. Somatochart providing an overall representation of female participants, mean somatotype, and area of influence of the dispersion index of the population.
Sustainability 11 06224 g002
Figure 3. Somatochart showing areas of influence of the dispersion indices of both populations, dispersion index values, and the distance between somatotype means.
Sustainability 11 06224 g003
Figure 4. Somatochart with representation of the area of similarity between populations through the I index.
Sustainability 11 06224 g004
Table 1. Variables for the calculation of somatotype and body mass index (BMI), and the comparison between males and females.
Basic MeasuresSkinfold MeasuresCircumferenceDiameter
HeightWeightTricepsSubscapSuprspLegArmLegBiHumBiFem
Overall
n = 294
Mean156.7154.9818.3815.0318.1119.6226.6533.235.928.77
SD8.1810.757.777.659.599.793.693.400.690.86
Max.173.7288.8845.4546.4642.4249.4946.4644.448.6911.11
Min.139.5934.454.953.964.166.4420.3023.274.464.95
Males
n = 165
Mean160.5258.4017.4313.5916.7118.4027.4934.316.229.20
SD7.8710.809.127.7310.4310.202.733.220.600.72
Max.173.7288.8845.4540.4042.4246.4632.3244.448.4811.11
Min.141.0836.834.953.964.166.4420.7927.724.855.54
Females
n = 129
Mean151.8450.5119.5916.8719.9121.1925.5731.855.458.22
SD5.588.915.397.158.089.034.413.130.620.68
Max.169.6877.7737.3746.4640.4049.4946.4639.398.699.70
Min.139.5934.4510.407.927.929.9020.3023.274.464.95
Males
Vs.
Females
Z−8.892−6.429−4.075−5.326−3.832−3.467−6.544−6.192−9.770−11.71
Sig.0.000 ***0.000 ***0.000 ***0.000 ***0.000 ***0.001 **0.000 ***0.000 ***0.000 ***0.000 ***
Note: (n/s) p > 0.05; (*) 0.05 > p > 0.01; (**) 0.01 > p > 0.001; (***) 0.001 > p.
Table 2. BMI, somatotype components, and comparisons between males and females.
Somatotype ComponentsSomatoc. Coordinates
BMIEndomorphyMesomorphyEctomorphyXY
Overall
n = 294
Mean22.315.384.021.98−3.390.68
SD3.672.101.331.303.203.07
Max.33.8110.298.486.142.977.03
Min.16.061.520.950.10−10.19−8.55
Males
n = 165
Mean22.684.834.412.11−2.711.87
SD3.932.301.101.373.492.47
Max.33.8110.297.836.142.076.47
Min.16.061.521.130.10−7.50−3.10
Females
n = 129
Mean21.846.083.531.82−4.26−0.83
SD3.251.561.441.192.553.10
Max.32.179.918.484.231.025.20
Min.16.943.200.950.10−8.00−6.23
Males
Vs.
Females
Z−1.279−5.323−6.581−1.674−4.362−7.610
Sig.0.201 n/s0.000 ***0.000 ***0.094 n/s0.000 ***0.000 ***
Note: (n/s) p > 0.05; (*) 0.05 > p > 0.01; (**) 0.01 > p > 0.001; (***) 0.001 > p.
Table 3. Comparison of sports players according to sex corresponding to the Duquet and Carter zones.
SOMATOCHART ZONEFemalesMales
Endomorphic zone83.72%45.45%
Endo-mesomorphic zone0%7.27%
Mesomorphic zone0%23.03%
Meso-ectomorphic zone0%8.48%
Ectomorphic zone2.32%4.64%
Ecto-endomorphic zone4.24%1.82%
Central zone9.30%9.70%
Table 4. Correlations between BMI and somatotype.
Option A: BMI – Somatotype Components
(Continuous Values)
Option B: Spearman Rho
BMI-Somatotype Categories
OverallMalesFemalesOverallMalesFemales
Endomorphy0.6970.7610.703−0.461−0.648−0.233
Mesomorphy0.5940.6570.548
Ectomorphy−0.933−0.929−0.955
X coordinate−0.833−0.877−0.898
Y coordinate0.4250.3520.475
In all cases p < 0.001.
Table 5. Mean somatotype, dispersion index, and distance between somatotype means.
Mean Somatotype CoordinatesDispersion Index (SDI)Distance between Somatotype Means (SDD)
Male populationX = −2.71; Y = 1.87SDI = 5.813.808
Female population X = −4.26; Y = −0.83SDI = 4.68
Males
Vs.
Females
Z = −3.073
Sig. = 0.002 ***
Note: (n/s) p > 0.05; (*) 0.05 > p > 0.01; (**) 0.01 > p > 0.001; (***) 0.001 > p.