Article

Global Variation in Climate, Human Development, and Population Density Has Implications for Urban Ecosystem Services

1
Singapore-ETH Centre, ETH Zurich, Singapore 138602, Singapore
2
Campus for Research Excellence and Technological Enterprise, Singapore 138602, Singapore
3
School of Design and Environment, National University of Singapore, Singapore 117566, Singapore
4
School of Biological Sciences, University of Queensland, 4072 Brisbane, Australia
5
Department of Geography, National University of Singapore, Singapore 117570, Singapore
6
School of Architecture, Harbin Institute of Technology, Shenzhen 518055, China
7
Chair of Planning of Landscape and Urban Systems, ETH Zurich, 8093 Zurich, Switzerland
*
Author to whom correspondence should be addressed.
Sustainability 2019, 11(22), 6200; https://doi.org/10.3390/su11226200
Submission received: 22 August 2019 / Revised: 22 October 2019 / Accepted: 31 October 2019 / Published: 6 November 2019
(This article belongs to the Section Sustainable Urban and Rural Development)

Abstract

:
Humans rely upon ecosystem services to regulate their environment and to provide resources and cultural benefits. As the world’s urban population grows, it becomes increasingly important to find ways of improving the provision of ecosystem services in urban areas. However, the kinds of ecosystem services that are most needed or demanded by urban populations, and the opportunities to provide these, vary widely in cities around the world. Here we explore variation in climate, Human Development Index (HDI), and population density, and discuss their implications for providing and managing urban ecosystem services. Using 221 published studies of urban ecosystem services, we analyse the extent to which existing research adequately covers global variation in climatic and social conditions. Our results reveal an under-representation of studies from tropical cities and from lower HDI countries, with implications for how we conceptualize and quantify urban ecosystem services, and how we transfer benefits across case studies. Future work should be aimed at correcting these deficits and determining the extent to which conclusions about urban ecosystem services are transferable from one city to another.

1. Introduction

Urban ecosystems provide residents with many benefits, or “ecosystem services” [1,2]. Examples include urban forests reducing air temperatures [3], urban streams and floodplains regulating stormwater [4], gardens and urban farms producing food [5], and parks providing space for recreation and exercise [6]. As the proportion of the global population living in urban areas continues to grow, the importance of urban ecosystem services for human well-being will increase [7,8].
Cities around the world vary widely in terms of climate [9], socio-economic conditions [10], and demography [11], and this variation influences the types of ecosystem services that are most needed. Cities are located in most of the world’s climate zones [12], and this wide variation in climate has implications for which ecosystem services are important in any particular region. The cooling effect of vegetation, for example, will be most valued in cities where high temperatures and humidity reduce thermal comfort [13] or increase the risk of heat-related mortality [14]. Cities also vary greatly in their economic status, from the wealthiest financial and industrial centres to the poorest developing economies [10]. This gradient in prosperity—which is closely linked to human development—also influences the relative importance of ecosystem services [15]. For example, urban and peri-urban agriculture is of minor significance as a source of food in the developed world but is essential to many residents in poor cities [16]. Finally, urban areas vary in population density, from dispersed low-rise settlements to compact, high-rise districts [11,17]. Population density also influences the demand for urban ecosystem services, with urban green spaces being used more intensively for recreation and connecting with nature in densely populated areas [18].
The same factors also influence the capacity of different cities to provide and enhance ecosystem services [19,20]. For example, establishing or restoring vegetation is likely to be more difficult in a dry, cold climate than in the humid tropics. Similarly, providing ecosystem services poses more of a challenge in densely populated cities with limited land [21] than in cities with large reserves of undeveloped land. Any strategy to improve urban ecosystem services must be adapted to local circumstances and take account of the relative importance of different ecosystem services in that city, the current provision of services, and the local opportunities for enhancing service provision through design [22,23]. However, many cities in developing countries lack the capacity or facilities needed to make these assessments, and are therefore dependent upon knowledge gained elsewhere. This raises a problem: since most research on urban ecosystem services has been conducted in the United States, Europe, and China [24], findings may not be applicable to other geographic regions [19,25]. The question arises, therefore, of which cities are sufficiently similar to each other to allow valid comparisons [26].
Improving urban ecosystem services and maximising the value of natural capital have now become important development priorities for many cities around the world. Local initiatives are being supported by international agencies and foundations such as the World Bank, Global Environment Facility, and Asian Development Bank, which work closely with cities, especially in developing countries [27]. This is leading to a growing demand from urban managers and planners for reliable methods to manage and restore natural capital and strengthen ecosystem services. Against this background, the aim of this study is to understand the extent to which knowledge about ecosystem services is transferable and to identify the types of cities where research is most urgently needed. To do this, we investigate the global distribution of urban areas in terms of climatic zones, Human Development Index (HDI), and population density, and relate these results to the distribution of research on urban ecosystem services. The specific objectives of the study are: (1) to characterise global variation in urban areas and discuss the implications for the provision and relative importance of urban ecosystem services and (2) to evaluate the extent to which existing research into urban ecosystem services is representative across these axes of variation.

2. Materials and Methods

2.1. Characteristics of Urban Areas

The boundaries of metropolitan regions are defined differently in different countries, which complicates the process of making global comparisons using administrative boundaries [28]. We have therefore defined urban areas on the basis of built cover using the Global Urban Footprint (GUF) dataset, which used high-resolution radar satellite data to map all buildings at a resolution of 2.8 arc seconds (~84 m near the equator) in 2012 [29]. We calculated the percentage of built cover within 10 by 10 pixel (28 by 28 arc second) quadrats, and defined quadrats with more than 25% of built cover as “urban”. We then extracted all contiguous urban areas larger than or equal to 35 quadrats in size (~0.25 km2 near the equator). The extraction process identified 6480 urban areas globally.
We selected one indicator each to represent variation in climate, socio-economic status, and population density. For climate, we chose the Köppen-Geiger classification [12], which is widely used in environmental science. Urban areas experience a slightly different climate to surrounding rural regions and so may depart somewhat from the Köppen-Geiger categories, particularly those having higher temperatures and more intense rainfall [30]. The magnitude of urban climatic effects, however, is largely determined by the surrounding climate conditions [31]. For population density, we chose a basic index of residential population density due to the lack of globally available data for more complex indices incorporating commuter movement [32]. For the socio-economic indicator, we chose to use HDI rather than more economically focused indices such as gross domestic product or gross domestic product per capita. HDI is correlated with economic indicators such as Gross Domestic Product (GDP), yet also incorporates non-financial indicators of economic well-being that may be expected to influence the demand for ecosystem services, notably education and life expectancy [33].
For each urban area we extracted existing data on climatic zones using the updated Köppen-Geiger classification [12]. This classification comprises 30 climate types derived from global climate data, including temperature and precipitation [12]. However, we simplified these 30 categories into 10 broad climate types that are likely to be relevant for urban ecosystem services research, according to Table 1, excluding tundra and ice cap (ET) climates completely. We extracted population density data from the EU Global Human Settlement mapping project at a resolution of 250 m [11] and took the average population density across each urban area. We extracted data on HDI from maps that present aggregated data from the World Bank and national reports at the highest level of resolution available, which is usually the sub-country level [34]. All subsequent analyses used only the 5915 urban areas (out of the 6480 initially identified) for which all three indicators were available.

2.2. Review of Urban Ecosystem Services Literature

To evaluate the scope of previous research into urban ecosystem services, we conducted a systematic review of the literature using Web of Science. This literature review searched only peer-reviewed research articles published in English; we acknowledge this omits a variety of peer-reviewed publications in other languages and also the grey literature. The search used the flowing search string and was constrained to the period between 1999 and 2018. The search was conducted on the 1st of November 2018 and returned 316 results.
(TI = ((“ecosystem service*”) AND (urban OR city OR cities OR town))) AND LANGUAGE: (English) AND DOCUMENT TYPES: (Article)
We read the abstracts of all articles to establish their relevance, excluding the following papers from further analyses: review or conceptual papers, papers from non-urban areas, papers looking at the incorporation of ecosystem services into urban development plans rather than quantification, and papers that analysed many cities, as these typically take one equation and apply it globally, rather than studying each urban area in detail [35]. From the 221 remaining papers, we identified 332 cases in which ecosystem services had been quantified to some extent within separate urban areas. We identified the locations of each of the 221 studies and matched the studied urban areas to those present in the dataset by the minimum distance between the study location and the centre points of the urban area polygons.
To compare the representativeness of research across the socio-economic and population density axes we classified these continuous variables into discrete classes. HDI was classified into “low” (< 0.55), “medium” (0.55–0.69), “high” (0.7–0.79), and “very high” (0.8–1) based on United Nations definitions [36]. Population density was classified into “low”, “medium low”, “medium high” and “high” categories, as defined by the 0–25th, 25–50th, 50–75th, and 75–100th quartiles.
To statistically analyse whether the published urban ecosystem services literature was representative of the climatic, HDI, and population density classes, we conducted Chi-square tests to compare the observed number of studies in each class to the number expected given the proportion of urban areas in each category. Separate Chi-square tests were run for the aggregated Köppen-Geiger categories (Table 1), the HDI categories, and the population density categories.

3. Results

3.1. Global Variation in Urban Climate, Human Development, and Population Density

Our sample of 5915 urban areas included all major Köppen classes (Table 1) from tropical to cold continental climates (Figure 1a). More than 30% of urban areas have a hot or warm continental climate, with minimum temperatures falling below −3 °C in the coldest month and reaching at least 22 °C in the warmest month, or each year having at least 4 months with mean temperatures above 10 °C (Table 1). A further 25% of urban areas have a subtropical climate characterised by wet warm seasons and either wet or dry cool seasons, with monthly minimum temperatures ranging between −3 °C in the coldest months and 18 °C in the warmest months (Table 1). Among the remaining cities, many are in regions with a tropical rainforest, savanna, or hot desert climates (Table 1). These cities experience markedly different annual and seasonal patterns in temperature and precipitation, as well as different extreme values of these factors.
Europe, North America, Japan, Australia, and New Zealand have relatively high HDI, while lower values are more typical of the Global South (Figure 1b). The largest number of urban areas (2661) fall into the “very high” HDI bracket, with 2037 classified as “high”, and less than a thousand classified as each of “medium” and “low” HDI. Variation in HDI is likely to impact both demand for ecosystem services and the capacity of cities to supply them. Our analysis shows considerable variation in urban population densities across the world, with generally lower densities in North America, Europe, Japan, and Australia (Figure 1c) than in much of Asia, Africa, and Central America (Figure 1c).

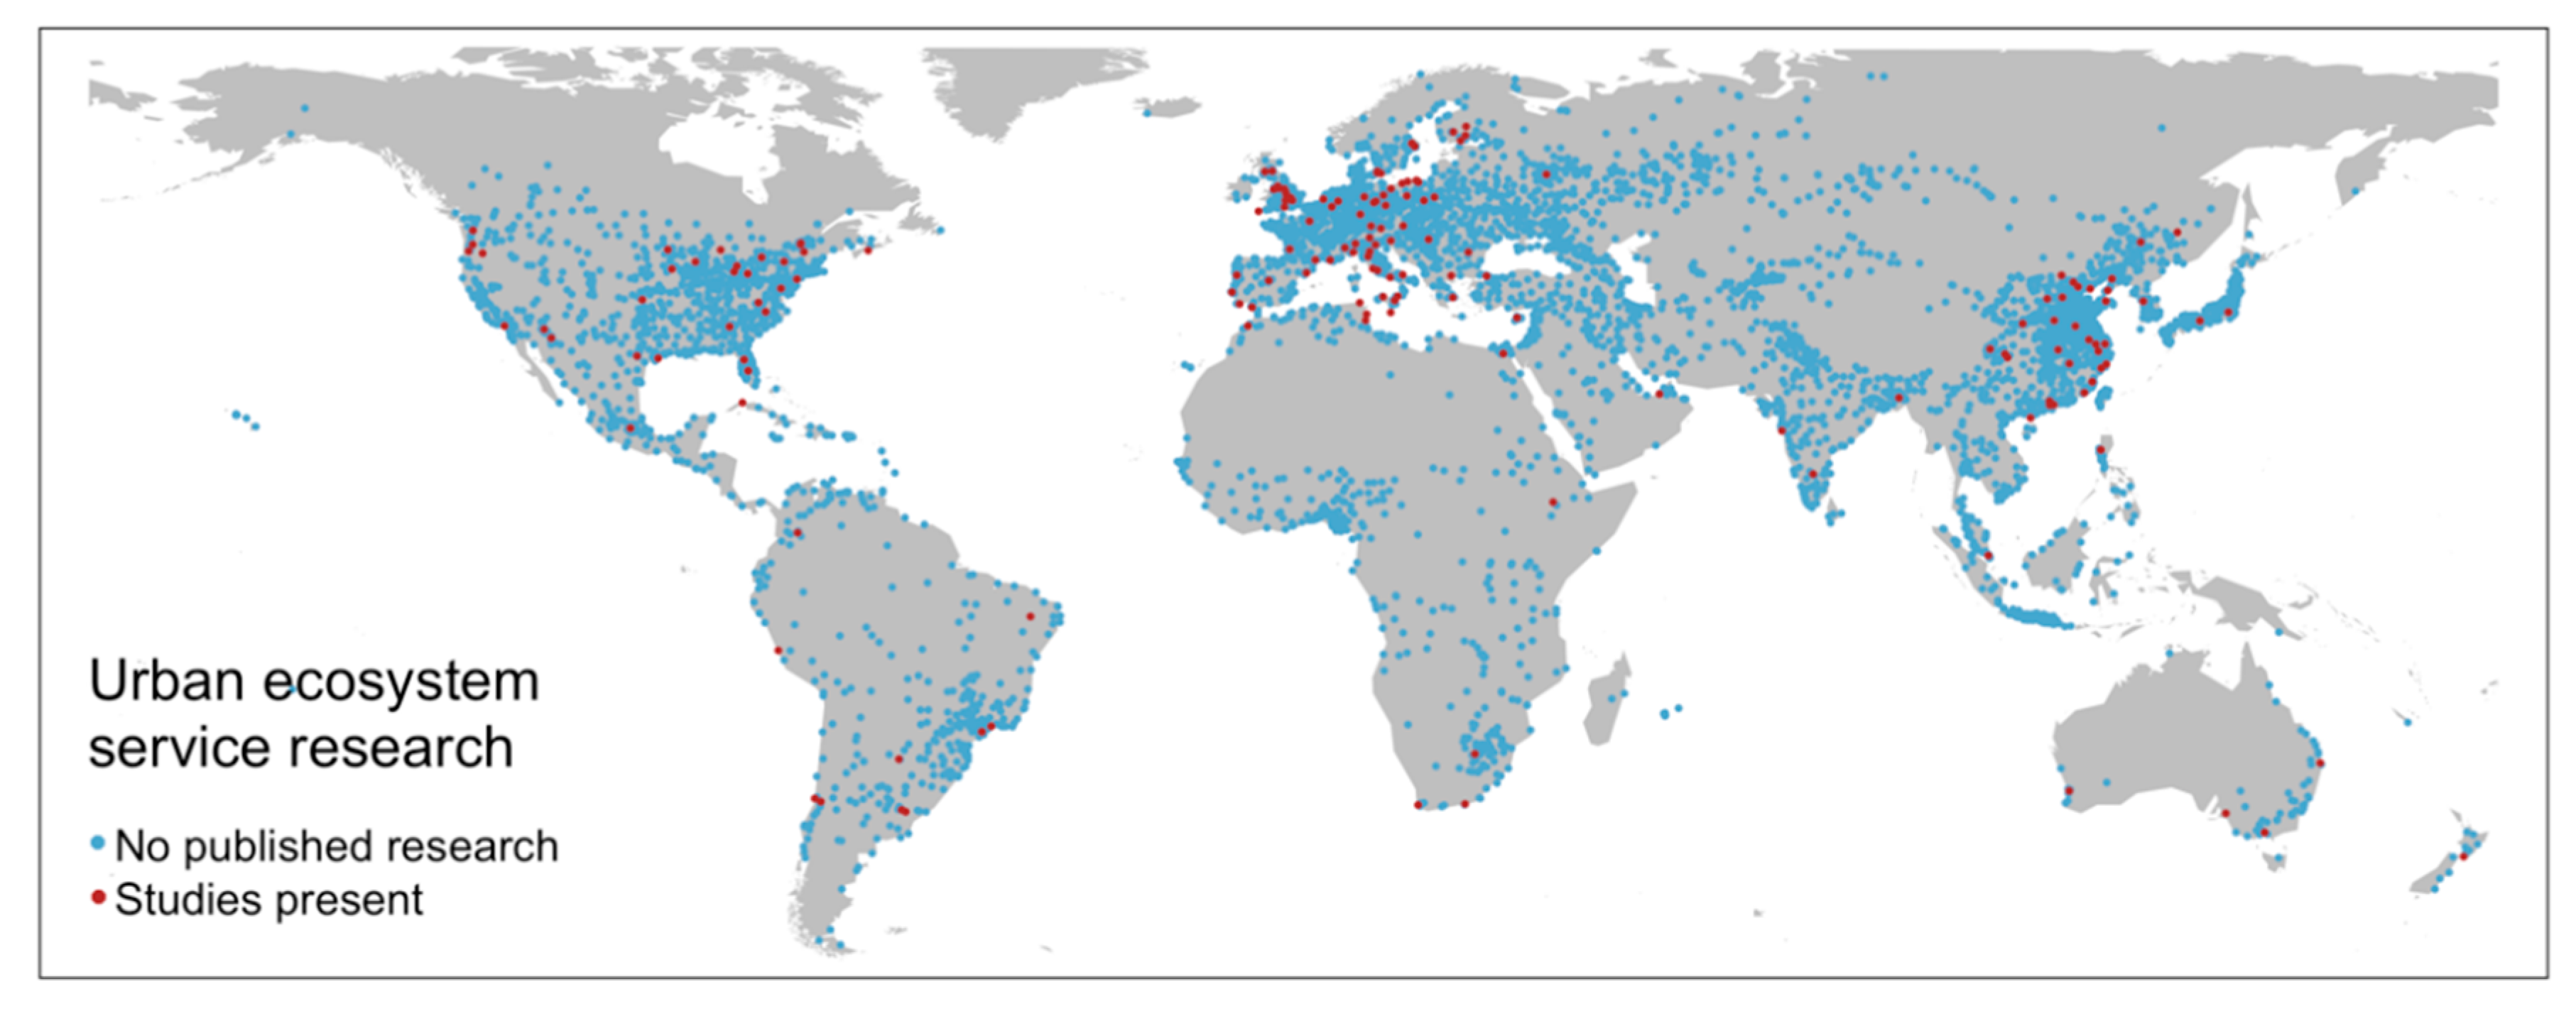
3.2. Representativeness of Published Research into Urban Ecosystem Services

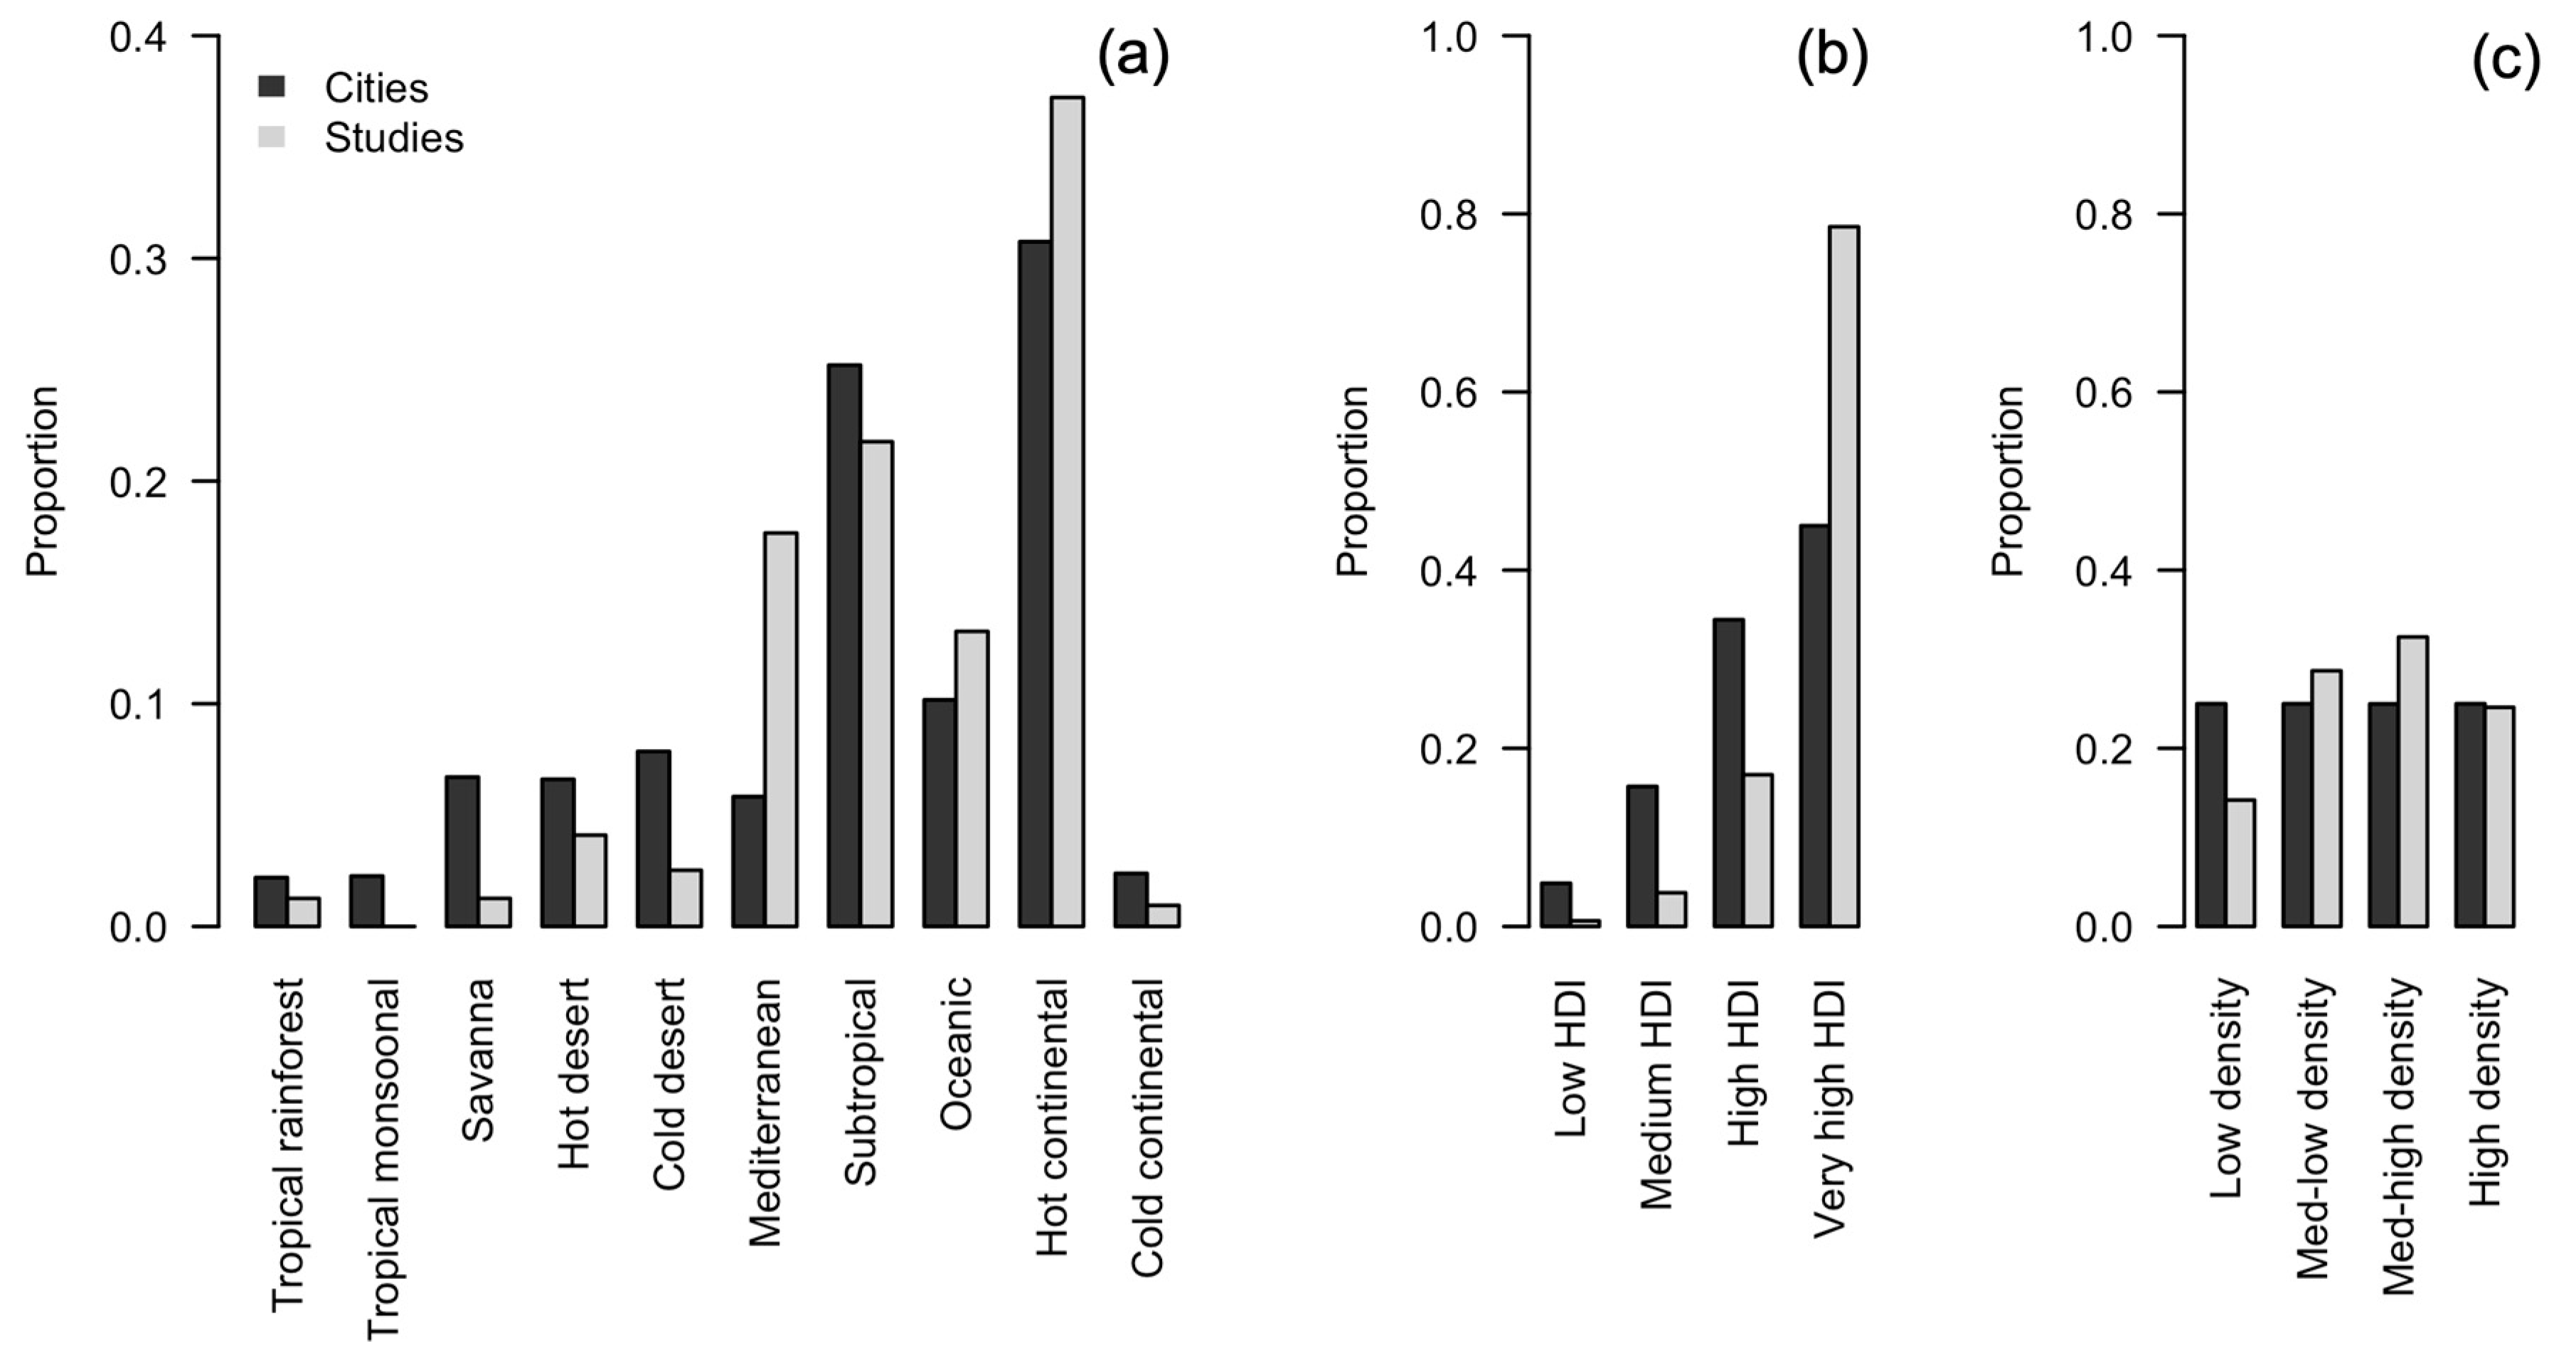
The concept of urban ecosystem services has attracted broad interest across the globe, though most research has been concentrated in cities in Europe, China, and the United States (Figure 2). By contrast, there have been rather few studies in South America, Oceania, Africa, Southeast Asia, and the Middle East (Figure 2). The observed distribution of studies across climate categories was significantly different from the proportion of cities in each category (X2(9, N = 317) = 56.02, p < 0.001). The largest proportion of studies (37%) are from cities with hot continental climates, followed by subtropical (22%), Mediterranean (18%), and oceanic (13%) cities (Figure 3a). As a whole, the number of studies is approximately proportional to the number of cities located in each climatic zone, with two exceptions. There are a considerable number of studies conducted in cities located in the Mediterranean climatic zone (18%), although these cities only constitute a small proportion (6%) of the total number of cities worldwide. By contrast, the number of cities located in the savanna climatic zone is approximately the same (7%) as in the Mediterranean, but there have been very few studies in this climatic zone (2%). Cities in tropical rainforest, tropical monsoonal, hot desert, and cold desert regions have also been relatively under-studied (Figure 3).
Cities with different levels of HDI were significantly unequally represented in studies of ecosystem services (Figure 3b; X2(3, N = 317) = 80.45, p < 0.001). Cities located in regions with “very high” and “high” HDI produced almost 95% of studies (Figure 3). On the other hand, cities with “low” to “medium” HDI constituted 20% of the urban areas worldwide, yet only around 5% of urban ecosystem services studies were produced in these locations. Studies on urban ecosystem services were significantly unequally represented across population density categories (X2(2, N = 317) = 13.24, p = 0.003), although the differences were slight. Medium-high population density urban areas were slightly over-represented while low-density areas were under-represented (Figure 3c).

4. Discussion

4.1. Variation between Cities and Implications for Ecosystem Services

4.1.1. Implications of Climatic Variation for Urban Ecosystem Services

Urban regions cover almost all types of climatic conditions known globally. This variation in climate has implications for the supply and demand of most, if not all, urban ecosystem services. In the following paragraphs we illustrate some of these implications using three examples: local cooling of air temperatures, stormwater regulation, and carbon sequestration.
Cooling of air temperatures. Urban vegetation can reduce air temperatures through increasing evaporative cooling and providing shade [3]. The demand for cooling is influenced by climate, because high air temperatures reduce thermal comfort and may negatively affect health and well-being [13,14,37]. In tropical climates, the need for mitigation is present throughout the year, while in more seasonal climates the problem of high temperatures may be severe for only a few months or weeks each year. The demand for cooling is also influenced by the urban heat island effect, which is itself mediated by climate; for example, the maximum urban heat island (UHI) intensity during dry summer months in temperate cities can be as much as 12 °C, while in the humid tropics it may only be 7 °C [38].
The supply of microclimate cooling ecosystem services is also influenced by the regional climate, because this controls the types of plants and vegetation that can be grown. Within one urban area, different types of vegetation have contrasting impacts on humidity and temperature, thus affecting thermal comfort [39]. At a global scale, forests at different latitudes have different impacts on climate; temperature differences between forests and open land become more negative with increasing latitude [40].
Stormwater regulation. In general, the demand for stormwater regulation is greatest in climates characterised by high rainfall throughout the year, seasonally intense rainfall, or sporadic but extreme precipitation events. Thus, this ecosystem service may be important in very different climates, including regions with a monsoon climate and desert regions that experience occasional extreme rainfall. However, extreme storm events may overload the supply of stormwater regulation in almost every system, a phenomenon that may become more common with climate change [41].
Natural ecosystems are typically adjusted to local rainfall patterns, which means that the supply of stormwater regulation tends to be high in areas with continuously high or seasonally intense rainfall. However, the ecosystems contributing to this regulation, such as swamps, bogs, fens, marshes, ephemeral ponds/streams, flood plains, and other catchments, are often the first to be damaged by human activities. In many cities, the risk of flash flooding has been aggravated by draining wetlands, sealing surfaces, and channelizing rivers [42,43]. Stormwater management in cities can benefit greatly from the preservation of natural waterways, floodplains, and catchments, construction of artificial catchments, and the incorporation of permeable surfaces in a hard-urban cityscape [30].
Carbon sequestration. Storing carbon in ecosystems is a crucial part of the global strategy to mitigate climate change, and urban ecosystems are expected to make some contribution to this effort [44]. While the carbon storage capacity of urban vegetation is small compared to urban emissions [45,46], carbon stocks in the soil can be significant [47]. One of the motivations for urban tree planting schemes around the world [48] is to increase carbon stocks, both in the vegetation itself and in the soil. While the demand for carbon storage is determined mainly by social and political factors, the capacity of urban ecosystems to supply this service is heavily influenced by climate. The average temperature and precipitation are key controls on the type of ecosystem, the rate at which it can develop and sequester carbon, and the location where biomass carbon is allocated [49]. This leads to substantial climate-driven differences in carbon sequestration and storage potential both between (e.g., [50]) and within ecosystems (e.g., for temperate and wet tropical forests [51], and mangrove forests [52]), which control the overall spatial variation in carbon sequestration by vegetation across the planet [53].

4.1.2. Implications of Variation in HDI for Urban Ecosystem Services

The Human Development Index is a composite index of education, life expectancy, and per capita gross national income, and is used as an indicator for the socio-economic characteristics of the urban areas included in this study. Wealth and education are known to influence people’s opinions about the relative importance of ecosystem services [54]. Since average wealth and educational status are components of the HDI, it is likely that cities with different HDI will prioritise ecosystem services differently. In urban areas with lower HDI, people rely to a greater extent on ecosystems to provide basic water supply and sanitation needs [15], and safeguarding these basic services must be a priority. A good example of an ecosystem service that is variably prioritised is urban food production, which is often a recreational activity in wealthy cities but an essential nutritional source for many people in less developed urban areas [16]. The quantity of food produced in some cities can be substantial; 100% of the leafy greens and up to 50% of the tomatoes sold in Phnom Penh, Cambodia, are produced inside the city [55], and Vientiane, Laos, is self-sufficient in rice and leafy greens [56].
The HDI also influences the capacity of a city to provide ecosystem services, as the creation, protection, and maintenance of urban green spaces requires financial inputs and specific expertise [57,58]. In cities with a low HDI, the threats to natural ecosystems and the services they provide are often the most severe. For instance, previous studies have shown that areas with high population growth but low HDI tend to be where deforestation rates were the highest [59]. A more recent study of the threats to protected areas has also found an inverse relationship between human-induced pressures and performance of protected areas and HDI [60]. The wealth of urban areas is positively related to their green cover, suggesting that less wealthy and less green urban areas may suffer from lower provision of a range of ecosystem services [28]. Furthermore, the construction of specific types of urban ecosystem, such as green roofs and green walls, requires expertise that may be unavailable in developing cities [61]. On the other hand, there are also strong economic forces that threaten ecosystem services in developed cities, including high land prices, which increase pressure to build on green areas, and high labour costs, which make maintaining urban greenery expensive [62].

4.1.3. Implications of Population Density Variation for Urban Ecosystem Services

The population density of a city has implications for ecosystem service management because it directly affects the demand for particular services (e.g., those related to recreation and health), as well as the potential for cities to provide urban ecosystem services. Urban areas with higher population densities typically have less urban vegetation per person [28,63]. The residents of densely populated cities are likely to interact less frequently with nature [64] and feel less connected emotionally; they may also undertake fewer outdoor activities, with negative consequences for health and well-being [65,66,67]. For these reasons, the unmet demand for urban green space is likely to be greatest in densely populated cities.
Population density also impacts the potential for cities to provide urban ecosystem services to their residents. The competing demands for land for urban development and land for green spaces are greatest in dense cities where space for housing, roads, and industry is in short supply [21]. High-density cities face many structural and institutional obstacles to the provision of green spaces [21] and ecosystem services, including limited interstitial space, a high proportion of impervious surfaces, and very high land prices.

4.2. Representativeness of Published Research into Urban Ecosystem Services

Most previous research into urban ecosystem services has focused on Europe, China, and the United States, while there has been less work done in South America, Oceania, Africa, Southeast Asia, and the Middle East (Figure 2). This geographical bias means that little information is available about urban ecosystem services for many parts of the world (Figure 2) and for some types of cities (Figure 3). The geographic bias in research related to ecosystem services is similar to that in other research areas such as urban development [68], conservation [69], and ecology generally [70,71].
Mediterranean climates were over-represented in the urban ecosystem services literature, while savanna, tropical rainforest, tropical monsoonal, hot desert, and cold desert climates were under-represented (Figure 3). The climatic bias observed here reflects a well-known bias in ecology away from the tropics [71] and restricts the ability of urban planners in cities with savanna climate, desert, and humid tropical climates to apply ecosystem service concepts in design [25]. The under-representation of lower HDI urban areas is particularly problematic for human well-being, as residents in these areas are typically more dependent on urban ecosystem services [72]. Indeed, research towards improving ecosystem services in such areas could even contribute to reducing socio-economic inequalities.
One reason for the relative neglect of low-density urban or peri-urban settlements may be that they fall between two conventional areas of research focus, the urban and the rural. However, it is important to improve our understanding of ecosystem services in these settings because the area of low density settlement is projected to increase rapidly as urban sprawl continues [73,74]. Urban areas with low population densities may be more amenable to urban designs that facilitate land sharing between people and nature, bringing opportunities to provide ecosystem services within the urban fabric [75,76].

5. Conclusions

Urban areas vary widely in climate, population density, and HDI, and all these factors influence the way that urban ecosystem services must be analysed and managed. Here we focus on three axes of variation in cities for which data are readily available at a global scale. Climate, economic development, and population density are critical variables to consider when developing strategies to improve ecosystem services. Our knowledge about these services in tropical climates is very limited, which means that planners in these climates have little information to draw upon. Similarly, less economically-developed cities are also under-represented, despite the critical importance of ecosystem services for some less wealthy urban residents [15,16]. Where possible, future research into urban ecosystem services should address these gaps in the literature to improve the global applicability of the approach as an urban planning and management framework. Where this is not possible, researchers should address more directly the urban context that they are working in and the transferability of their findings to other urban areas.

Author Contributions

Conceptualization, D.R., M.M., R.R.Y.O., E.S.Y., J.Z., D.A.F., A.G.-R., P.Y.T. and P.J.E.; data collection, D.R., M.M., J.Z., R.R.Y.O. and E.S.Y.; data analysis, D.R.; Writing—Original draft preparation, D.R., E.S.Y. and D.A.F.; Writing—Review and editing, D.R., M.M., R.R.Y.O., E.S.Y., J.Z., D.A.F., P.Y.T. and P.J.E.

Funding

This research was supported by the National Research Foundation, Prime Minister’s Office, Singapore under its Campus for Research Excellence and Technological Enterprise (CREATE) Programme (NRF2016-ITC001-013).

Acknowledgments

We thank the anonymous Reviewers for their helpful feedback which improved this paper.

Conflicts of Interest

The authors declare no conflict of interest. The funders had no role in the design of the study; in the collection, analyses, or interpretation of data; in the writing of the manuscript, or in the decision to publish the results.

References

  1. Elmqvist, T.; Setälä, H.; Handel, S.N.; van der Ploeg, S.; Aronson, J.; Blignaut, J.N.; Gómez-Baggethun, E.; Nowak, D.J.; Kronenberg, J.; de Groot, R. Benefits of restoring ecosystem services in urban areas. Curr. Opin. Environ. Sustain. 2015, 14, 101–108. [Google Scholar] [CrossRef] [Green Version]
  2. Bolund, P.; Hunhammar, S. Ecosystem services in urban areas. Ecol. Econ. 1999, 29, 293–301. [Google Scholar] [CrossRef]
  3. Bowler, D.E.; Buyung-Ali, L.; Knight, T.M.; Pullin, A.S. Urban greening to cool towns and cities: A systematic review of the empirical evidence. Landsc. Urban Plan. 2010, 97, 147–155. [Google Scholar] [CrossRef]
  4. Berland, A.; Shiflett, S.A.; Shuster, W.D.; Garmestani, A.S.; Goddard, H.C.; Herrmann, D.L.; Hopton, M.E. The role of trees in urban stormwater management. Landsc. Urban Plan. 2017, 162, 167–177. [Google Scholar] [CrossRef] [Green Version]
  5. Mcdougall, R.; Kristiansen, P.; Rader, R. Small-scale urban agriculture results in high yields but requires judicious management of inputs to achieve sustainability. Proc. Natl. Acad. Sci. USA 2019, 116, 129–134. [Google Scholar] [CrossRef]
  6. Wolch, J.R.; Byrne, J.; Newell, J.P. Urban green space, public health, and environmental justice: The challenge of making cities “just green enough”. Landsc. Urban Plan. 2014, 125, 234–244. [Google Scholar] [CrossRef]
  7. Mcdonnell, M.J.; Macgregor-Fors, I. The ecological future of cities. Science 2016, 352, 936–938. [Google Scholar] [CrossRef]
  8. Wu, J. Urban ecology and sustainability: The state-of-the-science and future directions. Landsc. Urban Plan. 2014, 125, 209–221. [Google Scholar] [CrossRef]
  9. Zhou, Y.; Smith, S.J.; Zhao, K.; Imhoff, M.; Thomson, A.; Bond-Lamberty, B.; Asrar, G.R.; Zhang, X.; He, C.; Elvidge, C.D. A global map of urban extent from nightlights. Environ. Res. Lett. 2015, 10, 054011. [Google Scholar] [CrossRef]
  10. Nagendra, H.; Bai, X.; Brondizio, E.S.; Lwasa, S. The urban south and the predicament of global sustainability. Nat. Sustain. 2018, 1, 341–349. [Google Scholar] [CrossRef]
  11. Freire, S.; Pesaresi, M. GHS Population Grid, Derived from GPW4, Multitemporal (1975, 1990, 2000, 2015). Available online: https://data.europa.eu/euodp/en/data/dataset/jrc-ghsl-ghs_pop_gpw4_globe_r2015a (accessed on 1 October 2018).
  12. Kottek, M.; Grieser, J.; Beck, C.; Rudolf, B.; Rubel, F. World map of the Köppen-Geiger climate classification updated. Meteorol. Z. 2006, 15, 259–263. [Google Scholar] [CrossRef]
  13. Jendritzky, G.; Tinz, B. The thermal environment of the human being on the global scale. Glob. Health Action 2009. [Google Scholar] [CrossRef] [PubMed]
  14. Mora, C.; Dousset, B.; Caldwell, I.R.; Powell, F.E.; Geronimo, R.C.; Bielecki, C.R.; Counsell, C.W.W.; Dietrich, B.S.; Johnston, E.T.; Louis, L.V.; et al. Global risk of deadly heat. Nat. Clim. Chang. 2017, 7, 501–506. [Google Scholar] [CrossRef]
  15. Vollmer, D.; Grêt-Regamey, A. Rivers as municipal infrastructure: Demand for environmental services in informal settlements along an Indonesian river. Glob. Environ. Chang. 2013, 23, 1542–1555. [Google Scholar] [CrossRef]
  16. Zezza, A.; Tasciotti, L. Urban agriculture, poverty, and food security: Empirical evidence from a sample of developing countries. Food Policy 2010, 35, 265–273. [Google Scholar] [CrossRef]
  17. Tsai, Y.H. Quantifying urban form: Compactness versus “sprawl”. Urban Stud. 2005, 42, 141–161. [Google Scholar] [CrossRef]
  18. Soga, M.; Gaston, K.J. Extinction of experience: The loss of human-nature interactions. Front. Ecol. Environ. 2016, 14, 94–101. [Google Scholar] [CrossRef]
  19. Song, X.P.; Tan, P.Y.; Edwards, P.; Richards, D. The economic benefits and costs of trees in urban forest stewardship: A systematic review. Urban For. Urban Green. 2018, 29, 162–170. [Google Scholar] [CrossRef]
  20. Keeler, B.L.; Hamel, P.; McPhearson, T.; Hamann, M.H.; Donahue, M.L.; Meza Prado, K.A.; Arkema, K.K.; Bratman, G.N.; Brauman, K.A.; Finlay, J.C.; et al. Social-ecological and technological factors moderate the value of urban nature. Nat. Sustain. 2019, 2, 29–38. [Google Scholar] [CrossRef]
  21. Jim, C. Green-space preservation and allocation for sustainable greening of compact cities. Cities 2004, 21, 311–320. [Google Scholar] [CrossRef]
  22. Gómez-Baggethun, E.; Barton, D.N. Classifying and valuing ecosystem services for urban planning. Ecol. Econ. 2013, 86, 235–245. [Google Scholar] [CrossRef]
  23. Tratalos, J.; Fuller, R.A.; Warren, P.H.; Davies, R.G.; Gaston, K.J. Urban form, biodiversity potential and ecosystem services. Landsc. Urban Plan. 2007, 83, 308–317. [Google Scholar] [CrossRef]
  24. Luederitz, C.; Brink, E.; Gralla, F.; Hermelingmeier, V.; Meyer, M.; Niven, L.; Panzer, L.; Partelow, S.; Rau, A.-L.; Sasaki, R.; et al. A review of urban ecosystem services: Six key challenges for future research. Ecosyst. Serv. 2015, 14, 98–112. [Google Scholar] [CrossRef]
  25. Song, X.P.; Richards, D.; Edwards, P.J.; Tan, P.Y. Benefits of trees in tropical cities. Science 2017, 356, 6344. [Google Scholar] [CrossRef] [PubMed]
  26. Plummer, M.L. Assessing benefit transfer for the valuation of ecosystem services. Front. Ecol. Environ. 2009, 7, 38–45. [Google Scholar] [CrossRef] [Green Version]
  27. Wu, L.; Wang, Z.; Mao, X. How multilateral financial institutions promote sustainable water infrastructure planning through economic appraisal: Case studies from coastal cities of China. J. Environ. Plan. Manag. 2018, 61, 1402–1418. [Google Scholar] [CrossRef]
  28. Richards, D.R.; Passy, P.; Oh, R.R.Y. Impacts of population density and wealth on the quantity and structure of urban green space in tropical Southeast Asia. Landsc. Urban Plan. 2017, 157, 553–560. [Google Scholar] [CrossRef]
  29. Esch, T.; Heldens, W.; Hirner, A.; Keil, M.; Marconcini, M.; Roth, A.; Zeidler, J.; Dech, S.; Strano, E. Breaking new ground in mapping human settlements from space—The Global Urban Footprint. ISPRS J. Photogramm. Remote Sens. 2017, 134, 30–42. [Google Scholar] [CrossRef]
  30. Richards, D.R.; Edwards, P.J. Using water management infrastructure to address both flood risk and the urban heat island. Int. J. Water Resour. Dev. 2018, 34, 490–498. [Google Scholar] [CrossRef]
  31. Manoli, G.; Fatichi, S.; Schläpfer, M.; Yu, K.; Thomas, W.; Katul, G.G.; Bou-zeid, E. Magnitude of urban heat islands largely explained by climate and population. Nature 2019, 573, 55–60. [Google Scholar] [CrossRef]
  32. Qi, W.; Liu, S.; Gao, X.; Zhao, M. Modeling the spatial distribution of urban population during the daytime and at night based on land use: A case study in Beijing, China. J. Geogr. Sci. 2015, 25, 756–768. [Google Scholar] [CrossRef]
  33. Wilson, J.; Tyedmers, P.; Pelot, R. Contrasting and comparing sustainable development indicator metrics. Ecol. Indic. 2007, 7, 299–314. [Google Scholar] [CrossRef]
  34. Kummu, M.; Taka, M.; Guillaume, J.H.A. Data Descriptor: Gridded global datasets for Gross Domestic Product and Human Development Index over 1990–2015. Sci. Data 2018, 5, 180004. [Google Scholar] [CrossRef]
  35. Dobbs, C.; Nitschke, C.R.; Kendal, D. Global Drivers and Tradeoffs of Three Urban Vegetation Ecosystem Services. PLoS ONE 2014, 9, e113000. [Google Scholar] [CrossRef] [PubMed]
  36. Human Development Indices and Indicators: 2018 Statistical Update. Available online: http://hdr.undp.org/en/content/human-development-indices-indicators-2018-statistical-update (accessed on 1 October 2018).
  37. Lan, L.; Lian, Z.; Pan, L. The effects of air temperature on office worker’s well-being, workload and productivity-evaluated with subjective ratings. Appl. Ergon. 2010, 42, 29–36. [Google Scholar] [CrossRef] [PubMed]
  38. Roth, M. Review of urban climate research in (sub)tropical regions. Int. J. Climatol. 2007, 26, 1859–1873. [Google Scholar] [CrossRef]
  39. Zhang, Z.; Lv, Y.; Pan, H. Cooling and humidifying effect of plant communities in subtropical urban parks. Urban For. Urban Green. 2013, 12, 323–329. [Google Scholar] [CrossRef]
  40. Lee, X.; Goulden, M.L.; Hollinger, D.Y.; Barr, A.; Black, T.A.; Bohrer, G.; Bracho, R.; Drake, B.; Goldstein, A.; Gu, L.; et al. Observed increase in local cooling effect of deforestation at higher latitudes. Nature 2011, 479, 384–387. [Google Scholar] [CrossRef]
  41. Huong, H.T.L.; Pathirana, A. Urbanization and climate change impacts on future urban flooding in Can Tho city, Vietnam. Hydrol. Earth Syst. Sci. 2013, 17, 379–394. [Google Scholar] [CrossRef] [Green Version]
  42. Marsalek, J.; Schreier, H. Innovation in stormwater management in canada: The way forward. Water Qual. Res. J. Can. 2009, 44. [Google Scholar] [CrossRef]
  43. Barbosa, A.E.; Fernandes, J.N.; David, L.M. Key issues for sustainable urban stormwater management. Water Res. 2012, 46, 6787–6798. [Google Scholar] [CrossRef] [PubMed]
  44. Nowak, D.J.; Crane, D.E. Carbon storage and sequestration by urban trees in the USA. Environ. Pollut. 2002, 116, 381–389. [Google Scholar] [CrossRef]
  45. Velasco, E.; Roth, M.; Norford, L.; Molina, L.T. Does urban vegetation enhance carbon sequestration? Landsc. Urban Plan. 2016, 148, 99–107. [Google Scholar] [CrossRef]
  46. Zhao, S.; Tang, Y.; Chen, A. Carbon Storage and Sequestration of Urban Street Trees in Beijing, China. Front. Ecol. Evol. 2016, 4, 1–8. [Google Scholar] [CrossRef]
  47. Edmondson, J.L.; Davies, Z.G.; McHugh, N.; Gaston, K.J.; Leake, J.R. Organic carbon hidden in urban ecosystems. Sci. Rep. 2012, 2, 1–7. [Google Scholar] [CrossRef] [PubMed]
  48. Schadler, E.; Danks, C. Carbon Offsetting through Urban Tree Planting; University of Vermont: Burlington, VT, USA, 2011. [Google Scholar]
  49. Reich, P.B.; Luo, Y.; Bradford, J.B.; Poorter, H.; Perry, C.H.; Oleksyn, J. Temperature drives global patterns in forest biomass distribution in leaves, stems, and roots. Proc. Natl. Acad. Sci. USA 2014, 111, 13721–13726. [Google Scholar] [CrossRef] [Green Version]
  50. Saatchi, S.; Harris, N.; Brown, S.; Lefsky, M.; Mitchard, E.; Salas, W.; Zutta, B.; Buermann, W.; Lewis, S.; Hagen, S.; et al. Benchmark map of forest carbon stocks in tropical regions across three continents. Proc. Natl. Acad. Sci. USA 2011, 108, 9899–9904. [Google Scholar] [CrossRef] [Green Version]
  51. Stegen, J.C.; Swenson, N.G.; Enquist, B.J.; White, E.P.; Phillips, O.L.; Jørgensen, P.M.; Weiser, M.D.; Monteagudo Mendoza, A.; Núñez Vargas, P. Variation in above-ground forest biomass across broad climatic gradients. Glob. Ecol. Biogeogr. 2011, 20, 744–754. [Google Scholar] [CrossRef]
  52. Simard, M.; Fatoyinbo, L.; Smetanka, C.; Rivera-Monroy, V.H.; Castañeda-Moya, E.; Thomas, N.; Van der Stocken, T. Mangrove canopy height globally related to precipitation, temperature and cyclone frequency. Nat. Geosci. 2019, 12, 40–45. [Google Scholar] [CrossRef]
  53. Beer, C.; Reichstein, M.; Tomelleri, E.; Ciais, P.; Jung, M.; Carvalhais, N.; Rödenbeck, C.; Arain, M.A.; Baldocchi, D.; Bonan, G.B.; et al. Terrestrial gross carbon dioxide uptake: Global distribution and covariation with climate. Science 2010, 329, 834–838. [Google Scholar] [CrossRef]
  54. Lau, J.D.; Hicks, C.C.; Gurney, G.G.; Cinner, J.E. What matters to whom and why? Understanding the importance of coastal ecosystem services in developing coastal communities. Ecosyst. Serv. 2019, 35, 219–230. [Google Scholar] [CrossRef]
  55. Sokhen, C.; Kanika, D. Vegetable Market Flows and Chains in Phnomh Penh; Asian Vegetable Research and Development Centre: Tainan, Taiwan, 2004; pp. 844–876. [Google Scholar]
  56. Kethonga, S.; Thadavong, K.; Moustier, P. Vegetable Marketing in Vientiane; Asian Vegetable Research and Development Centre: Tainan, Taiwan, 2004. [Google Scholar]
  57. Monkkonen, P. Urban land-use regulations and housing markets in developing countries: Evidence from Indonesia on the importance of enforcement. Land Use Policy 2013, 34, 255–264. [Google Scholar] [CrossRef] [Green Version]
  58. du Toit, M.J.; Cilliers, S.S.; Dallimer, M.; Goddard, M.; Guenat, S.; Cornelius, S.F. Urban green infrastructure and ecosystem services in sub-Saharan Africa. Landsc. Urban Plan. 2018, 180, 249–261. [Google Scholar] [CrossRef]
  59. Jha, S.; Bawa, K.S. Population growth, human development, and deforestation in biodiversity hotspots. Conserv. Biol. 2006, 20, 906–912. [Google Scholar] [CrossRef] [PubMed]
  60. Geldmann, J.; Joppa, L.N.; Burgess, N.D. Mapping Change in Human Pressure Globally on Land and within Protected Areas. Conserv. Biol. 2014, 28, 1604–1616. [Google Scholar] [CrossRef]
  61. Jim, C.Y. Planning strategies to overcome constraints on greenspace provision in urban Hong Kong. Town Plan. Rev. 2009, 73, 127–152. [Google Scholar] [CrossRef]
  62. Richards, D.R.; Thompson, B.S. Urban ecosystems: A new frontier for payments for ecosystem services. People Nat. 2019. [Google Scholar] [CrossRef]
  63. Fuller, R.A.; Gaston, K.J. The scaling of green space coverage in European cities. Biol. Lett. 2009, 5, 352–355. [Google Scholar] [CrossRef] [Green Version]
  64. Soga, M.; Yamaura, Y.; Aikoh, T.; Shoji, Y.; Kubo, T.; Gaston, K.J. Reducing the extinction of experience: Association between urban form and recreational use of public greenspace. Landsc. Urban Plan. 2015, 143, 69–75. [Google Scholar] [CrossRef]
  65. Maas, J.; van Dillen, S.M.E.; Verheij, R.A.; Groenewegen, P.P. Social contacts as a possible mechanism behind the relation between green space and health. Heal. Place 2009, 15, 586–595. [Google Scholar] [CrossRef] [Green Version]
  66. Alcock, I.; White, M.P.; Wheeler, B.W.; Fleming, L.E.; Depledge, M.H. Longitudinal Effects on Mental Health of Moving to Greener and Less Green Urban Areas. Environ. Sci. Technol. 2014, 48, 1247–1255. [Google Scholar] [CrossRef] [PubMed]
  67. Lachowycz, K.; Jones, A.P. Greenspace and obesity: A systematic review of the evidence. Obes. Rev. 2011, 12, 183–189. [Google Scholar] [CrossRef] [PubMed]
  68. Kanai, J.M.; Grant, R.; Jianu, R. Cities on and off the map: A bibliometric assessment of urban globalisation research. Urban Stud. 2018, 55, 2569–2585. [Google Scholar] [CrossRef]
  69. Shwartz, A.; Turbé, A.; Julliard, R.; Simon, L.; Prévot, A.C. Outstanding challenges for urban conservation research and action. Glob. Environ. Chang. 2014, 28, 39–49. [Google Scholar] [CrossRef]
  70. Martin, L.J.; Blossey, B.; Ellis, E. Mapping where ecologists work: Biases in the global distribution of terrestrial ecological observations. Front. Ecol. Environ. 2012, 10, 195–201. [Google Scholar] [CrossRef]
  71. Millard, J.W.; Freeman, R.; Newbold, T. Text-analysis reveals taxonomic and geographic disparities in animal pollination literature. Ecography 2019, in press. [Google Scholar] [CrossRef]
  72. Hamann, M.; Biggs, R.; Reyers, B. Mapping social–ecological systems: Identifying ‘green-loop’ and ‘red-loop’ dynamics based on characteristic bundles of ecosystem service use. Glob. Environ. Chang. 2015, 34, 218–226. [Google Scholar] [CrossRef]
  73. Terando, A.J.; Costanza, J.; Belyea, C.; Dunn, R.R.; McKerrow, A.; Collazo, J.A. The southern megalopolis: Using the past to predict the future of urban sprawl in the Southeast U.S. PLoS ONE 2014, 9. [Google Scholar] [CrossRef]
  74. Cohen, B. Urbanization in developing countries: Current trends, future projections, and key challenges for sustainability. Technol. Soc. 2006, 28, 63–80. [Google Scholar] [CrossRef]
  75. Soga, M.; Yamaura, Y.; Koike, S.; Gaston, K.J. Land sharing vs. land sparing: Does the compact city reconcile urban development and biodiversity conservation? J. Appl. Ecol. 2014, 51, 1378–1386. [Google Scholar] [CrossRef]
  76. Lin, B.B.; Fuller, R.A. FORUM: Sharing or sparing? How should we grow the world’s cities? J. Appl. Ecol. 2013, 50, 1161–1168. [Google Scholar]
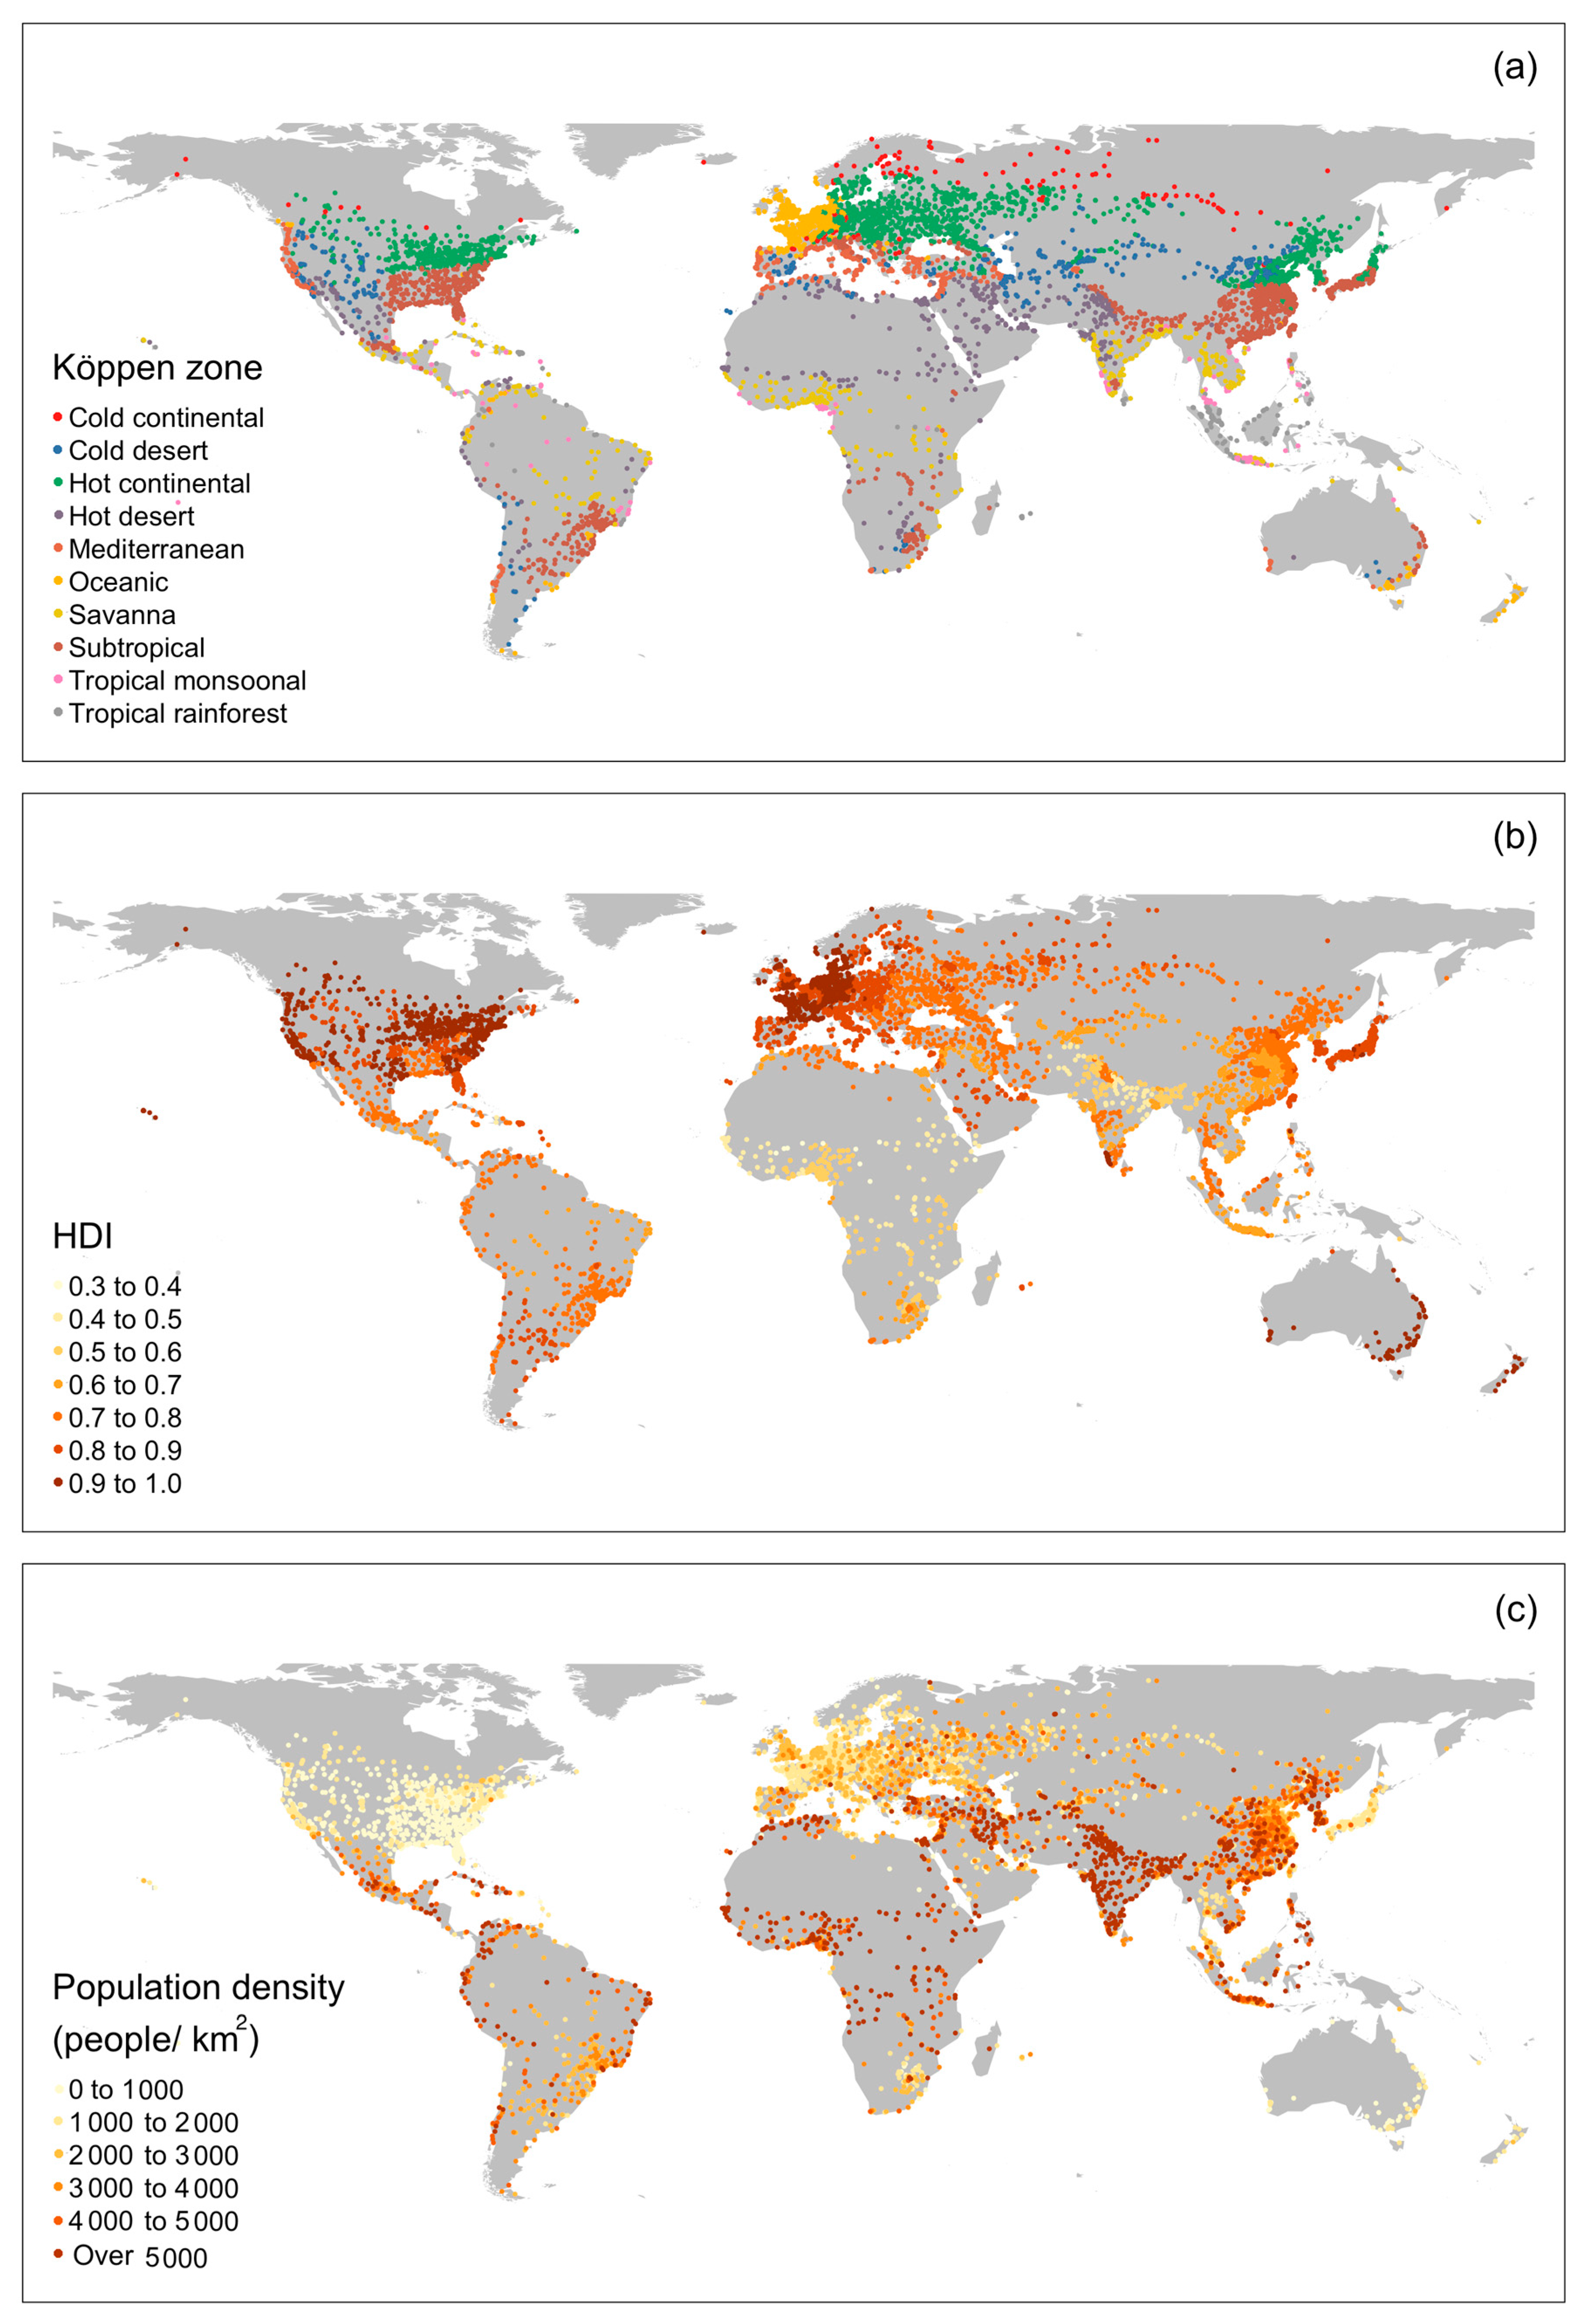
Figure 1. (a) Climatic, (b) socio-economic, and (c) population density variation across 5915 urban areas globally. Legend: HDI, Human Development Index.
Sustainability 11 06200 g001
Figure 2. Locations of 174 urban areas in which urban ecosystem service research has previously been conducted.
Sustainability 11 06200 g002
Figure 3. Proportional representation of cities (dark grey bars) and studies (light grey bars) across (a) climatic, (b) socio-economic, and (c) population density categories. Proportion of cities is the proportion of 5915 urban areas falling within each category, proportion of studies is the proportion of 332 observations of urban ecosystem services research conducted in individual urban areas.
Sustainability 11 06200 g003
Table 1. Climate zones summarized from the Köppen classification. Pth is the dryness threshold parameter used in climatology and is defined according to the Köppen-Geiger climate classification [12]. The total number of urban areas analyzed was 5915.
Climate ZoneKöppen Climate Zones IncludedDescriptionNumber of Urban Areas
1. Tropical rainforestAfMinimum temperature of coldest month above 18 °C, precipitation of the driest month above 60 mm130
2. Tropical monsoonAmMinimum temperature of coldest month above 18 °C, accumulated annual precipitation above 25 (100—minimum precipitation of the driest month)134
3. SavannaAwMinimum temperature of coldest month above 18 °C, precipitation of the driest month above 60 mm in winter397
4. Hot desert or aridBWh, BShMean temperature for the year above or equal to 18 °C, annual precipitation less than 10× Pth391
5. Cold desert or aridBWk, BSkMean temperature for the year below or equal to 18 °C, annual precipitation less than 10× Pth465
6. MediterraneanCsa, Csb, CscMinimum temperature of coldest month above −3 °C and temperature minimum of warmest month no greater than 18 °C, dry warm seasons with minimum monthly precipitation in cold seasons greater than the warm seasons, cold season maximum precipitation greater than 3× warm season minimum precipitation, and warm season minimum precipitation less than 40 mm/month.345
7. SubtropicalCwa, Cwb, Cwc, CfaMinimum temperature of coldest month above −3 °C and minimum temperature of warmest month no more than 18 °C, dry cold seasons with minimum cold season precipitation less than warm season minimum precipitation and warm season maximum precipitation greater than 10× cold season minimum precipitation; also includes areas with wet humid conditions year round and temperature maximums >22 °C1491
8. OceanicCfb, CfcMinimum temperature of coldest month above −3 °C and minimum temperature of warmest month no more than 18 °C, wet and humid conditions year round, and at least 4 months with mean temperatures greater than 10 °C or minimum temperatures of the coldest month no less than −38 °C, but no maximum temperatures greater than 22 °C602
9. Hot or warm continentalDsa, Dsb, Dwa, Dwb, Dfa, DfbMinimum temperature of coldest month less than −3 °C and summer maximum temperatures greater than 22 °C or at least 4 months with mean temperatures above 10 °C1819
10. Cold continentalDsc, Dsd, Dwc, Dwd, Dfc, DfdMinimum temperature of coldest month less than −3 °C, maximum temperatures no more than 22 °C, and no more than 3 months with mean temperatures above 10 °C141