Abstract
Reducing fuel consumption and emissions of aircrafts during taxiing on airport surfaces is crucial to decrease the operating costs of airline companies and construct green airports. At present, relevant studies have barely investigated the influences of the operation environment, such as low visibility and traffic conflict in airports, reducing the assessment accuracy of fuel consumption and emissions. Multiple aircraft ground propulsion systems on airport surfaces, especially the electric green taxiing system, have attracted wide attention in the industry. Assessing differences in fuel consumption and emissions under different taxiing modes is difficult because environmental factors were hardly considered in previous assessments. Therefore, an innovative study was conducted based on practical running data of quick access recorders and climate data: (1) Low visibility and taxiing conflict on airport surfaces were inputted into the calculation model of fuel consumption to set up a modified model of fuel consumption and emissions. (2) Fuel consumption and emissions models under full- and single-engine taxiing, external aircraft ground propulsion systems, and electric green taxiing system could accurately estimate fuel consumption and emissions under different taxiing modes based on the modified model. (3) Differences in fuel consumption and emissions of various aircraft types under four taxiing modes under stop-and-go and unimpeded aircraft taxiing conditions were obtained through a sensitivity analysis in Shanghai Pudong International Airport under three thrust levels. Research conclusions provide support to the airport management department in terms of decision making on taxiway optimization.
1. Introduction
With the continuous growth of air transportation demands globally, air traffic has caused serious impacts on global and regional environments. The pollutants included in the Databank of the International Civil Aviation Organization (ICAO) are HC, CO, and NOx [1,2]. Carbon emissions produced by civil air transport accounts for approximately 2% of total carbon emissions produced by human activities [3]. By 2040, CO2 and NOX emissions are predicted to increase by at least 21% and 16%, respectively, according to the reports of the European Environment Agency [4]. During aircraft taxiing, fuel consumption accounts for 6% of the total fuel consumption in short-haul flights, and the annual total fuel consumption worldwide is 5 million tons [5]. Aircraft fuel cost, an important cost component of airline companies, accounts for more than 35% of the operating cost of airline companies [6]. In addition to air transport costs, many taxiing aircrafts on large airport surfaces may produce considerably high concentrations of pollutant gas, which remarkably influence the surrounding air quality of airports [7]. The influences of emissions from taxiing aircrafts on the environment and physical health of humans are gradually intensifying. A study on aircraft emissions in the Mytilene International Airport (Greece) reported that the mass concentration of particulates caused by aircraft activities has increased by 10 times; specifically, the particulate concentration during take-off has increased by two orders of magnitudes [8]. Therefore, a model of the health cost due to airport pollution was constructed. In this model, every 1000 t emissions of PM2.5 in 500 km may cause 3–160 deaths [9]. Therefore, setting up a calculation model of fuel consumption conforming to practical taxiing and choosing an energy-saving and environmentally friendly taxiing mode will not only effectively lower fuel consumption cost but also is crucial to carbon emissions reduction and environmental protection in airports.
Civil aviation administrations, airline companies, and airports have been focusing their attention on energy-saving, emission reduction, and fuel utilization during aircraft taxiing. For example, ICAO [10] developed an engine emission database to estimate fuel consumption and emissions of aircrafts. In the comprehensive environmental protection statement, all members are required to optimize air traffic management to relieve environmental influences. The Aviation System Block Upgrade proposed by ICAO is aimed at a 2% annual increase in civil aircraft fuel efficiency by 2050 [3]. The International Air Transport Association indicated that the annual average fuel efficiency of the air transport industry will increase by 1.5% from 2013 to 2020 [6]. The Single European Sky ATM Research (SESAR) program [11,12] comes up with integrated surface management techniques for improving airport operations. Several studies have theoretically investigated the influences of engine thrust levels on fuel consumption and emissions by calculating and modeling fuel consumption for taxiing on airport surfaces [13,14,15]. Furthermore, many aviation operation management organizations have developed relevant tools to estimate fuel consumption and emissions of aircrafts under different thrust levels. Such tools include the following: the Aviation Environmental Design Tool developed by the Federal Aviation Administration and National Aeronautics and Space Administration [16], environmental assessment tool kit advanced emission model for global fuel/emission impact assessments, airport local air quality studies for detailed airport air quality assessments, and an integrated aircraft noise and emission modeling platform for advanced fuel/emission and noise impact assessments proposed by EUROCONTROL [17]. These tools can accurately estimate airport operation efficiency.
The airport operation efficiency can be accurately assessed by analyzing fuel consumption and emissions under different thrust levels. However, most studies calculate fuel consumption and emissions using the fuel consumption model under the ideal state and the fuel emission model of ICAO, respectively. The practical assessment accuracy is low because fuel consumption and emissions are often sensitive to changes in the operating environment, such as low visibility and traffic conflict. Therefore, this study aimed to construct a modified model for fuel consumption and emissions calculation of aircrafts under different taxiing modes, with considerations to visibility and taxiing conflict [18]. The fuel consumption of different types of aircrafts under varying taxiing modes was compared based on actual quick access recorder (QAR) and weather data in Shanghai Pudong Airport. Results provide some references to the airport management department in terms of decision making on taxiway optimization. The main contributions and innovations of this study are summarized as follows.
(1) In this study, a statistical analysis of the QAR data of flights was conducted to acquire the influencing coefficient of low visibility on taxiing time. This influencing coefficient was input into the calculation model of fuel consumption and emissions. The acceleration and deceleration states at taxiing conflict were input into the calculation model based on the calculation of engine thrust level under different taxiing modes upon taxiing conflict. The accuracy of the calculated results was protected on the basis of such modification, and the results were close to practical situations.
(2) Compared with conventional taxiing, single-engine taxiing, external aircraft ground propulsion systems (AGPS), and on-board AGPS under the ideal state [19], a calculation model of fuel consumption and emissions under four taxiing modes with considerations to visibility and taxiing conflict was constructed.
(3) In contrast to the method that determines airport emission level by calculating total emissions of the airport [1], this study analyzed sensitivity under three thrust levels based on the constructed calculation model and disclosed differences in fuel consumption and emissions of four common taxiing modes.
The remainder of this study is organized as follows. Section 2 analyzes the influencing coefficient of low-visibility weather on taxiing time by calculating and analyzing the QAR data and categorizes aircraft taxiing conflict into different taxiing states. These taxiing states were input into the calculation model of fuel consumption and emissions. Section 3 sets up a modified calculation model of aircraft fuel consumption and emissions under four taxiing modes based on the modified model in Section 2 with considerations to influences of low-visibility weather and taxiing conflict. Section 4 conducts four groups of comparative experiments based on a taxiway in Shanghai Pudong International Airport. Section 5 summarizes the conclusions and prospects.
2. Literature Review
This section presents a concise literature survey on existing research efforts related to the mathematical models used in the assessment of taxiing problems, such as fuel consumption and emissions, on airport surfaces. A brief survey is also provided. The survey particularly focused on categorization according to the following issues: (1) assessment model and methods and (2) traction taxiing modes.
2.1. Fuel Consumption and Emissions Assessment Model and Aircraft Taxiing Methods
A vast amount of research on fuel consumption and carbon emission optimization for taxiing aircrafts in airports has been conducted in recent decades. Morris [13] demonstrated that the full-rated power level of approximately 5–6% of engines was practical for most engine modes. Nikoleris et al. [1] applied one group of four different values in various taxiing stages: idling thrust (4%), taxiing at constant speed or brake thrust (5%), perpendicular turn thrust (7%), and breakaway thrust (9%). In studies concerning air quality in the British Airport and its influences on public health, Stettler et al. [14] applied a 4–7% setting (uniformly random distribution averaging at 5.5%) at taxiing (to maintain a constant speed or deceleration) and used a 7–17% setting at taxiway acceleration. Wey et al. [15] indicated that engine fuel flow was approximately proportional to the engine thrust setting. Atkin et al. [20,21], Marín et al. [22], and Roling et al. [23] shortened the total taxiing time by studying the relationship between fuel consumption and taxiing time, thereby improving the operation efficiency and reducing fuel consumption of airports. Atkin et al. [24] calculated the speed curve during aircraft taxiing by establishing a model to prevent unnecessary fuel consumption and emissions caused by acceleration and idling. Lesire [25] applied post-processing in the route method to smoothen the speed curve and evaluate environmental impacts. Based on data of the Airport Surface Detection Equipment—Model X and flight data recorder, Khadilkar [26] constructed a calculation model of aircraft fuel consumption and emissions during the taxiing stage according to taxiing time and number of turnings, stops, and accelerations. He also proposed a method to estimate fuel consumption based on linear regression and concluded that total taxiing time was the major influencing factor. Furthermore, Khadilkar [26] found that the number of acceleration events is an important factor. However, the influences of low-visibility weather were neglected in the modeling of fuel consumption and emissions. Chen and Stewart [27] proposed a method to analyze the balance between taxiing time and fuel consumption for determining the single track of an unimpeded aircraft. Evertse and Visser [28] divided taxiing into four states, namely, breakaway and acceleration, taxiing at constant speed, idling during a hold, and turning. Fuel consumption was calculated according to the thrust levels under different states to establish a calculation model of fuel consumption and emissions. Weiszer et al. [29] proposed a priority, multigoal, evolved optimization framework to solve the complicated ground motion optimization by combining runway scheduling and surface taxiing in airports. Accordingly, the optimal Pareto solution set with the minimum cost for taxiing time, fuel consumption, and emissions was obtained. The engine power of taxiing/surface idling was set to 7% of full-rated power. However, taxiing was not divided into different stages.
To sum up, different taxiing states have usually been used to calculate different thrust levels in the past research, without considering the actual conflict in the process of aircraft taxiing. According to the taxiing state that the aircraft experiences when encountering the conflict, the influence of the taxiing conflict on the fuel consumption and emissions is calculated during the whole taxiing process of the aircraft.
2.2. Traction Taxiing Modes
Several studies compared fuel consumption and emissions of aircrafts under different traction taxiing modes to determine the optimal traction mode for surface taxiing. Balakrishnan et al. [30] introduced two surface taxiing modes, namely, single-engine and aircraft tow-out, with low fuel consumption. The fuel consumption and emissions under the two taxiing modes were theoretically calculated. The external environmental requirements that facilitate aircraft taxiing with low fuel consumption and key restraints were illustrated. Honeywell and Safran [31] cooperated in the R&D of an electric green taxiing system for civil aircrafts. This system used the generator of an auxiliary power unit (APU) to drive the electric motor installed in the leader of the undercarriage. Accordingly, the aircraft can be automatically pushed and taxied between the boarding gate and the runway without using the main engine. Companies have reported that this strategy can decrease annual fuel consumption of aircrafts by 4%. Balakrishnan and Deonandan [32] considered two methods to reduce fuel consumption and emissions. The first method involved taxiing aircrafts by using fewer engines, thereby decreasing fuel consumption and emissions. The second method involved aircraft placement close to the runway before starting the engines. The advantages of each method were assessed, and the problems that must be solved before these measures can be implemented were determined. Reference [19] reported that statistics on fuel consumption and emissions data for aircrafts under four taxiing modes, namely, conventional taxiing, single-engine taxiing, external AGPS, and on-board AGPS, in 10 airports of America was obtained. These taxiing modes were also compared. However, the calculated results were obtained under ideal weather and uniform taxiing state, which presented a considerable difference from practical results. Pan et al. [33] made a new taxiing mode for aircrafts through ground and airborne equipment. They calculated fuel consumption and emissions of all aircrafts in the airport under full taxiing mode and the new one. Results showed that the new taxiing mode could decrease fuel consumption by at least 75% and emissions by 60%.
Thus, it can be seen that the analysis of fuel consumption and emissions in the past research is focused on contrastive analyses of different traction taxiing modes, without considering the operation environment, such as low visibility and traffic conflict. Therefore, this study analyzes the fuel consumption and emissions of different taxiing modes under the operation environment at the same path.
3. Research Methodologies and Data Sources
The calculation model of fuel consumption and emissions based on the engine emission database of the ICAO is constructed under ideal states. This model neglects low-visibility weather and taxiing conflict during actual taxiing, which disagrees with the practical operating environment. Consequently, the calculated results of fuel consumption and emissions are different from those of practical situations. This calculation model was optimized from the following aspects in this study based on the aforementioned shortcomings.
3.1. Influencing Coefficient of Low-Visibility Weather on Taxiing Time
The influences of low-visibility weather on taxiing time were divided into three parts in this study: (1) acquisition and processing of low-visibility weather information, (2) real-time running data processing of aircraft, and (3) determining the influencing coefficient of weather on taxiing time.
(1) Acquisition and processing of low-visibility weather information: weather factors that influence surface taxiing of aircraft were divided into two types, namely, normal and low-visibility weather. The latter includes thunderstorms, rain, snow, and haze. Airports will generally implement Category II operation under low-visibility weather conditions. For example, when the visual range of Pudong airport runway is less than 500 m and the visibility is less than 800 m in the daytime, the airport begins to implement Category II operation.
Current weather conditions are usually recorded at each airport in the form of METAR (meteorological terminal aviation routine weather report) [34]. The data of airports in the same periods for the past two years were individually collected and translated. For example, a METAR message (METAR ZSPD 251200Z 35006MPS 7000 BKN033 20/17 Q1022 NOSIG=) obtained at Pudong International Airport contains the following information: message type, METAR message; ICAO code of Pudong International Airport, ZSPD; observation time, 12:00 on the 25th of the world coordinated time; wind direction, 350°; wind speed, 6 m/s; ground visibility, 7000 m, 3300 feet, 5–7 clouds; temperature, 20 °C; dew point temperature, 17 °C; corrected sea level pressure, 1022 hPa; no significant weather phenomenon.
Data were divided into r intervals according to the lowest operating condition (e.g., visibility).
(2) Acquisition and processing of surface taxiing data of the aircrafts. First, the QAR data of flights in airports in periods corresponding to r intervals were collected. Then the periods with zero ground velocity in the QAR data were eliminated to offset taxiing delay due to conflict. Finally, the sum of ground velocities at each second was calculated, thus obtaining the departure taxiing distance of each flight. The taxiing distance was divided by the total taxiing time (η, excluding the period with zero ground velocity), and the average taxiing velocity of each flight can be obtained. The average taxiing speed of flight q can be calculated as follows:
(3) Determining the influencing coefficient of low-visibility weather on taxiing time
In periods corresponding to r − 1 visible intervals, except for the normal weather interval, f groups of QAR data (f flights) were randomly chosen in each interval. The sum of average taxiing velocity of each flight in r − 1 visible intervals was calculated, and the mean was selected:
Given r − 1 low-visibility conditions, the taxiing time per unit taxiing distance is , . If the average taxiing velocity under normal weather is , then the taxiing time per unit taxiing distance is . The influencing coefficient of low-visibility weather on taxiing time is as follows:
3.2. Calculation Model of Fuel Consumption and Emissions
The engine performance model of each aircraft under ideal situations is generally applied to calculate fuel consumption. However, acquiring the special performance data of these aircraft types is difficult. Thus, the demands of scholars for available performance data of aircrafts prompted the development of engine emission databases, which can provide fuel flow and emission indexes as functions of engine thrust. At present, two data lists are widely applied. These data lists include the aircraft engine emission database and the base of aircraft data, which were respectively developed and maintained by ICAO [2] and EUROCONTROL Experimental Center [35]. The latter is mainly used for the flight stage of aircrafts and estimates fuel consumption for thrust and idling function. However, such a database is hardly used to calculate fuel consumption during surface taxiing of aircraft. The former contains data regarding engine performance and emissions obtained by full-engine tests on sea level. This database provides fuel flow and emission indexes under 7%, 30%, 85%, and 100% of the rated output power for most jet and turbofan commercial engines. A calculation model of fuel consumption for aircraft surface taxiing was constructed in the present study based on the ICAO database. When the aircraft starts taxiing at a uniform velocity in an airport under the ideal state, the calculation formula of fuel consumption is as follows:
where is the total fuel consumption of aircraft i during surface taxiing, is the taxiing time of aircraft i, is the fuel flow of one aircraft i, and is the number of engines in aircraft i.
According to the emission index corresponding to fuel flow, the calculation formula of pollutant is as follows:
where is the emissions of pollutant of aircraft i during surface taxiing and is the emission index of pollutant from one engine of aircraft i.
In addition to low-visibility weather, surface taxiing of aircraft often suffers various conflicts due to the growing number of flights and increasingly complicated network system in a large airport. Conflicts can be divided into the following three types: intersection, head-on, and rear-end conflicts. During conflicts, aircraft will be in three states, namely, deceleration, acceleration, and waiting. The calculation formula of fuel consumption can be expressed as follows:
where is the total taxiing time of aircraft i under the taxiing state j, is the fuel flow of one engine of aircraft i under the taxiing state j, is the number of engines of aircraft i, is the state of engine (idling, uniform velocity, breakaway, and turning), and is the influencing coefficient of low-visibility weather on taxiing time.
The calculation formula of emissions at taxiing conflict is as follows:
where is the emission index of pollutant k of aircraft i under the taxiing state j.
3.3. Modified Calculation Model of Fuel Consumption and Emissions under Four Taxiing Modes
The modified calculation models of fuel consumption and emissions of aircrafts under full- and single-engine taxiing, external AGPS, and EGTS were constructed in this study based on the aforementioned modified model.
(1) Full-engine taxiing.
Full-engine taxiing means that the main engines of aircraft are initiated and work at a uniform velocity during surface taxiing. This taxiing mode is the most commonly used at present. Fuel consumption () of any aircraft under full taxiing can be expressed on the basis of differences in engine fuel flows under different taxiing states:
where represents the engine states, namely, idling, uniform velocity, breakaway, and turning; is the taxiing time of aircraft i under full-engine taxiing when the engine is at state ; refers to the number of engines in aircraft i; is the fuel flow of aircraft i when the engine is at state ; and refers to the influencing coefficient of low-visibility weather on taxiing time.
Pollutant gas emissions of aircrafts are related to fuel consumption and states of the dynamic device. The emissions of pollutant () of aircraft under full-engine taxiing can be expressed as follows:
where is the emission index of pollutant of the aircraft when the engine is at state .
(2) Single-engine taxiing.
If frictional force and airport surface slope are allowed, then the aircraft can reserve one engine during taxiing. Under single-engine taxiing, the engine can only consume fuel and produce pollutants during its operation. If single-engine taxiing is adopted, then the main engine, which is closed, must be preheated before entering into the runway. The main engine can provide take-off power to the aircraft only after preheating. The engine start-up time (ESUT) is related to the aircraft mode, engine mode, and closed time of the engines. The duration is generally 2–5 min. Under taxiing, the aircraft needs time to cool the engines, which are closed during taxiing, after it lands. The engine cool-down time is similar to ESUT. The fuel consumption () of any aircraft under single taxiing can be expressed as follows:
where is the taxiing time of aircraft under single-engine taxiing when the engine is at state j; indicates aircraft taxiing when only half of the engines are started to produce thrust; is the fuel flow of aircraft when the engine is at state j; is the fuel flow under idling when preheating or cooling of engines is not needed during taxiing; indicates that if the taxiing time of the aircraft is longer than 5 min, then the preheating or cooling time of engines is set to 5 min. If the taxiing time is less than 5 min, then the preheating or cooling time of engines is used as the taxiing time.
Under single-engine taxiing, emissions of pollutant () can be expressed as follows:
where is the emission index of pollutant of aircraft when the engine is at state j and is the emission index of pollutant when the engine is at idling state.
(3) External AGPS
External AGPS is a taxiing mode driven by a motor tractor while the main engine of the aircraft is unused. When the tractor drags the aircraft to initiate surface taxiing, engines remain at the idling state and are only started 5 min before take-off. Later, the aircraft accomplishes taxiing in the last taxiway section, and the tractor automatically returns. The traction taxiing velocity of the aircraft is far smaller than that driven by engines. The tractor can be divided into diesel- and electric-driven types [36]. The latter is more economical and environmentally friendly than the former. However, comparing the electricity with fuel consumption under other taxiing modes is difficult. Therefore, the diesel-driven tractor was applied as an external AGPS in the present study.
The fuel consumption () of any aircraft i during external AGPS in an airport can be expressed as follows:
where is the surface taxiing time of aircraft under external AGPS. Brake horsepower (BHP) refers to the average rated BHP of an engine equipment type. The typical BHP data are included in Table A2. The load factor (LF) is the average operational horsepower output of the engine divided by its rated BHP. The LFs by equipment type are included in Table A2. is the fuel flow of aircraft at taxiing state j by tractor t. is the number of engines of aircraft . refers to fuel flows when the preheating or cooling engines are under idling state. indicates that if the taxiing time of aircraft is longer than 5 min, then the preheating or cooling time of the engines is set to 5 min. If the taxiing time is less than 5 min, then the preheating or cooling time of the engines is used as the traction taxiing time.
Under external AGPS, the emissions of pollutant () can be expressed as follows:
where is the emission index of pollutant from tractor t of aircraft and is the emission index of pollutant of aircraft under the idling state of engines.
(4) EGTS
EGTS [37] provides energy by using an APU. The electric motor on the undercarriage is driven by initiating the APU, thus driving the rotation of airplane wheels. However, the APU cannot provide the necessary power for aircraft taxiing at present; thus, EGTS is only applied as an APU.
Similar to single-engine taxiing, the aircraft must start all closed main engines before take-off and cool all engines after landing. Therefore, the preheating and cooling times of engines must be considered. The main engine of aircraft must be started at least 5 min before take-off. Under EGTS, the fuel consumption () of any aircraft can be expressed as follows:
where is the EGTS time of the aircraft ; is the fuel flow when APU is used as the main power for aircraft taxiing; indicates that if the taxiing time of aircraft is longer than 5 min, then the preheating or cooling time of engines is set to 5 min. If the taxiing time is less than 5 min, then the preheating or cooling time of engines is used as the traction taxiing time. Under EGTS, the emissions () of pollutant k can be expressed as follows:
where is the emission index of pollutant under EGTS and EIik is the emission index of pollutant when engines are at idling state.
3.4. Data Sources
Based on the aforementioned model, data types of fuel consumption and emissions were summarized in this study as follows: (1) weather and flight data, (2) fuel consumption and emission index under four taxiing modes, (3) surface taxiing data of aircrafts, and (4) node information of taxiway.
3.4.1. Weather and Flight Data
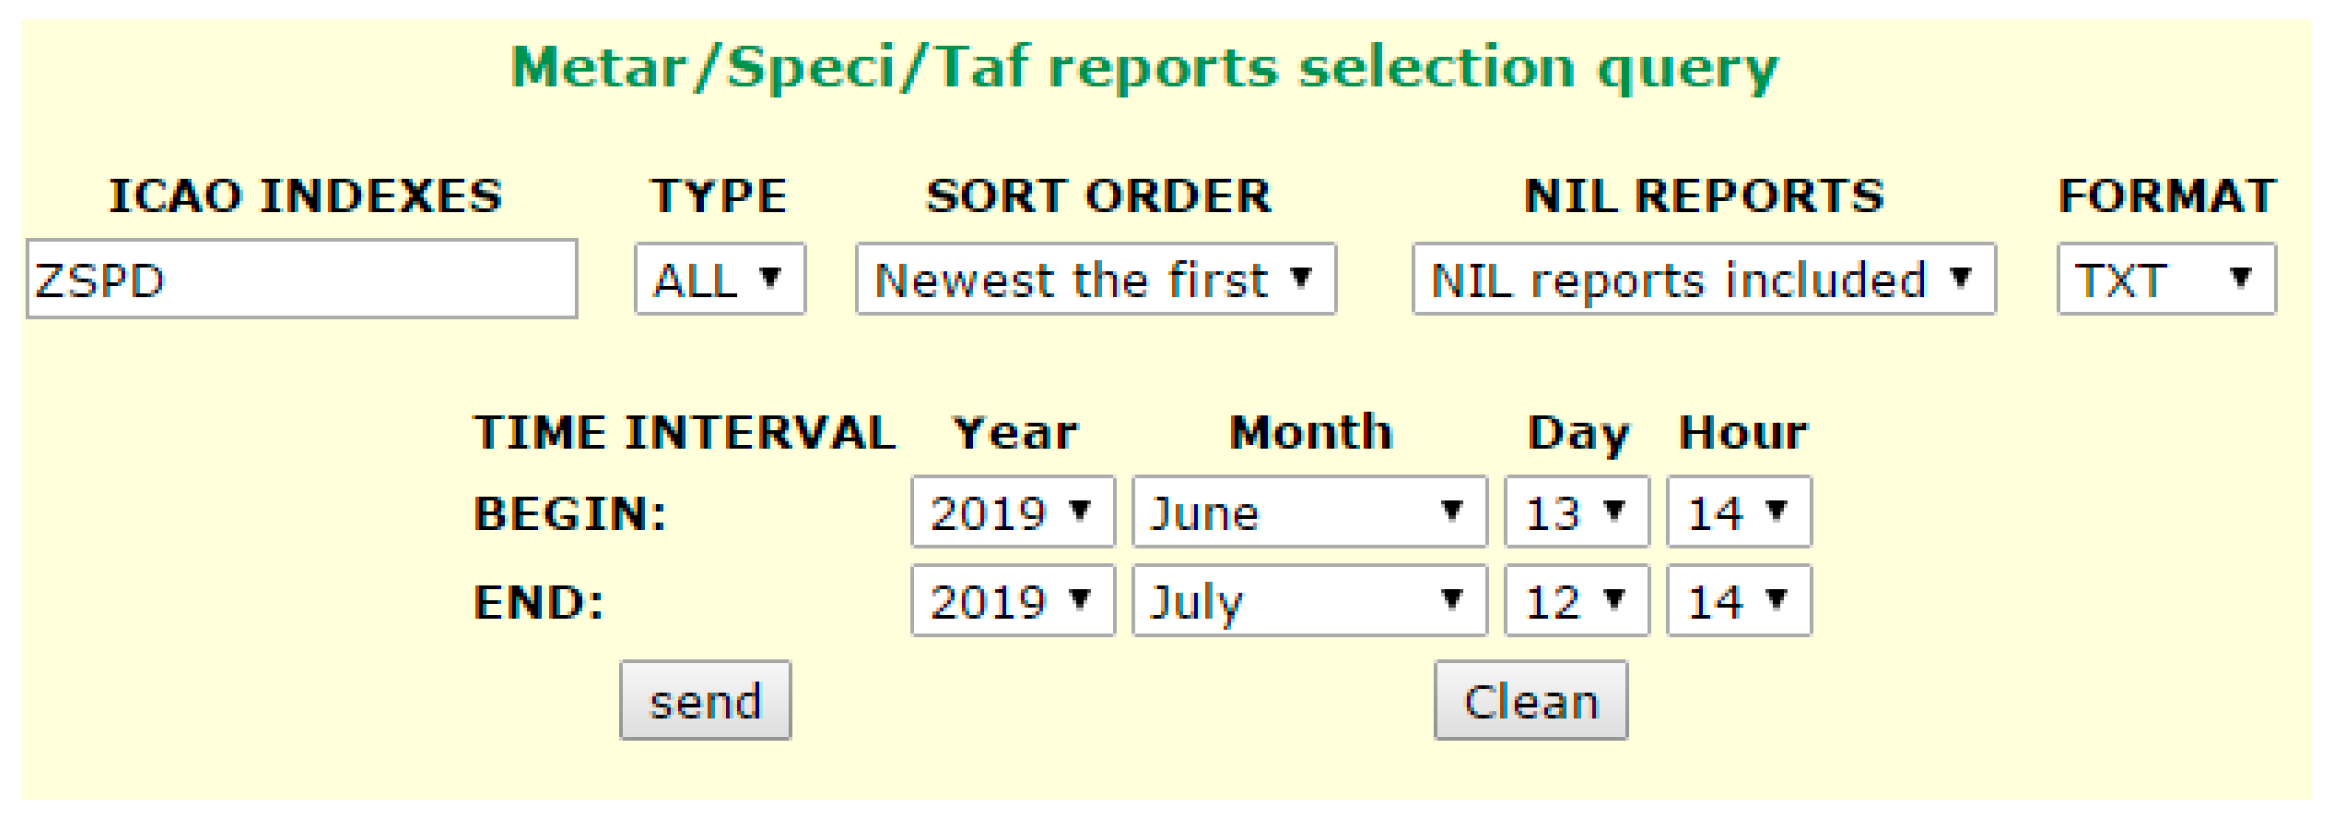
Weather data can be collected from the Ogimet website (http://www.ogimet.com/metars.phtml.en), in which METAR of different airports in recent years are available. Input the four word code of the airport in ICAO indexes, set the type to all, and set the start and end time of the query to get the METAR message of the airport in half an hour intervals. Each set of message data includes airport code, observation time, ground wind direction, wind speed, and other information. Data access is free and available from the net mainly from the National Oceanic and Atmospheric Administration. The data are available for all meteorological stations that are part of the World Meteorological Organization. Figure 1 shows the online weather inquiry website interface of Ogimet.
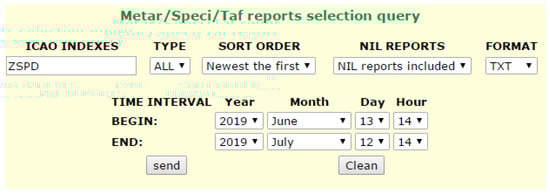
Figure 1.
Ogimet online interface.
Flight data can be collected from the QAR data, which are mainly provided by pilots and employees of airline companies. The QAR data provide practical running data information of each flight, including taxiing time of each flight, taxiing velocity per second, and fuel consumption of each engine.
3.4.2. Fuel Consumption and Emission Index under Four Taxiing Modes
- Under full- and single-engine taxiing, fuel and emission indexes were collected from the engine emission database of ICAO [2]. Given that the database only provides fuel flow and emission indexes under 7%, 30%, 85%, and 100% of rated output power, fuel flow and emission indexes under different taxiing modes and thrust levels were collected by linear interpolation (idle (4%), constant speed or brake (5%), breakaway (9%), and perpendicular turn (7%)) [12]. In this study, fuel flows and HC, CO, and NOx emission indexes of four aircraft types (A320, A340, B738, and B747) under four thrust levels were collected. Appendix A: Table A1 illustrates the data.
- The BHP value of each aircraft and engine mode under external AGPS and the corresponding fuel consumption and emission coefficients are all based on the FAA technical report [38]. Traction equipment and engine data packet include the type of aircraft (wide or narrow body), LF, fuel type, BHP, and fuel flow (Appendix A: Table A2). The emission index table covers the cooling type of the engine, BHP ranges, and emission indexes of HC, CO, NOx, PM, and SO2 (Appendix A: Table A3).
- The Environmental Science Associates [39] provide the data of fuel flow and emission indexes of airborne APUs under EGTS for setting the three different powers: idle (the lowest power setting at “APU on”), environmental control system (supporting normal running of “gate in” and “gate out”), and pneumatics of the main engine (supporting setting of the highest power to start the main engine). In this study, fuel flow and emission indexes under the main engine start (MES) were chosen. At MES of the APU, the fuel consumption and pollution emission index table covers the type of aircraft, fuel flow, and HC, CO, NOx, and CO2 emission indexes of APU (Appendix A: Table A4).
3.4.3. Surface Taxiing Data of Aircraft
The taxiing time, longitude and latitude, ground velocity, and real-time fuel consumption data of each engine were extracted on the basis of the QAR data of A320, A340, B738, and B747. The longitude and latitude coordinates were transformed into rectangular ones by using the center point of the 17L/35R runway in Shanghai Pudong International Airport as the origin. The taxiway was simulated by the Visual Basic program. The taxiing conflicts and modes were calculated by setting the taxiing velocity, fuel flow and emission, and fuel consumption and emissions of two-engine (A320 and B738) and four-engine (A340 and B747) aircrafts on the taxiway under different low-visibility weather conditions.
3.4.4. Node Information of the Taxiway Obtained from the Aeronautical Chart
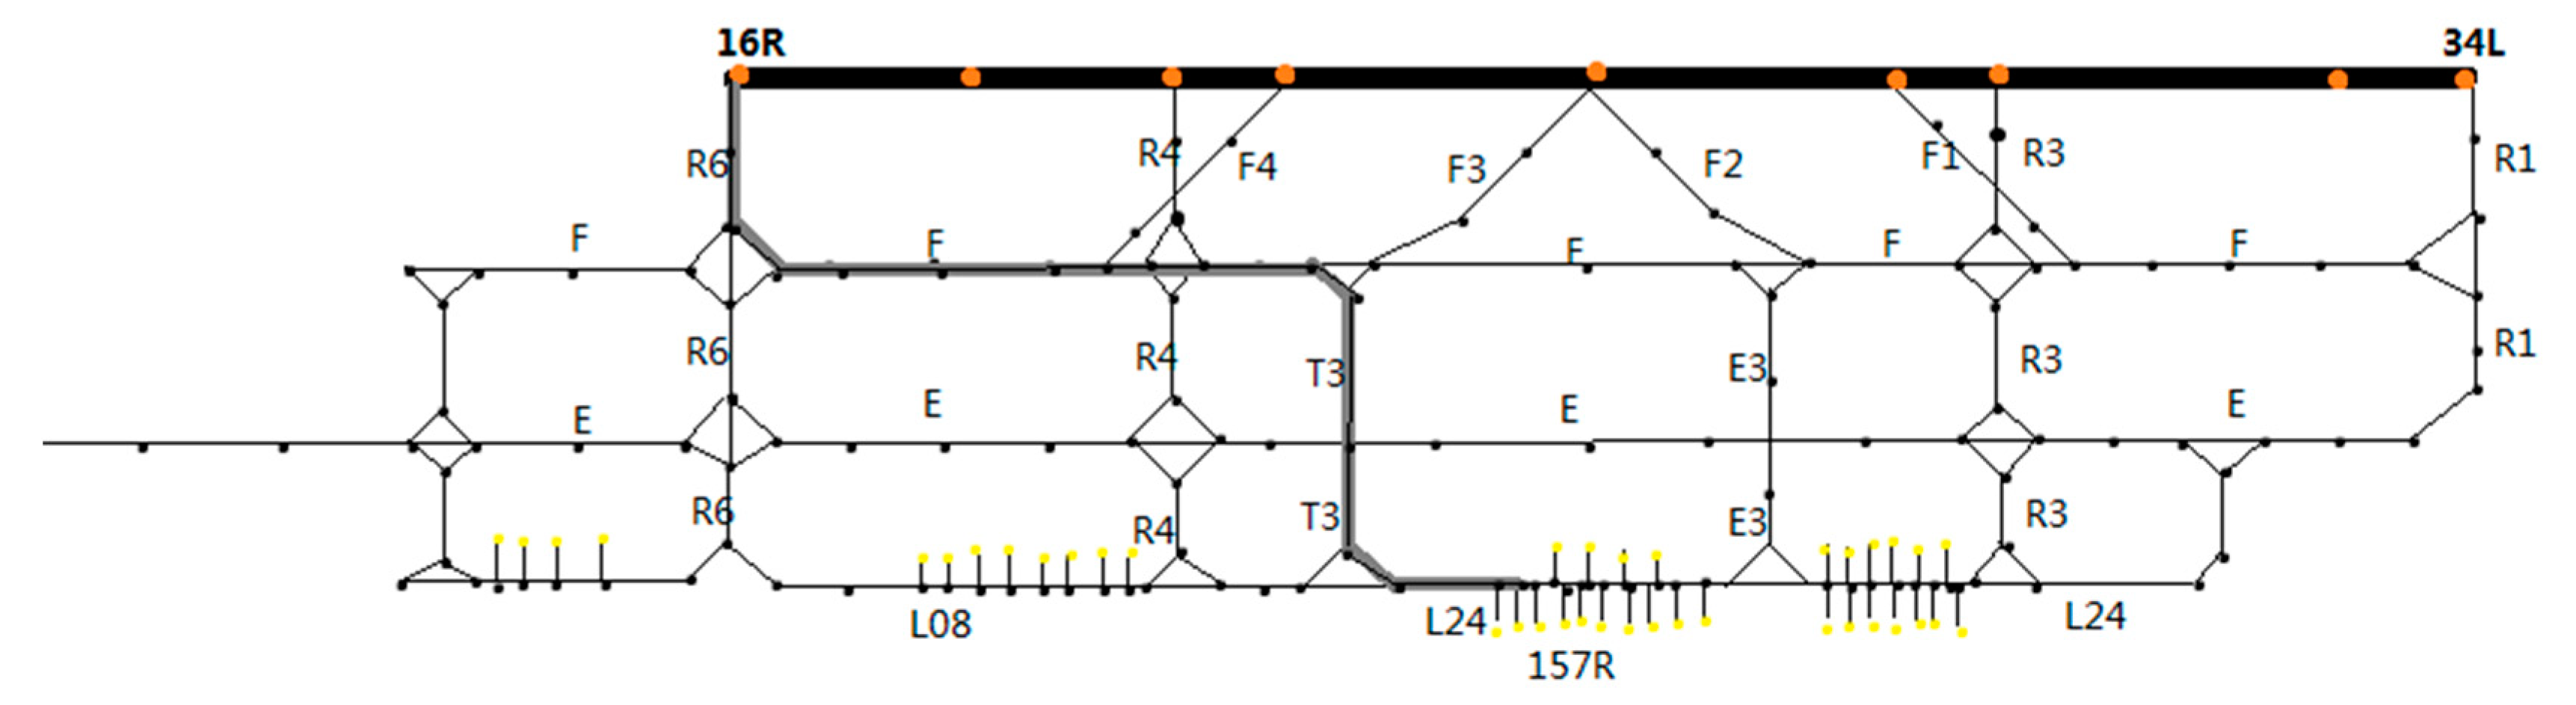
The taxiing node information in Shanghai Pudong International Airport was collected according to the aircraft surface taxiway. The taxiway L24-T3-F-16R was chosen (gray broken line in Figure 2).
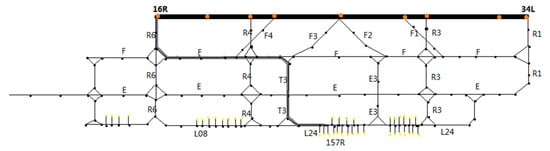
Figure 2.
Aircraft taxiway in Shanghai Pudong International Airport.
4. Results and Discussions
4.1. Visibility for Surface Taxiing in Airports and Taxiing Time Statistics
(1) METAR data extraction and analysis. The weather reports in Shanghai Pudong International Airport in the past two years were extracted from the Ogimet website and updated every 30 min. Each METAR was individually translated through a computer program and the results were putted into the database for extraction convenience. METAR was divided into two intervals according to the lowest operating condition of the Shanghai Pudong International Airport in Table 1.

Table 1.
Standard IFR take-off minimums of the Shanghai Pudong International Airport (m).
(2) The influencing coefficient of low-visibility weather was acquired from the QAR data statistics, and the QAR data of flights in airports in periods corresponding to two intervals of METAR were collected. The QAR field covers time and ground taxiing velocity. QAR data processing involves the following steps.
Step 1. The periods with zero ground velocity in the QAR data were deleted to offset taxiing delay due to conflict. The sum of ground velocity at each second is calculated to obtain the departure taxiing distance of each flight. The taxiing distance is divided by the total taxiing time. Accordingly, the average taxiing velocity of each flight can be obtained.
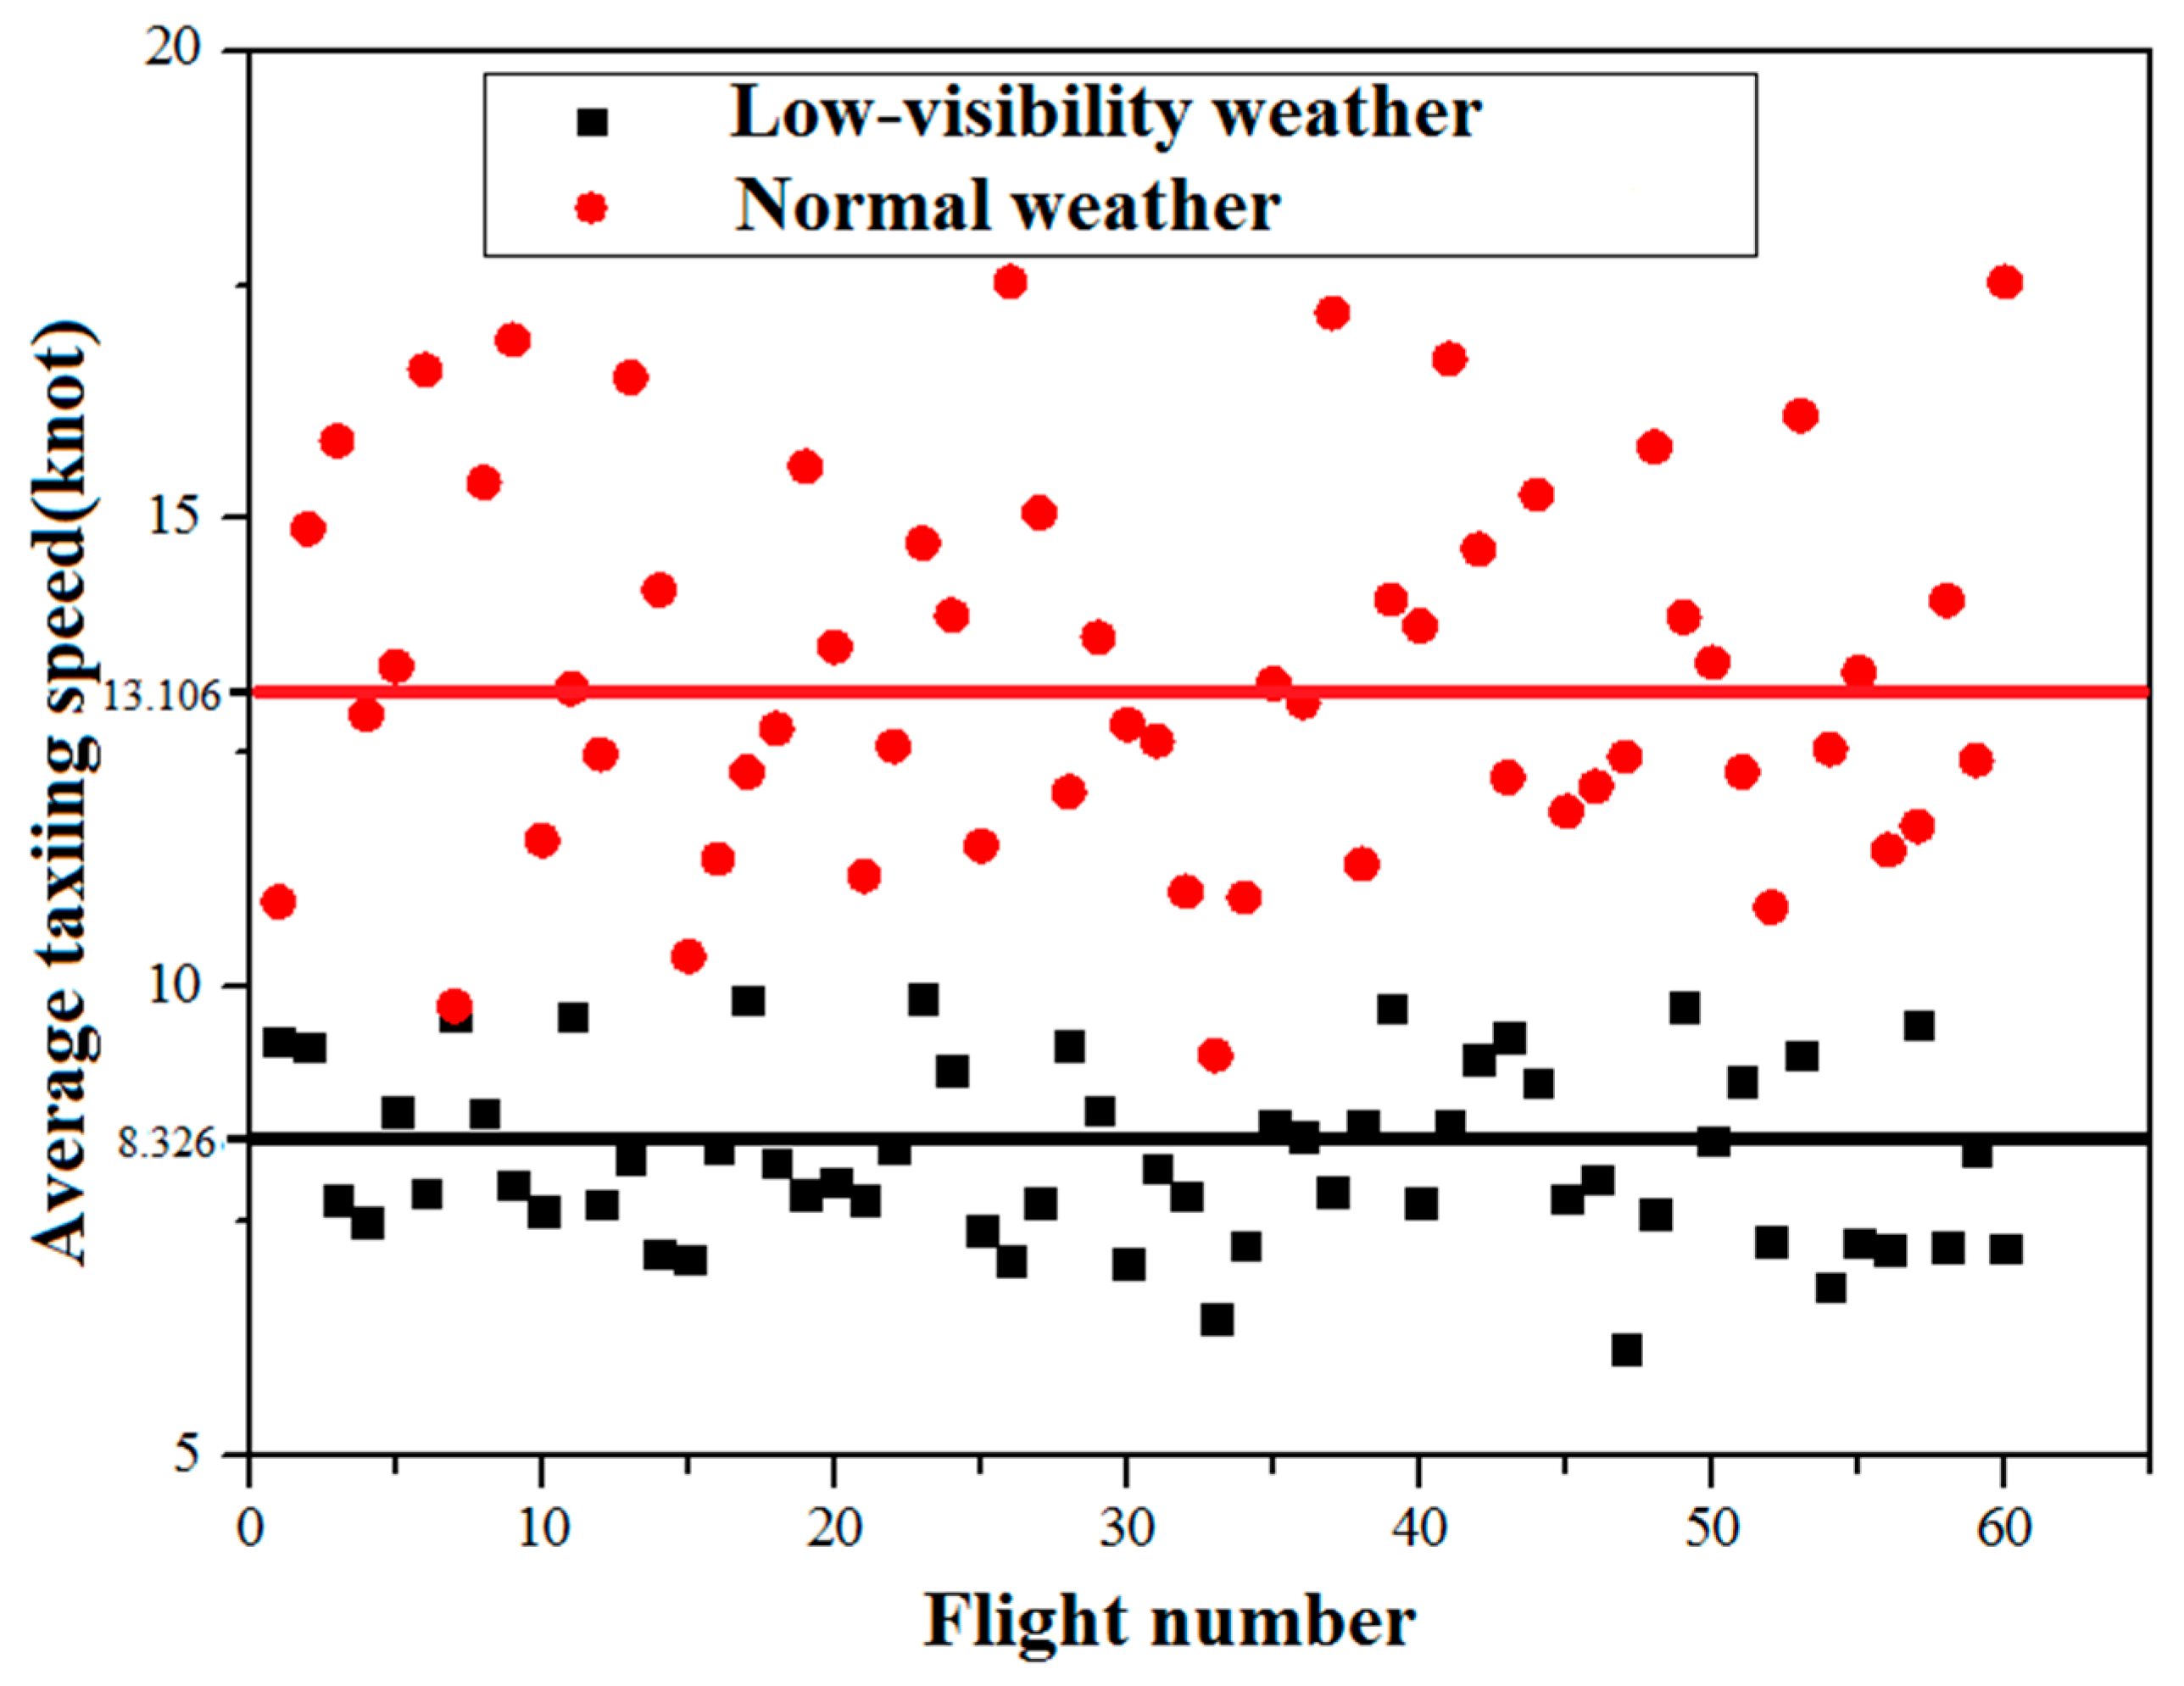
Step 2. A total of 60 groups of QAR data were randomly acquired in periods corresponding to two intervals of different visibilities. The average taxiing velocity of each flight is calculated on the basis of the aforementioned idea. Flights in two intervals are ordered according to the average taxiing velocity. The flights in the two intervals are randomly numbered from 1 to 60 (Figure 3).
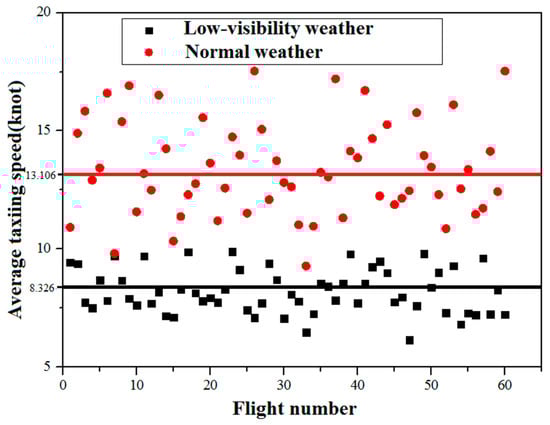
Figure 3.
Average taxiing velocity of flights in two intervals of different visibilities.
Step 3. The sum of average taxiing velocity of each flight in two intervals of different visibilities was calculated. The average taxiing velocity of all flights under low-visibility weather is 8.326 sections and under normal weather conditions is 13.106 sections. When flights provided taxiing per unit distance (nautical mile) at the above velocities under low-visibility and normal weather conditions, they take 0.1201 and 0.0763 h, respectively. Accordingly, the taxiing time of flights over the same taxiing distance under low-visibility weather is 1.574 times that under normal weather conditions. Therefore, the influencing coefficient () of visibility under the average taxiing time can be expressed as follows: = 1.574 when visibility is 800 m, and = 1 when visibility is >800 m.
4.2. Fuel Consumption and Emissions under Different Visibilities and Taxiing Conflicts
In practical operation, the acceleration and deceleration caused by conflict can directly influence fuel consumption and emissions during surface taxiing of aircraft. Meanwhile, the taxiing velocity of aircrafts may decrease under low-visibility weather and the taxiing time for the same taxiing distance will increase, thus raising fuel consumption and emissions. Given that HC, CO, and NOx emissions during surface taxiing of an aircraft are not recorded in practical QAR data, calculating emission coefficients of different types of pollutants in engine emission data of ICAO is necessary to obtain the emission results of the theoretical model. To do this, the acceleration, deceleration, uniform velocity, and stopping time in the QAR data, as well as the fuel consumption index in the engine emission database of ICAO, are input into the calculation formula of fuel consumption involving taxiing conflict. Accordingly, fuel consumption at different points of the taxiway is calculated. In this study, node information in the QAR data was used to simulate the taxiway of A320, A340, B738, and B747. Fuel consumption of different aircraft types under taxiing at uniform velocity and ideal conditions was calculated using Equation (4). Fuel consumption of different aircraft types under various taxiing stages and conflicts was calculated using Equation (5). Moreover, the fuel consumption of different aircraft types under half taxiing velocity and low-visibility weather with taxiing conflict was calculated. Table 2 shows the calculated results of different aircraft types.
Table 2.
Quick access recorder (QAR) data of different aircraft types and simulation data of fuel consumption.
Table 2 demonstrates that the calculation accuracies of the modified calculation models for fuel consumption of A320, A340, B738, and B747 under ideal conditions were 86.31%, 87.18%, 89.45%, and 87.26%, respectively. The calculation accuracies under taxiing conflicts are 90.14%, 92.53%, 94.39%, and 93.84%. The calculation accuracy of fuel consumption of B738 is the highest. The average calculation accuracy is 87.55% under ideal conditions, while that with considerations to taxiing conflict is increased by 5.18% to 92.73%.
Moreover, the fuel consumption of different aircraft types under low-visibility weather conditions is 1.5672 times that in the QAR data on average. This finding is similar to the coefficient (1.5724) obtained from the taxiing data statistics of practical flights in Section 2. Therefore, the calculation model of fuel consumption involving low-visibility weather and taxiing conflict is feasible and close to the value in the real environment. This finding indicates that the calculation accuracy is high.
4.3. Sensitivity Analysis of Fuel Consumption and Emissions under Different Taxiing Velocities and Thrusts
(1) Sensitivity analysis of the three scenarios under unimpeded aircraft taxiing conditions.
The taxiing velocity of aircrafts on the airport surface is generally sensitive to weather conditions and airport busyness. Under the same taxiing distance, the taxiing time increases when the taxiing velocity decreases. Accordingly, fuel consumption and emissions were increased. The following scenes were set to discuss the influences of different taxiing velocities on fuel consumption and emissions of aircraft:
- Under low-visibility weather conditions, the taxiing velocity of aircraft was 10–15 knots.
- During busy hours in the airport, the taxiing velocity of aircraft was 15–20 knots.
- The taxiing velocity of aircraft was 20–25 knots.
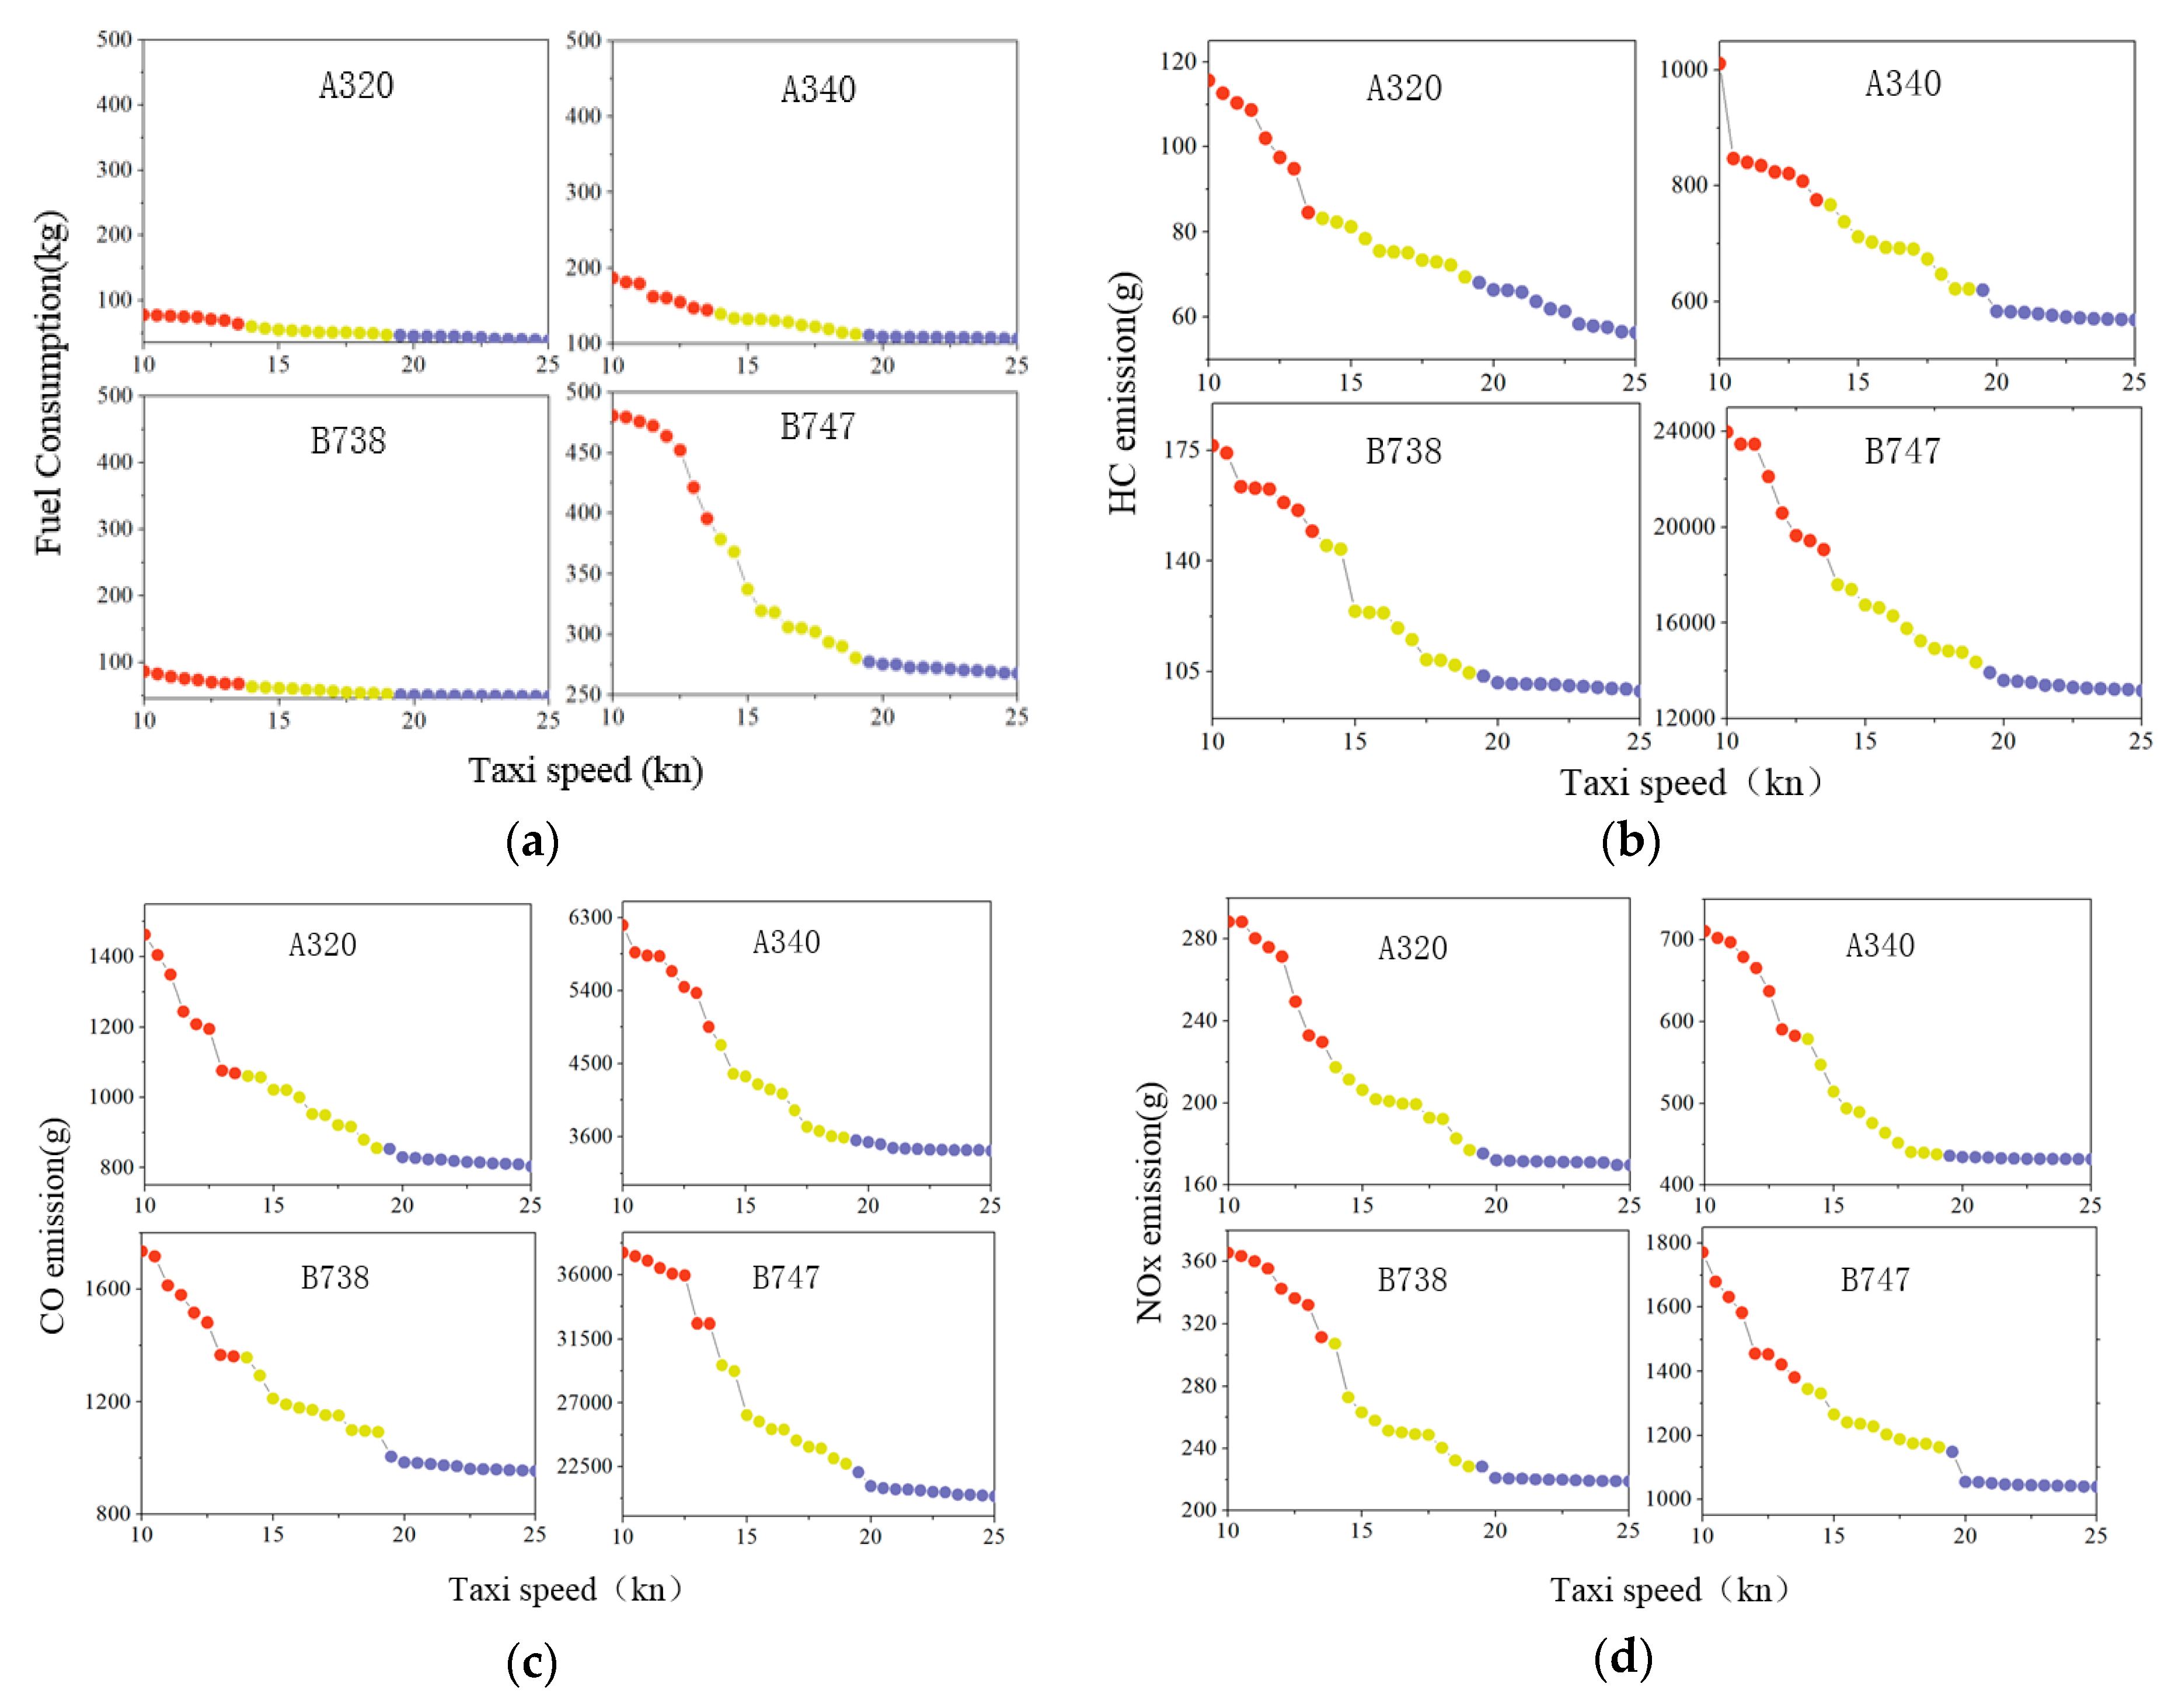
Based on the aforementioned hypotheses, Figure 4 shows the calculated results of fuel consumption and emissions produced by A320, A340, B738, and B747 under taxiing at a uniform velocity without taxiing conflicts.
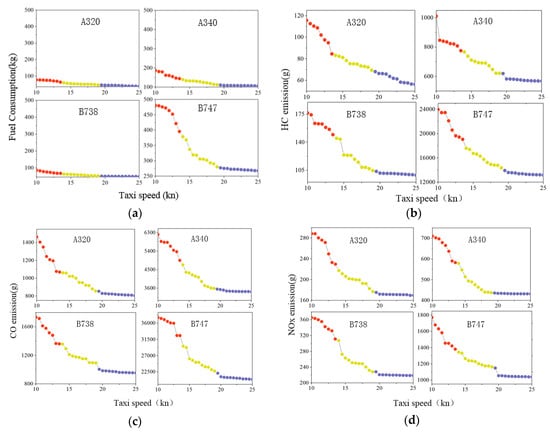
Figure 4.
Sensitivity analysis in the three scenarios under unimpeded aircraft taxiing conditions (a) Comparison of fuel consumption distribution; (b) comparison of HC emission; (c) comparison of CO emission; (d) comparison of NOX emission. The intervals of red points, yellow points, and blue points are corresponding fuel consumption or emissions at taxi speed of 10–15 knots, 15–20 knots, and 20–25 knots, respectively.
The figure demonstrates the following:
- When the taxiing distance is fixed, fuel consumption and emissions of A340 and B747 are higher than those of A320 and B738. Fuel consumption and emissions of B747 are also the highest compared with those of the three aircraft types.
- Data statistics in Figure 4 demonstrate that fuel consumption and emissions produced by different aircraft types from taxiing at the velocity of 10–15 knots in three scenes are approximately 1.7 times those under taxiing at the velocity of 20–25 knots. Fuel consumption and emissions produced by different aircraft types from taxiing at the velocity of 15–20 knots are approximately 1.25 times those under taxiing at the velocity of 20–25 knots. Specifically, fuel consumption and emissions of different aircraft types are negatively related to taxiing velocity, and NOx emission is influenced by taxiing velocity the least.
- In this section, fuel consumption and emissions of different aircraft types under the existence of conflicts and different taxiing velocities are discussed. Figure 4 shows that the fuel consumption and emissions of A320, A340, B738, and B747 for the same taxiing distance are closely related to taxiing velocity. The fuel consumption and emissions will be low when the taxiing velocity is high.
(2) Sensitivity analysis of fuel consumption and emissions under different thrust levels with considerations of taxiing conflict.
The ICAO database hypothesized that the taxiing thrust of all aircrafts is 7%. Wood et al. [40] and DuBois and Paynter [41] believed that thrust at idling state was approximately 4%. A study of the British Aircraft Corporation disclosed that the engine thrust of aircrafts from stopping to acceleration reached as high as 9% [13]. Suppose the thrust levels under uniform and decelerating taxiing were slightly higher than those under idling and the engines under turning were slightly lower than those under accelerating taxiing. Therefore, thrust levels under uniform and turning taxiing were set to 5% and 7%, respectively [1].
The aforementioned studies manifested that fuel flow and NOx emission under each state were collected through linear interpolation. HC and CO emissions under decelerating taxiing were the highest and sharply decreased with the increase in power (Figure 4). In summary, the following parameters were set in the present study: thrust levels under idling state, uniform velocity, deceleration, and acceleration conditions were set at 4%, 5%, 5%, and 9%, respectively.
Statistics show that the Shanghai Pudong International Airport had 1494 flight arrivals and departures on April 5, 2019 (sunny, visibility >10 km). The flight arrivals and departures were 53% and 47%, respectively. Fuel consumption and emissions of flights under stopping, acceleration, constant taxing, and turning were calculated (Table 3).
Table 3.
Fuel consumption and emissions of total flights under taxiing conflict.
Table 3 demonstrates that fuel consumption and emissions of all flight arrivals and departures under taxiing at a uniform velocity account for the highest proportion in the entire taxiing stage.
The proportions of fuel consumption and emissions of flight arrivals and departures under taxiing at uniform velocity are approximately 76%, 82%, and 70% of the total values. During arrival, the taxiing velocity of an aircraft continuously decreases and the idle thrust is higher than the average thrust level of flight departure. Therefore, the proportions of fuel consumption and emissions of flight arrivals are higher than those of flight departures.
Fuel consumption and emissions of flights under the stopping state must be considered. The proportions of fuel consumption and emissions of all flights, flight arrivals, and flight departures under stopping state are 15%, 9%, and 21% of the total values, respectively. The times of stopping and waiting for aircraft must be significantly higher than those of flight arrivals to prevent stopping and waiting for taxiing conflict at departure. The proportions of fuel consumption and emissions of flight departure under stop-and-go states are higher than those of flight arrivals.
Statistics show that the total fuel consumption and emissions of flights in the Shanghai Pudong International Airport can be generally estimated. This work provides references to estimate the total emission levels of airports. However, airport surface control often needs an understanding of variations of different aircraft types in terms of fuel consumption and emissions on relative taxiways. The results can provide references in terms of decision making on taxiway optimization considering environmental factors. Hence, fuel consumption and emissions of A320, A340, B738, and B747 on the same taxiway under different states were calculated and analyzed in this section.
Fuel consumption and emissions of A320, A340, B738, and B747 for taxiing at a velocity of 15 knots on the L24-T3-F-16R taxiway of the Shanghai Pudong International Airport during taxiing conflict and a waiting time of 95 s were calculated (Table 4).
Table 4.
Calculated results of fuel consumption and emissions.
The following conclusions can be drawn from Table 4.
- Differences of various aircraft types in terms of fuel consumption and emissions under varying states: the fuel consumption and emissions of A320, A340, and B738 produced by taxiing at a uniform velocity are high. The HC emission of B747 under the idling state is significantly higher than that under other taxiing modes. The proportions of fuel consumption and emissions in the entire taxiing process are equal because the maximum taxiing velocity and acceleration of the aircraft in the initial taxiing stage and the stage from stopping to accelerating taxiing are also equal. Table 4 demonstrates that fuel consumption and CO emission of all aircraft types under deceleration, idle, and taxiing at a uniform velocity during taxiing conflict account for approximately 50% of the total values. The HC emission of B747 from taxiing conflict accounts for approximately 84% of the total emissions.
- Differences of various aircraft types in fuel consumption and emissions under the presence or absence of taxiing conflict. By comparing data in the two aforementioned tables, fuel consumption and CO emission of all aircrafts under taxiing at the velocity of 15 knots during taxiing conflict are 60% higher than those without taxiing conflict. HC emissions of A320 and B738 from taxiing conflict are approximately 3.8 and 3.2 times those with the absence of taxiing conflict, while NOx emissions are 23% and 14% low. Compared with values under no taxiing conflict, the HC emission of A340 increased by 20% and NOx emission doubled. HC and NOx emissions of B747 decreased and increased by 61% and 17.6 times, respectively.
- Differences of various aircraft types in fuel consumption and emissions under varying thrust levels. The thrust level under full taxiing is 7% according to the slow thrust in the ICAO database. Accordingly, fuel consumption and CO emission of all aircraft types are overestimated by approximately 14% and 8.7%, respectively. HC and NOx emissions of A320 and B738 are overestimated by approximately 50% and 10%, respectively. HC emission of A340 is underestimated by 35%, while NOx emission remains the same. HC emission of B747 is overestimated by 4.2 times, and NOx emission is underestimated by 89%. Specifically, 7% of the thrust level may produce considerable calculation errors of fuel consumption and emissions.
In this study, different thrust levels were set for various operation states, namely, taxiing at a uniform velocity, idling state, acceleration, and deceleration. This task was undertaken to analyze fuel consumption and emissions of different aircraft types. Differences in emissions in the airport were assessed by calculating the total emissions in the airport in Reference [1]. Determining the differences between distinct aircraft types in fuel consumption and emissions under various taxiing modes can provide references to the airport management department in terms of decision making on taxiway optimization.
4.4. Fuel Consumption and Emissions of Different Aircraft Types under Varying Tractions at Normal Traffic Conditions
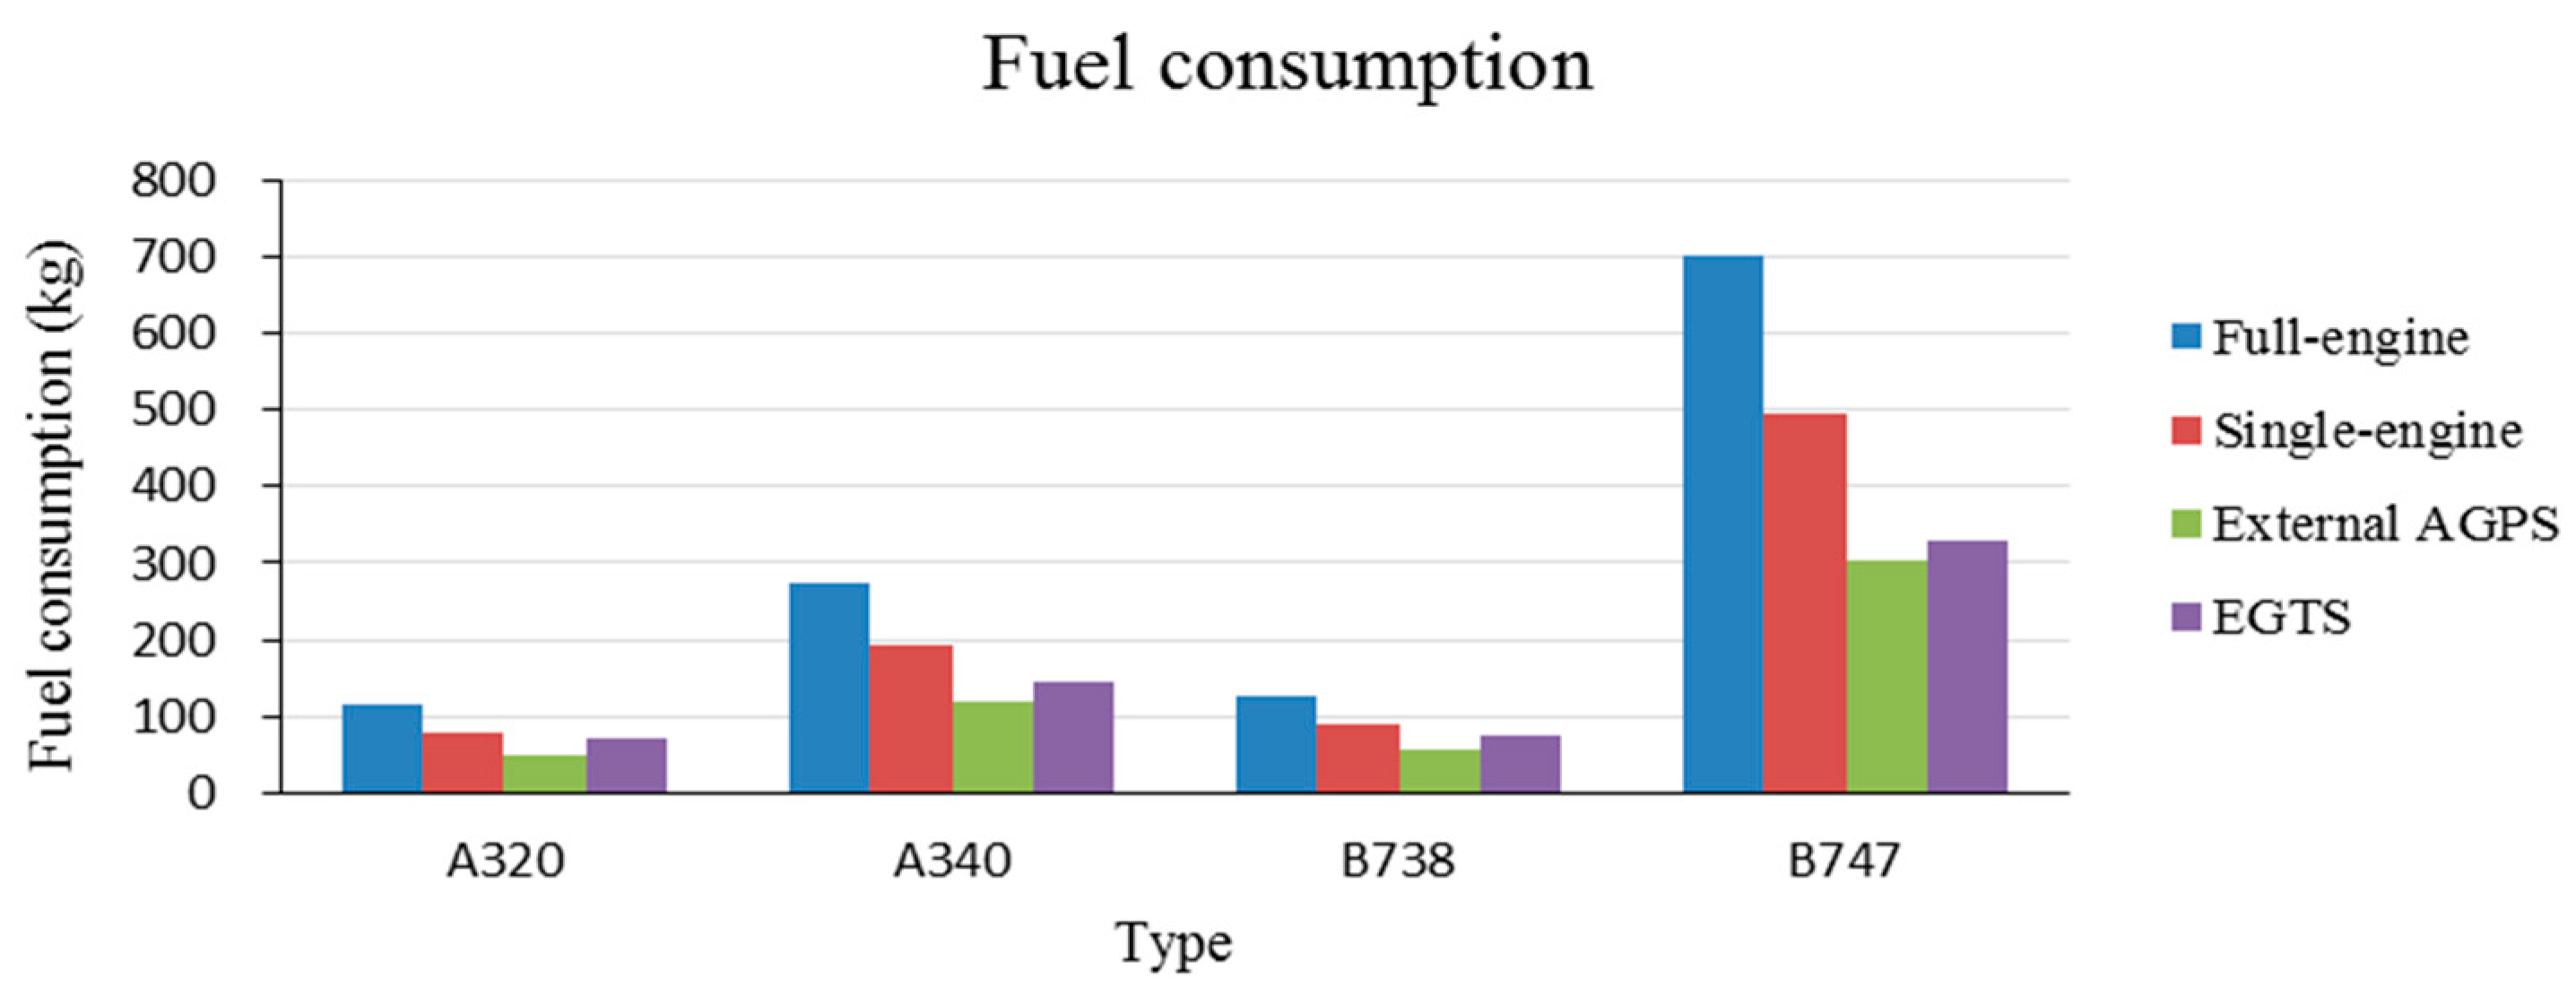
In this experiment, L24-T3-F-16R in the Shanghai Pudong International Airport was chosen as the taxiway. Four aircraft types, namely, two narrow-body two-engine (A320 and B738) and two wide-body four-engine (A340 and B747) aircrafts, were selected to calculate fuel consumption and emissions of different aircraft types under varying taxiing modes. Fuel flow and emission indexes of different aircraft types were collected from the engine emission database of the ICAO, and the models in Section 3 were used in the calculation of fuel consumption (Figure 5).

Figure 5.
Fuel consumption of different aircraft under four taxiing modes.
Figure 5 shows that fuel consumption of A340 and B747 are higher than those of A320 and B738. Moreover, the fuel consumption of B747 is significantly higher than that of the other three aircrafts. Fuel consumption under full taxiing is the highest; that is, approximately 1.2–1.8 times higher than that under single-engine taxiing. Furthermore, fuel consumption under external AGPS taxiing and EGTS presents advantages. Fuel consumption under external AGPS taxiing is the lowest. Therefore, single-engine taxiing, external AGPS taxiing, and EGTS can effectively decrease fuel consumption by surface taxiing. Table 5 illustrates the emissions under four taxiing modes.
Table 5.
Emissions of different aircraft under four taxiing modes.
The table shows that emissions from B747 are significantly higher than those of the other three aircraft types. Emissions of all aircraft types under single-engine, external AGPS taxiing, and EGTS are lower than those under full-engine taxiing. The details are introduced as follows.
- HC and CO emissions under external AGPS taxiing and EGTS are lower than those under single-engine taxiing. CO emission of A320, A340, and B738 under external AGPS taxiing is approximately 35% lower than that under single-engine taxiing. By contrast, HC emission is decreased by approximately 20–33%. CO and HC emissions of B747 under external AGPS taxiing are approximately 5% and 7% lower than those under single-engine taxiing. CO emissions of A320, A340, and B738 under EGTS are approximately 32–41% lower than those under single-engine taxiing, and the HC emission is decreased by approximately 38%. CO and HC emissions of B747 under EGTS are approximately 7% lower compared with those under single-engine taxiing.
- No significant difference is observed in NOx emission under EGTS and single-engine taxiing. However, NOx emissions of all aircraft types under external AGPS taxiing are higher than those under single-engine taxiing and EGTS. This phenomenon is due to the use of diesel in the tractor during external AGPS taxiing. NOx emissions of A320, A340, and B747 under external AGPS taxiing are approximately 55% higher than those under single-engine taxiing. NOx emission of B738 under external AGPS taxiing is approximately 28% higher than that under single-engine taxiing. NOx emissions of A320, A340, and B747 under EGTS are approximately 11–23% higher than those under single-engine taxiing, whereas HC emissions are approximately 38% lower. NOx emission of B738 EGTS is approximately 4% higher than that under single-engine taxiing.
The calculated results of different aircraft types under four taxiing modes reveal that fuel consumption under external AGPS taxiing is the least. However, NOx emission is higher than that under single-engine taxiing and EGTS, thus mostly decreasing emissions. Fuel consumption under EGTS is only lower than that under external AGPS taxiing. Therefore, the new EGTS is the best choice among all types of surface taxiing modes.
The modified calculation model of fuel consumption and emissions can accurately estimate fuel consumption and emissions of different aircraft types under varying taxiing modes. The model verifies comparison results in Reference [19] and further analyzes variations of different aircraft types in terms of fuel consumption and emissions under four taxiing modes. The research results provide references for airline companies in terms of decision making on fleet plans and increasing surface operation economics.
5. Conclusions
The calculation model of fuel consumption and emissions under taxiing at a uniform velocity under ideal conditions and the database of ICAO both neglect the influences of low-visibility weather and taxiing conflicts. The influencing coefficient of low-visibility weather on aircraft taxiing time was introduced in this study. Moreover, the taxiing conflict under different taxiing modes was input into the calculation model to increase calculation accuracy. The calculation models of fuel consumption and emissions under four taxiing modes were deduced on the basis of the modified model. The models were also verified by a case study based on the Shanghai Pudong International Airport, and the following major conclusions can be drawn.
(1) The QAR data were compared through a simulation test according to the practical QAR data of A320, A340, B738, and B747. The results demonstrate that the modified model with considerations to low-visibility weather and fuel consumption is feasible, and the calculated results are close to the practical value. Therefore, the model has high calculation accuracy.
(2) Different thrust levels were set for four taxiing modes, namely, uniform velocity, idling, deceleration, and acceleration. The differences in aircraft in terms of fuel consumption and emissions were also analyzed. The results show that the proposed method can determine variations of different aircraft types in terms of fuel consumption and emissions under various taxiing modes. This approach is in contrast with the analytical method based on total fuel consumption and emissions in airports in Reference [1]. The present work can also provide references for the airport management department in terms of decision making on taxiway optimization considering environmental factors.
(3) Fuel consumption and emissions of four aircrafts under four taxiing modes were compared. The results show that the new EGTS taxiing is optimal in terms of fuel consumption and emissions. This result verifies the assessment conclusion in Reference [19]. The proposed method further analyzes variations of different aircraft types in terms of fuel consumption and emissions under four taxiing modes. These results provide references for airline companies in decision making on fleet plans and improving surface operation economics.
Future work is currently planned to further solve two issues of fuel consumption and emissions during taxiing on airport surfaces. High-altitude airports have significantly different environmental factors, such as air pressure and temperature. Thus, airports must modify fuel flow and emission indexes under different taxiing modes. Furthermore, solving random studies on surface taxiing conflicts of aircrafts and considering them in the modified model of fuel consumption and emissions are important tasks to assess surface operation safety and flight cost in airports.
Author Contributions
Conceptualization, M.Z.; methodology, M.Z.; software, Q.H. and H.L.; validation, S.L.; formal analysis, Q.H; investigation, Q.H.; data curation, Q.H.; writing—original draft preparation, M.Z.; writing—review and editing, H.L.; visualization, S.L.; supervision, M.Z.; funding acquisition, M.Z.
Funding
This research was funded by the National Science Foundation of China, grant number No. U1633119, No. U1233101, and No. 71271113.
Conflicts of Interest
The authors declare no conflict of interest.
Appendix A
Table A1.
Fuel flow and emission index for four types of aircrafts at different thrust levels.
Table A1.
Fuel flow and emission index for four types of aircrafts at different thrust levels.
| Type | Fuel and Emission | Thrust Level | |||
|---|---|---|---|---|---|
| 7% | 4% | 5% | 9% | ||
| A320 | Fuel (kg/s/eng) | 0.1011 | 0.0763 | 0.0846 | 0.1176 |
| HC (g/kg fuel/eng) | 1.4000 | 1.5304 | 1.4870 | 1.4030 | |
| CO (g/kg fuel/eng) | 17.6000 | 19.5696 | 18.9130 | 16.2870 | |
| NOx (g/kg fuel/eng) | 4.0000 | 3.4783 | 3.6522 | 4.3478 | |
| A340 | Fuel (kg/s/eng) | 0.1240 | 0.0898 | 0.1012 | 0.1468 |
| HC (g/kg fuel/eng) | 5.0000 | 5.6437 | 5.4291 | 5.0147 | |
| CO (g/kg fuel/eng) | 30.9300 | 34.7817 | 33.4978 | 28.3622 | |
| NOx (g/kg fuel/eng) | 4.2800 | 3.4465 | 3.7243 | 4.8357 | |
| B738 | Fuel (kg/s/eng) | 0.1130 | 0.0837 | 0.0934 | 0.1326 |
| HC (g/kg fuel/eng) | 1.9000 | 2.1348 | 2.0565 | 1.9054 | |
| CO (g/kg fuel/eng) | 18.8000 | 21.0435 | 20.2957 | 17.3043 | |
| NOx (g/kg fuel/eng) | 4.7000 | 3.9043 | 4.1696 | 5.2304 | |
| B747 | Fuel (kg/s/eng) | 0.3000 | 0.2426 | 0.2617 | 0.3383 |
| HC (g/kg fuel/eng) | 46.4600 | 51.8939 | 50.0826 | 46.5844 | |
| CO (g/kg fuel/eng) | 73.8000 | 81.2217 | 78.7478 | 68.8522 | |
| NOx (g/kg fuel/eng) | 4.1100 | 3.3874 | 3.6283 | 4.5917 | |
Table A2.
Data sheet for traction equipment and engines.
Table A2.
Data sheet for traction equipment and engines.
| Type | Load Factor | Fuel Type | BHP | Fuel Consumption (Gallons) |
|---|---|---|---|---|
| Narrow body | 80% | Diesel | 175 | 0.061 |
| Electric | – | – | ||
| Gasoline | 130 | 0.089 | ||
| LPG | 130 | – | ||
| CNG | 130 | – | ||
| Wide body | 80% | Diesel | 500 | 0.053 |
| Gasoline | 500 | 0.089 | ||
| CNG | 500 | – |
Table A3.
Engine emission coefficient of traction equipment.
Table A3.
Engine emission coefficient of traction equipment.
| Engine Type | Coolant Type | Horsepower Range | Emission Factors (Grams per BHP-hr) | ||||
|---|---|---|---|---|---|---|---|
| HC | NOx | CO | PM | SO2 | |||
| Gasoline | Air-cooled | 1–24 | 10.0 | 2.0 | 360.0 | 0.2 | 0.21 |
| 25–50 | 7.0 | 3.0 | 400.0 | 0.0 | 0.21 | ||
| Water-cooled | 25–50 | 4.0 | 4.0 | 240.0 | 0.0 | 0.21 | |
| ≥51 | 4.0 | 4.0 | 240.0 | 0.0 | 0.26 | ||
| Diesel | Water-cooled | 1–50 | 1.0 | 11.0 | 4.0 | 0.7 | 0.29 |
| ≥51 | 1.2 | 11.0 | 4.0 | 0.5 | 0.25 | ||
| OME-optimized CNG | Water-cooled | 1–24 | 5.0 | 4.0 | 180.0 | 0.0 | 0.00 |
| 25–50 | 2.0 | 6.0 | 120.0 | 0.0 | 0.00 | ||
| ≥51 | 1.0 | 3.5 | 2.1 | 0.0 | 0.00 | ||
| Existing CNG or LPG | Air-cooled | 1–24 | 5.0 | 4.0 | 180.0 | 0.0 | 0.00 |
| 25–50 | 4.0 | 6.0 | 200.0 | 0.0 | 0.00 | ||
| Water-cooled | 1–24 | 5.0 | 4.0 | 180.0 | 0.0 | 0.00 | |
| 25–50 | 2.0 | 6.0 | 120.0 | 0.0 | 0.00 | ||
| ≥51 | 2.0 | 6.0 | 120.0 | 0.0 | 0.00 | ||
Table A4.
APU fuel flow and emission index under the MES conditions.
Table A4.
APU fuel flow and emission index under the MES conditions.
| Type | FF (kg/s) | EI CO2 (g/kg) | EI CO (g/kg) | EI HC (g/kg) | EI NOx (g/kg) |
|---|---|---|---|---|---|
| Narrow body | 0.038 | 3.155 | 4.94 | 0.29 | 7.64 |
| Wide body | 0.064 | 3.155 | 0.98 | 0.13 | 11.63 |
Note: FF = fuel flow, EI = emission index, CO2 = carbon dioxide, CO = carbon monoxide, HC = hydrocarbon, NOx = nitric oxide. The original data source of these weighted mean values was obtained from FOI (Sweden), 2009. The CO2 emission index was obtained from the Aviation Environmental Design Tool of the US Federal Aviation Administration, 2015.
References
- Nikoleris, T.; Gupta, G.; Kistler, M. Detailed estimation of fuel consumption and emissions during aircraft taxi operations at Dallas/Fort Worth International Airport. Transp. Res. D 2011, 16, 302–308. [Google Scholar] [CrossRef]
- International Civil Aviation Organization. ICAO Aircraft Engine Emissions Databank; ICAO: Montreal, QC, Canada, 2019. [Google Scholar]
- International Civil Aviation Organization. Resolution A37-19: Consolidated Statement of Continuing ICAO Policies and Practices Related to Environmental Protection—Climate Change. 2010. Available online: https://www.icao.int/environmental-protection/37thAssembly/A37_Res19_en.pdf (accessed on 25 September 2019).
- European Environment Agency. European Aviation 8 Environmental Report 2019. Available online: https://www.eurocontrol.int/publication/european-aviation-environmental-report-2019 (accessed on 25 September 2019).
- Honeywell Aerospace. Electric Green Taxiing System. 2013. Available online: https://aerospace.honeywell.com/en/press-release-listing/2013/june/honeywell-and-safran-to-demonstrate-electric-green-taxiing-system-at-paris-air-show (accessed on 25 September 2019).
- International Air Transport Association. Economic Performance of the Airline Industry: 2015 End-year Report. 2015. Available online: https://www.iata.org/whatwedo/Documents/economics/IATA-Economic-Performance-of-the-Industry-end-year-2016-report.pdf (accessed on 25 September 2019).
- Peace, H.; Maughan, J.; Owen, B.; Raper, D. Identifying the contribution of different airport related sources to local urban air quality. Environ. Model. Softw. 2006, 21, 532–538. [Google Scholar] [CrossRef]
- Psanis, C.; Triantafyllou, E.; Giamarelou, M.; Manousakas, M.; Eleftheriadis, K.; Biskos, G. Particulate matter pollution from aviation-related activity at a small airport of the Aegean Sea Insular Region. Sci. Total Environ. 2017, 596–597, 187–193. [Google Scholar] [CrossRef] [PubMed]
- Penn, S.L.; Boone, S.T.; Harvey, B.C.; Heiger-Bernays, W.; Tripodis, Y.; Arunachalam, S.; Levy, J.I. Modeling variability in air pollution-related health damages from individual airport emissions. Environ. Res. 2017, 156, 791–800. [Google Scholar] [CrossRef] [PubMed]
- International Civil Aviation Organization. Aircraft Engine Emissions, Annex-16-Vol-2-3rd-Edition. 2008. Available online: www.icao.int/environmental-protection/technology-stand ards_FR.aspx (accessed on 25 September 2019).
- Bousmanne, C.; Ferro, D.; Schuller, D.; Zaki, G.; Kuren, I.; Stridsman, L.; Huart, O.; Schnabel, O.; Genchev, M. SESAR 2020 Concept of Operations Edition 2017, PU/CO/CL, EUROCONTROL. 28 November 2017. Available online: https://ec.europa.eu/research/participants/documents/downloadPublic?documentIds=080166e5b6d2b912&appId=PPGMS (accessed on 25 September 2019).
- SESAR Joint Undertaking. SESAR Solutions Catalogue 2019, 3rd ed.; Bietlot: Charleroi, Belgium, 2019; Available online: https://www.sesarju.eu/sites/default/files/documents/reports/SESAR_Solutions_Catalogue_2019_web.pdf (accessed on 25 September 2019).
- Morris, K.M. Results from a Number of Surveys of Power Settings Used during Taxi Operations; British Airways Technical Report ENV/KMM/1126/14.8; British Airways: London, UK, 2005; Available online: http://www.britishairways.com/cms/global/pdfs/csr/PSDH_Technical_Reports.pdf (accessed on 25 September 2019).
- Stettler, M.E.J.; Eastham, S.; Barrett, S.R.H. Air quality and public health impacts of UK airports. Part I: Emissions. Atmos. Environ. 2011, 45, 5415–5424. [Google Scholar] [CrossRef]
- Wey, C.C.; Anderson, B.E.; Hudgins, C.; Wey, C.; Li-Jones, X.; Winstead, E.; Thornhill, L.K.; Lobo, P.; Hagen, D.; Whitefield, P. Aircraft Particle Emissions eXperiment (APEX). Technical report NASA. 2006. Available online: http://hdl.handle.net/2060/20060046626 (accessed on 25 September 2019).
- Ahearn, M.; Boeker, E.; Gorshkov, S.; Hansen, A.; Hwang, S.; Koopmann, J.; Didyk, N.; Bernal, J.; Hall, C.; Augustine, S.; et al. Aviation Environmental Design Tool (AEDT) Technical Manual Version 2d, DOT-VNTSC-FAA-17-16. September 2017. Available online: https://aedt.faa.gov/documents/aedt2d_techmanual.pdf (accessed on 25 September 2019).
- EUROCONTROL. Modelling Tools to Measure the Environmental Impacts of Aviation. Available online: https://www.eurocontrol.int/environment-modelling-tools (accessed on 25 September 2019).
- Li, N.; Sun, Y.; Yu, J.; Li, J.; Zhang, H.; Tsai, S. An Empirical Study on Low Emission Taxiing Path Optimization of Aircrafts on Airport Surfaces from the Perspective of Reducing Carbon Emissions. Energies 2019, 12, 1649. [Google Scholar] [CrossRef]
- Guo, R.; Zhang, Y.; Wang, Q. Comparison of emerging ground propulsion systems for electrified aircraft taxi operations. Transp. Res. C 2014, 44, 98–109. [Google Scholar] [CrossRef]
- Atkin, J.A.D.; Burke, E.K.; Greenwood, J.S. A comparison of two methods for reducing take-off delay at London Heathrow Airport. J. Sched. 2011, 14, 409–421. [Google Scholar] [CrossRef]
- Ravizza, S.; Atkin, J.A.D.; Burke, E.K. A more realistic approach for airport ground movement optimization with stand holding. J. Sched. 2014, 17, 507–520. [Google Scholar] [CrossRef]
- Marín, A.; Codina, E. Network design: Taxi planning. Ann. Oper. Res. 2008, 157, 135–151. [Google Scholar] [CrossRef]
- Roling, P.C.; Visser, H.G. Optimal airport surface traffic planning using mixed-integer linear programming. Int. J. Aerosp. Eng. 2008, 1, 1–11. [Google Scholar] [CrossRef]
- Atkin, J.A.; Burke, E.K.; Ravizza, S. The airport ground movement problem: Past and current research and future directions. In Proceedings of the 4th International Conference on Research in Air Transportation (ICRAT), Budapest, Hungary, 1–4 June 2010; pp. 131–138. [Google Scholar]
- Lesire, C. An iterative A* algorithm for planning of airport ground movements. In Proceedings of the 19th European Conference on Artificial Intelligence (ECAI)/6th Conference on Prestigious Applications of Intelligent Systems (PAIS), Lisbon, Portugal, 16–20 August 2010. [Google Scholar]
- Khadilkar, H.; Balakrishnan, H. Estimation of Aircraft Taxi-out Fuel Burn using Flight Data Recorder Archives. In Proceedings of the AIAA Conference on Guidance, Navigation and Control, Portland, OR, USA, 8–11 August 2011; pp. 1–19. [Google Scholar]
- Chen, J.; Stewart, P. Planning aircraft taxiing trajectories via a multi-objective immune optimization. In Proceedings of the 7th international Conference on Natural Computation (ICNC), Shanghai, China, 26–28 July 2011; Volume 4, pp. 2235–2240. [Google Scholar]
- Evertse, C.; Visser, H.G. Real-time airport surface movement planning: Minimizing aircraft emissions. Transp. Res. C 2017, 79, 224–241. [Google Scholar] [CrossRef]
- Weiszer, M.; Chen, J.; Stewart, P.; Zhang, X. Preference-based evolutionary algorithm for airport surface Operation. Transp. Res. C 2018, 91, 296–316. [Google Scholar] [CrossRef]
- Balakrishnan, H.; Deonandan, I.; Simaiakis, I. Opportunities for Reducing Surface Emissions through Surface Movement Optimization; Report No. ICAT-2008-07; Department of Aeronautics and Astronautics Massachusetts Institute of Technology: Cambridge, MA, USA, 16 December 2008; pp. 1–36. [Google Scholar]
- Ganev, E.D. Electric Drives for Electric Green Taxiing Systems: Examining and Evaluating the Electric Drive System. IEEE Electrif. Mag. 2017, 5, 10–24. [Google Scholar] [CrossRef]
- Balakrishnan, H.; Deonandan, I. Evaluation of Strategies for Reducing Taxi-Out Emissions at Airports; American Institute of Aeronautics & Astronautics: Reston, VA, USA, 2010. [Google Scholar]
- Pan, W.; Ye, Y.; Li, X.; Zhang, Q.; Zhang, Z.; Lai, X. Calculation and analysis of new taxiing modes on aircraft pollutant emissions in coastal airports of China. J. Coast. Res. 2018, 83 (Suppl. S1), 448–455. [Google Scholar] [CrossRef]
- Schultz, M.; Lorenz, S.; Schmitz, R.; Delgado, L. Weather Impact on Airport Performance. Aerospace 2018, 5, 109. [Google Scholar] [CrossRef]
- Eurocontrol Experimental Center. User Manual for the Base of Aircraft Data (BADA); Revision 3.8, EEC Technical/Scientific Report No. 2010–003; EUROCONTROL: Brussels, Belgium, 2010; Available online: https://www.eurocontrol.int/publication/user-manual-base-aircraft-data-bada-revision-38 (accessed on 25 September 2019).
- Electric Aircraft Tow Tractor. Available online: https://www.lektro.com/series/airline-models/ (accessed on 25 September 2019).
- Safran Landing Systems. Wheel Tug and the Electric Green Taxiing System. Available online: https://www.safran-landing-systems.com/systems-equipment/electric-taxiing-0 (accessed on 25 September 2019).
- Federal Aviation Administration. Voluntary Airport Low Emission Program Technical Report, Version 7, DOT/FAA/AR-04/37; FAA: Washington, DC, USA, 2010. [Google Scholar]
- Environmental Science Associates. ACRP Report 64: Handbook for Evaluating Emissions and Costs of APUs and Alternative Systems; Transportation Research Board/Airport Cooperative Research Program: Washington, DC, USA, 2012. [Google Scholar]
- Wood, Z.; Kristler, M.; Rathinam, S.; Jung, Y. A simulator for modeling aircraft surface operations at airports. In Proceedings of the AIAA Modeling and Simulation Technologies Conference, Chicago, IL, USA, 10–13 August 2009. [Google Scholar]
- DuBois, D.; Paynter, G. Fuel Flow Method 2 for Estimating Aircraft Emissions. SAE Trans. 2006, 115, 1–14. [Google Scholar]
© 2019 by the authors. Licensee MDPI, Basel, Switzerland. This article is an open access article distributed under the terms and conditions of the Creative Commons Attribution (CC BY) license (http://creativecommons.org/licenses/by/4.0/).