Abstract
With the obvious regionalization trend in the new period of urbanization in China, the scientific delineation of functional regions (FRs) at different scales has become a heated topic recently. Since the 20th century, western academia has formed a basic idea of metropolitan areas’ (MAs) delineation based on population density and commuting rate, for which the subjectivity of threshold setting is difficult to overcome. In this study, community detection algorithms from the field of network science are employed, namely the Louvain algorithm with adjustable resolutions and Combo with high-precision output, respectively. We take the nationwide car-hailing data set as an example to explore a bottom-up method for delineating regional economic geography at different scales based on the interconnection strength between nodes. It was found that most of the prefecture-level cities in China have a dominant commuting region and two or three secondary commuting sub-regions, while regional central cities have extended their commuting hinterlands over jurisdictional boundaries, which is not common due to the larger initial administrative divisions and the comprehensive development niveau of cities. The feasibility and limitation of community detection partitioning algorithms in the application of regional science are verified. It is supposed to be widely used in regional delimitation supported by big data. Both of the two algorithms show a shortage of ignorance of spatial proximity. It is necessary to explore new algorithms that can adjust both accuracy and spatial distance as parameters.
1. Introduction
The unexpected demographic change in the last 40 years has shown profound impacts on the morphology of urbanized areas around the world [1]. The agglomeration economic phenomenon has led to a specific manifestation of concentration in industries, population, and built-up areas around growth poles worldwide [2,3,4,5]. With the “intangible hand” of the market against the barriers formed by existing administrative jurisdictions, cities are integrated inextricably with the surrounding municipalities, which is now interpreted in terms of metropolitan area, metropolitan region, mega-region, megalopolis, or urban agglomeration in the context of highly dense and continuous urban in East Asia [6].
The concept of urban agglomeration (UA) evolved initially from Gottmann (1957) as the metropolis [7], with the following concept of conurbation proposed by Geddes (1968) [8]. Afterward, the discussion with respect to large-scale contiguous urbanized areas lasted for years in terms such as the mega-urban region [9], global city-region [10], polycentric city regions [11], mega-region [12,13,14] under different social contexts. As an evolving concept, Fang argues a UA follows a spatiotemporal path from a single city to metropolitan areas (MAs), metropolitan area belts, large metropolitan area belts, and a megalopolis [6]. To summarize the common features described, urban agglomeration is recognized by one or more core cities with a population threshold and obvious functional dominance, surrounded contiguously by several big cities with which the core is closely associated. These highly integrated urbanized clusters build impacted connection through well-developed transportation and information and communications technology (ICT) infrastructure, which encourages daily commuting and flows [1,6].
Compared to the matured UAs which entered the post-industrialization stage in the European and American continents, the phenomenon of UA has demonstrated more potential and diversity in Asian countries because population evolution has coincided with the process of globalization since the last decades of the 20th century [10]. According to the United Nations 2018 world population report, among the 33 mega-cities in the world, 20 are located in Asia [15]. UA is more likely to be the future form for the Asian urbanized settlement with universal significance.
To focus on the context of China, since the beginning of the reform and opening-up policy, central cities which had the privilege of the priority development policy have become the engine of the national economic growth by becoming involved in the global industry chain and global production networks [16]. After 2000, the development of MAs and UAs has gained increasing importance with the shift in national, regional policies. The policy of urbanization was reversed for the first time at the 16th Congress of the Communist Party in 2002, promoting the coordinated development of large, medium, and small cities. Soon after, in 2007, it encouraged the nation to “take full advantage of the leading role of mega-cities and large metropolitan areas and urban agglomerations, fostering new economic growth poles.” Most recently in November 2019, the “Opinions on Establishing a More Effective Regional Coordination and Development Mechanism” clearly stated that a new model of regional development led by central cities and UAs, to promote long-term coordination and sustainability, and subsequently 19 national-level MAs/UAs planning strategies was approved [17]. However, despite the clarification of MAs/UAs in the national policy over time, the existing delineation has not reached consensus among geographers and planners. For instance, the empirical studies of various MAs/UAs’ delineation often have their own criteria and datasets, leaving a research gap for exploration until now. Given that the consistent standard for delineation is not indifferent, the results are inevitably influenced by the measurement framework. To eliminate the ambiguity and inconsistency, this paper explores a new interdisciplinary empirical method employing the full-sample nationwide car-hailing commuting dataset as a proxy to delineate the regional economic geography in the context of China.
Even though it is fundamental that the definition comes before measurement, it is an impossible task to completely portray the features of regional economic geography by one theory. As earlier geographers and economists determined the hierarchical structure within the geographical scope by the scale of the center [18,19], current regionalism shows more recognition of the theory of space of flows and urban networks [20,21]. Based on such a functional connection hypothesis of geography, scholars have gradually reached a consensus which is to use connection as a proxy to characterize the functional interaction inside MAs/UAs for boundary delineation, such as information, enterprise headquarters and branches [22,23], transportation and daily commuting of the integrated labor market [11,24,25].
One of the main objectives of the study is to delineate the regional economic geography under current development conditions, to verify whether the hypothesis of economic activities spillover happens or not in the context of China. Following the existing research, we try to explore the interdisciplinary application of community detection algorithms in the delimitation of functional regions through empirical evidence based on the accessible car-hailing commuting dataset provided by the main service provider in China. In addition to simply visualizing the origin–destination (O-D) flow, this paper employs two network-partitioning algorithms with slightly different accuracy and computation speed, namely Louvain and Combo [26,27]. These bottom-up computation approaches based on the relative relational strength of O-D pairs are expected to provide a relatively rigorous and consistent result of regional delineation covering nationwide. Additionally, it provides a new way of thinking for the delineation of boundaries in urban and regional studies and how to use the emerging massive datasets to reduce the subjectivity of previous spatial sciences relying on experience. The remainder of the paper is as follows: We review the related literature from both scholarly studies and current policy practice aspects in Section 2. Section 3 introduces the data and methods of this research. Section 4 presents the main results from both commute landscape and community partitioning scope. Finally, discussions and conclusions are conducted in Section 5 and Section 6, respectively.
2. Literature Review
Regional delineation is a classic topic for geographers and other closely allied disciplines stretching back more than one century [28], which attempts to divide space into stable territorial regions relying on physical proximity, economic integration, and cultural similarity [25]. Due to the complex and highly heterogeneous distribution of features which characterize human geography [29], a regionalization scheme that combines both spatial laws and practical framework remains very much alive and unsolved.
Instead of traditional contestable interpretive methods or semi-quantitative analysis based on the recognition of a hierarchical structure and bounded space, more recently, scholars have asserted the importance of flows and networks to better understand the space [30]. Fueled by globalization, information and communications technology (ICTs), and high-speed transportation networks, the world has witnessed dramatic changes in the past three decades, which triggered a massive global time-space compression [31,32] and a new space forms emerged termed “the space of flows” [20,33]. Compared to “the space of place”, the new space form shows a combined changing characteristic in both expanded geographical scope and intensified connections beyond the confines of boundary [34,35]. In the scope of urban and regional studies, Pflieger and Rozenblat (2010) raised their viewpoint of “The city as a network of networks” as a response to Berry’s “Cities as systems within systems of cities” proposed in 1964, which emphasized the relationality and connectivity in the new city space [36,37]. As a paradigm shift, the most prevailing concept and model are “world city networks” and “interlocking network model” proposed by GaWC (Globalization and World Cities Research Network), which offer an empirical approach to measure numerous intercity connections and even delineate functional regions at different scales [11,21]. Various data from corporate relations to transportation infrastructures were applied, while the methods have also evolved from distance-based gravity models to social network analysis [38,39,40]. However, the collection of these kinds of relational data is the “dirty little secret” for urban network research that might challenge the comparative analysis [41].
Exciting new advances in big data, especially the availability of large-scale open data from human interaction, social media, and mobility, have been experienced in the last ten years. Progress in information and communication technologies and the accumulation of massive data sets on human behavior now allow researchers to explore spatial interaction and complex patterns with unprecedented precision [42,43]. Such rich data from location-based services to social media services (i.e., mobile phone, digital footprint, smart card, and taxi trajectory data) deepens insights into human interactions in the era of “the space of flows” by providing new data sources, inspiring new analytic methods and offering new research perspectives [44,45,46,47,48,49,50,51,52], which otherwise would be impossible to understand quantitatively. Among these, some studies have focused on delineating geographical regions using both networks and community structure of human interaction, which has opened an entirely new window for those who are interested in such questions [25,43,53,54].
On the other hand, from planning and policy perspective, it is essential to define a coherent, bounded region to enable zoning, define electoral districts, and manage public services and municipal jurisdictions. One basic reason for identifying such units is that, in reality, the administrative boundary of a city/region cannot represent the actual size and impact of the labor force and economic activity happening there well. To capture its real population or economic functions, the concept of functional regions (FRs) or functional urban regions (FURs) are introduced and become more often used in urban policies. Among these, both metropolitan areas (MAs) and urban agglomerations (UAs) are typical regions whose geographical logic follows the underlying functional structure of these new patterns. Since the introduction of the concept of MAs and UAs, the bureaus of statistics and scholars of different countries have come up with a large set of methods to delineate their boundaries. The mainstream of these methods can be summarized as a two-step approach—first, identify the core spatial unit, and then identify other spatial units, denoted as the hinterland, which have a significant connection with the core. Nonetheless, although the basic idea of these methods resembles the specific data and techniques used, the identification of the core or measurement of the strength of connections differ in various ways. The U.S. Census Bureau’s delineation method can be summarized as a population-based core threshold, plus a bidirectional commuting threshold [55]. In Europe, the European Spatial Planning Observation Network (ESPON) endeavored to establish a uniform standard for the delineation of metropolitan areas, but as the data availability varies greatly among the countries, a unique standard is yet to be fully accomplished. While the density-based method for core identification is still in its conception [56], the Economic Co-operation and Development (OECD) also uses population density to define the cores. However, for the same reason as the different nature of administrative divisions—“unevenly sized and highly heterogeneous within and between countries” [57], it is difficult to define a uniform definition for all the OECD members.
In China, The National Bureau of Statistics of China has not published a national standard for the delineation of MAs and UAs. However, from the 1990s, Chinese scholars began focusing on similar topics, including defining urban economic regions through to urban agglomerations [58,59,60,61]. The methods of Chinese scholars also followed the core–hinterland scheme. For the definition of the core there have been disputes, but almost all scholars used the statutory urban districts as the core. However, due to the lack of commuting data on a nationwide base, they used a variety of other measures of connection for the definition of the hinterland, including bus ridership, industrial economic indicators, and also road network [62].
Although the core–hinterland scheme is an efficient and census-friendly way to delineate metropolitan areas, scholars have also criticized the assumptions in this two-step delineation method. Both the ex-ante selection of urban cores and the use of commuting as the single measure of connection were both challenged [4], not to mention that there is no accessible survey data on commuters in most Chinese cities. To avoid falling into the mud of the threshold discussion, this paper borrows the method of community detection based on modularity calculation, identifying FRs considering the relative strength of the connections, and a nationwide car-hailing commuting dataset is applied as a proxy to represent the commute landscape in China to delineate the functional regions (FRs) for the first time. We also want to demonstrate the “natural” patterns of community clustering compare to the official MAs/UAs through the lens of visual interpretations and network analysis. We hope our explorations provide a more empirically approach to detecting and defining MAs/UAs and show the utility of this evaluation to gain a deep understanding of the regional economic geography of China.
3. Data and Methods
3.1. Car-hailing Commuting Dataset
We used the accessible car-hailing commuting dataset provided by the most popular service provider in China to represent the commute landscape. Given that car-hailing has become one of the most convenient commute ways for people of a certain income level, the high-resolution dataset (to the scale of Jiedao/township) is supposed to provide the first chance for us to portray commute connections clearly at a fine scale. Since we focus on commuting connections inside those regions, we specifically considered the time period setting. What we employed was a car-hailing dataset of three consecutive workdays during the morning peak (7:00 to 9:30), which covered commute records of taxi-hailing service, tailored taxi, fast ride, and ride-sharing service. The four service forms almost represent different income groups. Due to the coverage of different incomes and popular use of this car-hailing service, we consider this data one of the best available commute datasets in current China. This dataset also divides the whole country into 53,979 transport statistics units (TSUs) representing towns. If we cluster the towns into larger units, we could get 338 prefecture-level city units and 2598 county-level units, which are tested for regional delineation. The total number of traveling records during the commute period was 7,213,371, which accounted for 16.5% of all-day car-hailing travels (more than 41 million records in total). We connected all the O-D points of TSUs by ArcGIS and calculated the number of travel times in each distance interval. About 98.6% of the commuter flow was less than 30 km, while 99.7% was within 80 km (7,194,509 in total, as shown in Figure 1). Considering the tolerance of commuters to time and price in reality, according to Nelson and Rae [25], the study believes that 80 km is a threshold to figure out whether the commute flow has practical significance or not. The methods used and results generated in the following parts are based on it.
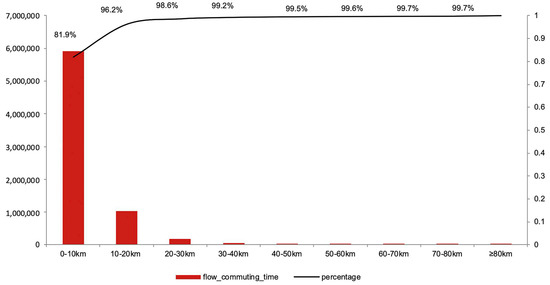
Figure 1.
Percentage of commuting flow volumes of different distance intervals.
3.2. Method
3.2.1. Identification using the Method of Community Detection
The methods employed in this research are two borrowed algorithms of community detection, namely Louvain and Combo, from the field of network science. The calculations are mutually verified to increase the robustness and quasi-determination of the research. Community detection has its theoretical root in graph theory [63], focusing on the cluster partitioning and structure features of the various complex systems [64]. The increasing accessibility of huge amounts of internet-based data sets has increasingly promoted its prosperity and application in other fields, such as biology, social networks, technological networks, and spatial networks [65,66,67]. Visualizing the complexity of communities within a network has been recognized as crucial for scholars to understand its general features [65].
A network or graph can be represented as a set of vertices, joined in pairs by edges [68]. Most of the community structure within a network follows a common rule that vertices show higher concentrations in specific groups while lower concentration between groups [65]. Communities, or modules, are groups of vertices sharing common properties and/or playing similar roles within the graph [69]. It has a very high similarity with the spatial relation demonstrated in the spatial science, that the urban core is always closely connected with a certain hinterland, while the link between two cities or two regions is loose and blurred. The in-between suburbs possibly have ambiguous connections on both sides. If we concentrate specifically on the commute flow, in reality, functional regions (FRs) could be considered as a network structure composed of commuter flows with the origin, destination, and directed segments forming the vertices and edges. The “vertices” with higher centrality sharing a large number of edges are supposed to be significant as the core area/job market inside an FRs, while vertices lying at the boundaries with limited edges connected to others may play the role as a hinterland or represent places of residence. Considering the attribute of the commute flow network, we believe that the algorithms of community detection are suitable and feasible for regional delineation in China.
3.2.2. Algorithms Used for Regional Delineation
Generally, algorithms of community partitions are valued by their computational precision within a reasonable time. The past 20 years have witnessed great progress in the development of well-performed algorithms. Famous algorithms in application include the simple greedy agglomerative optimization by Newman [68], the faster Clauset–Newman–Moore heuristic [70], and recently the Louvain method proposed by the Université catholique de Louvain, which provides an approach to find high modularity partitions of networks with large amounts of nodes in a short time and demonstrates the hierarchical structure clearly [71]. For each node i, the algorithm considers the neighbors j of i and evaluates the gain of modularity that would take place by removing i from its community and by placing it in the community of j. The node i is then placed in the community for which this gain is maximum (in case of a tie, we use a breaking rule), but only if this gain is positive. If no positive gain is possible, i stays in its original community. This process is applied repeatedly and sequentially for all nodes until no further improvement can be achieved, and the first phase is then complete. Its accuracy is verified as excellent in comparison and the algorithm has been applied widely until now [72,73,74].
In comparison, the recently emerged Combo method is an optimized algorithm with higher accuracy at the price of longer computational time proposed by Sobolevsky and Campari in 2014 [27]. The vast majority of search strategies take one of the following steps to evolve starting partitions: merging two communities, splitting a community into two, or moving nodes between two distinct communities. Combo involves all three possibilities, after selecting an initial partition made of a single community, the following steps are iterated as long as any gain in terms of the objective function score can be obtained: (1) For each source community, the best possible redistribution of every source nodes into each destination community (either existing or new) is calculated; this also allows for the possibility that the source community entirely merges with the destination; (2) the best merger, split, or recombination is performed. The modularity score of Combo is the best in the performance test, together with different algorithms, including Louvain. Furthermore, it also shows similarity to Infomap when optimizing the description code length [27], indicating much better overall quality in practice [25]. Since our dataset provides us the fine-scale computational resources to explore its mathematical properties, we employ both Louvain and Combo for the calculation to increase the robustness of the results and test their availability in the application of spatial science.
For the calculation by Louvain, we transferred the original file into Comma-Separated Values file and kept the necessary value for analysis in Gephi (Source, Target, Type, Id, Label, Weight); while the realization of Combo was via the open-source code package developed and shared by the MIT’s Senseable City Lab (http://senseable.mit.edu/community_detection/). We had a total of 53,979 nodes, using an assembly computer with a memory of 16 GB and ubuntu16.04 × 64, the calculating of Combo cost 1015.34 s in total. We used Python to number the O-D nodes in order, converting origin and destination to “vertices” format and listing the segments as “arcs”. The results calculated by Louvain and Combo include the overall modularity and module group number that each vertice belongs to. We then used ArcGIS and QGIS to match and visualize the data. It should be pointed out that both algorithms have a shortcoming in the application of spatial science; that is, the spatial distance cannot be considered as the weight factor. Instead, the weight used in calculating is only the frequency of the same O-D arcs.
4. Results
In the following section, we present the results by both algorithms after a brief visualization analysis of the general commuting landscape of the whole country and four main policy urban agglomerations. Afterward, we present the results of the Louvain and Combo approaches to detect the functional regions/clusters based on the car-hailing commuting flows inter and intra regions. With different resolutions, the algorithmic method was verified to be available to demonstrate potential FRs at various scales, namely (larger) metropolitan areas or even urban agglomerations. If the rationality of the proxy data is further improved, the effectiveness of the method will inevitably be further enhanced.
4.1. The Overall Visualized Commute Landscape
We first conducted a visualization of the car-hailing commuting dataset to get a rough depiction of the overall distribution of China’s current commute patterns. Visualizing all trips less than 80 km nationwide (Figure 2), the commute landscape confirmed the existence of some larger metropolitan areas and urban agglomerations that mainly concentrate on the coastal area previously under priority development policy, which accounted for 55.1%. In addition, Western and Central China is witnessing the formation of Chengdu, Xi’an, Chongqing, Wuhan, Changsha, Zhengzhou metropolitan areas. However, the overall commuting flow proportion of the central, western and northeastern region was still low, constituting 19.7%, 17.3%, and 7.8%, respectively, and the metropolitanization reflected by commuting was centered around several major cities, reflecting the characteristics of China’s urbanization in the previous stage. Most of the large metropolitan areas show characteristics with a unique cluster, for example, Zhengzhou, Hefei, Wuhan, and Changsha metropolitan Areas, while Qingdao, Dalian, and Xiamen perform as multiple clusters inside the boundary.
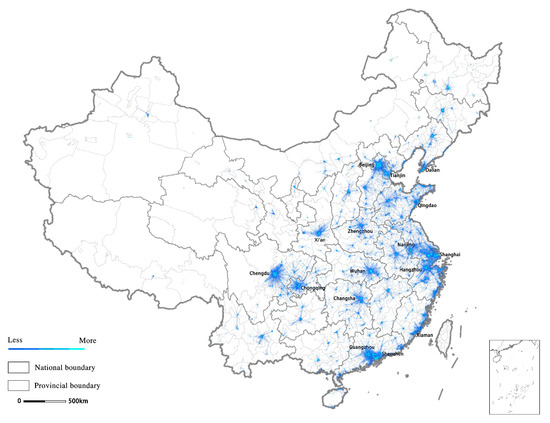
Figure 2.
The car-hailing commute landscape of 80 km or less in China.
The commuting volume is verified to be positively correlated with economic patterns and population density. Refining the scale on the four main urban agglomerations namely Yangtze River Delta (22.5%), Pearl River Delta (9.9%), Beijing–Tianjin–Hebei Region (15.7%), and Chengdu-Chongqing Region (12.2%), we could form a basic understanding of the central cities, linkage strengths of nodes, and comprehensive development level in each UA. The former two UAs have already presented as polycentric city regions in process, whereas the Beijing–Tianjin–Hebei Region has three core cities, namely Beijing, Tianjin, and Shijiazhuang, while the former two are closely connected and account for more than 80% of all commuter flows in this region. Chengdu and Chongqing still develop with less interconnection between each other due to the overall size of the economy (Figure 3).
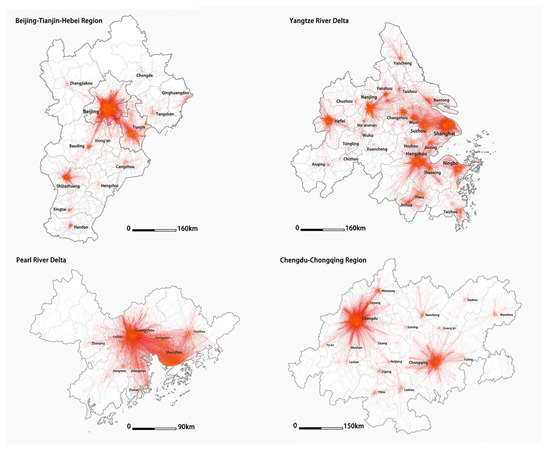
Figure 3.
The commute landscape of the four main urban agglomerations (UAs) in China.
The above visual approach provides us a simple but clear image with spatial patterns and structure. We demonstrated it here as a basis for the subsequent algorithmic results. The following parts will separately present the result by Louvain and Combo, to identify the availability and pros and cons of regional delineation methods by employing community detection algorithms.
4.2. Regionalization by Louvain
The computation process of the Louvain algorithm is completed quickly in Gephi software. With different resolutions as modularity parameters (we tried 1, 3, 5, 7, 11, 20, 50, and 100), we finally got the modularity results with a different number of communities detected and modularity resolution as follow (Table 1):

Table 1.
Result by the Louvain algorithm.
We also visualize the community partition results in, each TSU (township) with different colors indicates it is partitioned into a different community. To understand the difference more clearly, we focus on the Beijing–Tianjin–Hebei Region, Yangtze River Delta, and Pearl River Delta as the main observing regions. With the highest accuracy of Louvain, only the northern three counties of Langfang city and the towns of Baoding on the boundary of Beijing are classified to the main Beijing region, which means that the hinterland of Beijing is just slightly crossing administrative boundaries while the other prefecture-level cities have their own unique commuting hinterland within the jurisdiction. On the one hand, China’s prefecture-level administrative divisions are large in scale, as we mentioned before. In addition, it also reflects the barriers formed by the division of the administrative powers. Even in the Yangtze River Delta, the most market-oriented region in China, the cross-border region is seldom detected when the parameter setting is strict. What we detected by the Louvain algorithm were basically the same as the jurisdiction boundaries, except that the FR of Hangzhou covered the eastern part of Huzhou city and the border area together with Shaoxing, while the rest of Shaoxing city integrated into the FR of Ningbo, and prefecture-level cities in central Jiangsu Province had a relatively small area of jurisdiction but closer links in between. In comparison, the integration level of daily commuting in the Pearl River Delta was close to the borderless urban area; Guangzhou, Foshan, Dongguan, and Shenzhen and border area of Zhaoqing, Qingyuan have already formed into one cluster (Figure 4).
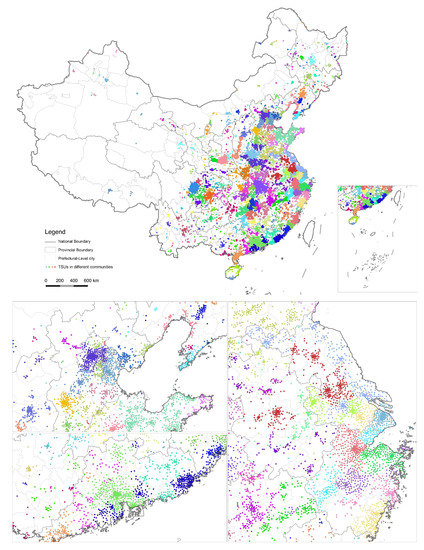
Figure 4.
Computational result of functional regions (FRs) by Louvain when Parameters/Resolution =1.
Comparing the FR pattern of different resolution intervals, four or more FRs joined into one, as shown in Figure 5. The FR computational result by the largest resolution interval provides us a clue of the objective commuting integrated urban agglomerations in China. Within the Beijing–Tianjin–Hebei Region, Baoding affiliated towns and cities along the Beijing–Guangzhou expressway, the whole jurisdiction of Langfang city and Zhangjiakou city and Tianjin affiliated Jixian were integrated into the Beijing FR, while Tangshan and the rest of Tianjin and Cangzhou city form another FR surrounding the Bohai Bay. The Yangtze River Delta comprised four FR sections with Shanghai, Hangzhou, Ningbo, and Nanjing as the core, while the commuter FR at the largest scale of the Pearl River Delta exceeded the defined boundary written in the policy (Figure 5), implying an even larger economic hinterland in the future.
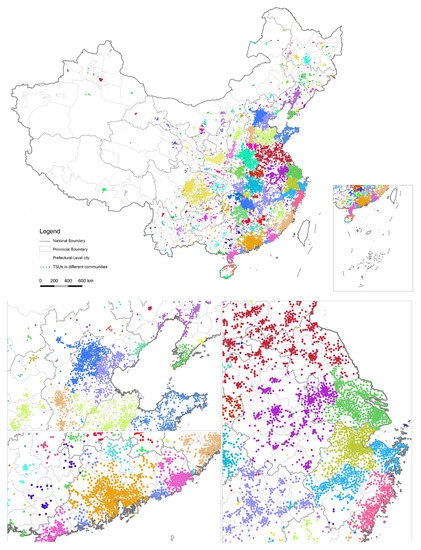
Figure 5.
Computational result of FRs by Louvain when Parameters/Resolution =100.
4.3. Regionalization by Combo
The result obtained by the Combo algorithm (Figure 6) shows an obviously higher accuracy than that of the Louvain algorithm at the cost of approximately 17 minutes of computing time. We kept the precision parameter as the original “infinity” and got 183 regions detected as the pattern below with a modularity of 0.9643. It should be noted that the Combo algorithm removed points that cannot be counted or not suitably counted into a community, so there was a significant difference in the number of the recognized communities from Louvain. The highest precision results were basically consistent with the perception of the metropolitan area defined by the daily commuting rate.
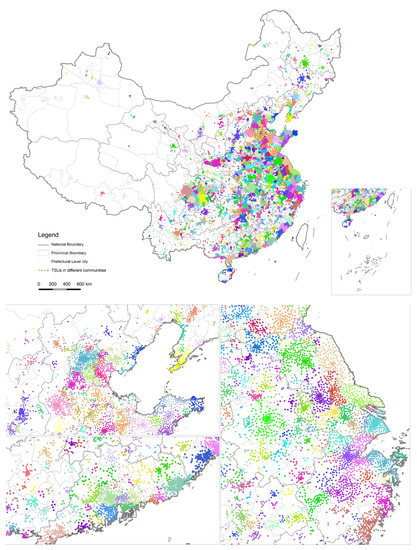
Figure 6.
FR computational result by Combo with the highest accuracy.
Most of the prefecture-level cities had a unique larger urban commuting area, with one or two smaller sub-clusters. Cities with complex topography or a larger jurisdiction, such as Chongqing city, may have more than five FRs; the influencing spheres of regional cities with functional importance have extended across the administrative boundaries, for example, Wuhan, Xi’an, Zhengzhou, and so on (Figure 7). From the results of the measurement, the Combo algorithm with a high-precision parameter setting can be applied to the city-region scale to assist in identifying spatial sub-clusters within a prefecture-level city, reducing the subjectivity relying on planners’ experience.
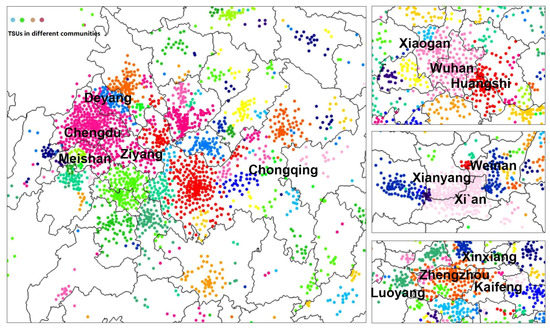
Figure 7.
Refined scope of FR result by Combo with the highest accuracy.
4.4. Comparing Larger FRs Tested by Louvain and Combo with Policy-Defined Regions
In addition to the above-mentioned results detected with town-scale car-hailing data, we also tried to increase "resolution" by merging town-scale data into county-level and city-level before applying the community detection algorithms. However, due to the limitations of the data itself that the total number of car-hailing data across the prefecture-level city was insignificant, the result was not ideal. By contrast, two different partitioning patterns have been achieved on the county scale by Louvain and Combo, respectively (Figure 8 and Figure 9). The results under the standard resolution of Louvain provide a larger regional division that characterizes the relative strength between cities, most of which have exceeded the recent policy-defined metropolitan circles that are, in fact, the 1-hour accessible area of the regional central cities [75]. The Combo algorithm still generated an image of the metropolitan area, located in or slightly beyond the administrative boundary of the prefecture-level city, while the scale was much smaller and inconsistent compared to the questionable metropolitan circle in the policy.
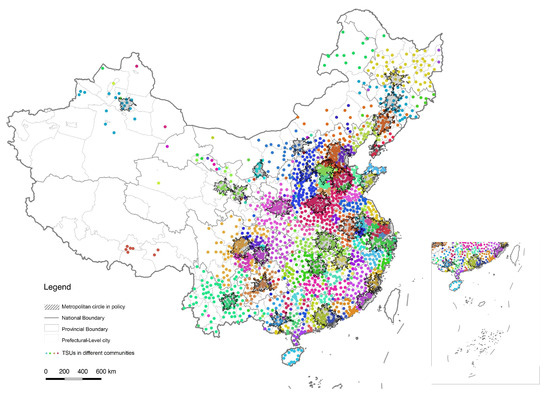
Figure 8.
Larger FRs tested by Louvain and county-level clustered data.
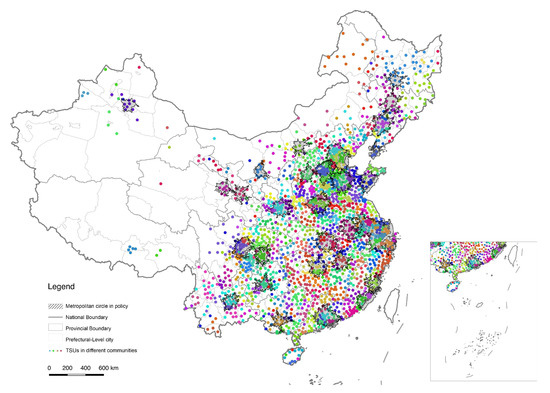
Figure 9.
Larger FRs tested by Combo and county-level clustered data.
5. Discussion
Using the new emerging car-hailing data set, this study explored the application scenarios of algorithm-based community detection methods in urban and regional studies. And the results indicate this exploration can indeed identify functional regions of different scales according to the relative connection strength between nodes employing massive data set. It could outline the boundary directly, avoiding the cumbersome calculating process of the traditional methods by defining the urbanized center and its periphery by population threshold first and then recognize the commuting hinterland with the accurate commuting percentage towards the functional center, what is more, it is also supposed to avoid the subjectivity of pre-setting centers of a region. Compared to the previous research conducted by Gu (1991) [58], Zhou and Zhang (2003) [60], and Ning (2011) [59], our research can identify potential city regions, metropolitan areas, and urban agglomerations by different parameter settings, which addresses the needs of regional boundaries delineation for planning and regional policy pre-research at different scales well. However, from another perspective, it is crucial to realize that the applicable scenarios of the two algorithms are both closely related to the setting of their parameters. The accuracy and credibility of the results depend on the researcher’s personal understanding of regions.
It is foreseeable that if we employ better proxy data set, the detected boundaries by our approach will be much closer to reality. With continuous time-series commuting data set, we could also observe the dynamic process of regional spatial evolution, which is obviously maneuverable in the era of massive increasingly accessible data. Using the computational methods borrowed from network science, a clearer spatial definition and delineation is going to be achieved, which prompts scholars to reach a wider consensus on the issue of the regional boundary, thus easing the disputes and deepening the further discussion referring to the same spatial context.
There are still two major limitations in the research so far. First, the proxy of data remains insufficient. According to the estimation, the proportion of car-hailing commute in the overall commuting flow is not dominant, so we cannot say that the regional delineation is completely solved. Taking more comprehensive full-sample proxy data, such as rail transit data, cell phone signaling data, telephony data, email, mail, or other data sets, that can characterize daily economic connection as agents is expected to have more satisfying results in the follow-up research. Second, the deficiencies of the algorithm for community detection and the ambiguity of parameter settings have not been overcome. If we return to the algorithm generation logic, it fails to take the spatial distance into consideration, which means that the highly valued “spatial proximity” in regional science is almost ignored. During the calculation process, all nodes were treated as indistinguishable points in contrast to that in reality. Cities and towns that are close to each other integrate more in terms of economy, culture, and social interaction, therefore, it is flawed to neglect the attribute of spatial proximity. In addition, as mentioned above, the accuracy of the application of the community detection algorithm is rooted in its parameter setting. Expect for more straightforward and scientific presentation, the regional delineation results under different parameter settings with those measured needed to further verified and corrected by other reliable methods. Otherwise, regional delineation still partially depends unavoidably on the subjective knowledge and empirical judgment of the researcher.
6. Conclusions
This paper employed the nationwide commuting proxy dataset for the first time to carefully identify the current functional regions at different scales. By the computational results of the two algorithms, we can conclude that in China, most prefecture-level cities have a major FR together with two to three smaller sub-clusters. The phenomenon of commuting beyond the boundaries of municipal administrative scope is relatively rare except for central cities that undertake functions as regional economic centers, the FRs of which are commonly extended along the traffic corridors to the border areas of nearby prefecture-level cities, such as Zhengzhou, Wuhan, Xi’an, Chengdu, thus demanding the coordination of regional governance. The internal commuting pattern of the three major urban agglomerations is different from what is defined by the policy. The FRs of Beijing only reach out slightly to a few towns in the east and south. The relationship between Beijing and Tianjin is not like the pattern suggested by the previous visualization. Cities with close functional linkages with Tianjin locate around the Bohai Bay, while the hinterland of Beijing is mainly towns within 100 km of Beijing, especially the eastward. As one of the world’s largest urbanized continuous zone, daily commuting in the Pearl River Delta is closely compacted into integrated regions, in particular, the Foshan–Guangzhou–Dongguan urbanized area. For the two algorithms verified in this paper, Combo shows better accuracy than Louvain. Furthermore, Combo is tested to be able to cover and observe a larger scale despite the longer computational time.
On the other hand, the study explored a refreshing method of regional delineation by employing interdisciplinary knowledge in the context of China for the first time. We are not in the succession of traditional delineation methods proposed by previous studies since the end of the 20th century, which follows the steps of identifying centers and hinterlands by population and then calculating commuting rate as the threshold. Instead, we focused more on the linkage intensity between city nodes within an FR. In addition, the nationwide commuting data set provided us a chance to inspect the bias of current regional policy. We have also depicted the overall structure of the densely urbanized area and FRs of central cities that we have ignored for a long time. If the accuracy of the data set is further increased and then overlapped with other economic, geographic information, this approach is expected to provide scientific support for regional policy development at the provincial level.
Author Contributions
Conceptualization, K.W.; Methodology, K.W. and J.T.; Software, J.T. and K.W.; Resources, Y.L. and K.W.; Writing—original draft preparation, J.T. and K.W.; Writing—Review and Editing, K.W.; Visualization, J.T. and K.W.; Supervision, K.W.; Funding acquisition, K.W.
Funding
This research was funded by the Natural Science Foundation of China, grant number 41671161/41401178/71733001, a research project of Institute for China Sustainable Urbanization, Tsinghua University, grant number K-17009-1, and the Youth Talent Support Program in University of Beijing, grant number CIT&TCD201804097.
Acknowledgments
The authors appreciate Beijing Xiaoju Technology Co, Ltd. for providing car-hailing dataset.
Conflicts of Interest
The authors declare no conflict of interest.
References
- Weber, C. Urban agglomeration delimitation using remote sensing data. In Remote Sensing and Urban Analysis: GISDATA 9; Donnay, J.P., Barnsley, M.J., Longley, P.A., Eds.; Taylor & Francis: London, UK; New York, NY, USA, 2003; pp. 131–146. [Google Scholar]
- Krugman, P. What’s new about the new economic geography? Oxf. Rev. Econ. Policy 1998, 14, 7–17. [Google Scholar] [CrossRef]
- Fujita, M.; Krugman, P. The new economic geography: Past, present and the future. In Fifty Years of Regional Science; Springer: Berlin/Heidelberg, Germany, 2004; pp. 139–164. [Google Scholar]
- Duranton, G.; Puga, D. Micro-Foundations of urban agglomeration economies. In Handbook of Regional and Urban Economics; Elsevier: Amsterdam, The Netherlands, 2004; pp. 2063–2117. [Google Scholar]
- Uchida, H.; Nelson, A. Agglomeration Index: Towards a New Measure of Urban Concentration. 2009. Available online: https://openknowledge.worldbank.org/bitstream/handle/10986/9039/WDR2009_0008.pdf?sequence=1 (accessed on 20 August 2019).
- Fang, C.; Yu, D. Urban agglomeration: An evolving concept of an emerging phenomenon. Landsc. Urban Plan. 2017, 162, 126–136. [Google Scholar] [CrossRef]
- Gottmann, J. Megalopolis or the urbanization of the northeastern seaboard. Econ. Geogr. 1957, 33, 189–200. [Google Scholar] [CrossRef]
- Geddes, P. Cities in Evolution: An Introduction to the Town Planning Movement and to the Study of Civics; Ernest Benn: London, UK, 1968. [Google Scholar]
- Gavin, J. Southeast Asian urbanization and the growth of mega-urban regions. J. Popul. Res. 2002, 19, 119–136. [Google Scholar]
- Scott, A.J.; Scott, A.J. Global City-Regions; Oxford University Press: Oxford, UK, 2001; pp. 11–30. [Google Scholar]
- Hall, P.G.; Pain, K. (Eds.) The Polycentric Metropolis: Learning from Mega-City Regions in Europe; Routledge: London, UK, 2006. [Google Scholar]
- Neuman, M.; Hull, A. The futures of the city region. Reg. Stud. 2009, 43, 777–787. [Google Scholar] [CrossRef]
- Florida, R.; Gulden, T.; Mellander, C. The rise of the mega-region. Camb. J. Reg. Econ. Soc. 2008, 1, 459–476. [Google Scholar] [CrossRef]
- Innes, J.E.; Booher, D.E.; Di Vittorio, S. Strategies for megaregion governance: Collaborative dialogue, networks, and self-organization. J. Am. Plan. Assoc. 2010, 77, 55–67. [Google Scholar] [CrossRef]
- United Nations. Department of Economic and Social Affairs, Population Division. In World Population Prospects 2019; United Nations: New York, NY, USA, 2019; Available online: https://population.un.org/wpp/Publications/Files/WPP2019_Highlights.pdf (accessed on 20 August 2019).
- Chen, L.; Xue, L. Global production networks and the upgrading of China’s integrated circuit industry. China World Econ. 2010, 18, 109–126. [Google Scholar] [CrossRef]
- CPC; The State Council. Opinions on Establishing a More Effective Regional Coordination and Development Mechanism. Beijing, China, Press Release; 2018. Available online: http://www.gov.cn/zhengce/2018-11/29/content_5344537.htm (accessed on 26 August 2019).
- Christaller, W. Die Zentralen Orte in Süddeutschland: Eine Ökonomisch-Geographische Untersuchung Über Die Gesetzmässigkeit Der Verbreitung Und Entwicklung Der Siedlungen Mit Städtischen Funktionen; Gustav Fisher Verlag: Jena, Germany, 1933. [Google Scholar]
- Lösch, A. Die Räumliche Ordnung Der Wirtschaft; Verlag von Gustav Fischer: Stuttgart, Germany, 1944. [Google Scholar]
- Castells, M. The Rise of the Network Society; Blackwell: Cambridge, MA, USA, 1996. [Google Scholar]
- Taylor, P.J. World City Network: A Global Urban Analysis; Routledge: London, UK; New York, NY, USA, 2004. [Google Scholar]
- Karlsson, C.; Olsson, M. The identification of functional regions: Theory, methods, and applications. Ann. Reg. Sci. 2006, 40, 1–18. [Google Scholar] [CrossRef]
- Khanna, P. Connectography: Mapping the Future of Global Civilization; Random House: New York, NY, USA, 2016. [Google Scholar]
- Duranton, G. Delineating metropolitan areas: Measuring spatial labour market networks through commuting patterns. In The Economics of Interfirm Networks; Watanabe, T., Uesugi, I., Ono, A., Eds.; Springer: Tokyo, Japan, 2015. [Google Scholar]
- Nelson, G.D.; Rae, A. An economic geography of the United States: From commutes to megaregions. PLoS ONE 2016, 11, e0166083. [Google Scholar] [CrossRef]
- De Meo, P.; Ferrara, E.; Fiumara, G.; Provetti, A. Generalized louvain method for community detection in large networks. In Proceedings of the 2011 11th International Conference on Intelligent Systems Design and Applications, ISDA 2011, Córdoba, Spain, 22–24 November 2011; pp. 88–93. [Google Scholar]
- Sobolevsky, S.; Campari, R.; Belyi, A.; Ratti, C. General optimization technique for high-quality community detection in complex networks. Phys. Rev. E 2014, 90, 012811. [Google Scholar] [CrossRef] [PubMed]
- Sng, T.H.; Chia, P.Z.; Feng, C.-C.; Wang, Y.-C. Are China’s provincial boundaries misaligned? Appl. Geogr. 2018, 98, 52–65. [Google Scholar] [CrossRef]
- Hartshorne, R. The nature of geography: A critical survey of current thought in the light of past. Ann. Assoc. Am. Geogr. 1939, 29, 413–658. [Google Scholar] [CrossRef]
- Batty, M. The New Science of Cities; The MIT Press: Cambridge, MA, USA, 2013. [Google Scholar]
- Bridge, G. Mapping the terrain of time-space compression: Power networks in everyday life. Environ. Plan. D-Soc. Space 1997, 15, 611–626. [Google Scholar] [CrossRef]
- Kivisto, P. Time-space compression. In Wiley-Blackwell Encyclopedia of Globalization; Wiley-Blackwell: New York, NY, USA, 2012. [Google Scholar]
- Castells, M. The Information City: Information Technology, Economic Restructuring, and the Urban-Regional Progress; Blackwell: Oxford, UK; Cambridge, MA, USA, 1989. [Google Scholar]
- Zook, M.A. Old hierarchies or new networks of centrality? The global geography of the Internet content market. Am. Behav. Sci. 2001, 44, 1679–1696. [Google Scholar] [CrossRef]
- Rietveld, P.; Vickerman, R. Transport in regional science: The ‘death of distance’ is premature. Pap. Reg. Sci. 2004, 83, 229–248. [Google Scholar] [CrossRef]
- Pflieger, G.; Rozenblat, C. Urban networks and network theory: The city as the connector of multiple networks. Urban Stud. 2010, 47, 2723–2735. [Google Scholar] [CrossRef]
- Berry, B.J.L. Cities as systems within systems of cities. Pap. Reg. Sci. 1964, 13, 147–163. [Google Scholar] [CrossRef]
- Taylor, P.J.; Evans, D.M.; Pain, K. The UK space economy as practiced by advanced producer service firms: Identifying two distinctive polycentric city-regional processes in contemporary Britain. Int. J. Urban Reg. Res. 2009, 33, 700–718. [Google Scholar] [CrossRef]
- Alderson, A.S.; Beckfield, J.; Sprague-Jones, J. Intercity Relations and Globalization: The Evolution of the Global Urban Hierarchy, 1981–2007. Urban Stud. 2010, 47, 1899–1923. [Google Scholar] [CrossRef]
- Goei, B.D.; Burger, M.J.; Oort, F.G.V.; Kitson, M. Functional Polycentrism and Urban Network Development in the Greater South East, United Kingdom: Evidence from Commuting Patterns, 1981–2001. Reg. Stud. 2010, 44, 1149–1170. [Google Scholar] [CrossRef]
- Short, J.R.; Kim, Y.; Kuus, M.; Wells, H. The Dirty Little Secret of World City Research: Data Problems in Comparative Analysis. Int. J. Urban Reg. Res. 1996, 20, 697–717. [Google Scholar] [CrossRef]
- Lazer, D.; Pentland, A.S.; Adamic, L.; Aral, S.; Barabasi, A.-L.; Brewer, D.; Christakis, N.; Contractor, N.; Fowler, J.; Gutmann, M.; et al. Life in the network: The coming age of computational social science. Science 2009, 323, 721–723. [Google Scholar] [CrossRef] [PubMed]
- Sobolevsky, S.; Szell, M.; Campari, R.; Couronne, T.; Smoreda, Z.; Ratti, C. Delineating geographical regions with networks of human interactions in an extensive set of countries. PLoS ONE 2013, 8, e81707. [Google Scholar] [CrossRef] [PubMed]
- Ratti, C.; Frenchman, D.; Pulselli, R.M.; Williams, S. Mobile landscape: Using location data from cell phones for urban analysis. Env. Plan. B-Plan. Des. 2006, 33, 727. [Google Scholar] [CrossRef]
- González, M.; Hidalgo, C.; Barabási, A.L. Understanding individual human mobility patterns. Nature 2008, 453, 779–782. [Google Scholar] [CrossRef] [PubMed]
- Liu, Y.; Kang, C.; Gao, S.; Xiao, Y.; Tian, Y. Understanding intra-urban trip patterns from taxi trajectory data. J. Geogr. Syst. 2012, 14, 463–483. [Google Scholar] [CrossRef]
- Liu, Y.; Sui, Z.W.; Kang, C.G.; Gao, Y. Uncovering patterns of inter-urban trip and spatial interaction from social media check-in data. PLoS ONE 2014, 9, e86026. [Google Scholar] [CrossRef]
- Long, Y.; Thill, J.C. Combining smart card data and household travel survey to analyze jobs–housing relationships in Beijing. Comput. Environ. Urban Syst. 2015, 53, 19–35. [Google Scholar] [CrossRef]
- Tang, J.J.; Liu, F.; Wang, Y.; Wang, H. Uncovering urban human mobility from large scale taxi GPS data. Phys. A Stat. Mech. Appl. 2015, 438, 140–153. [Google Scholar] [CrossRef]
- Huang, W.; Li, S.N. Understanding human activity patterns based on space-time-semantics. ISPRS-J. Photogramm. Remote Sens. 2016, 121, 1–10. [Google Scholar] [CrossRef]
- Ilieva, R.T.; McPhearson, T. Social-media data for urban sustainability. Nat. Sustain. 2018, 1, 553. [Google Scholar] [CrossRef]
- Marti, P.; Serrano-Estrada, L.; Nolasco-Cirugeda, A. Social media data: Challenges, opportunities and limitations in urban studies. Comput. Environ. Urban Syst. 2019, 74, 161–174. [Google Scholar] [CrossRef]
- Ratti, C.; Sobolevsky, S.; Calabrese, F.; Andris, C.; Reades, J.; Martino, M.; Claxton, R.; Strogatz, S.H. Redrawing the map of Great Britain from a network of human interactions. PLoS ONE 2010, 5, e14248. [Google Scholar] [CrossRef] [PubMed]
- Kallus, Z.; Barankai, N.; Szüle, J.; Vattay, G. Spatial fingerprints of community structure in human interaction network for an extensive set of large-scale regions. PLoS ONE 2015, 10, e0126713. [Google Scholar] [CrossRef] [PubMed]
- United States Census Bureau. History: Metropolitan Areas. U.S. Census Bureau, 31 March 2014. Available online: http://www.census.gov/history/www/programs/geography/metropolitan_areas.html (accessed on 17 June 2015).
- European Spatial Planning Observation Network (ESPON). Study on Urban Functions. ESPON Project 1.4.3. 2007. Available online: https://www.espon.eu/sites/default/files/attachments/fr-1.4.3_April2007-final.pdf (accessed on 17 June 2015).
- OECD. Redefining Urban: A New Way to Measure Metropolitan Areas. OECD Publishing, 2012. Available online: http://dx.doi.org/10.1787/9789264174108-en (accessed on 17 June 2015).
- Gu, C. A preliminary study on the division of urban economic regions in China. Acta Geogr. Sin. 1991, 46, 129–141. (In Chinese) [Google Scholar]
- Ning, Y. Definition of Chinese metropolitan areas and large urban agglomerations: Role of large urban agglomerations in regional development. Sci. Geogr. Sin. 2011, 31, 257–263. (In Chinese) [Google Scholar]
- Zhou, Y.; Zhang, L. China’s urban economic region in the open context. Acta Geogr. Sin. 2003, 58, 271–284. (In Chinese) [Google Scholar]
- Zhang, Q.; Hu, Y.; Liu, J.; Liu, Y.; Ren, W.; Li, J. A quantitative assessment of the distribution and extent of urban clusters in China. J. Geogr. Sci. 2012, 22, 137–151. [Google Scholar] [CrossRef]
- Ma, Y.; Xue, F. Deciphering the spatial structures of city networks in the economic zone of the West Side of the Taiwan Strait through the lens of functional and innovation networks. Sustainability 2019, 11, 2975. [Google Scholar] [CrossRef]
- Bollobás, B. Modern Graph Theory; Springer Science & Business Media: Berlin/Heidelberg, Germany, 2013; Volume 184. [Google Scholar]
- Lancichinetti, A.; Fortunato, S.; Radicchi, F. Benchmark graphs for testing community detection algorithms. Phys. Rev. E 2008, 78, 046110. [Google Scholar] [CrossRef] [PubMed]
- Girvan, M.; Newman, M.E. Community structure in social and biological networks. Proc. Natl. Acad. Sci. USA 2002, 99, 7821–7826. [Google Scholar] [CrossRef] [PubMed]
- Pereira-Leal, J.B.; Enright, A.J.; Ouzounis, C.A. Detection of functional modules from protein interaction networks. Proteins 2004, 54, 49–57. [Google Scholar] [CrossRef] [PubMed]
- Manley, E. Identifying functional urban regions within traffic flow. Reg. Stud. Reg. Sci. 2014, 1, 40–42. [Google Scholar] [CrossRef]
- Newman, M.E. The structure and function of complex networks. SIAM Rev. 2003, 45, 167–256. [Google Scholar] [CrossRef]
- Fortunato, S. Community detection in graphs. Phys. Rep. 2010, 486, 75–174. [Google Scholar] [CrossRef]
- Clauset, A.; Newman, M.E.; Moore, C. Finding community structure in very large networks. Phys. Rev. E 2004, 70, 066111. [Google Scholar] [CrossRef]
- Blondel, V.D.; Guillaume, J.L.; Lambiotte, R.; Lefebvre, E. Fast unfolding of communities in large networks. J. Stat. Mech. Theory Exp. 2008, 2008, P10008. [Google Scholar] [CrossRef]
- De Montis, A.; Cashili, S.; Chessa, A. Commuter networks and community detection: A method for planning sub regional areas. Eur. Phys. J.-Spec. Top. 2013, 215, 75–91. [Google Scholar] [CrossRef]
- Betzel, R.F.; Griffa, A.; Avena-Koenigsberger, A.; Goñi, J.; Thiran, J.P.; Hagmann, P.; Sporns, O. Multi-scale community organization of the human structural connectome and its relationship with resting-state functional connectivity. Netw. Sci. 2013, 1, 353–373. [Google Scholar] [CrossRef]
- Hong, Q.; Kim, S.; Cheung, S.C.; Bird, C. Understanding a developer social network and its evolution. In Proceedings of the 2011 27th IEEE international conference on software maintenance (ICSM), Williamsburg, VA, USA, 25–30 September 2011; pp. 323–332. [Google Scholar]
- National Development and Reform Commission (NDRC). People Republic of China. The Guidance of Cultivate and Development the Modern Metropolitan Circles; NDRC: Beijing, China, 2019. Available online: http://www.ndrc.gov.cn/gzdt/201902/t20190221_928325.html?from=timeline&isappinstalled=0 (accessed on 16 October 2019).


© 2019 by the authors. Licensee MDPI, Basel, Switzerland. This article is an open access article distributed under the terms and conditions of the Creative Commons Attribution (CC BY) license (http://creativecommons.org/licenses/by/4.0/).