Abstract
According to the Intergovernmental Panel on Climate Change (IPCC) Reports, climate variability and changes increase the possibility of extreme weather events causing climate-related hazards and the risk of natural disasters. A storm is one of the most common and serious natural hazards that pose significant human and economic damage costs worldwide. The Korean Peninsula is also at persistent risk of hydro-meteorological disasters induced by rainstorms and typhoons due to geomorphological features and climate change impacts. This study has, therefore, proposed the damage vulnerability index for a spatial assessment of the damage vulnerability to storms, based on the IPCC’s vulnerability assessment concept. The damage vulnerability index is aggregated from the potential indicator for the potential damage targets, estimated by the population and major facility densities, and the risk indicator for the expected damage risk, estimated by the risk analysis for integrating both frequency and severity of human and economic damage cost records. The damage vulnerability index can assess regions vulnerable to the disaster damage induced by rainstorms, typhoons, and both, respectively, over the 231 administrative districts in the Republic of Korea. It is expected that the proposed damage vulnerability index can provide realistic and practical information on sustainable damage mitigation plans for the nationwide administrative districts against storm-induced disasters.
1. Introduction
The Intergovernmental Panel on Climate Change (IPCC) Reports [1,2,3] have indicated that climate variability and changes lead to an increase in frequency, intensity, and duration of extreme events, which can cause more severe climate-related hazards increasing the risk of natural disasters. Changes in the frequency and severity of climate-related hazards affect not only the disaster risk itself but also the spatial and temporal patterns of vulnerable populations and assets exposed to natural hazard risks [4]. Natural disasters can cause catastrophic loss of life and enormous damage to property. A storm is one of the hydro-meteorological hazards that can also trigger flood disasters, and storms and floods are the most common and devastating natural disasters worldwide. The Emergency Events Database (EM-DAT) [5] recorded that storm and flood disasters accounted for 71.6% of all types of natural disasters in the last two decades between 1998 and 2017. According to the EM-DAT [5] data, storms and floods affected a large number of people about 2.7 billion (61% of the total affected people from natural disasters), and they were also reported as major types of natural disasters with economic losses of about US$1986 billion (69% of the total economic losses from natural disasters) over the last two decades. In the Korean Peninsula located between the East Asian Continent and the Western Pacific Ocean, hydro-meteorological disasters occur almost every year mainly due to storms, such as rainstorms (convective storms) and typhoons (tropical storms). From 1998 to 2017, rainstorms and typhoons affected about 240 thousand and 160 thousand people, respectively, with economic losses totaling about US$7.5 and 13.4 million, respectively, based on the 2017 consumer price index (CPI), as reported by the National Disaster Information Center in the Republic of Korea [6]. The cumulative damage costs from storms during the last two decades accounted for about 88% of the total damage costs from natural disasters, which gives evidence that rainstorms and typhoons are the most dominant natural hazards in the Korean Peninsula.
Since the IPCC Third Assessment Report (TAR) [1] reported that flood-related hazards and disasters can be linked to climate variability and change, there has been an increasing number of natural disasters triggered by more intense storm events, such as local torrential downpours and super typhoons due to climate change [4]. As growing climate-related hazards and risks pose a dire threat to humans and the environment, the assessment of vulnerability to natural disasters becomes an essential tool to provide fundamental and relevant information on responses to emerging climate-induced hazards and the mitigation of damage from climate-related disasters. The IPCC (TAR) [1] also proposed a conceptual framework for the assessment of vulnerability to climate change as a function of a system’s exposure, sensitivity, and adaptive capacity to adverse effects of climate change. The IPCC TAR [1] defined “exposure” as “the nature and degree to which a system is exposed to significant climatic variations”, “sensitivity” as “the degree to which a system is affected by climate-related stimuli”, and “adaptive capacity” as “the ability of a system to adjust to climate change, to moderate potential damages, to take advantage of opportunities, or to cope with the consequences”. Holmes and Croot [7] also described the IPCC’s three components for the assessment of vulnerability to flood-related disasters, such that “exposure” is “an area’s predisposition to disruption by a flooding event due to its location in the same area of influence”, “sensitivity” is “the elements exposed within the system (e.g., people, property, infrastructure, etc.) which influence the probabilities of being harmed at times of hazardous floods”, and “adaptive capacity” is “the capacity of a system to endure a hazard/disaster event, such as a flood, maintaining significant levels of organization in its social, economic, environmental, and physical components”.
To provide the overall performance comparison outcomes in vulnerability assessments based on the IPCC’s definition, the three assessment components have usually been aggregated into a single composite indicator through one of the following four major frameworks. First, after Adger [8] proposed that vulnerability to climate change can be quantified by a general function for aggregating the IPCC’s three assessment components, the composite indicators have been compiled individually from exposure, sensitivity, and adaptive capacity components to measure the vulnerability to natural disasters, as conducted in the selected previous studies for the flood vulnerability in coastal areas [9,10], in national industrial parks [11], and in urban areas [12]. Second, following another assessment framework using the potential impact component as a function of exposure and sensitivity components by Metzger et al. [13], vulnerability to climate-related disasters has been evaluated, as presented in some selected previous studies for the flood vulnerability in watersheds [14], in urban areas by land-use changes [15,16], and in coastal metropolitan areas [17]. Third, as Hahn et al. [18] proposed the livelihood vulnerability index based on the IPCC’s three components, the sensitivity component is combined with the difference between exposure and adaptive capacity components to assess vulnerability to natural disasters, as shown in the selected previous studies for the livelihood vulnerability in wetland communities [19], in farming communities, [20], horticultural districts [21], and riverine communities [22]. Fourth, in accordance with the Method for the Improvement of Vulnerability in Europe (MOVE) framework [23] for combining the exposure component with an average of sensitivity and adaptive capacity components as presented by Depietri et al. [24], some other selected previous studies have assessed vulnerability to the multi-hazards in urban areas [25] and in coastal deltas [26], and the flood in urban areas [27,28].
A similar approach to the livelihood vulnerability index [18] was attempted to develop the potential flood index in the long-term national comprehensive master plan for water resources in the Republic of Korea [29]. The potential flood index [29] is evaluated as the product of the two major components, such as the potential and risk indicators. The potential component represents the system (people, property, and infrastructure) potentially affected by floods, which is identical to the sensitivity component, as described in Holmes and Croot [7]. The risk component is estimated by the difference between the likelihood of flood damage and coping with flood damage, which is comparable to the difference between exposure and adaptive capacity components in the livelihood vulnerability index [18]. There are, however, limitations in the construction framework for the potential flood index [29] by the multiplicative aggregation function, whose overall outcomes are computed to be zero when either of the potential or risk components is zero. Moreover, it is difficult to interpret the meaning of negative values of the risk component computed by the difference between the two sub-components. This study has, therefore, developed an assessment method that uses a new aggregation function to improve aggregation performance in the existing multiplicative utility function and constructs the risk component based on the risk analysis of the historical damage cost data to reduce the uncertainty in the proxy variables being used. This study has proposed the damage vulnerability index to storms based on the basic structure of the potential flood index [29] as a comprehensively revised one for the assessments of vulnerability to storms that pose the greatest human and economic damage in the Korean Peninsula due to climate change impacts as well as geomorphological features. As for the spatial assessment outcomes of the damage vulnerability to storms for the 231 administrative districts in the Republic of Korea, the three damage vulnerability indexes are presented with regard to the causes of damage costs, such as rainstorms, typhoons, and both, respectively. It is expected that more feasible and realistic assessment outcomes of vulnerability to storms can be generated through the proposed assessment methodology based on the comprehensive analysis of both frequency and severity of damage costs from rainstorms and typhoons.
2. Materials and Methods
2.1. Assessment Framework
One of the assessment frameworks for vulnerability to floods was developed to estimate the potential flood damage index () in the long-term national comprehensive master plan for water resources in the Republic of Korea [29]. The comprises the two major components, such as the potential indicator and the risk indicator. The potential indicator is estimated by population, property, urbanization, and social overhead capital to measure the potential damage. The risk indicator is estimated by likelihood variables with positive values and coping variables with negative values to measure the damage risk. The can be estimated by the product of the two major components as presented by the Korea Institute of Construction Technology (KICT) [29]:
where is the likelihood indicator, and is the coping indicator. and are weighting factors of the two major component indicators where the equal weights of 0.5 are applied.
Hahn et al. [18] proposed the livelihood vulnerability index () for comprehensively assessing risks from climate variability and change in Mozambique through the two alternative methods. One scheme computes the from the IPCC’s three components such as exposure, sensitivity, and adaptive capacity, as presented in Hahn et al. [18]:
where is the sensitivity indicator, is the exposure indicator, and is the adaptive capacity indicator.
The framework structure of the is similar to that of the incorporating the IPCC’s vulnerability definition [1]. As for the both frameworks of and in Equations (1) and (2), each first term represents target elements of the system likely to be harmed at times of hazards, and each second term is evaluated by the difference between the degree of influence on the system by hazards ( or ) and the ability of resilience in the system to hazards ( or ). In the IPCC’s vulnerability framework [1], the relationship to vulnerability is positive for the exposure and sensitivity components but negative for the adaptive component, as denoted by the minus signs in Equations (1) and (2). Hence, the second terms in Equations (1) and (2) can be negative, which consequently leads to the negative outcomes of vulnerability. Since it might not be reasonable to regard the zero or negative outcome of the second terms as the complete prevention of hazard-induced disaster damage, there could be difficulty and discrepancy in the coherent interpretation of vulnerability assessment outcomes of the both and . In addition, the coping and the adaptive capacity components are estimated by a variety of proxy variables in extensive areas such as social, economic, environmental, and physical measures. Hence, the and are bound to accommodate themselves to the nature of more uncertainty than other component indicators [30], especially when they are measured by perceptions, behaviors, and policies, such as governance and administrative capability, social benefits and networks, human capital and institutions, health and technology, and so on. Such features might cause difficulties and limitations in direct quantification of their effects on hazard damage mitigation. Therefore, it is deemed appropriate to consider the disaster damage characteristics for the second components ( and ) in the and the assessments, in that historical damage cost records can represent the consequences of a lack of resilience ability to respond to influences by hazards and disasters. Based on the major assessment components of the , this study has proposed a new damage vulnerability index as
where is the potential indicator that represents the target elements likely to be affected by storms. is the risk indicator that represents the storm damage risk measured by historical human and economic damage cost data. The details on the two major components and the aggregation function for them are addressed when the assessment indicators are constructed in Section 2.3.
2.2. Study Site
As shown in Figure 1, the nationwide 231 administrative districts in the Republic of Korea were chosen for the damage vulnerability assessments based on the human and economic damage costs caused by rainstorms and typhoons.
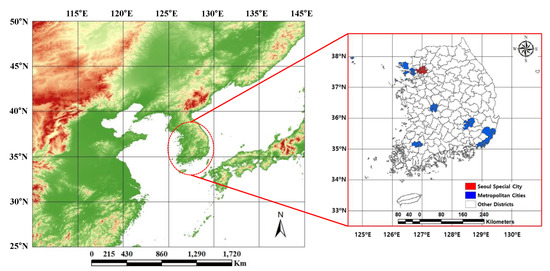
Figure 1.
The location and the 231 administrative districts of the Republic of Korea under study.
The study site is located between 33~43°N and 124~131°E in the middle latitudes of the Northern Hemisphere. Since this study site lies in the southern part of the Korean Peninsula belonging to the east coast of the Eurasian Continent and also facing the Western Pacific, it shows both continental and oceanic climate features. The average annual precipitation is 1237.4 mm from 1912 to 2017 over the entire study site, and more than half of the annual amount is concentrated in the wet season from June to September [31]. It is due to a rainy period of the East Asian Monsoon in summer and several typhoons during summer and early autumn. Severe rainstorms and typhoons have brought flooding to some areas every year, leading to serious annual storm damage to people and property in the study site (see Table 2 and Figure 3 for details). The average winter temperature is 1.2 °C, and the average precipitation amount is 94.1 mm from 1912 to 2017 [31]. There is little snow accumulation outside of mountainous regions. With mountain areas being about 70% of the country’s terrain and the high growth of urban areas through the rapidly industrializing economy and agrarian transition, the population and infrastructure tend to be concentrated in large cities, such as the Seoul Special City, the largest (605.2 km2) and capital, and the six metropolises including Busan, Incheon, Daegu, Daejeon, Gwangju, and Ulsan as denoted in Figure 1.
2.3. Data Construction
For the assessments of the in terms of the storm damage characteristics, the two major component indicators and need to be constructed by focusing on human and physical impacts from hazardous storms, as denoted in Table 1.

Table 1.
The assessment components and proxy variables for the damage vulnerability index focused on human and physical factors.
To represent the human and physical features likely to be affected by storm events, the potential indicator was evaluated by the population density and major facilities area ratio for each administrative district. The population data were collected from the Korean Statistical Information Service [32]. The major facility areas denote the total areas of residential, industrial, commercial, agriculture, transport, and public facilities, which were collected from the land cover and use map by the National Environment Information Network System [33].
As described in Section 2.1, the risk indicator can be estimated by a risk quantification based on historical records of the storm-induced damage cost data. This study has adopted the storm damage risk values as the proxy variables for the , which can measure complex characteristics of both frequency and severity of historical damage costs, better than the cumulative or average magnitude of the past damage cost records. In many mathematical methods used for quantitative analysis, the risk is often measured as the expected value of an undesirable outcome such as the occurrence probability of the accident multiplied by the consequence loss of the accident. Hence, the total risk for all accidents can be expressed as the sum over individual risks for each different accident [34]:
where is the total risk for the all accidents , is the loss of the accident , and ) is the occurrence probability of . Note that this concept was first used to calculate safety levels for a flood protection program in the Netherlands, known as the Delta Works in 1953, with the aid of a mathematician [34].
For the human and physical features in the storm-induced damage risk, the risk indicator is evaluated by both the human damage risk and the economic damage risk for each administrative district. The human damage costs indicate the total deaths and the total affected. The total deaths are defined as persons confirmed as dead, missing, and presumed dead after a storm, and the total affected is defined as the sum of the injured, evacuated, and left homeless after a storm, as addressed in the EM-DAT [5]. The economic damage costs indicate the losses on buildings, ships, public facilities, crops, etc., as collected and reported by the National Disaster Information Center [6]. For the equivalent evaluation of the economic damage amount over the years, all the damage cost records were adjusted by the inflation rates based on the 2017 CPI. The human and economic damage data were collected for the major causes of rainstorms (heavy rains or downpours) and typhoons over the past two decades during 1998 and 2017 from the National Disaster Information Center [6]. The occurrence probabilities were estimated by the log-normal probability distribution functions of the historical storm damage data by each cause to be analyzed. As it is known that the log-normal distributions adequately fit the flood damage data in general [35], a log-normal distribution function was selected to represent the occurrence probability of storm damage losses. The mean and standard deviation values of the logarithmic historical damage data were estimated for the shape and scale parameters of each log-normal distribution function in the analysis of human and economic damage records induced by rainstorm, typhoon, and both, respectively. The appropriate performance of all the lognormal distributions for each historical damage dataset was demonstrated by the three goodness of fit tests, such as the Chi-square test [36], Kolmogorov Smirnov test [37], and Cramer-von Mises test [38].
The two major component indicators and can be linearly aggregated from the sub-components for human and physical features with the equal weights of 1/2 as
and,
Note that both and outcomes derived by the additive aggregation functions could compensate for a low value in one component with a high value in another component.
Another aggregation scheme needs to combine the two major assessment components and into a composite indicator for measuring the overall damage vulnerability to storms. The composite indicators are compiled from component indicators by additive or multiplicative multi-attribute utility functions, in general [39]. The multiplicative forms offers lower compensability for components with lower values, while additive forms allows constant trade-offs between components for all cases [39]. The multiplicative aggregations are deemed more appropriate when composite indicator outcomes with lower scores in one component will not be fully compensated in another component. Thus, the multiplicative aggregation functions are popularly employed, as used for the and the in Equations (1) and (2). On the other hand, there is such a noticeable specificity in the multiplicative composite indicators that one of the much lower components can seriously diminish the overall outcomes, for instance, the composite indicator becomes zero when one of the components is zero regardless of the much higher score of other components. Hence, this study has proposed the derived by another aggregation scheme to complement such disadvantages of the conventional multiplicative utility function as
Note that the above equation adopts the root mean square difference of the two assessment components and from the maximum value of 1. Since a root term in Equation (7) can be minimized when the difference between and is minimal as well as the sum of and is maximal, the is expected to be higher when the two assessment components and are both higher. In addition, Equation (7) with some degree of compensability, cannot be zero even if either or is zero, unlike the multiplicative aggregation function.
Furthermore, for the equivalent comparison of different scaled datasets all the indicators and proxy variables need to be transformed into the normalized values by the ratio to each maximum value at each aggregation process scheme as
3. Results
3.1. Assessment Component Indicators
Figure 2 shows the spatial distributions of the potential indicator along with the potential of human factor and the potential of physical factor over the study site in Figure 2a–c and around the Seoul metropolitan area in Figure 2d–f, respectively. The values in Figure 2c are much higher in the metropolises such as Busan, Incheon, Daegu, Daejeon, Gwangju, and Ulsan including the metropolitan area of the Seoul Special City in Figure 2f that have higher values of both the population density for the and the infrastructure area ratio for the . On the contrary, nearly 75% of total districts shows relatively lower values, less than 0.3. It is due to the fact that about 70% of the land area is mountainous and mostly uninhabitable, and rapid urban growth and migration have contributed to higher population density in urban areas. According to the 2017 Population and Housing Census of the Statistics Geographic Information Service [40], 81.5% of the total population resides in urban areas and cities. As shown in Figure 2d–f, the northwestern districts in the Seoul Special City and the surrounding areas are highly urbanized and densely populated with about half of the total population.
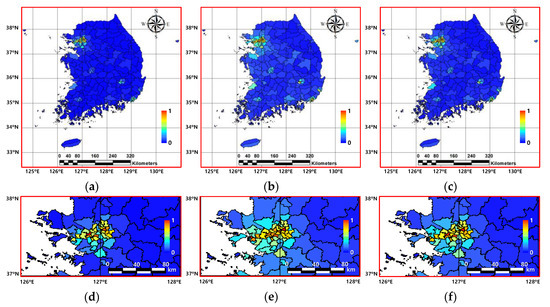
Figure 2.
Spatial distributions of the potential components for the damage vulnerability index over the whole study site: (a) the potential of human factor ; (b) the potential of physical factor ; and (c) the potential indicator , and over the zoomed-in area around the Seoul Special City: (d) ; (e) ; and (f) .
The officially recorded damage costs induced by rainstorms and typhoons were collected from the National Disaster Information Center [6]. Table 2 summarizes the data statistics of the historical damage data from 1998 to 2017 over the nationwide 231 administrative districts. As for the total number of damage events in the 231 administrative districts, rainstorm-induced damage events occur more frequently than typhoon-induced damage events, and economic damage cases are about twice human damage cases, as denoted in Table 2. Table 2 also indicates that much greater cumulative and event average amounts of economic costs are induced by typhoons rather than rainstorms, which implies that typhoons can cause more severe damage to property in the study site. For a comprehensive, integrated measure of both frequency and severity of damage costs in each administrative district, the risk component was estimated as the sum of the expected values computed by the occurrence probability of a damage event multiplying the damage cost through Equation (4). Figure 3 denotes the yearly changes in the total occurrence records of the human and economic damage events over the nationwide 231 administrative districts. The number of damage events in 2012 was the highest during the last two decades in the study site. Overall, the yearly historical damage records change with a slightly increasing trend in a periodic pattern inferred from the climate change impact associated with the El Niño–southern oscillation (ENSO).
Table 2.
Data statistics of the past human and economic damage costs induced by rainstorms and typhoons over the nationwide 231 administrative districts from 1998 to 2017.
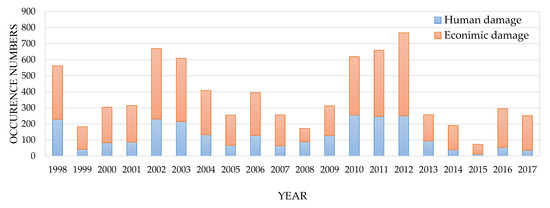
Figure 3.
Yearly changes in the number of occurrence records of storm-induced human and economic damage cases over the nationwide 231 administrative districts from 1998 to 2017.
Figure 4, Figure 5 and Figure 6 compare spatial distributions over the study site of the human and economic damage characteristics based on the historical damage costs from storm events in the last two decades from 1998 to 2017, assessed as the three measures such as cumulative occurrence magnitude, event average magnitude, and damage risk magnitude. All the magnitude values were normalized by Equation (8) for both human and economic damage records induced by rainstorms in Figure 4, by typhoons in Figure 5, and by both rainstorms and typhoons in Figure 6, respectively. Cumulative and average magnitudes are typical measures in a basic statistical analysis for quantitative measurements of the historical storm damage records. The cumulative magnitude as a gross count of occurrences of the past storm damage could represent the likelihood of storm damage. The average magnitude as an averaged storm damage cost per event could represent the average intensity of storm damage costs. In addition to such two common measures, the damage risk magnitude can quantify the comprehensive degree of both frequency and severity of the past storm damage from 1998 to 2017.
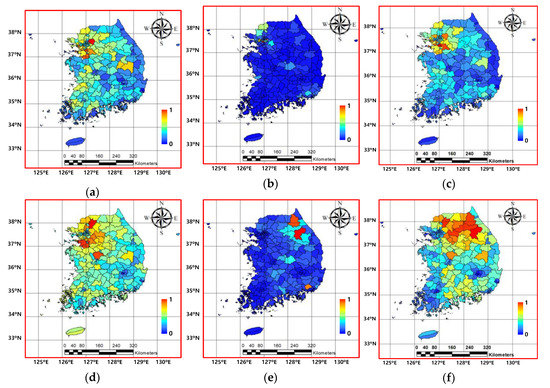
Figure 4.
Comparison of spatial distributions of the damage magnitude induced by rainstorms from 1998 to 2017 over the study site, assessed as (a) the cumulative count magnitude of human damage; (b) the event average magnitude of human damage; (c) the damage risk magnitude of human factor ; (d) the cumulative count magnitude of economic damage; (e) the event average magnitude of economic damage; and (f) the damage risk magnitude of physical factor . All magnitude values were normalized to a maximum of 1. The human damage is the sum of the total deaths and the total affected. The economic damage is the total losses on buildings, ships, public facilities, crops, etc., based on the consumer price index (CPI) and US$ rate in 2017.
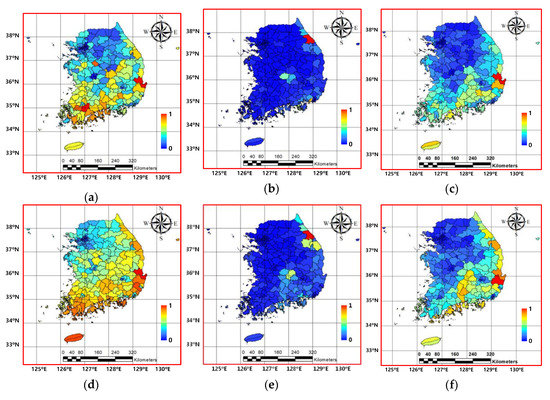
Figure 5.
Comparison of spatial distributions of the damage magnitude induced by typhoons from 1998 to 2017 over the study site, assessed as (a) the cumulative count magnitude of human damage; (b) the event average magnitude of human damage; (c) the damage risk magnitude of human factor ; (d) the cumulative count magnitude of economic damage; (e) the event average magnitude of economic damage; and (f) the damage risk magnitude of physical factor . All magnitude values were normalized to a maximum of 1. The human damage is the sum of the total deaths and the total affected. The economic damage is the total losses on buildings, ships, public facilities, crops, etc., based on the CPI and US$ rate in 2017.
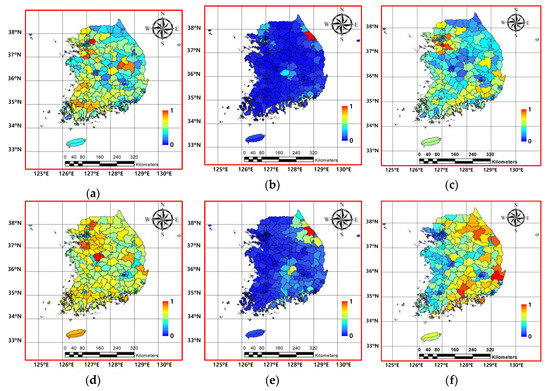
Figure 6.
Comparison of spatial distributions of the damage magnitude induced by both rainstorms and typhoons from 1998 to 2017 over the study site, assessed as (a) the cumulative count magnitude of human damage; (b) the event average magnitude of human damage; (c) the damage risk magnitude of human factor ; (d) the cumulative count magnitude of economic damage; (e) the event average magnitude of economic damage; and (f) the damage risk magnitude of physical factor . All magnitude values were normalized to a maximum of 1. The human damage is the sum of the total deaths and the total affected. The economic damage is the total losses on buildings, ships, public facilities, crops, etc., based on the CPI and US$ rate in 2017.
As shown in Figure 4c, the rainstorm-induced damage risk of human factor was higher in the northwestern part around the suburban areas of the Seoul Special City, which were more densely populated and frequently damaged than the average. The spatial distribution of was more influenced by the cumulative count magnitude in Figure 4a rather than the event average magnitude in Figure 4b. The highest level values of the rainstorm-induced damage risk of physical factor were in most of the northern districts (Figure 4f) due to the fact that the cumulative count magnitude was higher in northwestern districts (Figure 4d) and the event average magnitude was higher in northeastern districts (Figure 4e). The spatial distribution of was influenced by an increasing number of flooding from torrential rainfalls due to the recent abnormal weather conditions.
Figure 5c denotes the typhoon-induced damage risk of human factor that had higher values in the southeastern districts more influenced by the cumulative count magnitude in Figure 5a rather than the event average magnitude in Figure 5b. Figure 5f presents higher values of the typhoon-induced damage risk of physical factor in the southern and eastern districts influenced by both the cumulative count magnitude in Figure 5d and the event average magnitude in Figure 5e. In general, typhoons barreling toward the Korean peninsula affect mostly the southern and eastern parts due to regional climatic and topographic features. Especially coastal regions are more prone to impacts of typhoons than inland regions, since the warm ocean waters are the primary energy source of typhoons and high waves and storm surges occur during typhoons [31].
Figure 6c indicates that the damage risk of human factor induced by both rainstorms and typhoons generates the highest level values around the suburban areas of the Seoul Special City, densely populated and mostly affected by rainstorms, and the is also relatively high in some southern districts typically affected by typhoons. The spatial pattern of the highest level districts at the human damage risk is due to the fact that the human damage costs occur more frequently and severely in rainstorm events than typhoon events, as denoted in Table 2. The spatial distribution of was more influenced by the cumulative count magnitude in Figure 6a rather than the event average magnitude in Figure 6b, as similar to the property that affect the spatial patterns of human factors and . As shown in Figure 6f, the damage risk of physical factor induced by both rainstorms and typhoons generated the highest level values in some southern and eastern districts affected largely by typhoons, and in some inland districts affected by both rainstorms and typhoons. Such a spatial pattern of the economic damage risk was due to the fact that the economic damage costs occur much greater in typhoon events than rainstorm events, as denoted in Table 2. The spatial distribution of was influenced by both the cumulative count magnitude in Figure 6d and the event average magnitude in Figure 6e, as similar to the property that affect the spatial patterns of physical factors and .
Figure 7 presents the spatial distributions over the study site of the three risk indicators , , and induced by rainstorms, typhoons, and both rainstorms and typhoons, respectively, which were calculated by Equation (6) for averaging the human and economic damage risks based on the past damage costs from 1998 to 2017. The average of the in Figure 4c and the in Figure 4f produced the rainstorm-induced risk indicator that has higher values mostly in the northern districts and comparable high values in some southern inland districts (Figure 7a). As denoted in Figure 7b, the typhoon-induced risk indicator averaged by the in Figure 5c and the in Figure 5f produced the top-level values in the two coastal districts of the southeastern part and comparable high values, mostly in the southern and eastern districts near the coastline located on the typical routes of severe typhoons. Figure 7c presents the risk indicator induced by both the two main causes of rainstorms and typhoons, as an average of the in Figure 6c and the in Figure 6f. The produced the highest-level values in some southern and eastern districts influenced largely by typhoons and comparable high outcomes in some northern districts including suburban areas of the Seoul Special City influenced largely by rainstorms. Such a spatial pattern of the supports the fact that the typhoon-induced damage risk could be more serious than the rainstorm-induced damage risk in this study site.
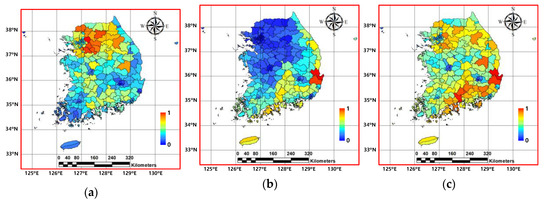
Figure 7.
Comparison of spatial distributions of the risk indicators for the damage vulnerability index over the study site: (a) induced by rainstorms; (b) induced by typhoons; and (c) induced by both rainstorms and typhoons.
3.2. Damage Vulnerability Assessments
Figure 8 indicates the damage vulnerability assessment results classified into the five grades from Level 1 for the highest and to Level 5 for the lowest at equal intervals of the ranking orders based on the outcomes by Equation (7). As denoted Figure 8a, the damage vulnerability to rainstorms was graded at Level 1 around the Seoul Special City and its vicinities located in the northwestern part and Busan metropolis located in the southeastern part. Most of the northern administrative districts were assessed as comparably vulnerable regions to rainstorm-induced damage at Level 2. Figure 8b presents a higher level (Level 1 or 2) vulnerability to typhoon-induced damage in some administrative districts of the Seoul metropolitan areas that have the highest-level potential components and most administrative districts along southern and eastern coastlines on the typical tracks of typhoons in the study site. Figure 8c indicates the higher level grades (Level 1 or 2) of the damage vulnerability to both rainstorms and typhoons in Seoul and Busan metropolises mainly due to higher potential components, and the Seoul’s vicinities and some southern districts mainly due to higher risk components. As shown in Figure 8, the vulnerable districts were assessed differently according to the causes of the disaster damage, but some administrative districts in Seoul (northwestern part) and Busan (southeastern part) metropolises were found to have the top-level vulnerability for all the three cases.
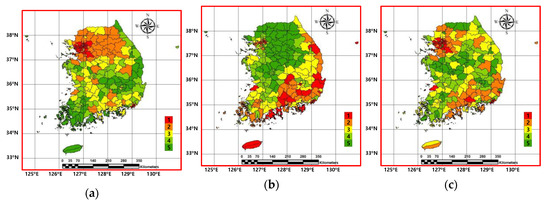
Figure 8.
Spatial distributions of the damage vulnerability grades for the study site based on (a) by rainstorms; (b) by typhoons; and (c) by both rainstorms and typhoons.
4. Discussion
As there have been many assessments of vulnerability to hydro-meteorological disasters based on the IPCC’s three components, such as exposure, sensitivity, and adaptive capacity [1], the potential flood damage index [29] was developed by the product of the potential indicator (sensitivity) and the risk indicator (exposure minus adaptive capacity), similar to the livelihood vulnerability index [18] adopting the IPCC’s vulnerability concept. Based on the framework for the potential flood damage index [29], this study has developed the damage vulnerability index to assess vulnerability to rainstorms and typhoons that pose major and serious damage costs in the Korean Peninsula. As for the aggregation framework for combining the two major components into a composite indicator, a new aggregation function incorporated with a quadratic mean formula was proposed to produce higher vulnerability outcomes when the two components (potential and risk indicators) are both higher, and have some degree of compensability even when either of the two components is zero, as a complement to the existing multiplicative aggregation function. The proxy variables were selected in terms of the damage to people and property for the two major components. The potential indicator comprises the population density for the human factor and the major facilities area ratio for the physical factor. The risk indicator is measured by an expected value for integrating both frequency and severity of the human and economic damage costs, which can provide a better interpretation of the risk indicator outcomes and reduce the nature of uncertainty in the proxy variables being used. The proxy variables for the adaptive capacity component tend to have more uncertainty than other proxy variables [30]. Moreover, the human and economic damage risks are primarily caused by localized heavy rains and storms exceeding designed capacity inducing insufficient capacity of river conveyance and inland drainage systems, in general [4]. Hence, instead of the use of the difference between exposure and adaptive capacity components for the risk indicator, a comprehensive analysis result on both frequency and severity of the historical damage cost records can be interpreted explicitly as a measure of actual experiences and behaviors arising from the lack of adaptive capacity to exposed hazard risks. For more feasible and realistic evaluation in this study, the risk indicator was constructed based on the human and economic damage cost data officially collected during the last two decades from 1997 to 2017. The risk analysis results indicate that the human and economic damage risk were higher mostly in small and medium cities exposed to storm hazards, which tend to have a relatively higher population and infrastructure densities than rural districts but have relatively less ability to prevent or recover from storm damage than metropolises, in general.
The proposed methodology for the damage vulnerability index was implemented for the spatial assessment of vulnerability to rainstorms, typhoons, and both, respectively, over the nationwide 231 administrative districts in the Republic of Korea. There were spatially different vulnerable patterns in the three damage vulnerability index outcomes for storm disasters triggered by different causes. The damage vulnerability to rainstorms was higher in most northern districts, including the Seoul metropolitan areas (northwestern part) and some southeastern districts in Busan metropolis (southeastern part). The damage vulnerability to typhoons was higher in some districts of the Seoul Special City and most districts along southern and eastern coastlines, including Busan metropolis. The damage vulnerability to both rainstorms and typhoons was higher in the Seoul metropolitan areas and some southern districts, including Busan metropolis. Some districts in Seoul and Busan metropolises were assessed to be most vulnerable to all the three cases of storm-induced disasters. The proposed damage vulnerability index needs to be continuously updated by including the most recent storm damage records and successively evaluated with damage data series over several time periods to provide feasible and effective information on sustainable mitigation plans for changes in storm damage patterns. Furthermore, to assess the future vulnerability to storms by the proposed assessment methodology based on the analysis of the past damage cost records, the human and economic damage costs need to be predicted by the regression analysis of the meteorological data in the event of a disaster for the use of future damage cost estimations according to climate change scenarios. For practical use of the proposed damage vulnerability to storms, each administrative district needs to establish region-specific disaster countermeasures relevant to major causes of hazards, and also can quantitatively evaluate their effects on disaster risk reduction and mitigation consequences.
5. Conclusions
Storm-induced disasters that are becoming more frequent and threatening worldwide cause serious human and economic damage costs in the Korean Peninsula, where rainstorms and typhoons are the predominant natural hazards. The vulnerability assessments for natural disasters were conducted mainly based on the IPCC’s conceptual framework for vulnerability to climate change [1]. Most vulnerability assessment studies tend to include a somewhat excessive number of the uncertainty-incorporated variables to account for a variety of potential factors associated with vulnerability. This study has, therefore, presented a new damage vulnerability index incorporating a minimized assessment indicator directly related to vulnerability, based on the basic framework of the potential flood damage index [29] similar to the livelihood vulnerability index [18] adopting the IPCC’s vulnerability concept [1]. To provide more realistic and feasible spatial assessment outcomes of vulnerability to storms, the damage vulnerability index comprises the two major assessment components, such as the potential and risk indicators for human and physical factors. The potential indicator was estimated by the population and major facility densities to represent the potential damage targets, and the risk indicator was calculated by integration of both frequency and severity of the historical human and economic damage costs to estimate the expected damage risk. Compared to most conventional vulnerability assessments measured mainly by various assessment components for the potential or possibility of vulnerability, the proposed assessment method can integrate both potential and actual aspects of vulnerability since the damage vulnerability index can reflect both the nature of the historical damage costs as well as the potential damage possibility. The spatial assessments of the damage vulnerability were conducted with respect to the disaster damage patterns induced by rainstorms, typhoons, and both, respectively, over the nationwide 231 administrative districts in the Republic of Korea. The assessment outcomes in this study can contribute to decision making at the national level on the desirable rank ordering in the process of identifying the priority districts for substantial investments and improvements against storm-induced disasters. It is, therefore, expected that the proposed damage vulnerability index can provide basic and useful information on sustainable damage mitigation plans for the nationwide administrative districts against flood-related disasters induced by different types of storms, major natural hazards in the Korean Peninsula. The proposed assessment method can be implemented for any district, country, or continent that has reliable historical records of natural damage costs.
Funding
This work was supported by Korea Environment Industry & Technology Institute(KEITI) though Water Management Research Program, funded by Korea Ministry of Environment(MOE)(79608).
Conflicts of Interest
The authors declare no conflict of interest.
References
- Intergovernmental Panel on Climate Change (IPCC). Climate Change 2001: Impacts, Adaptation, and Vulnerability. Contribution of Working Group II to the Third Assessment Report of the Intergovernmental Panel on Climate Change; McCarthy, J.J., Canziani, O.F., Leary, N.A., Dokken, D.J., White, K.S., Eds.; Cambridge University Press: Cambridge, UK; New York, NY, USA, 2001. [Google Scholar]
- Intergovernmental Panel on Climate Change (IPCC). Climate Change 2007: Synthesis Report. Contribution of Working Groups I, II and III to the Fourth Assessment Report of the Intergovernmental Panel on Climate Change; Core Writing Team, Pachauri, R.K., Reisinger, A., Eds.; IPCC: Geneva, Switzerland, 2007. [Google Scholar]
- Intergovernmental Panel on Climate Change (IPCC). Climate Change 2014: Synthesis Report. Contribution of Working Groups I, II and III to the Fifth Assessment Report of the Intergovernmental Panel on Climate Change; Core Writing Team, Pachauri, R.K., Meyer, L.A., Eds.; IPCC: Geneva, Switzerland, 2014. [Google Scholar]
- Intergovernmental Panel on Climate Change (IPCC). Managing the Risks of Extreme Events and Disasters to Advance Climate Change Adaptation. A Special Report of Working Groups I and II of the Intergovernmental Panel on Climate Change; Field, C.B., Barros, V., Stocker, T.F., Qin, D., Dokken, D.J., Ebi, K.L., Mastrandrea, M.D., Mach, K.J., Plattner, G.-K., Allen, S.K., et al., Eds.; Cambridge University Press: Cambridge, UK; New York, NY, USA, 2012. [Google Scholar]
- Centre for Research on the Epidemiology of Disasters (CRED) & United Nations International Strategy for Disaster Reduction (UNISDR). Economic Losses, Poverty & Disasters, 1998–2017. 2018. Available online: https://www.unisdr.org/we/inform/publications/61119 (accessed on 15 September 2019).
- National Disaster Information Center. Available online: http://www.safekorea.go.kr (accessed on 15 September 2019).
- Holmes, D.; Croot, D. Top Spec Geography: Flood Risk and Management; Geographical Association: Sheffield, UK, 2010; ISBN 978-1-84377-302-3. [Google Scholar]
- Adger, W.N. Social Aspects of Adaptive Capacity; Smith, J.B., Klein, R.J.T., Huq, S., Eds.; Climate Change, Adaptive Capacity and Development. Imperial College Press: London, UK, 2003. [Google Scholar]
- Balica, S.F.; Wright, N.G.; Van Der Meulen, F. A Flood vulnerability index for coastal cities and its use in assessing climate change impacts. Nat. Hazards 2012, 64, 73–105. [Google Scholar] [CrossRef]
- Yang, L.; Scheffran, J.; Qin, H.; You, Q. Climate-related flood risks and urban responses in the Pearl River Delta, China. Reg. Environ. Change 2015, 15, 379–391. [Google Scholar] [CrossRef]
- Ryu, J.; Lee, D.K.; Park, C.; Ahn, Y.; Lee, S.; Choi, K.; Jung, T. Assessment of the vulnerability of industrial parks to flood in South Korea. Nat. Hazards 2016, 82, 811–825. [Google Scholar] [CrossRef]
- De Andrade, M.M.N.; Szlafsztein, C.F. Vulnerability assessment including tangible and intangible components in the index composition: An Amazon case study of flooding and flash flooding. Sci. Total Environ. 2018, 630, 903–912. [Google Scholar] [CrossRef] [PubMed]
- Metzger, M.J.; Leemans, R.; SchroTer, D. A multidisciplinary multi-scale framework for assessing vulnerabilities to global change. Int. J. Appl. Earth Obs. Geoinf. 2005, 7, 267. [Google Scholar] [CrossRef]
- Jung, Y.; Kim, D.; Choi, M.; Kim, S.; Park, M. Vulnerability resilience in the major watersheds of the Korean Peninsula. Terr. Atmos. Ocean. Sci. 2014, 25, 857–868. [Google Scholar] [CrossRef]
- Chang, L.-F.; Huang, S.-L. Assessing urban flooding vulnerability with an emergy approach. Landsc. Urban. Plan. 2015, 143, 11–24. [Google Scholar] [CrossRef]
- Chang, Y.T.; Lee, Y.; Huang, S. Integrated spatial ecosystem model for simulating land use change and assessing vulnerability to flooding. Ecol. Model. 2017, 362, 87–100. [Google Scholar] [CrossRef]
- Yankson, P.W.K.; Owusu, A.B.; Owusu, G.; Boakye-Danquah, J.; Tetteh, J.D. Assessment of coastal communities’ vulnerability to floods using indicator-based approach: a case study of Greater Accra Metropolitan Area, Ghana. Nat Hazards 2017, 89, 661–689. [Google Scholar] [CrossRef]
- Hahn, M.B.; Riederer, A.M.; Foster, S.O. The livelihood vulnerability index: A pragmatic approach to assessing risks from climate variability and change—A case study in Mozambique. Glob. Environ. Chang. 2009, 19, 74–88. [Google Scholar] [CrossRef]
- Shah, K.U.; Dulal, H.B.; Johnson, C.; Baptiste, A. Understanding livelihood vulnerability to climate change: Applying the livelihood vulnerability index in Trinidad and Tobago. Geoforum 2013, 47, 125–137. [Google Scholar] [CrossRef]
- Amoatey, P.; Sulaiman, H. Assessing the climate change impacts of cocoa growing districts in Ghana: The livelihood vulnerability index analysis. Environ. Dev. Sustain. 2018, 1–22. [Google Scholar] [CrossRef]
- Williams, P.A.; Crespo, O.; Abu, M. Assessing vulnerability of horticultural smallholders’ to climate variability in Ghana: Applying the livelihood vulnerability approach. Environ. Dev. Sustain. 2018, 1–22. [Google Scholar] [CrossRef]
- Sarker, M.N.I.; Wu, M.; Alam, G.M.M.; Shouse, R.C. Livelihood vulnerability of riverine-island dwellers in the face of natural disasters in Bangladesh. Sustainability 2019, 11, 1623. [Google Scholar] [CrossRef]
- Birkmann, J.; Cardona, O.D.; Carreño, M.L.; Barbat, A.H.; Pelling, M.; Schneiderbauer, S.; Kienberger, S.; Keiler, M.; Alexander, D.; Zeil, P.; et al. Framing vulnerability, risk and societal responses: The move framework. Nat. Hazards 2013, 67, 193–211. [Google Scholar] [CrossRef]
- Depietri, Y.; Welle, T.; Renaud, F.G. Social vulnerability assessment of the Cologne urban area (Germany) to heat waves: Links to ecosystem services. Int. J. Disaster Risk Reduct. 2013, 6, 98–117. [Google Scholar] [CrossRef]
- Welle, T.; Depietri, Y.; Angignard, M.; Birkmann, J.; Renaud, F.; Greiving, S. Vulnerability assessment to heat waves, floods, and earthquakes using the MOVE framework, Test Case Cologne, Germany. Assess. Vulnerabil. Nat. Hazards 2014, 91–124. [Google Scholar] [CrossRef]
- Hagenlocher, M.; Renaud, F.G.; Haas, S.; Sebesvari, Z. Vulnerability and risk of deltaic social-ecological systems exposed to multiple hazards. Sci. Total Environ. 2018, 631, 71–80. [Google Scholar] [CrossRef]
- Kablan, M.K.A.; Dongo, K.; Coulibaly, M. Assessment of social vulnerability to flood in urban Côte d’Ivoire using the MOVE framework. Water 2017, 9, 292. [Google Scholar] [CrossRef]
- Morimoto, T. Spatial analysis of social vulnerability to floods based on the MOVE framework and information entropy method: Case study of Katsushika Ward, Tokyo. Sustainability 2019, 11, 529. [Google Scholar]
- Korea Institute of Construction Technology (KICT). Water Vision 2020; Ministry of Land, Infrastructure and Transportation of Korea: Seoul, Korea, 2001. (In Korean)
- Adger, W.N.; Vincent, K. Uncertainty in adaptive capacity. C. R. Geosci. 2005, 337, 399–410. [Google Scholar] [CrossRef]
- Korea Meteorological Administration. Available online: http://www.kma.go.kr (accessed on 15 September 2019).
- Korean Statistical Information Service. Available online: http://kosis.kr/index/index.do (accessed on 15 September 2019).
- National Environment Information Network System. Available online: http://www.neins.go.kr (accessed on 1 May 2019).
- Van Dantzig, D. Economic decision problems for flood prevention. Econometrica 1956, 24, 276–287. [Google Scholar] [CrossRef]
- Zhai, G.; Fukuzono, T.; Ikeda, S. Modeling flood damage: Case of Tokai Flood 2000. J. Am. Water Resour. Assoc. 2005, 41, 77–92. [Google Scholar] [CrossRef]
- Pearson, K. On the criterion that a given system of deviations from the probable in the case of a correlated system of variables is such that it can be reasonably supposed to have arisen from random sampling. Philos. Mag. Ser. Five 1900, 50, 157–175. [Google Scholar] [CrossRef]
- Kolmogorov, A. Confidence limits for an unknown distribution function. Ann. Math. Stat. 1941, 12, 461–463. [Google Scholar] [CrossRef]
- Anderson, T.W. On the distribution of the two-sample Cramer-von Mises criterion. Ann. Math. Stat. 1962, 33, 1148–1159. [Google Scholar] [CrossRef]
- Organisation for Economic Co-Operation and Development (OECD). Handbook on Constructing Composite Indicators. Methodology and User Guide; OECD Publisher: Paris, France, 2008. [Google Scholar]
- Statistics Geographic Information Service. Available online: https://sgis.kostat.go.kr (accessed on 15 September 2019).


© 2019 by the author. Licensee MDPI, Basel, Switzerland. This article is an open access article distributed under the terms and conditions of the Creative Commons Attribution (CC BY) license (http://creativecommons.org/licenses/by/4.0/).