Article

A Typological Characterization of Organic Livestock Farms in the Natural Park Sierra de Grazalema Based on Technical and Economic Variables

Departamento de Producción Animal, Facultad de Veterinaria, Universidad de Córdoba, 14071 Córdoba, Spain
*
Author to whom correspondence should be addressed.
Sustainability 2019, 11(21), 6002; https://doi.org/10.3390/su11216002
Submission received: 1 October 2019 / Revised: 22 October 2019 / Accepted: 25 October 2019 / Published: 28 October 2019
(This article belongs to the Special Issue Sustainable Livestock Production)

Abstract

:
This paper describes the typological characterization of the Natural Park Sierra de Grazalema (NPSG) livestock farms using its communal pastures (N = 23, 100% of population) in order to study their sustainability from 160 technical, economic and social variables (from direct on-farm data collection). A principal components analysis (PCA) produced four principal components related to size, livestock species, main productions and intensification level, explaining 73.6% of the variance. The subsequent cluster analysis classified the farms into four groups: C1 (medium size farms without sheep), C2 (large size and very extensive farms), C3 (farms with multipurpose sheep) and C4 (farms with dairy goat and without cattle). Forty-eight-point-seven percent of the surface was registered as organic but none of the farms’ commercialized products were organic. C2 and C3 (both having three ruminant species) are those farms that have more economic differences, the former generating the lowest profit, and the latter generating the highest; however, there is a risk to grasslands conservation from the current tendency that leads dairy farms to rapid intensification. Nevertheless, the very extensive farms are the most interesting for NPSG conservation and the administration should help to maintain the profitability of this sustainable traditional activity, which is necessary to conserve communal pastures.

Graphical Abstract

1. Introduction

Numerous European landscapes and habitats—both natural and cultural—developed and persisted through the grazing of domestic ruminants. Many of these landscapes have a high level of biodiversity and are therefore very important for nature conservation [1]. However, the more extensively used sites are at risk of abandonment. The establishment and preservation of “pasture landscapes” with a mixed character of open grassland, shrubs and forests (agroforestry systems) have been recognized as a suitable strategy of management in several European countries, offering solutions for both nature conservation and traditional large-scale grazing systems [1]. In this context, the southern region of Spain (Andalusia) is the region with the largest protected area (1,784,992 ha), consisting of 27.3% of the protected area in the country [2]. Usually, its protected natural areas (PNA) are located in mountainous areas, which are agriculturally unproductive and traditionally exploited by extensive livestock and various complementary activities that have allowed for the preservation of many habitats [3]. Given the variety of ecosystems and the extension of the PNA in Andalusia, Rodríguez-Estévez et al. [4] and Díaz-Gaona et al. [3] suggest that these PNA are a sustainable model of management for grasslands and the use of natural resources for the rest of the Spanish territory. Of the 243 PNA in Andalusia, 24 consist of natural parks (NP), totaling 1,422,468 ha, 16.3% of the region and 50.4% of its protected area [5]. Hence, this region, with a 32.3% proportion of protected terrestrial land, has one of the highest percentages in Europe, only surpassed by Bulgaria and Slovenia, which are both close to 35% [6].
In the inland NP of Spain, the proportion of public surfaces (39.3%) is much lower than private ones (60.7%), although there are significant differences between regions. Specifically, in Andalusia, this percentage is even lower since public areas occupy only 35.5% of the total area of inland NP [7] and are mainly above 1400 m altitude. As most of these PNA conserve their environmental values by their farmers and inhabitants’ ancient rational use of resources and cultural heritage, it is necessary to maintain the sustainability of traditional extensive livestock farming. This is a general agreement for socio-ecological landscapes, with their future sustainability reliant on on-going agricultural management [8]. What is more, areas where farming practices are associated with high biodiversity value are often qualified as High Nature Value (HNV) farmland [9,10]. A large part of these HNV farmlands are also located in areas designated as ‘less-favoured’ from an economic perspective, with agricultural production restricted because of the characteristic factors of mountain areas (difficult climatic conditions, steep slopes and low soil productivity) [6]. As a consequence, these systems are being abandoned and may disappear due to a lack of profitability, or are being intensified; both negatively affecting PNA conservation [3]. Therefore, the biodiversity that depends on these low farm practices could be lost [6]. So, the balance of these agrosilvopastoral systems may be threatened by changes in the drivers of management [8].
In this context, current concern over environmental issues, climate change, food security, and the abandonment of rural areas (which results in a loss of traditional systems of production) causes the administration (environmental and agrarian authorities) to choose to link the future of PNA to sustainable livestock systems, as is the case with organic farming (OF) [3,11,12,13,14]. Hence, the continuity of traditional pastoral systems and agroforestry are key to the sustainability of these rural areas [3]. This, coupled with the recognition of the productive, environmental and social aspects of traditional grazing systems by agricultural policies and the marketing of quality products, is a boost for organic farming [3]. Besides, in Europe, the promotion of agroforestry has been shown as a solution for systems of high natural and cultural value [15], and farmers perceive their prominence in agroforestry.
Organic farming is a production system that, as a rule, respects the environment and has been developed in the EU since 1991 [16]. It has the support of the government and allows farmers to market their products with a certified label of quality. OF is an active sector, but improvements must be made for future consolidation of the sector.
Taking into account that traditional livestock production systems of the PNA are easily adapted to fulfill the requirements of OF regulation [12,17], OF is postulated as the most appropriate production system for the use and management of forage resources of the PNA, while these are conserved [3].
Moreover, pasture-based farming systems have a high diversity of characteristics and consequently a higher complexity and heterogeneity in relation to off-land farming systems [18]. This makes the typification of these kinds of farming systems very necessary and interesting, and this analysis can contribute to knowing these systems and increasing the global improvement and promotion of possibilities in these areas and their linked farms [18].
The characterization of a given production sector is based on the establishment of a typology of the farms that belong to that sector [19], and these typologies contribute to reducing heterogeneity by grouping farms according to similar characteristics. The analysis of structural, economic and social variables is useful to distinguish groups [20] and to discriminate while establishing typologies [21] as a tool to identify the structural features that define every livestock system. On top of that, from the typologies obtained it is possible to recommend improvement measures and specific policies for each of the groups identified [22].
Data analysis methods provide different tools or combination of tools to build typologies; for a review of farming system typology methodologies to study pasture-based farming systems see Madry et al. [18]. The most common statistical techniques to establish and characterize groups in livestock production systems are principal components analysis (PCA) and hierarchical clustering analysis with factorial analysis (i.e., [19,22,23,24]). Validation of typological results is often used to assess the differences between groups by means of ANOVA (i.e., [23,25,26]).
This study was conducted on the communal pastures of the Natural Park Sierra de Grazalema (NPSG) in Cádiz County (Southern Spain), which contains the Biosphere Reserve Sierra de Grazalema (the first one declared in Spain in 1977). The Use and Management Regulation of the NPSG indicates that OF will have preference in the use of public surfaces (grasslands and forests) [27]. What is more, grazing livestock provides services for wildfire prevention [28] and there is traditional shepherding knowledge of livestock management in the area that facilitates easy conversion to OF [29]. However, this NP is characterized by hilly terrains and adverse climatic conditions for agricultural production (seasonality of rainfall, extreme temperatures) and a high inter-year variability in grass production. Consequently, the profitability of its livestock systems should be studied and increased for their future consolidation; especially when considering the current climate change scenario.
There is a lack of knowledge about the current productive structures of the extensive and organic livestock farms in the studied area. However, due to the evolution of traditional and very extensive farms over the last decades, with the disappearance of many farms, abandonment of communal pastures, and gradual emergence of OF systems [29], it is necessary to characterize these farms in order to establish adequate policies for their support.
This study has a double objective: firstly to describe the typology of the farms that take advantage of the communal pastures of the NPSG in relation to their livestock management, and economic and social variables; and secondly to propose corresponding measures of improvement or support for these farms, especially in relation to organic farming livestock production.

2. Materials and Methods

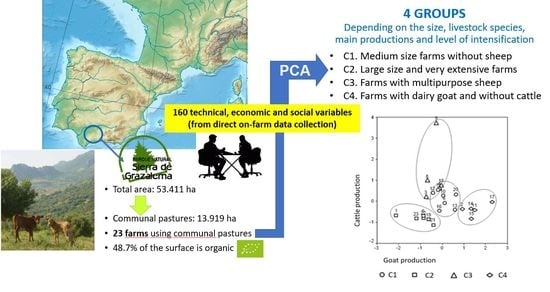
2.1. Study Area and Data Collection

This study was conducted in the Natural Park Sierra de Grazalema (NPSG) (Cadiz, Southern Spain) on all the 23 farms that take advantage of its communal pastures, with an area of 13,919 ha (26.1% of the NP) of which 69.9% are communal pastures. Seventy-four percent of these farms are registered as organic farms (OF) and produce in accordance with the Council of the European Union [12] regulations.
The NPSG belongs to the “Subbético” geological system and its composition is predominantly limestone. It shows areas of high slopes with an average altitude of about 900 m, and a great diversity of habitats and vegetation, predominantly dehesa pastures and Mediterranean forest.
The climate in the region is Mediterranean, humid with mild temperature and seasonal rainfall, which ranges from 700 to 2300 mm per year. The annual temperature variation is moderate (about 20 °C); in winter, the average minimum temperatures are recorded between 4 and 11 °C and the average maximum summer temperatures reaches values above 25 °C [30,31].
The information was obtained through the collection of primary data from direct interviews with the farmers according to the methodology proposed by various authors [20,22,23,32,33]. The information gathered is highly reliable since it was collected by an experienced team. The interview questionnaire included 303 questions, relative to the following three aspects: sociology (27), exploitation system (224) and economy (52). Some of the questions to the farmers were about information that cannot be directly measured (i.e., data of purchase of a piece of machinery or of building of facilities).

2.2. Statistical Analysis

The development of the typology was made from the methodology recently used by other authors (i.e., [20,22]), which consists of three stages: review and selection of variables, principal component analysis and cluster analysis.
In the first stage, 52 variables were selected, those with a coefficient of variation higher than 50%. Then the correlation matrix was analyzed to eliminate uncorrelated variables and the one with the lowest coefficient of variation of each pair was analyzed with linear dependence [34]. Through this selection process the following 19 variables were obtained: farm surface area (ha), land in ownership (%), work unit (WU) per area (WU/100 ha), WU per livestock unit (LU) (WU/100 LU) (1 cow = 1 LU; 1 ewe = 0.15 LU; 1 goat = 0.15 LU), stocking rate (SR) (LU/ha), cattle LU (%), sheep LU (%), goat LU (%), supplementary feed cost (€/ha and year), annual expenditure per tenancies and sharecropping (€/ha and year), lamb sales (€/ha and year), calf sales (€/ha and year), kid sales (€/ha and year), sheep milk sales (€/ha and year), goat milk sales (€/ha and year), subsidies for organic farming (€/ha and year), operating profit rate or rate of return (%), profit (net entrepreneurial income) (€/ha and year) and relation sales/total income (%).
In the second stage, PCA was used in order to reduce the number of variables and summarize the most variability [34]. The variables were standardized to avoid influence by the use of different scales [35]. Once the components were selected, the orthogonal quartimax rotation was applied to relate the selected variables more easily to the extracted factors. The Bartlett sphericity test and the Kaiser–Meyer–Olkin index were applied to verify sample adequacy (KMO > 0.6) [36].
In the third stage, the farms were classified into groups using sequential cluster analysis. According to Martínez-González et al. [37] the hierarchical cluster was used as a clustering method, because it is the best suited to samples of less than 250 individuals. The final solution was found by the method of Ward and the Euclidean distance, properly classifying all farms. This procedure maximizes the homogeneity within groups and heterogeneity between groups [34].
For the development of statistical analysis SPSS® 11.5 was used.

3. Results

3.1. Characteristics of the Farms in the Communal Grasslands of the NPSG

The farms with grasslands within the communal pastures of the NPSG cover an area of 13,919 ha (26.1% of the NPSG), of which 69.9% belong to the communal pastures of the PNA and only 19.6% are owned by the farmers; the rest (10.4%) is private grassland rented by these farmers. Moreover, 66% of the surface of these farms is registered as organic, although none of the surveyed farms has managed to commercialize products that are certified as organic on the organic market.
The variables used in the discriminant analysis to characterize these farming systems are shown in Table 1. The average SR is 0.21 LU/ha, although it has a high variability (0.07–0.56 LU/ha) due to different management systems (from extensive to semi-extensive), and it is higher than the average of 0.13 LU/ha (n = 67) found by Rodríguez-Estévez et al. [4] for all the OF in the NPSG. However, this average is lower than what other authors have found for extensive livestock in other areas with similar agro-ecosystems in the Spanish Southwest, mainly associated with dehesa (for a description of this agro-ecosystem see [38]). So, Escribano et al. [39] and Gaspar et al. [33] showed 0.37 and 0.38 LU/ha, respectively, for dehesa farms in Extremadura; Tierras [40], 0.38 LU/ha for Andalusian cattle farms; and Perea et al. [41], 0.36 LU/ha for Spanish organic cattle farms.
Animal production is very diversified in the NPSG, with several species and a high proportion of indigenous breeds: 94.9% of reproductive cows, 93.4% of reproductive goats and 64.6% of reproductive ewes; predominantly Retinta cows, Payoya goats and Grazalema Merino sheep, respectively. A good description of the traditional management of Payoya goats in this mountain area can be found in Gutierrez-Peña et al. [42]. These percentages are higher than those found by other authors for extensive farms in Southwestern Spain, from 59.1 to 83.5% [26,33,43,44]. Thirty-nine-point-one percent of farms have three species of ruminants, 56.4% have two and 4.3% have only one species.
Regarding the farm surface area, the farms studied have a mean of 605 ha grazed by an average flock of 108 LU. Therefore, the mean herd of cattle is 60 LU/farm (Table 2). This size is lower than that reported by Perea et al. [45] (98.8 LU) for organic farms in Andalusia; and is approximately half the size of the herds from other dehesa areas, for instance: 133.8 LU [46] and 124.9 LU [26].
The mean numbers of small ruminant flocks have 40 and 36 LU/farm for sheep and goats, respectively (Table 2). This sheep flock size is greater than indicated by Ruiz et al. [47] for mixed small ruminant flocks of Sierra de Cádiz and Serranía de Ronda (6.8 LU/farm). However, these researchers found a similar herd size for the goats (30.9 LU/farm). The herds of goats described by Gaspar [46] for dehesa farms in Extremadura are similar (41.0 LU), although this species was only found in 8.7% of those farms, while it was found in 86.9% of the NPSG farms.
The goat SR is negatively correlated with the farm surface area (r = −0.467, p < 0.05) (Table 3); because this species, which in this area is generally exploited for the production of milk in semi-extensive systems, is more related to small and family farms [25]. This correlation does not exist in other species. These results differ from those reported by other authors for dehesa farms. Escribano et al. [39] indicate negative correlations between the total area and SR levels, being more evident for cattle (r = −0.394, p < 0.01), which increases SR levels in smaller farms. Gaspar et al. [33] also found a negative correlation between the land surface and the total SR (r = −0.30, p < 0.05), indicating that the larger the surface, the less livestock there is. Escribano et al. [39] also highlighted the negative correlation between sheep and beef SR (r = −0.297, p < 0.05), which shows that, unlike the case in NPSG in dehesa farms of Extremadura, simultaneous farming of both ruminants is not frequent and an increase in SR of one species of these conditions means a decrease in the other.
The workforce (annual work unit = AWU) is employed in an average of 1.9 AWU/farm and year (1 AWU/42 LU); García et al. [48] found a similar result in farms located in the mountains of Jaen (1.8 AWU/farm and year), another province of the same region with mountain livestock systems. However, this is higher than that reported by Perea et al. [45] for Andalusian organic cattle farms and by Gaspar et al. [20] for extensive herds of goats in the region of the Villuercas-Ibores (Cáceres, Extremadura) (1.6 AWU/farm and year). Ninety-three-point-four percent of the workforce of the farms studied is familiar; similar to the 85% reported by [49] for Extremadura dairy goat farms, and higher than the 39% found by Gaspar [46] for dehesa farms of Extremadura. This result is mainly attributed to the family nature of traditional milk production in Andalusia [50] and in the area [25]; especially considering that 96% of the farms studied produce goat or sheep milk.
Fixed costs (salaries, rents paid for leasing and amortization) are much higher (64.6%) than variable costs (feed, veterinary services and other goods) (35.4%), which is a major constraint on the improvements design for these systems. Labor is the largest cost (52%).
Cost indicators highlight their high positive correlation (p < 0.01) with cattle SR (Table 4), except for rents paid for rented grasslands. In contrast, sheep SR has only a positive correlation with the rents paid for rented grasslands (r = 0.499, p < 0.05). This indicates that farms whose main production comes from sheep have the largest percentage of rented land for grazing, which contributes to reducing costs, such as those caused by supplementary feed. As far as goats are concerned, it highlights the high correlation between the SR and salaries (r = 0.782, p < 0.01), due to the greater needs of labor that milk production demands. It also highlights the correlation (r = 0.484, p < 0.05) between goat SR and consumption of other goods and services; with their greatest needs associated with milking.
The main income comes from sales of milk (40.1%). Subsidy payments account for 23.3% of incomes, and more than a third of these (9.1%) correspond to organic production. Incomes have a high positive correlation (p < 0.01) with total SR (Table 4); except those from subsidies to organic farming, which do not depend on production [51].
The average rate of profitability of these farms is high (15.7 ± 3.5%), mainly due to their low fixed capital. The average benefit is 92.8 ± 18.4 €/ha, significantly higher (184.3 €/ha) on farms with more SR (>0.22 LU/ha) and those receiving the subsidy derived from organic production policies (140.9 €/ha).

3.2. Principal Components Characterizing the Farms

The KMO test of sampling adequacy showed a value of 0.6 while the Bartlett’s sphericity test showed a satisfactory probability value (p < 0.001), indicating the suitability of the analysis. The first four factors that accounted for 73.6% of the original variability were selected (Table 5).
The first principal component (PC) explains 25.1% of the variability and is associated with indicative variables of the farm dimension, use of labor, percentage of goat LU and goat production (kids and milk) (Table 5). This PC can be called “goat production”. Higher scores on this factor correspond to small herds of dairy goats with high requirements of labor and scarce presence of cattle.
The second PC attributes for 21.3% of the variance and explains the SR and its relation to calf sales, annual consumption of supplementary feed and surface ownership (Table 5). This PC can be called “cattle production”. The farms that show the higher scores for this factor have calf production, high SR and, consequently, a high consumption of supplementary feed. Besides, these farms have facilities adapted to this livestock management built into the owner’s land (not rented).
The third PC accounts for 16.0% of the original variability and shows the direct relation between percentage of sheep LU, ovine productions (lambs and milk) and annual rents paid (in this case these are the lowest rents) (Table 5). This PC can be called “sheep production”. Higher scores on this factor indicate sheep presence and a high percentage of rented grassland.
The fourth PC expresses the relation between technical variables and the economic variability of farms; this explains 11.2% of the variance (Table 5). This PC can be called “low level of sales”. Thus, higher fourth factor scores correspond with low productive farms.

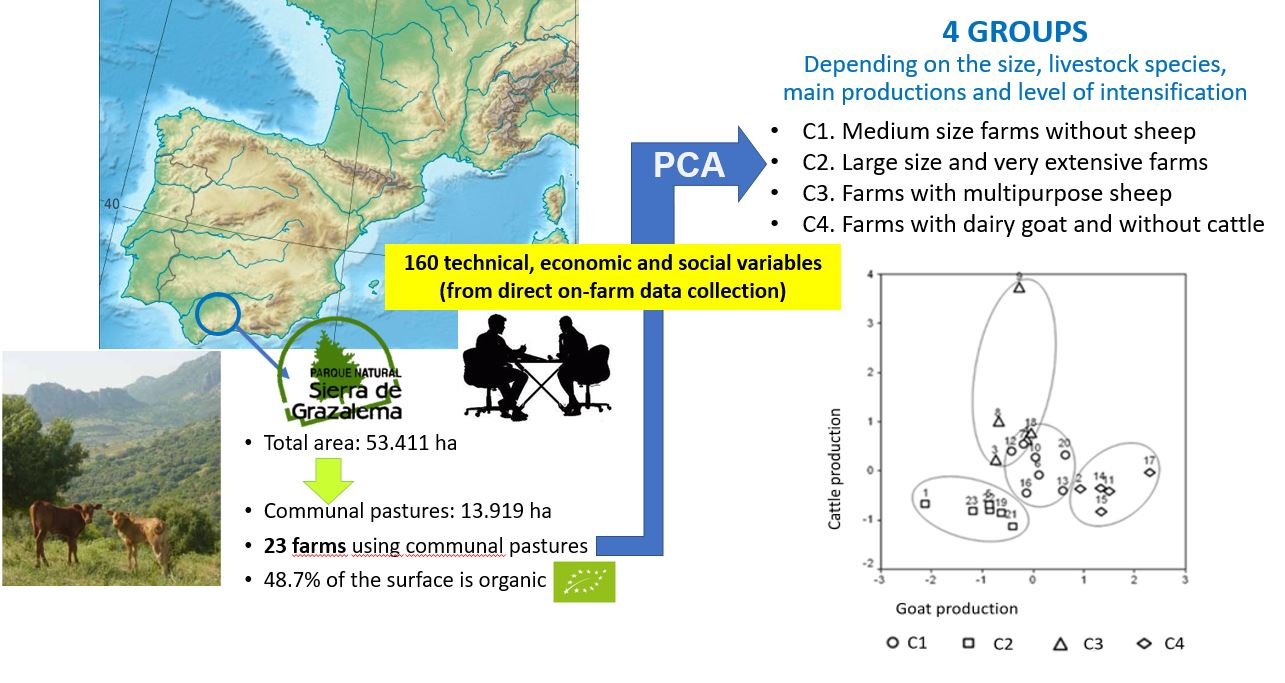
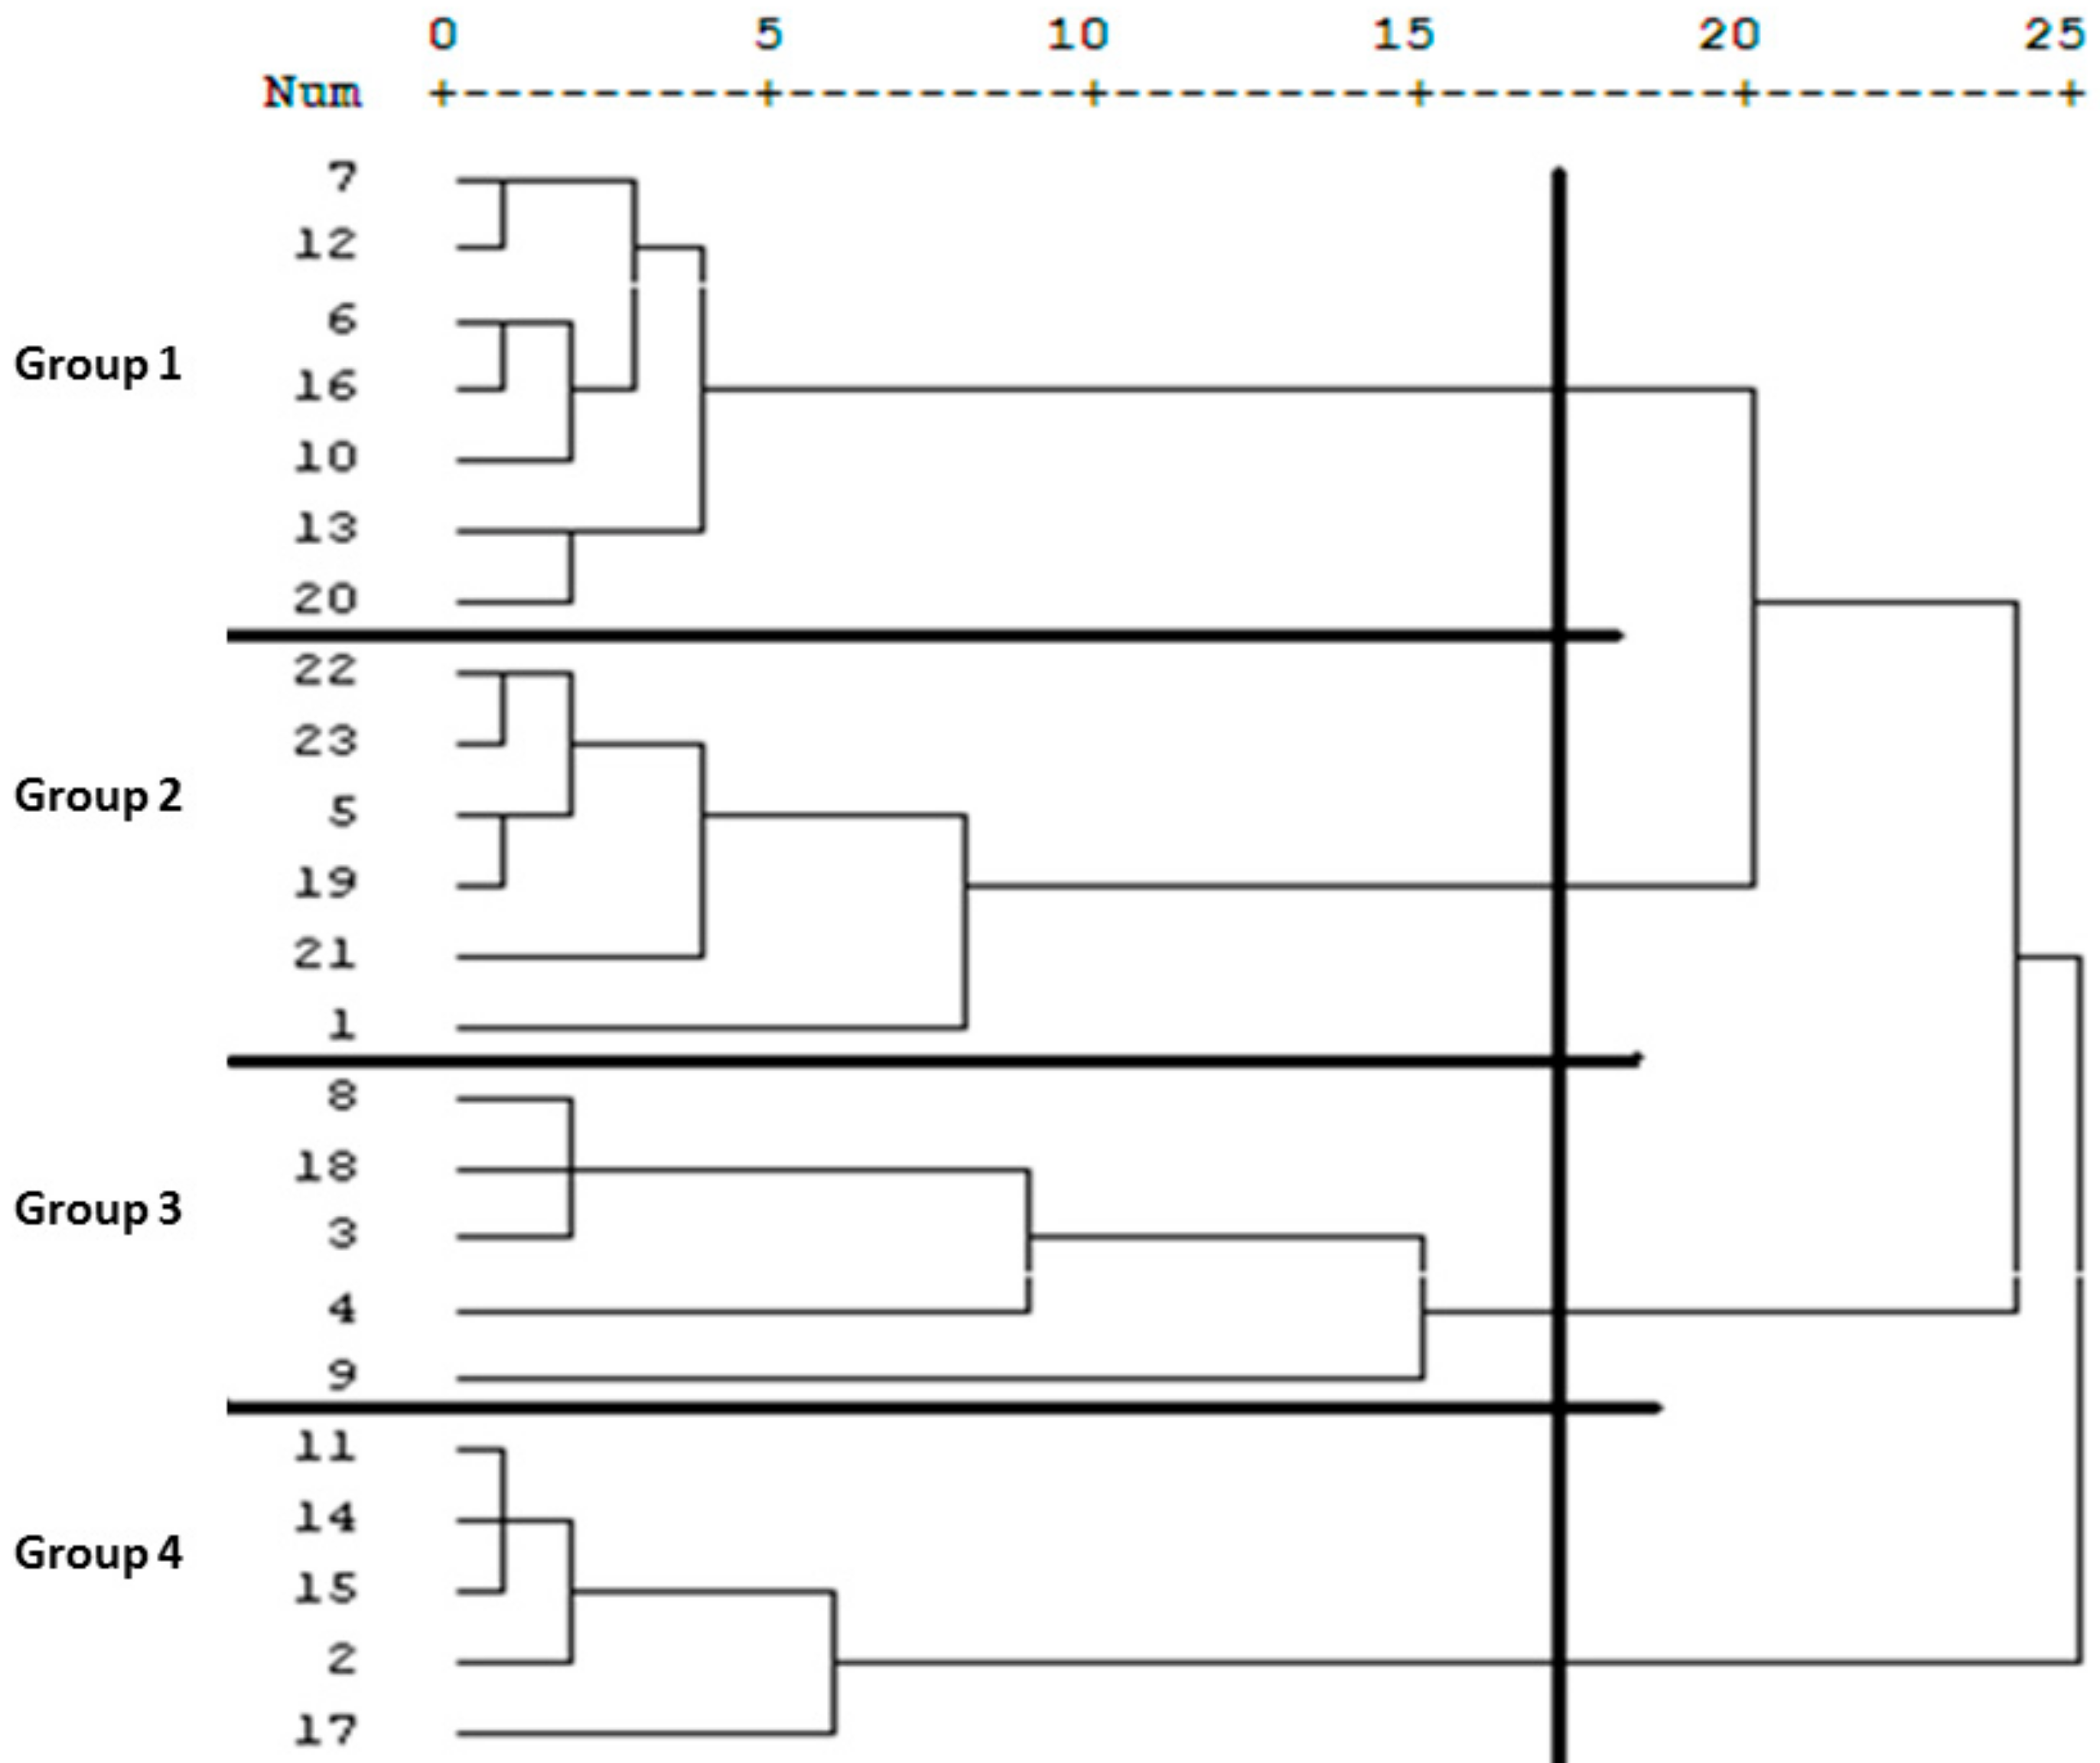
3.3. Establishment of the Typology

The cluster analysis presenting the most significant results is the solution of four clusters or groups (Figure 1). Group 1 (C1) are 7 farms, Group 2 (C2) are 6 farms and Groups 3 (C3) and 4 (C4) consist of 5 farms each.
Figure 2 shows the distribution of farms considering the first two components, where scores of farms distinguish the 4 groups formed. C1, C2 and C4 show greater homogeneity with regard to the first two PC, while C3 exhibited a greater dispersion of data.
Table 6 shows the differences between groups or systems and Table 7 shows a schematic comparison of the cluster groups. According to the differences and similarities found between the groups obtained it is possible to describe these as follows.

3.3.1. Group 1: Medium Size Farms Without Sheep

This group represents 30.4% of farms. These have intermediate values for: farm surface (300–700 ha); labor: per surface (0.24–0.50 family WU/100 ha) and per livestock (2–3 total WU/100 LU); SR (0.14–0.25 LU/ha); and gross margin (35–125 €/ha and year) (Table 6 and Table 7).
These farms have no sheep, with the exception of a farm with a low percentage of meat sheep (17.1% of its LU).

3.3.2. Group 2: Large Size and Very Extensive Farms

The second group represents 26.1% of farms. These are the largest farms (surface > 700 ha). However, these show the lowest values for: labor per surface (<0.24 family WU/100 ha); SR (<0.14 LU/ha); goat presence (15.9% of total LU); and have productions with scarce net margin per surface unit (<35 €/ha) (Table 6 and Table 7).

3.3.3. Group 3: Farms with Multipurpose Sheep

This group represents 21.7% of farms. These farms show low values for labor per livestock (<2 WU/100 LU) and for goat presence (<12.64% of total LU). However, these have a high SR (>0.25 LU/ha) and a high incomes from calf sales (>23 €/ha), lambs (>18 €/ha) and sheep milk (>14 €/ha); which provide a high annual net margin (>125 €/ha) (Table 6 and Table 7).

3.3.4. Group 4: Farms with Dairy Goat and Without Cattle

The fourth group represents 21.7% of farms. These are the smallest ones (<300 ha), and have the highest values of labor: per surface (>0.5 family WU/100 ha) and per livestock (>3 of total WU/100 LU), as a consequence of milking activities. They show the highest dairy goat presence (>52% of total LU) and the highest incomes from goat milk sales (>90 €/ha). Their SR is intermediate (from 0.14 to 0.25 LU/ha) and do not produce cattle or sheep milk (Table 6 and Table 7). The profits of these farms vary greatly, from very high values (up to 300 €/ha) to negative values.

3.4. Comparison of Farm Groups

The distribution of the farms studied among the four groups obtained is similar, ranging between 21 and 31% of the total (Table 7). The main differences are the dimension of the surface, the present livestock species, the main production and the level of intensification. Other authors, also studying extensive and semi-extensive livestock systems in Spain, found similar results. Thus, Gaspar et al. [33], for sheep in Extremadura, indicate those differences among the six groups found, but add one more: profitability. Castel et al. [25], for the Andalusian semi-extensive dairy goats, showed the same results for the first three differences between the five groups found, but also add differences for location and percent of rented grassland surface. Milán et al. [26], for Spanish dehesa pastures with cattle, show the first two differences between the three groups obtained and added one more: herd size. But these results do not agree with those found by Perea et al. [52] when a sample of 69 Spanish organic farms around the country were studied and no group in NPSG coincided with their typology.
In Spanish organic farms, other authors like López-i-Gelats and Bartolomé [53] and Toro-Mujica et al. [22] only agree with these results when the groups differ in the level of intensification.
Comparing the most significant characteristics of each of the groups found between the farms that use communal pastures of NPSG, it has been found that the highest average surface (1306 ha) corresponds to the “large size and very extensive farms” (C2); while the other groups have a much lower average surface (between 226 and 471 ha) (p < 0.001). These surfaces are slightly higher than those found by Milán et al. [26] for Spanish cattle pastures (257,357 and 1021 ha respectively for each of the three groups set), and those found by Gaspar et al. [33] in Extremadura (with average areas between 156 and 849 ha), and much higher than those indicated by Castel et al. [25] (with average surfaces between 32 and 362 ha).
As far as labor is concerned, C4 (“farms with dairy goat and without cattle”) stands out for the highest average (4.0 WU/100 LU) (p < 0.001); since, as has been said, producing milk is very demanding and requires a higher level of labor in quantity and qualification. These results are far superior to those of other Mediterranean extensive systems in which there is milking, with mean values for farm groups between 1.1 and 2.4 WU/100 LU [26,33].
Regarding SR, the highest one corresponds to C3 (“farms with multipurpose sheep”) with a mean value of 0.39 LU/ha (p < 0.001). This average is lower than the maximum group averages of 0.45, 0.62 and 0.63 LU/ha identified by Milán et al. [26], Castel et al. [25] and Gaspar et al. [33] respectively for extensive and semi-extensive farms in Southern Spain.
The four groups show significant differences in the presence of different species of livestock. Groups C2 and C3 have a similar distribution: nearly half of SR for cattle (49 and 48% respectively), followed by sheep and a few goats. C4, “farms with dairy goat and without cattle”, is the most unbalanced in this regard, showing very high values for goats (70%) and non-existent cattle. In turn, C1 “medium size farms without sheep” shows around 50% of SR for cattle and goats census. These data differ from those found in other extensive systems in the Spanish Southwest, where there are no goats (i.e., [33,46]).
From the economic point of view the most important factor in all groups is the production of goat’s milk, with very different levels in both net values (€/ha) and percentage values. Goat production is more important in groups C1 and C4. Sheep production is more important in groups C2 and C3, although these farms market five products (beef, sheep and goat meat, and sheep and goat milk). C3 is where the average income per hectare is higher, since its production system is the most intensive. The farms belonging to C4 are clearly unbalanced in favor of the sale of goat’s milk, with the highest average income from this source (147 €/ha), which is 75% of total revenues; resulting in the sale of kids being the second production in economic importance (32 €/ha). C1 shows intermediate incomes from goat milk sales (77 €/ha) and calves and kid sales (22 €/ha and 21 €/ha).
Overall, the total incomes from sales amount to (in order of highest to lowest): 203 €/ha in C3, 197 €/ha in C4, 122 €/ha in C1 and 33 €/ha in C2. These figures are lower than those of other more intensified organic farming, as those described for dairy sheep in Castilla-La Mancha (Central Spain) by Toro-Mujica et al. [22] with an average between 83 and 368 €/ha; and to those found by Gaspar et al. [33] in the six groups of sheep farms found in dehesa farms with averages between 222 and 689 €/ha, where there are only revenues from livestock sales (lambs, wool and culling ewes).
Regarding the average profit per ha, farms of C3, which support the highest SR, have the highest average values (185 €/ha); while farms of C2, which have the lowest SR have the lowest ones (22 €/ha) (p < 0.01).
With regard to the European Common Policy subsidies for organic production, it is noteworthy that although 73.94% of farms are registered as organic, for various reasons, only 52.3% receive this economic support (Table 8); hence, only 39.1% of NPSG farms receive these subsidies. The groups with the most organic farms are C2 (“large size and very extensive farms”) and C3 (“farms with multipurpose sheep”), with 100% and 80% of farms registered as organic, respectively. But whereas in C2 only 33% of the organic farms receive the subsidy, in C3 it is received by 75% (Table 8). Of the other two groups organic farms receiving subsidies are 50% of C1 (“medium size farms without sheep”) and 66.7% of C4 (“farms with dairy goat and without cattle”); so it is in C2 where there is the smallest percentage of organic farms receiving this support, and C3 is where this percentage is the highest (Table 8). This aspect leads to C3 being the farm with the greatest profits.

4. Discussion

The pastures used by the farms studied are mostly leased, being mainly public property (common grasslands), which is an exception in Spanish PNA, where most of the farms are private estates [3,4,7]. This fact determines the investments in improving structures. Faced with this situation, it should be taken into consideration that a high proportion of the NPSG farms (86.9%) have dairy goats (infrequent when compared to other similar agroecosystems) and that this production system requires some special equipment and facilities for milking, and country roads to be in good condition for daily milk transport. Besides, according to Martín Bellido et al. [43] this herd size would be large and unusual; these authors indicate that goat herds with more than 30 LU have low frequency in Andalusia and Extremadura (6.7 and 6.6%, respectively). By contrast, Gaspar [46] shows much larger herds of sheep for dehesa farms (150.2 LU vs. 40.0 LU in NPSG); however, those herds studied by Gaspar were not dairy.
As has been found, from an economic point of view, the most important production in all groups is goat’s milk, mainly in groups C1 and C4 (C4 standing out where milk is 75% of total revenue). Both groups have an intermediate SR (0.14–0.25 LU/ha) when compared to the farms studied. But the mean SR of the farms that use communal pastures of the NPSG (0.21 LU/ha) is higher than the average of 0.13 LU/ha shown by Rodríguez-Estévez et al. [4] for all the organic farms in the NPSG (n = 67). This could be evidence for the current tendency of dairy farms to rapid intensification [54]. In general, extensive dairy goat farms are more dependent on feed for a better milk yield, therefore they should either reduce their workforce costs or better sell their products [28], whether directly transformed, organically certified or both.
However, the mean SR of the farms that use communal pastures of the NPSG (0.21 LU/ha) is much lower than the SR of 0.36 LU/ha found by Mena et al. [55] for dairy goat farms in the same mountain area of the NPSG; and is much lower than the SR of 0.43 LU/ha found by Perea et al. [52] for a sample of 69 Spanish organic farms, comprising around half of the farms. So, as Carpio et al. [56] indicate, the standards for organic livestock farming detailed by the OF regulations of the European Community [12] allow intensive open air production, without grazing and feeding animals with organic compound feeds adding green or conserved fodder. Hence, organic milk production only has to pass the minimum standard of OF feeding, but does not imply grazing because the limit for SR is 1.4 LU/ha. However, communal pastures of the NPSG need well-adjusted SR grazing livestock herds for its conservation and with this aim OF are preferenced in the use of communal pastures of the NPSG, as is indicated in its Use and Management Regulation [27]. This is in agreement with the perception of farmers who believe that agroforestry is the most adequate land use for this NPA, as Lovrić et al. [57] show for farmers from many marginal rural Mediterranean areas.
In relation to average profit per ha, it is evident that, the fact that the most intensified farms, C3 (0.39 LU/ha), generate the most profit and the least intensified ones produce the least profit; thus profit can promote intensification by farmers as is the general tendency [3], thereby putting at risk NPSG environmental conservation. So, intensification in organic farming can lead to a lack of sustainability, both from an environmental point of view (overgrazing and imbalance) and economically. Thus, Toro-Mujica et al. [22] found that the profits of the organic dairy sheep farms of Castilla-La Mancha were lower (4 €/ha) due to their higher costs of feed (less grazing and more supplementary feeding) and their high investment in infrastructure and equipment. However, in recent years there has been a remarkable decrease in grazing in goat systems, leading to rapid intensification; and in the case of dairy herds there has been a high evolution towards “false grazing systems”, whereby the animals graze daily but most of their nutritional requirements are covered by forage and concentrates given in the stable [54]. This scenario would be a problem for the conservation of the NPSG communal pastures and its grazing systems, losing its environmental sustainability. Besides that, intensification would come with the loss of agroforestry benefits from integrating trees in livestock systems; which include, among others, animal welfare, disease control, diversification of feed resources, nutrient retention and increased biodiversity [15].
However it must be recognized that C3 is where the average income per hectare is the highest (185 €/ha) and, at the same time, is the most interesting from the rural development point of view with C4 (0.63 and 0.69 familiar WU/100 ha, respectively), because the production of milk in semi-extensive systems is more related to small and family farms [25].
This justifies the interest in authentic OF conversion for livestock grazing in communal pastures by the responsible authorities of NPSG. Accordingly, as Díaz-Gaona et al. [3] indicate, all authorities involved throughout all stages of the control, inspection and surveillance of OF livestock production, as a system based on the harmonious relationship between land, plants and livestock, should guarantee a balanced SR. What is more, this necessary equilibrium is the reason why the administration of NPSG gives priority to OF. On the other hand, there is a very clear need to market differentiated products from extensive farming so that they get added value to make more profit based on the social demand of environmentally-friendly and high quality products [42]. This loss of differentiation once on the market, or lack of increase in market price has been reported by other authors; i.e., Perea et al. [52] indicate that only 40.6% of the Spanish farms surveyed commercialize calves certified as organic on the market. Any campaign launched by the NPSG administration or the development of a local quality brand in support of these more sustainable farms would be a good help, along with some specific carbon footprint certification [42]. However, all those opportunities go through marketing; which is one of the pending subjects for all of these farmers. Escribano [58] recommends transversal support measures to train consumers’ level of cognizance regarding organic food and their readiness to pay premium prices, making it clear that this is the way to support farmers’ conservation of high nature value grasslands.
Group C2 farms, which are forcing less production, are those with the greatest ease of conversion to organic production; but without access to these subsidies and without differentiation in the market, their competitiveness is greatly reduced. There is general agreement between experts that the implementation of specific lines of subsidies encouraging the production of organic livestock in high ecological value ecosystems would be desirable [14]. Therefore, it is essential that, in the meanwhile, C2 farms and other groups can resolve incidents (most of which are bureaucratic) that are impeding the receiving of current subsidies.
This last fact about bureaucracy and the lack of differentiated marketing should be resolved by local authorities with the aim to support and conserve the traditional farming systems because the NPSG needs these in order to conserve its communal pastures without shrub invasion. The experts highlight that the lack, or stagnation, of sales of the final product as organically certified is a relevant aspect that hinders the implementation of organic livestock in high ecological value ecosystems [14]. The achievement of an extra price for organic products mainly implies the failure or success of the adaptation of these farms to these ecologically-valuable ecosystems. Escribano indicates that organic livestock farms need to adapt to a new global market context [58]. Besides, primary reasons for the difficulty of recruitment and farmer turnover included a lack of candidate farmers in the local landscape, and the marginal and fluctuating economics of grassland management. Behind all this lies the problem of a lack of generational relief, with the consequent disappearance of farmers and the abandonment of pastures. As McGinlay et al. [8] indicate, the main reasons for difficulty of recruitment and farmer turnover include a lack of candidate farmers in the local landscape, and the marginal and fluctuating profits of grassland management.

5. Conclusions

The research presented provides a solid basis for knowledge of the current scenario of the farms that use communal pastures in NPSG. These farms have a higher level of extensive production than other extensive livestock systems in Southwestern Spain and other Spanish organic farms; the former with more pasture surfaces, lower stocking density and a higher proportion of autochthonous breeds, in accordance with OF principles.
There are diverse livestock systems using common grasslands in NPSG, with different surfaces and different combinations and proportions of livestock species, leading to various productions with different impacts on productive results and levels of intensification. The level of intensification largely determines the two variance factors that best explain the differences between farms: those relating to “goat products” and “cattle production”.
Of the four farming typologies identified, the group called “farms with multipurpose sheep” is that which supports the highest SR and has the highest profit; contrary to what happened with “large size and very extensive farms”. These economic differences are increased by the fact that the latter farms are those with the highest percentage of incidents when trying to collect support for OF; while the former are those with the lowest percentage of incidents of this type. However, very extensive farms are the most interesting for natural park conservation and, hence, the regional administration should help to resolve those incidents.
The farms studied have a high association with milk production, which contributes to nearly half of incomes, generates a high demand for labor and contributes to rural development. So, the profitability of dairy production should increase for future consolidation by means of differentiated commercialization.
Organic farming offers NPSG a commitment to conserve the natural park ecosystems, and to farmers a profitability equal to or greater than the area average; even when the commercial channels leading to a premium for the sale of these certificated and differentiated quality products are not developed. Therefore, organic farming can be a suitable tool for managing this protected natural area, which needs grazing to maintain vegetation equilibrium. However, NPSG authorities or the highest level of the regional government should help to improve the economic viability and continuity of the largest possible number of farms, which generate rural development (employment) while conserving the NP. This could be supported by the adoption of administrative measures to resolve incidents and to avoid bureaucratic hindrances.
A similar policy could be followed in other European HNV farmlands and pastures located in ‘less-favoured’ areas from an economic perspective, with a risk of abandonment.

Author Contributions

Conceptualization, C.D.-G. and V.R.-E.; methodology, C.D.-G., T.R.-P., M.S.-R. and V.R.-E.; validation, C.D.-G. and T.R.-P.; formal analysis, C.D.-G. and V.R.-E.; investigation, C.D.-G., T.R.-P. and V.R.-E.; resources, M.S.-R. and V.R.-E.; data curation, C.D.-G. and V.R.-E.; writing—original draft preparation, C.D.-G., M.S.-R. and V.R.-E.; writing—review and editing, C.D.-G. and V.R.-E.; funding acquisition, C.D.-G., M.S.R. and V.R.-E.

Funding

This research was funded by Consejería de Medio Ambiente (Junta de Andalucía, Spain) and Asociación Valor Ecológico CAAE (Ecovalia).

Acknowledgments

The authors are grateful to the Natural Park Sierra de Grazalema authorities for their technical support and to organic farmers for their collaboration and for preserving and enhancing the legacy of the traditional farming systems while conserving and reshaping the future of natural parks every day.

Conflicts of Interest

The authors declare no conflicts of interest. The funders had no role in the design of the study; in the collection, analyses, or interpretation of data; in the writing of the manuscript, or in the decision to publish the results.

References

  1. Schröder, B.R.H.F.R. Pasture Landscapes and Nature Conservation; Springer: Berlin/Heidelberg, Germany, 2002. [Google Scholar]
  2. EUROPARC-España. Anuario 2018 del Estado de las áreas Protegidas en España; Fundación Fernando González Bernáldez: Madrid, Spain, 2019; p. 130. [Google Scholar]
  3. Díaz-Gaona, C.; Sánchez-Rodríguez, M.; Gómez-Castro, G.; Rodríguez-Estévez, V. La ganadería ecológica en la gestión de los espacios naturales protegidos: Andalucía como modelo. Arch. Zootec. 2014, 63, 25–54. [Google Scholar] [CrossRef]
  4. Rodríguez-Estévez, V.; Díaz-Gaona, C.; Sánchez-Rodríguez, M. La ganadería ecológica como herramienta de conservación de los parques naturales Andaluces. In Informe Anual del Sector Agrario en Andalucía 2009; Analistas Económicos de Andalucía: Málaga, Spain, 2010; pp. 417–429. [Google Scholar]
  5. Consejería de Agricultura, Ganadería, Pesca y Desarrollo Sostenible. Available online: http://www.juntadeandalucia.es/medioambiente/site/portalweb/menuitem.220de8226575045b25f09a105510e1ca/?vgnextoid=8ac0ee9b421f4310VgnVCM2000000624e50aRCRD (accessed on 11 June 2019).
  6. European Environment Agency. Protected Areas in Europe—An Overview; EEA: Copenhagen, Denmark, 2012; ISBN 9789292133290. [Google Scholar]
  7. EUROPARC-España. Anuario EUROPARC-España del Estado de los Espacios Naturales Protegidos 2005; Fundación Fernando González Bernáldez: Madrid, Spain, 2006; p. 160. [Google Scholar]
  8. McGinlay, J.; Gowing, D.J.G.; Budds, J. The threat of abandonment in socio-ecological landscapes: Farmers’ motivations and perspectives on high nature value grassland conservation. Environ. Sci. Policy 2017, 69, 39–49. [Google Scholar] [CrossRef]
  9. European Environment Agency. High Nature Value Farmland: Characteristics, Trends, and Policy Challenges; European Environment Agency: Copenhagen, Denmark, 2004; ISBN 9291676640. [Google Scholar]
  10. Paracchini, M.L.; Petersen, J.-E.; Hoogeveen, Y.; Bamps, C.; Burfield, I.; Swaay, C. Van High Nature Value Farmland in Europe—An Estimate of the Distribution Patterns on the Basis of Land Cover and Biodiversity Data; OPOCE: Luxembourg, 2008; ISBN 9789279095689. [Google Scholar]
  11. Bernués, A.; Ruiz, R.; Olaizola, A.; Villalba, D.; Casasús, I. Sustainability of pasture-based livestock farming systems in the European Mediterranean context: Synergies and trade-offs. Livest. Sci. 2011, 139, 44–57. [Google Scholar] [CrossRef]
  12. European Union. Council Regulation (EC) No 834/2007 of 28 June 2007 on organic production and labelling of organic products and repealing Regulation (EEC) No 2092/91. Off. J. Eur. Union 2007, L189, 1–23. [Google Scholar]
  13. Oudshoorn, F.W.; Sørensen, C.A.G.; de Boer, I.J.M. Economic and environmental evaluation of three goal-vision based scenarios for organic dairy farming in Denmark. Agric. Syst. 2011, 104, 315–325. [Google Scholar] [CrossRef]
  14. Horrillo, A.; Escribano, M.; Mesias, F.J.; Elghannam, A.; Gaspar, P. Is there a future for organic production in high ecological value ecosystems? Agric. Syst. 2016, 143, 114–125. [Google Scholar] [CrossRef]
  15. Burgess, P.J.; Rosati, A. Advances in European agroforestry: Results from the AGFORWARD project. Agrofor. Syst. 2018, 92, 801–810. [Google Scholar] [CrossRef]
  16. European Union. Council Regulation (EEC) No. 2092/91 of 24 June 1991 on organic production of agricultural products and indications referring thereto on agricultural products and foodstuffs. Off. J. Eur. Union 1991, L198, 1–15. [Google Scholar]
  17. European Union. Commission Regulation (EC) No 889/2008 of 5 September 2008 laying down detailed rules for the implementation of Council Regulation (EC) No 834/2007 on organic production and labelling of organic products with regard to organic production, labeling and control. Off. J. Eur. Union 2008, 250, 1–84. [Google Scholar]
  18. Mądry, W.; Mena Guerrero, Y.; Roszkowska-Madra, B.; Gozdowski, R.; Hryniewski, R.; Castel Genís, J.M. An overview of farming system typology methodologies and its use in the study of pasture-based farming system: A review. Span. J. Agric. Res. 2013, 11, 316–326. [Google Scholar] [CrossRef]
  19. Riveiro, J.A.; Mantecón, A.R.; Álvarez, C.J.; Lavín, P. A typological characterization of dairy Assaf breed sheep farms at NW of Spain based on structural factor. Agric. Syst. 2013, 120, 27–37. [Google Scholar] [CrossRef]
  20. Gaspar, P.; Escribano, A.J.; Mesías, F.J.; Escribano, M.; Pulido, A.F. Goat systems of Villuercas-Ibores area in SW Spain: Problems and perspectives of traditional farming systems. Small Rumin. Res. 2011, 97, 1–11. [Google Scholar] [CrossRef]
  21. Gibon, A.; Sibbald, A.R.; Flamant, J.C.; Lhoste, P.; Revilla, R.; Rubino, R.; Sørensen, J.T. Livestock farming systems research in Europe and its potential contribution for managing towards sustainability in livestock farming. Livest. Prod. Sci. 1999, 61, 121–137. [Google Scholar] [CrossRef]
  22. Toro-Mujica, P.; García, A.; Gómez-Castro, A.; Perea, J.; Rodríguez-Estévez, V.; Angón, E.; Barba, C. Organic dairy sheep farms in south-central Spain: Typologies according to livestock management and economic variables. Small Rumin. Res. 2012, 104, 28–36. [Google Scholar] [CrossRef]
  23. Milán, M.J.; Arnalte, E.; Caja, G. Economic profitability and typology of Ripollesa breed sheep farms in Spain. Small Rumin. Res. 2003, 49, 97–105. [Google Scholar] [CrossRef]
  24. Milán, M.J.; Caja, G.; González-González, R.; Fernández-Pérez, A.M.; Such, X. Structure and performance of Awassi and Assaf dairy sheep farms in northwestern Spain. J. Dairy Sci. 2011, 94, 771–784. [Google Scholar] [CrossRef] [Green Version]
  25. Castel, J.M.; Mena, Y.; Delgado-Pertıñez, M.; Camúñez, J.; Basulto, J.; Caravaca, F.; Guzmán-Guerrero, J.L.; Alcalde, M.J. Characterization of semi-extensive goat production systems in southern Spain. Small Rumin. Res. 2003, 47, 133–143. [Google Scholar] [CrossRef]
  26. Milán, M.J.; Bartolomé, J.; Quintanilla, R.; García-Cachán, M.D.; Espejo, M.; Herráiz, P.L.; Sánchez-Recio, J.M.; Piedrafita, J. Structural characterisation and typology of beef cattle farms of Spanish wooded rangelands (dehesas). Livest. Sci. 2006, 99, 197–209. [Google Scholar] [CrossRef]
  27. Ambiente, C.D.M. Decreto 90/2006, de 18 de Abril, por el que se Aprueban el Plan de Ordenación de los Recursos Naturales y el Plan Rector de Uso y Gestión del Parque Natural Sierra de Grazalema; Junta de Andalucía: Sevilla, Spain, 2006.
  28. Mena, Y.; Ruiz-Mirazo, J.; Ruiz, F.A.; Castel, J.M. Characterization and typification of small ruminant farms providing fuelbreak grazing services for wildfire prevention in Andalusia (Spain). Sci. Total Environ. 2016, 544, 211–219. [Google Scholar] [CrossRef]
  29. Mata Moreno, C.; Maurer, P.; Rodríguez Estévez, V.; Fernández, R.A. Recopilación del Conocimiento Ganadero Tradicional de la Comarca de la Sierra de Cádiz y su Validación Para la Reconversión e Implantación de la Ganadería Ecológica; ASAJA-UCO Producción Animal: Córdoba, Spain, 2004. [Google Scholar]
  30. De León, A. Caracterización Agroclimática de la provincia de Cádiz; Ministerio de Agricultura, Pesca y Alimentación: Madrid, Spain, 1989; p. 175.
  31. Fernández-Cancio, A.; NavarroCerrillo, R.M.; Fernández, R.F.; Hernández, P.G.; Meneéndez, E.M.; Martínez, C.C. Climate classification of Abies pinsapo Boiss. Forests in Southern Spain. For. Syst. 2007, 16, 222–229. [Google Scholar] [CrossRef]
  32. Dobremez, L.; Bousset, J.-P. Rendre Compte de la Diversité des Explotations Agricoles: Une Démarche D’analyse par Exploration Conjointe de Sources Statistiques, Comptables et Technico-Économiques; Centre National du Machinisme Agricole du Génie Rural des Eaux et des Forêts: Paris, France, 1996; ISBN 2853624501. [Google Scholar]
  33. Gaspar, P.; Escribano, M.; Mesías, F.J.; de Ledesma, A.R.; Pulido, F. Sheep farms in the Spanish rangelands (dehesas): Typologies according to livestock management and economic indicators. Small Rumin. Res. 2008, 74, 52–63. [Google Scholar] [CrossRef]
  34. Uriel, E.; Aldas, J. Análisis Multivariante Aplicado; Thompson: Madrid, Spain, 2005; Volume 76. [Google Scholar]
  35. Hair, J.F.; Anderson, R.E.; Tatham, R.L.; Black, W.C. Análisis Multivariante; Prentice Hall: Madrid, Spain, 1999; Volume 491. [Google Scholar]
  36. Malhotra, N.K. Investigación de Mercados: Un Enfoque Aplicado. Pearson Educación: Naucalpan de Juárez, México, 2004; ISBN 9702604915. [Google Scholar]
  37. Martínez-González, M.Á.; Sánchez-Villegas, A.; Faulín, F.J. Bioestadística Amigable; Díaz de Santos: Barcelona, Spain, 2008; ISBN 8490225001. [Google Scholar]
  38. Rodríguez-Estévez, V.; Sánchez-Rodríguez, M.; Arce, C.; García, A.R.; Perea, J.M.; Gómez-Castro, A.G. Consumption of Acorns by Finishing Iberian Pigs and Their Function in the Conservation of the Dehesa Agroecosystem. In Agroforestry for Biodiversity and Ecosystem Services—Science and Practice; InTech: Rijeka, Croatia, 2012; pp. 1–22. [Google Scholar]
  39. Escribano, M.; de Ledesma, A.R.; Mesías, F.J.; Pulido, F. Niveles de cargas ganaderas en la dehesa extremeña. Arch. Zootec. 2002, 51, 315–326. [Google Scholar]
  40. Ministerio de Agricultura, Pesca y Alimentación. Tierras Resultados Técnico-Económicos del Vacuno de Carne 2008; Castilla y León y Navarra: Andalucía, Spain, 2010; Volume 165, pp. 43–50.
  41. Perea, J.M.; García, A.; Valerio, D.; Acero, R.; Romero, M.; Alcántara, A. Buenas Prácticas en Producción Ecológica; Producción de Bovino de Carne (Ciclo completo); Ministerio de Medio Ambiente y Medio Rural y Marino: Madrid, Spain, 2008. [Google Scholar]
  42. Gutierrez-Peña, R.; Mena, Y.; Ruiz, F.A.; Delgado-Pertíñez, M. Strengths and weaknesses of traditional feeding management of dairy goat farms in mountain areas. Agroecol. Sustain. Food Syst. 2016, 40, 736–756. [Google Scholar] [CrossRef]
  43. Bellido, M.; Sánchez, M.E.; Díaz, F.J.M.; de Ledesma, A.R.; García, F.P. Sistemas extensivos de producción animal. Arch. Zootec. 2001, 50, 465–489. [Google Scholar]
  44. Sánchez, M.; Santos Alcudia, R.; Gil Rubio, M.J. Evolución y resultados de la producción de leche del grupo caprino de COVAP. In Proceedings of the XXVIII Jornadas Científicas y VII Internacionalesde la Sociedad Española Ovinotecnia y Caprinotenia, Badajoz, Spain, 25–27 September 2003; pp. 124–127. [Google Scholar]
  45. Perea, J.; García, A.; Acero, R.; Valerio, D.; Rodríguez, V. Caracterización productiva del vacuno ecológico en Andalucía. Arch. Zootec. 2007, 56, 517–521. [Google Scholar]
  46. García, P.G. Evaluación Técnico-Económica y Caracterización de Sistemas Ganaderos Extensivos en Dehesas de Extremadura; Universidad de Extremadura: Badajoz, Spain, 2007. [Google Scholar]
  47. Ruiz, F.A.; Castel, J.M.; Mena, Y.; Camúñez, J.; González-Redondo, P. Application of the technico-economic analysis for characterizing, making diagnoses and improving pastoral dairy goat systems in Andalusia (Spain). Small Rumin. Res. 2008, 77, 208–220. [Google Scholar] [CrossRef]
  48. García, A.; Domenech, V.; Frías, J.J.; Herrera, M.; Peña, F.; Martos, J.; Acero, R. Caracterización Técnico-Económica de los Sistemas de Producción de Caprino Extensivo en la Provincia de Jaén Como Base del Desarrollo Sostenible; Analista Económicos de Andalucióa: Málaga, España, 1999; ISBN 849519113X. [Google Scholar]
  49. Mateos, E. EI ganado caprino en el nordeste cacereño. Mundo Ganad. 1990, 9, 29–35. [Google Scholar]
  50. García, A.; Perea, J.; Acero, R. Estrategias comerciales de los sectores ganaderos ecológicos. Incidencia de las subvenciones. In Informe Anual del Sector Agrario en Andalucía 2008; Analistas Económicos de Andalucía: Málaga, España, 2009; pp. 293–316. [Google Scholar]
  51. European Union. Council Regulation (EC) No 1698/2005 of 20 September 2005 on support for rural development by the European Agricultural Fund for Rural Development (EAFRD). Off. J. Eur. Union 2005, L277, 1–40. [Google Scholar]
  52. Perea, J.; Penedo, I.B.; Barba, C.; Angón, E.; García, A. Organic beef farming in Spain: Typology according to livestock management and economic variables. Rev. Cient. 2014, 24, 347–354. [Google Scholar]
  53. López-i-Gelats, F.; Bartolomé, J. Typologies of organic beef farms in Catalonia. Options Méditerranéennes. Série A Séminaires Méditerranéens 2010, 92, 45–48. [Google Scholar]
  54. Castel, J.M.; Mena, Y.; Ruiz, F.A.; Camúñez-Ruiz, J.; Sánchez-Rodríguez, M. Changes occurring in dairy goat production systems in less favoured areas of Spain. Small Rumin. Res. 2011, 96, 83–92. [Google Scholar] [CrossRef]
  55. Mena, Y.; Gutierrez-Peña, R.; Ruiz, F.A.; Delgado-Pertíñez, M. Can dairy goat farms in mountain areas reach a satisfactory level of profitability without intensification? A case study in Andalusia (Spain). Agroecol. Sustain. Food Syst. 2017, 41, 614–634. [Google Scholar] [CrossRef]
  56. Carpio, A.; Bonilla-Valverde, D.; Arce, C.; Rodríguez-Estévez, V.; Sánchez-Rodríguez, M.; Arce, L.; Valcárcel, M. Evaluation of hippuric acid content in goat milk as a marker of feeding regimen. J. Dairy Sci. 2013, 96, 5426–5434. [Google Scholar] [CrossRef] [PubMed] [Green Version]
  57. Lovrić, M.; Rois-Díaz, M.; den Herder, M.; Pisanelli, A.; Lovrić, N.; Burgess, P.J. Driving forces for agroforestry uptake in Mediterranean Europe: Application of the analytic network process. Agrofor. Syst. 2018, 92, 863–876. [Google Scholar] [CrossRef]
  58. Escribano, A. Beef Cattle Farms’ Conversion to the Organic System. Recommendations for Success in the Face of Future Changes in a Global Context. Sustainability 2016, 8, 572. [Google Scholar] [CrossRef]
Figure 1. Dendrogram for hierarchical clustering using the Ward’s method and the Euclidean distance.
Sustainability 11 06002 g001
Figure 2. Positioning of the farms according to the scores obtained for principal component 1 (goat production) and principal component 2 (cattle production), where groups C1, C2, C3 and C4 are “medium size farms without sheep”, “large size and very extensive farms”, “farms with multipurpose sheep” and “farms with dairy goat and without cattle” respectively.
Sustainability 11 06002 g002
Table 1. Descriptive statistics for technical, economic and social variables.
MeanStandard DeviationCoefficient of Variation
Land in ownership (%)19.6223.91121.88
Total rented surface (%)80.3823.9129.75
Total farm surface (ha) 605.16528.6987.36
Surface registered as organic (%)48.6637.9477.98
Cattle stocking rate (LU/ha)0.080.0899.17
Sheep stocking rate (LU/ha)0.050.05107.58
Goat stocking rate (LU/ha)0.070.0678.06
Total stocking rate (LU/ha)0.210.1258.23
Cattle LU/Total LU (%)37.8924.6865.14
Sheep LU/Total LU (%)23.7721.2889.51
Goat LU/Total LU (%)36.9326.7172.34
Ewe replacement rate (%)10.168.6485.04
Lambs sold per year150.55275.43182.95
Cow replacement rate (%)13.049.2671.00
Calves sold per year22.9426.05113.54
Goat replacement rate (%)20.9411.8256.45
Kids sold per year191.54198.32103.54
Total work units per area (WU/100 ha and year)0.490.3060.91
Fixed work units per area (WU/100 ha and year)0.040.13360.07
Temporary work units per area (WU/100 ha and year)0.010.01141.39
Family work units per area (WU/100 ha and year)0.440.2659.49
Total work units per animal (WU/100 LU and year)2.401.1246.66
Fixed capital per area (€/ha)938.171,143.48121.88
Buildings’ fixed capital (€/ha)47.9054.38113.53
Machinery fixed capital (€/ha)16.8018.54110.39
Livestock fixed capital (€/ha)115.5874.0764.09
Supplementary feed (Kg/ha and year)28.4750.25176.52
Veterinary costs (€/ha and year)1.250.9878.54
Other goods and services per area (€/ha)13.379.5371.32
Intermediate consumption (€/ha)43.0853.20123.48
Labor costs per area (€/ha and year)63.2338.5260.93
Fixed capital consumption (amortization) per area (€/ha)2.642.6098.37
Rents paid per area (€/ha and year)12.629.4274.62
Livestock sold per area (€/ha and year)58.3164.08109.89
Other products sold per area (€/ha and year)85.9468.2379.39
Fixed capital goods produced on own account (€/ha and year)20.1514.6472.64
Total incomes from farming production (gross output) per area (€/ha and year)164.40119.2772.55
Subsidies to farming (different to organic farming support) per area (€/ha and year)30.3920.3066.80
Subsidies to organic farming per area (€/ha and year)19.6130.02153.08
Net value added at factor cost per area (€/ha and year)168.68115.3968.41
Net operating surplus per area (€/ha and year)105.4590.7486.05
Net entrepreneurial income per area (€/ha and year)92.8388.1794.98
Rate of return18.0020.11111.71
Breakeven point (LU/ha)0.090.0551.14
Profit (€/ha and year)92.8388.1794.98
Total sales/total incomes73.3317.7224.17
Total subsidies/total incomes26.6717.7266.46
Incomes from lambs sold (€/ha and year)9.0510.24113.11
Incomes from sheep milk sold (€/ha and year)14.1934.40242.43
Incomes from calves sold (€/ha and year)20.8128.36136.25
Incomes from kids sold (€/ha and year)16.7115.0490.02
Incomes from goat milk sold (€/ha and year)71.7569.2096.45
Table 2. Descriptive statistics for livestock census and stocking rates.
NMean±Standard
Error
Standard
Deviation
Q1Q3
Cattle LU1860.15±12.0751.2222.6084.29
Sheep LU1639.80±10.9543.8011.5239.86
Goat LU2036.23±6.9531.0921.0041.03
Swine LU411.87±6.5213.051.0525.17
Total LU23108.32±23.47112.5547.17133.74
Cattle SR *180.10±0.020.080.050.15
Sheep SR *160.07±0.010.050.030.11
Goat SR *200.09±0.010.050.040.13
Ruminants SR *230.20±0.020.110.110.25
Swine SR *40.04±0.020.040.000.08
Total SR *230.21±0.030.120.110.25
Cattle LU/Total LU (%) **1848.41±3.7215.7740.6656.51
Sheep LU/Total LU (%) **1634.17±4.2216.8826.1041.92
Goat LU/Total LU (%) **2042.46±5.3824.0621.1058.51
Swine LU/Total LU (%) **48.15±3.857.691.5915.92
* SR: stocking rate (LU/ha). ** These percentages correspond to those farms with the species.
Table 3. Matrix of Pearson correlations for the census (livestock units: LU) and stocking rates (SR; LU/ha) and surface.
Sheep LUGoat LUSwine LUTotal LUCattle SR
Cattle LU0.723 **0.894 **0.9480.930 **0.411
Sheep LU 0.920 **−0.8280.919 **0.202
Goat LU 0.9430.914 **0.276
Swine LU 0.8390.934
Total LU 0.429 *
Sheep SRGoat SRSwine SRTotal SRTotal Surface
Cattle LU0.3270.2150.1730.4610.602 **
Sheep LU0.4870.174−0.1920.3280.355
Goat LU0.548 *0.282−0.0970.482 *0.437
Swine LU0.3270.210.980 *0.95−0.398
Total LU0.3860.0210.1190.476 *0.534 **
Cattle SR0.108−0.1120.766 **0.779 **−0.039
Sheep SR -0.1−0.030.448 *−0.077
Goat SR 0.0710.372−0.467 *
Swine SR 0.696 **−0.163
Total SR −0.31
* p < 0.05, ** p < 0.01.
Table 4. Matrix of Pearson correlations for stocking rates of different species (SR; LU/ha) and economic indicators.
Cattle SRSheep SRGoat SRTotal SR
Cost indicatorsSupplementary feed per area (Kg/ha and year)0.844 **−0.2060.1460.675 **
Veterinary costs (€/ha and year)0.489 *0.2760.3850.382
Other goods and services (€/ha and year)0.631 **0.2840.485 *0.417 *
Intermediate consumption (€/ha and year)0.880 **−0.1440.2270.719 **
Labor costs per area (€/ha and year)0.811 **0.3020.782 **0.606 **
Amortization (€/ha and year)0.640 **0.010.560 *0.398
Rents paid per area (€/ha and year)0.0830.499 *−0.0670.188
Income indicatorsLivestock sales (€/ha and year)0.952 **0.1010.2750.915 **
Milk sales (€/ha and year)0.575 *0.641 **0.925 **0.495 *
Fixed capital goods produced on own account (€/ha and year)0.934 **0.3980.3320.902 **
Subsidies to farming (€/ha and year)0.799 **0.679 **0.721 **0.802 **
Subsidies to organic farming (€/ha and year)−0.0110.2990.3810.052
Other economic indicatorsNet value added (€/ha)0.755 **0.709**0.806**0.783 **
Net value added at factor cost (€/ha)0.710 **0.746**0.841 **0.729 **
Net operating surplus (€/ha)0.564 *0.779 **0.739 **0.669 **
Net entrepreneurial income0.579 *0.747 **0.750 **0.669 **
(profit) (€/ha)
Working capital (€/ha)0.898 **0.030.504 *0.747 **
Rate of return (%)−0.1110.1360.128−0.022
* p < 0.05, ** p < 0.01.
Table 5. Principal components (PC) selected, eigenvalues, explained and accumulated variances, and correlation coefficients of the variables with each PC.
PCEigenvalue % Variance Explained
(% Variance Accumulated)
VariablesCorrelation with the PC
14.8Total work units per animal (WU/100 LU and year)0.9
25.1Goat LU/Total LU0.8
(25.1)Incomes from goat milk sold per area (€/ha and year)0.8
Incomes from kids sold per area (€/ha and year)0.7
Work units per area (WU/100 ha and year)0.6
Farm surface (ha)−0.8
Cattle LU/Total LU−0.8
24.0Incomes from calves sold per area (€/ha and year)0.9
21.3Stocking rate (LU/ha)0.9
(46.4)Supplementary feed (€/ha and year)0.9
Land in ownership (%)0.7
Profit (€/ha and year)0.5
33.0Sheep LU/Total LU0.9
16.0Lambs sold (€/ha and year)0.8
(62.4)Sheep milk sold (€/ha and year)0.8
Rents paid (€/ha and year)0.5
42.1Subsidies to organic farming per area (€/ha and year)0.9
11.2Rate of return per area (€/ha and year)0.6
(73.6)Total sales/total incomes−0.8
Table 6. Means of quantitative variables and significance levels from the ANOVA for the characterization of clusters.
C1
(n = 7)
C2
(n = 6)
C3
(n = 5)
C4
(n = 5)
Total
(n = 23)
F
Total farm surface (ha)370.93a1305.86b471.43a226.00a605.1613.03***
Family work units per area (WU/100 ha and year)0.39ab0.15a0.63bc0.69c0.4411.81***
Total work units per animal (WU/100 LU and year)2.42a1.60a1.69a4.05b2.4016.29***
Total stocking rate (LU/ha)0.18a0.10a0.39b0.21a0.2115.57***
Cattle LU/Total LU (%)48.42a48.90a47.82a0.00b37.8913.75***
Sheep LU/Total LU (%)2.44a34.97b33.74b30.21ab23.775.53**
Goat LU/Total LU (%)48.82a15.90b12.64b69.79a36.9320.46***
Lambs sold (€/ha and year)1.53a5.50a22.40b10.50a9.059.31***
Sheep milk sold (€/ha and year)0.00a4.83ab52.41b7.07ab14.193.63*
Calves sold (€/ha and year)22.06ab7.09a56.35b0.00a20.817.55**
Kids sold per area (€/ha and year)20.97ab3.15a11.91a31.81b16.716.32**
Goat milk sold (€/ha and year)77.06ab11.95a61.09ab146.74b71.755.79**
Profit (€/ha and year)72.74ab22.37a184.62b113.71ab92.835.18**
Groups: C1 = medium size farms without sheep, C2 = large size and very extensive farms, C3 = farms with multipurpose sheep, C4 = farms with dairy goat and without cattle. a and b: means with different letters show significant differences between groups; * p < 0.05, ** p < 0.01, *** p < 0.001.
Table 7. Schematic comparison of the cluster groups.
C1
(30.43%)
C2
(26.09%)
C3
(21.74%)
C4
(21.74%)
Total farm surface (ha)Intermediate (300–700)Large (>700)(a)Small (<300)
Family work units per area (WU/100 ha and year)Intermediate (0.24–0.50)Low (<0.24)(a)High (>0.50)
Total work units per animal (WU/100 LU and year)Intermediate (2–3)(a)Low (<2)High (>3)
Stocking rate (LU/ha)Intermediate (0.14–0.25)Low (<0.14)High (>0.25)Intermediate (0.14–0.25)
Cattle LU/Total LU (%)(a)(a)(a)Non existent
Sheep LU/Total LU (%)Non existent(a)(a)(a)
Goat LU/Total LU (%)Intermediate (28–52)Low (<28)Low (<28)High (>52)
Lambs sold (€/ha and year)Non existentLow (<10)High (>18)(a)
Sheep milk sold (€/ha and year)Non existent(a)High (>14)Non existent
Calves sold (€/ha and year)(a)Low (3–11)High (>23)Non existent
Kids sold per area (€/ha and year)(a)Low (<7)(a)(a)
Goat milk sold (€/ha and year)(a)Low (<24)(a)High (>90)
Profit (€/ha and year)Intermediate (35–125)Low (<35)High (>125)Variable
(a): Variable without influence in group characterization. Groups: C1 = medium size farms without sheep, C2 = large size and very extensive farms, C3 = farms with multipurpose sheep, C4 = farms with dairy goat and without cattle.
Table 8. Distribution of cluster groups for variables related to organic farming.
C1C2C3C4Total
Organic farms (%)57.1100.080.060.073.9
Organic farms receiving subsidies to organic farming (%)50.033.375.066.752.9
Farms receiving subsidies to organic farming in NPSG (%)28.633.360.040.039.1
Groups: C1 = medium size farms without sheep, C2 = large size and very extensive farms, C3 = farms with multipurpose sheep, C4 = farms with dairy goat and without cattle.

