Abstract
Scientists are a core element of regional technological innovation and economic growth. Academicians of the Chinese Academy of Sciences (CAS) and Chinese Academy of Engineering (CAE) are outstanding representatives of Chinese scientists. The purpose of this paper is to reveal the characteristics of Chinese scientists’ space migration, depict the structural topology of their flow network and to analyze the driving mechanisms behind the characteristics of their space migration. We mainly used spatial statistics, complex network analysis, and a modified location quotient. Our main conclusions are as follows: (1) The spatial distribution of Chinese scientists at different development stages tends to converge. The Chinese scientists’ birthplaces are highly concentrated in the eastern coastal areas and the Yangtze River basin. Education locations are highly consistent, with clusters of global high-level educational resources at home and abroad, and their workplaces are mainly distributed in economically developed cities. (2) In terms of network characteristics, the spatial heterogeneity of the growth of Chinese scientists is obvious. Only a few cities, such as Beijing, Shanghai, and Nanjing, have higher degrees of node centrality, strength centrality, and betweenness centrality, so their networks’ hierarchical structures are pyramid-shaped and their core-periphery structures are prominent. By identifying the roles of the cities as network nodes, we found that only Beijing plays accomplished and stable roles, whereas other cities play a single role. (3) Regarding driving mechanisms, Chinese scientists’ spatial migration has been influenced by national policy, regional economic level, education level, and individual traits at national, regional, and personal scales. Therefore, the combined effects of various forces have driven the evolution of the flow network of Chinese scientists.
1. Introduction
A new round of technological and industrial revolution is reshaping the global innovation landscape [1,2], and the competition for the first-class scientific and technological talents to seize the advantage of scientific and technological innovation has already become a key support for increasing comprehensive national strength [3,4]. In recent years, the flow of scientific and technological talents’ spatial migration has been scaling up. For example, talents have gravitated to developed regions with first-class research resources and good career prospects for study and employment. In addition, emerging areas, with rapid economic development, improvement of social conditions and a proactive talent strategy, have begun to attract talents back [5]. Scientists’ clusters depend on the use of rich human resources to produce a scale effect that effectively promotes knowledge innovation, technological innovation, and scientific and technological progress in regions with talent agglomeration [6,7]. For example, groups of multinational scientists have built important technological innovation networks in Silicon Valley, Hsinchu, and Shanghai, which has promoted the growth of technology centers in mainland China and Taiwan, China. In the 1980s and 1990s, Taiwan pioneered semiconductor and personal computer manufacturing centers worldwide. The key to that was the flow and spillover of knowledge produced by a batch of US scientists shuttling between Silicon Valley and Taiwan [8].
As outstanding representatives of China’s top innovative talents and scientists, academicians of the Chinese Academy of Sciences (CAS) and Chinese Academy of Engineering (CAE) embody China’s highest level of science and technology [9,10], so agglomeration areas of CAS and CAE academicians are bound to be dominant in the competition for technological innovation. As one of the main carriers of knowledge flow and communication, the spatial migration of CAS and CAE academicians at different development stages accelerates the agglomeration and diffusion of knowledge, to some degree, and promotes the formation and development of knowledge and technology centers [6,11]. Against the backdrop of the acceleration of globalization and the implementation of China’s innovation-driven development strategy, China has stepped up efforts to make itself an innovative country with strong innovative capacity and global competitiveness. The task of cultivating and introducing scientists, as well as allowing them to realize their full potential, is one of China’s priorities. Thus, it is of great practical significance to reveal the spatial distribution and the characteristics of Chinese scientists’ space migration, so as to better attract and agglomerate global high-end technological talents, and promote the regional agglomeration and flow.
The purpose of this paper is to reveal the flow network of Chinese scientists and to analyze the driving mechanisms behind their space migration. The following three questions will be studied: (1) What are the characteristics of the spatial distribution of Chinese scientists at different development stages? (2) What is the structure of their flow network? (3) What factors drive the flow of Chinese scientists? Based on data sourced from the academicians of the Chinese Academy of Sciences (CAS) and the Chinese Academy of Engineering (CAE) at different development stages, this paper uses spatial statistics, social network approaches and visualization software to study the issues above.
The three main contributions of the study are as follows. First, the characteristics of the spatial distribution of Chinese scientists at different development stages at an urban scale are systematically revealed. Second, topological structures and core-periphery structures of the flow network of Chinese scientists are depicted and the role of cities as network nodes is identified by curriculum vitae analysis. Third, driving mechanisms behind Chinese scientists’ flow patterns are revealed through the application of relevant talent flow theories.
2. Literature Review
Due to the transformation of the world economy from being factor-driven to innovation-driven, research has regarded talent as a rare resource, and innovation factors have become a focus. However, at present, no clear definition exists of the concept of “talent” in academic circles, so the research object is relatively broad and general [12]. Some scholars regard college graduates [13], overseas students [14] and even migrant workers [15] as talents. This idea remains to be discussed. In recent years, as the significant role of talent in innovation has reached consensus, talent research has focused on scientific elites. Three types of scientific elites have always been the object of research, namely internationally renowned technology award winners (such as the Nobel Prize in Science, Wolf Prize, and Turing Award), academicians of international authoritative academies (such as National Academy of Sciences, United States; Royal Society, The United Kingdom; and French Academy of Sciences), and highly cited scientists around the world [16]. Research on Chinese scientific elites has mainly concentrated on CAS and CAE [17], Chang Jiang Scholars Program [18], The National Science Fund for Distinguished Young Scholars [4], and the Recruitment Program of Global Experts National [19]. At present, studies of the spatial distribution and flow of scientists have evolved from theoretical research to empirical analysis, including the geographical distribution patterns, flow characteristics, influencing factors, mechanisms, and flow effect of scientists.
The geospatial distribution of scientists shows a remarkably regional agglomeration. Globally, scientists agglomerate in Western Europe and North America, particularly the United States, the modern world technology center. Batty found that half of the most highly cited scientists in the world agglomerated in dozens of research institutions in a few developed countries [20]. Basu calculated the number of highly cited scientists from 1981 to 1999 and revealed that the proportion of such scientists in the United States was as high as 67% [21]. He found that Nobel Prize winners are highly concentrated in developed countries of North America and Europe, especially the United States, Britain, and Germany [22]. In China, spatial differences in Chinese talents tend to be evident. The talent remains mainly distributed in the coastal areas of Eastern China [23,24] and concentrated in regions with higher economic levels [25,26].
The flow characteristics of scientists obviously tend to be trans-regional or transnational, and the main trend of flow is to move to regions or countries with a higher level of science and technology. Hunter et al. found that nearly half of the most cited physicists in the world work outside their country of birth [27]. Zafira and Wang et al., respectively, found that the vast majority of the talent drain from Canada and China to the United States is concentrated in a few professional fields [28,29]. Some scholars believe that talent flow is experiencing a progression from “talent drain” and “talent reflux” to “talent circulation” [30,31]. A report of the OECD shows that an increasing number of scientists are returning to emerging economies, such as Brazil, Russia, India, and China (BRICs) [32]. For example, Huang et al. found that compared with BRICs and OECD countries outside the United States, especially China and India, the number and proportion of genetic scientists in the United States decreased [33].
The spatial differentiation of scientists is influenced by multiple factors [19], such as the natural environment, economic basis, cultural education level, and the political environment [34,35,36,37]. Early in their career, scientists are often attracted by a country with cutting-edge science and technology, good career prospects and a high-quality research environment [38,39]. For those who want to return after emigrating abroad, career prospects and return to the family are the most important factors [40]. Gaulé believes that the level of economic development and per capita income in their homeland are the primary factors for scientists working in the United States to return home [41]. In addition, international scientific and technological cooperation is also a factor that promotes the transnational flow of scientists [42].
Talent flow serves as an important channel of knowledge spillover, which can effectively promote regional knowledge diffusion, technological progress, and economic growth. Fallick et al. believe that the cross-border flow of scientists largely accounts for regional knowledge spillovers, and the knowledge spillovers caused by the flow of regional talents will greatly promote regional technological innovation [43]. This, of course, should be the case in developing countries. Saxenian believes that technology transfer can also be carried out in East Asia through a flow network of scientists returning home [44]. Walz holds that the flow of technological talents between developed and developing countries will lead to the flow of knowledge and technology between regions and promote the technological progress and economic growth of developing countries [45].
By summarizing the current research literature, we find that since no unified understanding exists of the connotation of talent, the current literature on talent is relatively broad and studies that focus on Chinese top scientists are relatively rare. Studies of scientists’ space agglomeration are mainly concentrated on static descriptions that lack a dynamic perspective. Gaps exist in the literature on the research of scientists’ spatial interaction processes from the network perspective. The study of spatial scientists’ distribution mostly remains at the national level and few studies have focused on spatial distribution and flow patterns at an urban scale.
In real geospatial space, scientists’ agglomeration is a dynamic, non-linear and multi-factor interactive process that involves multiple complex flow phenomena and migration characteristics. A single static research method cannot reveal the whole picture of the process of scientists’ spatial migration, nor can it satisfy the complex and ever-changing reality. Thus, developing an in-depth analysis of the spatial migration process of scientists and its mechanisms from a dynamic network perspective is necessary. Given this phenomenon, it is of certain feasibility and objectivity to use social network approaches to depict a flow network of Chinese scientists’ spatial migration.
3. Data and Methods
3.1. Data Sources
The academician is one of the highest academic titles established by the state in the field of science and technology representing the highest national scientific and technological level. Therefore, we used typical cases of academicians of CAS and CAE to reveal the scientists’ spatial migration characteristics and their driving mechanisms. The data samples in this study were taken from the list of academicians of CAS and CAE. As of May 2019, 1370 Chinese academicians were included in the CAS and 1070 Chinese academicians in the CAE, including deceased academicians but excluding foreign academicians, for 2440 in total. A total of 34 Chinese scientists were both academicians of CAS and CAE, to yield a final research sample of 2406 academicians.
We adopted the curriculum vitae (CV) analysis method to determine the development path information of academician individuals. The CV analysis method is a simple and effective analytical method that takes CV information, such as personal background, and work and life experience, as the basic data and is used to analyze and evaluate the life information of the respondents [33]. First, by drawing lessons from the relevant division method of the talent development path, we divided the development of scientists into 6 stages: birthplace (Bir-C), undergraduate graduation place (Uni-C), place where highest degree was obtained (Hig-C), first workplace (Fir-C), place where academician title was received (Aca-C), and place of current job (Cur-C) [46,47]. Second, information about each scientist’s 6 development stages was obtained using data collection methods, including network information retrieval (websites of CAS and CAE and websites of work units), literature inquiry (related statistics such as biography), interviews, and e-mail inquiry. Finally, relevant information from the scientists’ development stages was transferred into the corresponding urban space information, which was used to construct a database of the Chinese scientists’ spatial information.
3.2. Network Construction
The projection of a scientist’s development path in space can be abstracted as a flow network, with scientists as the medium and cities as the carriers. The L-space and P-space models are two popular methods for constructing an adjacency matrix of complex networks. The L-space model is used to identify direct links between cities [48]. A scientist’s growth network constructed using an L-space model depicts the development path as a one-way irreversible recursive path. However, scientists undertake multiple round trips between their birthplaces, educational places, and workplaces. Thus, a city link based on a scientist’s development path should be an overlapping composite network. Thus, the L-space model cannot comprehensively reflect the actual situation of a Chinese scientist’s spatial flow (Figure 1a). The P-space model considers that if any two points in the network can be linked together through a connection, these two points are regarded as linked points [49]. Under the effect of the P-space model, scientists’ individual development paths form a small undirected and fully connected network. The P-space model strictly requires that the related places form compound overlapping connections as a result of a scientist’s development path (Figure 1b). Therefore, the P-space model can systematically and accurately reflect a scientist’s flow in reality to form an urban connection network.
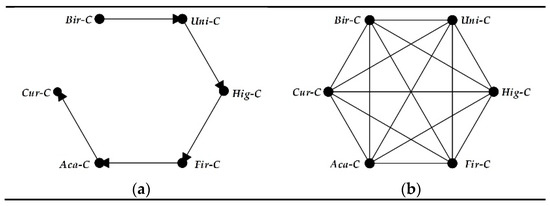
Figure 1.
An adjacency matrix abstract model of the network for the growth of Chinese scientists: (a) L-space, (b) P-space.
When constructing a P-space model, in some cases, multiple development stages exist in the same city. If no changes occur in the places of a scientists’ development stages, the urban connection is interpreted as 0. If the places of scientists’ development stages change within 2 cities, the urban connection is interpreted as 1. If the places of scientists’ development stages change within 3 cities, the urban connection is interpreted as 3. If the places of scientists’ development stages change within 4 cities, the urban connection is interpreted as 6. If the places of scientists’ development stages change within 5 cities, the urban connection is interpreted as 10. If the places of scientists’ development stages change within 6 cities, the urban connection is interpreted as 15.
The main technical software to analyze the social network used in this paper were Pajek, Gephi and VOSviewer. Gephi is the leading visualization and exploration software for all kinds of graphs and networks [50]. We used Gephi to count the overall characteristics of the network. The flow network for Chinese scientists consists of 469 nodes and 3792 edges. Pajek can analyze and visualize very large networks [51], and was applied to detect core-periphery structures in this study. VOSviewer is a software tool for constructing and visualizing bibliometric networks [52], which was applied to draw the topological map of the Chinese scientists’ flow network in this study.
3.3. Measurement Model
3.3.1. Network Attribute Measurement Model
Degree Centrality
Degree centrality refers to the number of other nodes connected to a certain node and depicts the degree of connection. The directional network node degree centrality is divided into the out-degree and in-degree. In the Chinese scientists’ flow network, the degree centrality of a node shows the number of cities that have made contact with the city due to the flow of scientists. The higher the degree centrality, the higher the number of cities connected to the city. The measurement model of degree centrality is as follows:
where is the degree centrality of a city; i, j are city i and city j; and is the Chinese scientist’s flow network matrix. The assignment with the scientist’s flow relationship is 1, and the assignment without the scientist’s flow relationship is 0.
Strength Centrality
Strength centrality is also called weighted degree centrality and refers to the weight of the edge that is directly connected with a certain node. In the weighted degree centrality of a directed network the nodes can be divided into the weighted out-degree and weighted in-degree. In the Chinese scientists’ flow network, the weighted degree centrality of the node shows the total amount of the scientists who enter the city and those who move to other cities from the city. The measurement model of strength centrality is as follows:
where means the weighted degree centrality of a city, v is a set of nodes that are directly connected with node i, and wij is the number of flow scientists who connect city i and city j, also called weight. The larger the weighted degree centrality of a city, the more important the position of the city in the Chinese scientists’ flow network.
Betweenness Centrality
Betweenness Centrality refers to the proportion of the paths passing through the node among all the shortest paths in the network that account for the total number of all nodes with the shortest paths. In the Chinese scientists’ flow network, this indicator indicates the possibility of scientists reaching the node and can also reflect the city’s ability to serve as an intermediary and transfer station. The measurement model of betweenness centrality is as follows:
where is the betweenness centrality of the city, njk is the number of the shortest paths between node vj and node vk, and njk(i) means the number of the shortest paths passing through node vi between node vj and node vk.
3.3.2. Modified Location Quotient Model
The location quotient is also called the specialization rate; first proposed by Haggett, it was applied to location analysis. The location quotient is a research method used to measure the spatial distribution of a certain regional element and reflect the specialization degree in an industry sector, and position and role of a certain area in high-level areas [53]. The location quotient indicator in this study was mainly used to identify the roles of cities in the growth of Chinese scientists. As most cities are at the periphery or semi-periphery of the Chinese scientists’ flow networks and only a few cities are rich nodes for scientist flow, we chose the top 50 cities in terms of strength centrality for the location quotient analysis. The formula is as follows:
where is the location quotient of city j at stage g, m is the set of the top 50 city nodes of the strength centrality, is the number of scientists of city j at the scientists’ stage g, and is the number of scientists of city j at the scientists’ 6 stages.
From the traditional location quotient model, identifying only the chosen 50 cities is, in reality, inconsistent with the original intention. In other words, the results of only identifying the roles of the top 50 cities among all the 469 cities in terms of strength centrality differ from reality. Thus, learning from the practices of He [22] and Duan [46], we modified the traditional location quotient model.
The higher the proportion of the strength centrality of all the cities for which the strength centrality of the top 50 cities accounts, the more important the role the top 50 cities play in the Chinese scientists’ growth network:
where is the role played by the top 50 cities in terms of strength centrality in a scientist’s growth process; is the strength centrality of city j; is the strength centrality’s total value for all the cities; and α represents the constant items. is the total of the strength centrality of the top 50 cities, and . is the total of the strength centrality of all the cities.
Since the number of cities in which Chinese scientists are distributed at 6 development stages varies greatly, the fewer the number of cities in which the scientists are distributed at a certain stage, the greater the importance of the stage to the city. This point is reflected in the top 50 cities. The larger the proportion of the total number of the scientists in stage g accounted for by the quantity of the scientists in the top 50 cities in stage g, the more important the role played by the top 50 cities in stage g:
where is the role that the top 50 cities play in terms of strength centrality in stage g of a scientist’s growth, is the number of the scientists owned by city j in stage g among the 50 cities, and α represents the constant items. On this basis, we corrected the location quotient model as follows:
where is the corrected location quotient value of city j in stage g, and city j is one of the top 50 cities in terms of strength centrality. After calculation, we obtained a location quotient matrix of , as follows:
According to this matrix, we could accurately identify the functions of the 50 cities by comparing their row and column maximums, as follows. Step 1: We assigned each city an initial role (type) by comparing the maximum of each row. If the location quotient at Bir-C is the largest, it is a foundational type. If the location quotient at Uni-C is the largest, it is an educational type. If the location quotient at Hig-C is the largest, it is a further-study type. If the location quotient at Fir-C is the largest, it is an initial type. If the location quotient at Aca-C is the largest, it is an accomplished type. If the location quotient at Cur-C is the largest, it is a stable type. The purpose of this step was to identify the most important role of the cities. Step 2: We assigned each city an additional role by comparing the maximum of each column. If a city owns the maximum entropy in the column, the corresponding role is attached on the basis of step 1. If the role in this step is the same as that in step 1, a unique role is chosen. If the two roles are not repeated, the role in step 2 should be added on the basis of the role in step 1.
4. Spatial Distribution Characteristics of Chinese Scientists’ Development stages
4.1. Birthplaces Mainly Distributed in Eastern Coastal Areas and Yangtze River Basin
The birthplaces of Chinese scientists are highly concentrated in the eastern coastal areas and the Yangtze River basin, especially in the Yangtze River Delta region (Figure 2a). From the sample, 932 scientists were born in the Yangtze River Delta, accounting for 38.7% of the total. Shanghai ranks first in China. The Bohai Rim region is another concentrated birthplace of Chinese scientists, and Beijing ranks second in China. However, Fuzhou, Quanzhou, Meizhou, Hong Kong, and Guangzhou along the southeast coast are also important birthplaces of scientists. The scientists from the Yangtze River Basin are mainly concentrated in the Chengdu-Chongqing region and the Hubei and Hunan provinces. The scientists’ birthplaces in Western China are mainly distributed in regional metropolises, such as Chongqing and Chengdu, whereas the spatial distribution of the scientists’ birthplaces in Hubei and Hunan provinces are relatively balanced. Relatively few Chinese scientists are born abroad; only 15 scientists in the sample were born abroad. China’s coastal and riverside areas are the most concentrated birthplaces of Chinese scientists, who benefit from the regional advantages of these areas. In these places, good economic conditions provide the necessary material support for the development of Chinese scientists; the atmosphere of attaching importance to the development of science and technology and basic research has prompted the local government to pay more attention to the cultivation of talents.
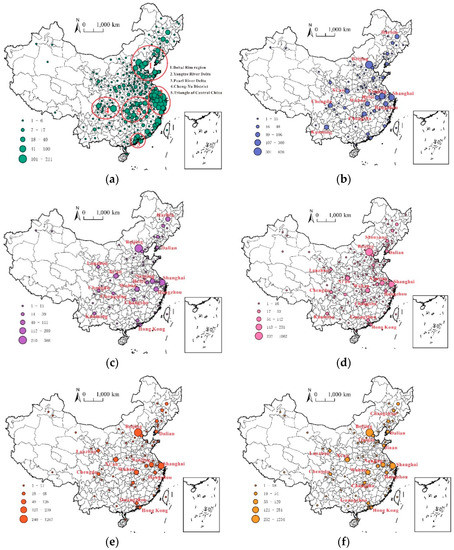
Figure 2.
Spatial distribution of Chinese scientists at all stages of growth in China: (a) birthplace (Bir-C), (b) place of undergraduate graduation (Uni-C), (c) place of highest degree was obtained (Hig-C), (d) first workplace (Fir-C), (e) place where academician title was received (Aca-C), (f) place of current job (Cur-C).
4.2. Cities of Undergraduate Graduation Highly Coupled with Domestic Cities with Rich Resources for Higher Education
Compared with the birthplaces of scientists, the spatial distribution of scientists’ undergraduate graduation cities is more concentrated and highly distributed in cities with concentrated resources of higher education (Figure 2b). The scientists received their bachelor’s degrees in only 82 cities, far fewer than the number of scientists’ birthplaces (218 cities). Beijing, Shanghai, and Nanjing are the major cities for undergraduate graduates, ranking in the top three in the country. The quantity of scientists who received their bachelor’s degree in the top three cities accounts for 50% of the whole sample. The quantity of scientists who received their bachelor’s degree in the top 15 cities accounts for 83.6% of the whole sample. The quantity of scientists who received their bachelor’s degree in the top 30 cities accounts for 95.5% of the whole sample. The data show that scientists have strong selectivity and weak randomness for the city of their undergraduate study mainly because many colleges and universities are located in Beijing, Shanghai, and Nanjing, where the educational resources advantages are outstanding. Xi’an, Chengdu, and Chongqing in Western China; Wuhan and Changsha in Central China; and Harbin, Changchun, and Shenyang in Northeast China have also trained many scientists for New China. In addition, 90 of the 2406 scientists have overseas experience for their undergraduate study; the USA, Russia, and Japan are the main countries where the scientists received their overseas undergraduate education.
4.3. Spatial Distribution of Places Where Highest Degree Obtained is More Concentrated
Scientists attained their highest degree most commonly in places with high-level and high-quality educational resources (Figure 2c). The places in which the Chinese scientists received their highest degree are centrally distributed in cities with national first-class universities like Beijing, Shanghai, Hangzhou, Nanjing, Wuhan, Xi’an, and Harbin. Among the research sample, 586, 209, and 111 scientists received their highest degree in Beijing, Shanghai, and Nanjing, respectively. The scientists who obtained their highest degree in these the cities account for 57.2% of all the scientists. The scientists who obtained their highest degree in the top 15 cities account for 88.7% of the scientists. The scientists who obtained their highest degree in the top 30 cities account for 98.4% of the total scientist sample. The data indicate that the cities where the scientists obtained their highest degree are more spatially concentrated compared with their birthplaces and undergraduate graduation locations. A total of 820 Chinese scientists received their highest degree in international cities—35.4% of the total. Specifically, 348 of these scientists are from the United States, 140 from Russia, 105 from the United Kingdom, 59 from Japan, 57 from Germany, 31 from France, and 13 from Canada. The improvement in academic qualifications enables scientists to increase their attention to their selection of education cities, and the scientists are more inclined to further their studies in top universities or research institutions as far as their majors are concerned [54].
4.4. Workplaces Mainly Distributed in Domestically Developed Cities
The spatial patterns of the scientists’ first workplaces, current workplaces, and the places where they received their academician titles do not vary considerably. All top five cities (in terms of first workplaces, current workplaces, and the places where they received their academician title) are sorted as follows in descending order: Beijing, Shanghai, Nanjing, Xi’an, and Wuhan (Figure 2d–f). Beijing was the first workplace of 1026 Chinese scientists, accounting for 43.5% of the total; it is the current workplace of 1234 Chinese scientists, occupying 51.3% of the total. It is also the place where 1276 Chinese scientists received their academician titles. With its political, economic, and cultural advantages, Beijing has become the first choice when Chinese scientists choose where to work. Harbin, Changchun, Hefei, Hangzhou, Tianjin, Changsha, Chengdu, Guangzhou, Shenyang, Dalian, and Hong Kong are also the main workplaces of Chinese scientists. Not many Chinese scientists choose to work overseas, as only 45 scientists chose overseas cities as their first workplaces. This shows that scientists mostly choose to return to China after completing their studies. Figure 2 shows that a high degree of consistency exists in the spatial pattern of the three major places. The spatial distribution between the current workplaces and the places where scientists attain their academician titles is more consistent. This result shows that Chinese scientists have a certain spatial continuity in their workplaces.
5. Characteristics of the Chinese Scientists’ Flow Network
Through analysis, the Chinese scientists’ flow network assumes the radiation-convergence, with Beijing as the core. However, the size of city nodes and the scientists’ flow among the cities are spatially uneven, and are especially prominent in Beijing, Shanghai, and Nanjing (Figure 3). Capital cities and municipalities directly under the central government in China (such as Wuhan, Xi’an, Hangzhou, Harbin, Tianjin, Chengdu, Changsha, Hefei, Guangzhou, Changchun, Chongqing, and Shenyang), as well as the big cities in Russia, USA, and Japan (such as Moscow, St. Petersburg, Boston, New York, and Tokyo) are the hot spots for the scientists’ spatial migration. The scientists’ flow differences between cities are as follows. The flow frequency for scientists between Beijing and Shanghai, and between Beijing and Nanjing, accounts for a greater proportion in the whole network, whereas little flow of scientists occurs among other cities. These phenomena indicate that the scientists’ spatial migration is more inclined between large cities in China.
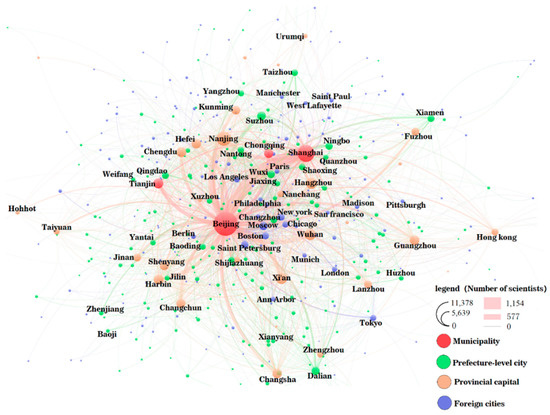
Figure 3.
The flow network of Chinese scientists. The size of the nodes in the graph is proportional to the strength centrality of the nodes. In other words, the more Chinese scientists arrive or flow out of the city, the larger the node; the thickness of the line is proportional to the flow of the Chinese scientists; the thicker the line, the higher the flow.
5.1. Network Node Characteristics
5.1.1. Degree Centrality
The degree centrality of China’s cities varies considerably (Figure 4a). In China’s domestic cities, the regions with a high degree centrality are mainly distributed in the Beijing–Tianjin–Hebei urban agglomeration centered on Beijing, the Wuhan-centered urban agglomeration in the middle reaches of the Yangtze River, the Chengdu–Chongqing urban agglomeration (with dual cores in Chengdu and Chongqing), and the Shanghai-centered urban agglomeration in the Yangtze River Delta. The top cities in terms of degree centrality are, in descending order, Beijing, Shanghai, and Nanjing, which shows that these cities are the focus of the spatial migration of scientists’ development paths. Among international cities, 192 foreign cities are related to Chinese scientists’ growth. These cities are concentrated in Western Europe, North America, and Japan. To be specific, 56 cities are related to Chinese scientists’ development in the United States, which ranks first. Secondly, 27 cities are located in Germany, then 23 cities in the United Kingdom, 17 cities in Japan, 13 cities in France, 6 cities in Canada, 4 cities in Russia, 4 cities in Switzerland, and 4 cities in Belgium (Figure 5). The top 10 foreign cities in terms of degree centrality are, in descending order, Moscow, New York, Tokyo, Boston, St. Petersburg, Chicago, Los Angeles, Paris, London, and Ann Arbor.
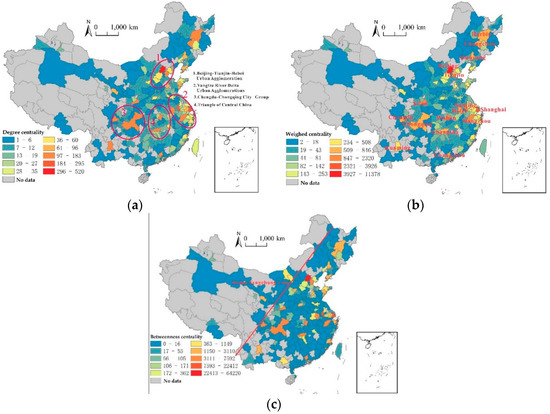
Figure 4.
Spatial distribution of (a) degree centrality, (b) strength centrality, and (c) betweenness centrality in China.
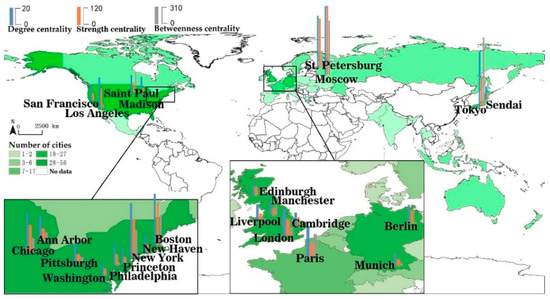
Figure 5.
Spatial distribution of degree centrality, strength centrality, and betweenness centrality in foreign countries. To display the main information, the figure only lists the foreign cities with prominent degree, strength, and betweenness centralities.
5.1.2. Strength Centrality
The strength centrality of Chinese scientists’ flow network follows the Pareto principle. The average strength centrality of the overall network is 96.49. The cities whose strength centrality is higher than 96.49 are called high-strength cities, and cities whose strength centrality is lower than 96.49 are labelled low-strength cities. According to the standards, there are 57 high-strength cities, which account for 12.5% of the total number of cities. This illustrates that only a few cities play a significant role in the Chinese scientists’ development process, whereas most cities are at the edge of the network. In other words, differences exist in the roles played by different cities in the flow network of Chinese scientists (Figure 4b).
The spatial distribution of the strength centrality of Chinese cities is unbalanced and the difference between east and west is obvious. The eastern parts of China, especially the cities in the eastern coastal areas, have relatively high strength centrality, but the cities in Western China have low strength centrality. Among the cities in China, the “one super and multi-strong” spatial pattern of strength centrality is particularly prominent. The cities with higher strength centrality are mainly provincial capitals or municipalities. Beijing’s strength centrality is 11,378, which is about three times that of Shanghai (3926), followed by those of Nanjing (2320), Wuhan (1210), and Xi’an (1156). It shows that Chinese scientists are moving more frequently between these Chinese cities. Among the international cities, foreign cities with higher strength centrality are mainly concentrated in the United States, Russia, Japan, the United Kingdom, Germany, and France (Figure 5). The top 10 foreign cities in terms of strength centrality include Moscow, St. Petersburg, Boston, New York, Tokyo, Chicago, Los Angeles, London, Paris, and Berlin.
5.1.3. Betweenness Centrality
At the domestic urban level, the cities with high betweenness centrality are scattered, and these cities are mainly distributed in the southeastern part of the Hu Huanyong Line (Figure 4c). This distribution indicates that a certain coupling exists between the Chinese scientists’ development path and China’s population distribution. The top 10 domestic cities in terms of betweenness centrality are, in descending order, Beijing, Shanghai, Nanjing, Hangzhou, Wuhan, Chongqing, Taizhou, Fuzhou, Changsha, and Wuxi. These cities play a role as a “bridge” in the Chinese scientists’ flow network; scientists need to move from these cities to other cities. These cities share some common characteristics. Firstly, these cities are more economically developed than other regions and attach importance to education. Thus, their education level is ahead of the country or the region in which the city is located, so these cities become the main birthplaces of Chinese scientists. Secondly, Chinese colleges and universities gather in these cities, and the number of colleges and universities in these cities is far greater than in other regions. High-quality educational resources make these cities the main educational places for Chinese scientists. Thirdly, many manufacturing enterprises and scientific research institutions are located in these cities, which can provide necessary research sites for Chinese scientists, creating important places for developing Chinese scientists.
Concerning international cities, the United States, Russia, Japan, the United Kingdom, and Germany are the gathering places with high betweenness centrality (Figure 5). The top 100 overseas cities in terms of betweenness centrality are Moscow, New York, St. Petersburg, Boston, Ann Arbor, Tokyo, Chicago, Los Angeles, Paris, Edinburgh, Manchester, London, and Sao Paulo. The quantity and quality of colleges and universities in these foreign cities surpass those of other regions with absolute superiority. With high-quality educational resources, these cities attract many Chinese scientists to further their studies, becoming an important bridge for the flow of Chinese scientists.
5.2. Hierarchical Structure
Hierarchical clustering in the Pajek block model analysis was adopted. According to strength centrality and the obtained hierarchical file, the Chinese scientists’ flow network was divided into four levels, and the network hierarchy levels are pyramid-shaped (Table 1).

Table 1.
Statistical characteristics of the hierarchical structure of the flow network of Chinese scientists.
The cities at the first level are Beijing, Shanghai, and Nanjing, which are at the core of the whole network. Beijing is the major birthplace for the Chinese scientists and also their primary place of education and workplace, playing an irreplaceable role in the development of Chinese scientists. In the research sample, most scientists are born in Shanghai. Shanghai and Nanjing rank in second and third, respectively, in terms of the number of Chinese scientists, as places for education and work. These three cities have become important nodes for the scientists’ flow and are at the top of the entire network pyramid.
The second level contains 14 cities on the second level—13 domestic cities and one foreign city: Wuhan, Xi’an, Hangzhou, Harbin, Tianjin, Chengdu, Changsha, Hefei, Changchun, Chongqing, Shenyang, Suzhou, Kunming, and Moscow in Russia. The domestic cities at the second level are the major birthplaces of the Chinese scientists. They also function by educating and employing Chinese scientists, but they are inferior to Beijing, Shanghai, and Nanjing in this regard, whereas the foreign cities at the second level are mainly the education places of Chinese scientists.
The third level includes 32 cities, mainly domestic provincial capitals, such as Guangzhou, Fuzhou, Zhengzhou, Taiyuan, Nanchang, Jinan, Lanzhou, and Shijiazhuang. Some regional central cities are included in this level, such as Dalian, Yangzhou, Nantong, Jiaxing, Qingdao, Baoding, Xiamen, Yantai, Xuzhou, Changzhou, Ningbo, Wuxi, Shaoxing, Tangshan, and Taizhou, as well as international regional cities (even world cities), such as Tokyo, London, New York, Hong Kong, Berlin, St. Petersburg, Los Angeles, Chicago, and Boston. Every index of the structural characteristics of this level is close to the mean value of the network. The provincial capital cities in China are also the birthplaces, education places, and workplaces of the Chinese scientists, but the regional central cities are mainly the birthplaces of the scientists. Conversely, the overseas cities are major education places for the Chinese scientists.
The number of cities at the fourth level is the highest, consisting of 420 cities. Compared with the importance of the cities at other levels, the cities in the fourth level are at the edge of the whole network. The economic development level and education level of science and culture in these cities are less developed than those in the cities at other levels. As a result, the cities at the fourth level are either the major birthplaces of the Chinese scientists, or the major education places or workplaces of the Chinese scientists. Every index of the network’s structural characteristics for the cities at the fourth level is mostly lower than the average level of the whole network.
The differentiated files generated by Pajek were output to VOSviewer in 2D format, and the hierarchical structure of the Chinese scientists’ flow network was drawn (Figure 6). The size of the nodes in the figure is proportional to the intensity of the nodes, and the size of the edge is positively correlated with the number of scientists who move between the two cities. Figure 6 shows that, for the hierarchical structure of Chinese scientists’ flow network, the Chinese scientists’ flow network develops into a core–periphery grade progressive form, which is divided into three major urban groups: the core area, semi-periphery area, and periphery area.
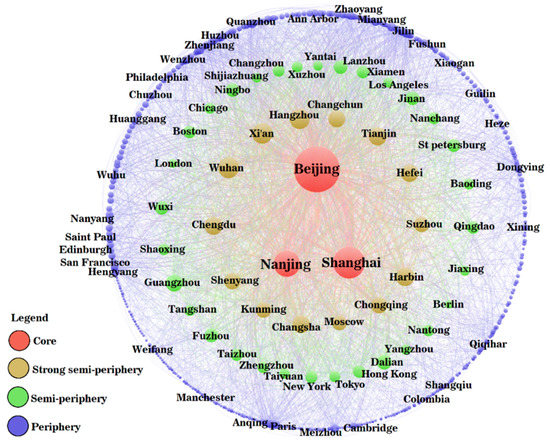
Figure 6.
The hierarchical structure of the flow network of Chinese scientists.
The core area contains the cities in the first level. These cities are the hub nodes of the whole Chinese scientists’ flow network. Beijing, Shanghai, and Nanjing are located in the core area of the Chinese scientists’ flow network. These three cities have many edges, and their average centrality is 355. Their average strength centrality is 5847.67. These three cities are rich nodes in the whole network and are mutually connected. The in-degree from Shanghai to Beijing is 1072, ranking first among all nodes. The in-degree from Nanjing to Beijing is 572, ranking second. Thus, these cities have the obvious characteristics of a triangulated structure.
The semi-periphery area mainly consists of the cities at the second and third levels, including 14 cities at the second level and 32 cities at the third level. The semi-periphery area is composed of 46 cities, which play a subordinate role in the innovation network. Less scientists flow between these cities and the core cities, but the cities in the semi-periphery area may have a low tie strength with the cities in the periphery area. The network characteristics of the semi-periphery area, such as the network density and average strength centrality, are in the middle of the whole network. Some cities in the semi-periphery area serve as the output place of the Chinese scientists and have a relatively high out-degree of the node; these cities include Suzhou, Ningbo, and Wuxi. Some cities in the semi-periphery area are rich in higher learning institutions and lead in educational level, so they attract some Chinese scientists to further their studies, including Moscow, Harbin, and Hefei. Some cities in the semi-periphery area serve as the education places and workplaces of the Chinese scientists, including Wuhan, Changsha, and Changchun.
Most cities (numbering 420), are located in the periphery area of the Chinese scientists’ flow network and belong to the fourth level. Only a few scientists flow in the cities in the peripheral areas, and these cities play a subsidiary role in the network. The network density of the peripheral area is 0.03, its average degree centrality is 7.35, and its average strength centrality is 20.30. These data indicate that the cities in the peripheral area are less connected. The connection between these peripheral cities and the core cities is also limited.
5.3. Node Role Recognition
The modified location quotient model was used to determine the role of the top 50 cities with strength centrality in the Chinese scientists’ flow network. The results show that the functions and roles that different cities assume in the scientists’ flow network are different. Only Beijing has two features, accomplished and stable, and other cities only play a single role. We also found that the foundational-, educational-, further study-, initial-, accomplished-, and stable-type cities show a decreasing trend. This result illustrates that scientists are becoming more selective about their cities. The scientists are stricter about the level of development of the city in which they choose to study and work. Therefore, only some of the cities can meet the scientists’ demands for development, showing that high-end talent is highly spatially concentrated (Table 2).
Table 2.
Role recognition of the top 50 cities with strength centrality.
Beijing is a unique city, classified as both accomplished and stable, so it attracts considerable scientific research talent and shows the talent agglomeration effect. Thus, scientists tend to acquire academic achievements in Beijing. Many colleges and universities, as well as scientific research institutes, are located in Beijing. Thus, Beijing remains the scientists’ favorite place to work and research and is the scientists’ most important stable type city. Hong Kong has many high-level international universities responsible for training Chinese scientific and technological talent. Hong Kong is also an important place where the Chinese scientists acquire academic achievements. Guangzhou and Qingdao are stable type cities. These two cities have many colleges and universities, as well as the branches of China’s top scientific research institutions, for example, the Guangzhou Energy Research Institute of Chinese Academy of Sciences, the Qingdao Institute of Bioenergy, and the Process of Chinese Academy of Sciences. Guangzhou and Qingdao simultaneously pay scientific researchers higher salaries. Zhengzhou, Dalian, Changchun, Lanzhou, and Shenyang are initial type cities and are important cities in which the Chinese scientists receive their undergraduate education. Many scientists choose to work locally after completing their undergraduate education, which suggests that the employment threshold of these cities is lower than in stable type cities.
The further-study type cities are foreign cities, except for Harbin, which shows that the scientists are more inclined to pursue advanced studies in world-class universities or institutions. The reason for the path dependence in Harbin—an important further-study type city—is largely the high-level universities in Harbin, such as the Harbin Institute of Technology and the Harbin Engineering University. Educational cities (Taiyuan, Xi’an, Nanchang, Changsha, Wuhan, Shanghai, Tianjin, Chengdu, Jinan, Nanjing, Xiamen, Hefei, Hangzhou, and Kunming) have high-quality higher education resources in their regions and offer the scientists’ elementary education. The cities that play the foundational type role are mostly concentrated in the southeast coast region of China, especially in the Yangtze River Delta. These cities have a solid economic foundation and a strong educational atmosphere, which lay a good foundation for the growth of scientists.
6. Mechanism Driving the Chinese Scientists’ Flow Network
The spatial migration of the Chinese scientists during their different development stages can be abstracted as the flow network of the scientists in a geographic projection, but the spatial migration of Chinese scientists is a phenomenon of population movement. The relevant theories of population flow, like push and pull theory [55], human capital theory [56], dual labor market theory [57], and the age-mobility theory model [58], have some applicability for explaining the driving mechanism of the Chinese scientists’ flow network, which is unusual due to the uniqueness of the scientist groups. At the national, regional, and personal scales, we analyzed the dynamic mechanism of each scientist’s individual spatial migration and flow network from the perspectives of national policy, regional economic level, education level, and individual traits.
Individual traits are the intrinsic driving force that promotes the evolution of the flow network of Chinese scientists. These scientists have the spirit to constantly pursue science and truth, which promotes their migration to science centers. This strong sense of social responsibility to serve the country and the people can also lead to changes in their geographic space [59]. Scientists migrate in space migration by their own decisions, but they also consider the economy, society, culture, and politics in their decisions [60]. An individual’s consideration of economic factors mainly includes economic income [61] and employment opportunities [62]. An individual’s consideration of social factors mainly includes the lifestyle and quality of life for themselves and their relatives [63], as well as the teaching and guidance of family members, teachers, and academic predecessors. The personal character formed under regional culture and social emotions affects the flow of scientists [64]. For example, after achieving self-worth and due to the personal feelings of repaying one’s hometown and country, some scientists return to their hometown or return from overseas after receiving their highest degree.
The differences in the levels of regional economic development create the external thrust of developing areas and the adsorption capacity of developed regions. The economic potential difference between China and the developed countries in the world, and that between China’s regions, is an important factor in the spatial migration of scientists. The world’s major economically developed countries, such as the United States, Russia, Japan, the United Kingdom, France, and Germany, have a great attraction for scientists. The eastern coastal areas of China, especially the Yangtze River Delta, the Bohai Rim, and the Pearl River Delta, are the areas in which China’s economically developed cities are concentrated and the growth centers of China’s economy. These areas are more attractive to scientists as a result of more employment opportunities and higher salary levels. In contrast, in areas with low regional economic levels, employment opportunities and wages are relatively low, so such regions generate an external thrust for talent to become a place that scientists are more willing to leave [65].
Educational attraction is a strong force driving the spatial migration of Chinese scientists. The cities with first-class educational resources, good academic atmosphere, and close ties with other cities at home and abroad strongly appeal to scientists who seek self-development [48]. For example, Beijing is the place in which 626 (26%) scientists completed their undergraduate studies and 586 (24.4%) scientists received their highest degree. In Shanghai, 300 (12.5%) scientists received their bachelor’s degree and 209 (8.7%) obtained their highest degree. These data are closely related with the large number of high-level and high-quality institutions of higher education in these cities, so these two cities have become the core cities in the whole flow network of Chinese scientists.
Changes in policy factors are external drivers of the spatial migration of Chinese scientists. Changes in the pattern of international relationships and changes in relationships between China and other countries have impacted the spatial migration of scientists to some extent. The Soviet Union was the destination for many Chinese scientists to study abroad in the early days of the founding of New China, but after the Sino–Soviet split, Chinese scientists’ study destinations have gradually shifted to Europe and the United States. The adjustment of domestic policies, such as changes in scientific research institutions, the adjustment of administrative positions, the transfer of jobs, and the allocation and employment, are major national policy factors affecting the spatial migration of scientists [66]. Compared with the period after the founding of New China, the scientists born before the founding of New China were less common in the eastern coastal areas, and this was linked to the wars being mainly concentrated in the eastern coastal areas. The War of Resistance against Japan facilitated the internal movement of colleges and universities, so the inland colleges and universities cultivated a large amount of talent. For example, over 170 academicians have graduated from Southwest Associated University, which is located in Kunming. Since the reform and opening up of China, the Chinese government has played a positive role in the migration of scientists through the Western Development policy guidance, the revitalization of the old industrial bases in Northeast China, and the development of the central region.
Different driving forces exhibit a nonlinear interaction in the evolution of the scientists’ spatial migration and flow network. Individual traits are the intrinsic driving force behind the evolution of Chinese scientists’ flow networks, but the individual decision-making is partly influenced by regional economic and educational levels. The regional economic and education levels are the external forces driving the evolution of the entire network. These two external drivers are affected by national policies and top-level design. The international environment and national policy are exogenous variables affecting the scientists’ spatial migration, which guide the flow of the scientists to a certain extent and affect the development of the regional economy, education, and culture. The regional economic development, education, and culture levels are also important factors for the formulation of a national talent strategy.
7. Discussion and Conclusions
Based on the spatial information database of 2406 Chinese scientists represented by academicians of the CAS and CAE, we adopted spatial statistics, complex network analysis, and a modified location quotient model to reveal the spatial distribution characteristics of Chinese scientists at each development stage to depict the Chinese scientists’ flow network, and to analyze the driving mechanisms behind the flow of Chinese scientists. The conclusions are as follows: For spatial distribution, the growth space of Chinese scientists is constantly concentrating. The Chinese scientists’ birthplaces are highly concentrated in eastern coastal areas and the Yangtze River Basin, and the Yangtze River Delta region is particularly prominent. The undergraduate graduation cities are highly coupled with domestic cities with rich higher education resources, and higher education institutions are highly concentrated in certain cities. The places where scientists attain their highest degrees are more concentrated in cities with an agglomeration of high-level education resources, both in China and globally. The first workplaces, current workplaces, and the places where scientists attain their academician title are highly consistent and mainly distributed in China’s developed cities. In terms of network characteristics, the spatial heterogeneity of Chinese scientists’ development is obvious. Only a few cities like Beijing have larger degree centrality values for each node, as well as higher strength centrality and betweenness centrality, which conforms to the Pareto principle. The network hierarchy is pyramid-shaped, with a prominent core–periphery structure. Beijing, Shanghai, and Nanjing are dominant in the core area of the Chinese scientists’ flow network, and most cities are located in the semi-marginal or periphery areas of the network. The roles that the cities play in the Chinese scientists’ flow network vary considerably. Only Beijing has a dual role, and all other cities play a single role. With the growth in the number of scientists, increasingly fewer cities can meet their demands for development. As a result, high-end talent is highly concentrated in space. Regarding the driving mechanisms, the Chinese scientists’ flow network is influenced by individual traits, regional economic levels, regional education levels, and policy orientation at the national, regional, and individual scales. Individual traits are the intrinsic force driving the evolution of Chinese scientists’ flow networks, and the regional economic and education levels are the external driving forces of the evolution of the entire network. The international environment and national policies are exogenous variables affecting the spatial migration of the scientists. The driving forces are closely related to each other, and the flow network of Chinese scientists is the result of the combined effect of the driving forces.
In the current situation of talent information shortage in China and no clear definition of talent, spatial analysis has become an important perspective and method of talent and talent geography research [12]. Taking academicians of the Chinese Academy of Sciences and the Chinese Academy of Engineering as representatives of Chinese scientists, this study serves as supplement to the current research on college students [13], overseas students [14] and faculty members [67] as talent samples. Li et al. found that there was uneven spatial distribution of academicians of the Chinese Academy of Sciences at a provincial scale [34]. In addition, the present study further refines the spatial perspective of research on Chinese scientists to the geographic unit of the city, showing the urban flow network of scientists. In addition, previous studies have only revealed that Chinese scientists are mainly concentrated in economically developed provinces, while the present study shows that the Chinese scientists’ flow tends to be more central to the big cities such as Beijing, Shanghai, Nanjing. The disequilibrium of the spatial distribution and flow of talents in China is not only manifested at a provincial scale but also more reflected in the first-tier big cities and other cities. This study finds that spatial differences in Chinese scientists’ flow largely depend on the spatial differences of urban economy and education level, and their causal relationship needs to be further explored. Moreover, this study also identifies the role of cities in the flow of scientists.
In view of the new trend and new problems of spatial distribution and flow of talents under the background of regional science and technology competition, as well as the competition for talented people, this study puts forward some corresponding suggestions from the national, urban and individual levels.
In terms of central government, the Chinese scientists’ flow network has an obvious core-periphery structure: scientists flow mainly to several big cities. The serious disequilibrium of talent distribution among Chinese cities has become an important factor hindering the coordinated development of regions. Therefore, it is necessary to regulate the distribution and flow of talents from the central government level. As a result, the state should establish a cross-regional coordination mechanism to improve the spatial distribution of talents. Firstly, at the policy level, appropriate support and preference should be given to the talent "desert areas" and establish a regional talent sharing mechanism. Secondly, the interregional higher education resources should be redistributed to a certain extent, especially to the edge of the talent flow network, so as to improve the spatial distribution and allocation of higher education resources. Thirdly, the income gap between scientists in eastern and western regions, and large and small cities should be narrowed, and a more flexible and diverse salary system suitable for scientists should be established. Finally, the state should implement a more open talent policy and build a good social atmosphere to attract talents. In addition, efforts should be intensified to encourage and fund students and teachers to study and academic exchange abroad, so as to take various measures to attract the brain backflow through various channels while preventing brain drain.
For city governments, this study reveals that cities at different levels in China occupy different positions in the scientist flow network, so cities should formulate corresponding talent policies according to local conditions. The core area of the scientists’ flow network should exert the effect of talent gathering, placing stress on promoting the effect of talents. The periphery of the network should focus on economic development, salary, employment and public services to create an attractive internal environment for scientists, placing stress on attracting talents. Specifically, the core cities of the flow network of Chinese scientists, such as Beijing, Shanghai and Nanjing, can give full play to the advantages of high-level talent resources, drive innovation by talent, and drive development by innovation. They will accelerate the transformation of talent advantages into core competitiveness of urban functions, fully release the new momentum of talent in leading the high-quality development of cities, and accelerate the construction of global science and technology innovation centers. Cities on the periphery of the flow network of Chinese scientists in the “scramble for talents” have natural disadvantages in their economic and educational levels. They should make full use of their own characteristic industries to introduce leading talents and give full play to the siphon effect of high-end talents with the support of national policies, which supposes that there is always a whole R&D team behind a high-end talent. In addition, those cities should take connecting cities with high betweenness centrality as a breakthrough to enhance the status of the city in the Chinese scientists’ flow network.
Last but not least, the spatial development path of Chinese scientists has provided valuable experience for young scholars. For example, a large number of scientists have studied in Moscow, Los Angeles, Boston, St. Petersburg, London and other cities. This shows that academic exchange with world-class universities with concentrated innovative resources is one of the important ways for the successful development of Chinese scientists. However, in China, Beijing has become the most important place for Chinese scientists to achieve success, which also indicates that Beijing is the main gathering place for Chinese higher education and innovation resources. Although the successful experiences of Chinese scientists cannot be simply copied, we can still see the general rules of Chinese scientists’ success. We read a significant number of biographies of Chinese scientists in the process of sorting the research materials, which showcase that the spirit of Chinese scientists in repaying the motherland, serving society and pursuing science is also a precious spiritual wealth left to contemporary young scholars.
The scientists’ flow network, based on the characterization of the individual flow of academicians of the CAS and CAE, provides a new perspective to focus on the research of different types of talents. In order to have a more comprehensive understanding of the flow network of Chinese scientists, the author may focus on the following aspects in future research. First, further expand the sample size and include more talent groups, such as the National Recruitment Program of Domestic Experts National, the Recruitment Program of Global Experts National, Chang Jiang Scholars Program, the National Science Fund for Distinguished Young Scholars, and famous scientific researchers in higher education. Second, depict Chinese scientists’ networks of collaboration and connections. Research the scientist’s cooperation network by means of papers, patents and research projects, and build the connection network by analyzing the relationship between scientists and their mentors. Third, study the driving effect of scientists’ flow network or network of human connections on cooperative network of scientists by using the Gravity Model or Quadratic Assignment Procedure (QAP). Fourth, the influences of individual traits, regional economic levels, regional education levels, and national policies on the Chinese scientists’ flow network need to be quantitatively analyzed.
Author Contributions
W.S. developed the original idea for this study, revised the manuscript, and supervised the research project. W.Y. performed the data analysis and original draft preparation under the supervision of the corresponding authors. D.D. directed the research comments and provided quality assurance.
Funding
This work was funded by the National Natural Science Foundation of China, grant number 41571123 and 41901139, Strategic Priority Research Program of Chinese Academy of Sciences, grant number XDA20100311, and the Philosophical and Social Science Foundation of Shanghai, grant number 2018EJL003.
Acknowledgments
The authors would like to thank the four anonymous reviewers for their comments and suggestions.
Conflicts of Interest
The authors declare no conflict of interest.
References
- Dirks, S.; Gurdgiev, C.; Keeling, M. Smarter cities for smarter growth. IBM Glob. Bus. Serv. 2010, 1, 24–31. [Google Scholar]
- Cooke, P. Regional development in the knowledge-based economy: The construction of advantage. J. Technol. Transf. 2005, 31, 5–15. [Google Scholar] [CrossRef]
- Cerna, L. Immigration Policies and the Global Competition for Talent; Palgrave Macmillan: London, UK, 2016. [Google Scholar]
- Cao, C. China’s brain drain at the high end: Why government policies have failed to attract first-rate academics to return. Asian Popul. Stud. 2008, 4, 331–345. [Google Scholar] [CrossRef]
- Porter, M.E. The Competitive Advantage of Nations; Harvard Business School Management Programs Cambridge: Boston, MA, USA, 1993. [Google Scholar]
- Sun, Y.T.; Guo, R.G. Shifting of world’s scientific activity center and transnational migration of scientists. Stud. Sci. Sci. 2018, 36, 1162–1169. [Google Scholar]
- Cole, J.; Cole, S. The Ortega hypothesis: Citation analysis suggests that only a few scientists contribute to scientific progress. Science 1972, 4059, 368–375. [Google Scholar] [CrossRef]
- Saxenian, A. Brain Circulation and Capitalist Dynamics: Chinese Chipmaking and the Silicon Valley-Hsinchu-Shanghai Triangle; Princeton University Press: Princeton, NJ, USA, 2005. [Google Scholar]
- Li, X.M. Roles of scientist and their characteristics. J. Shandong Univ. Sci. Technol. Sci. 2009, 11, 1–12. [Google Scholar]
- Cao, C. China’s Scientific Elite; Routledge: London, UK, 2004. [Google Scholar]
- Yuasa, M. The shifting center of scientific activity in the West. Jpn. Stud. Hist. Sci. 1962, 1, 57–75. [Google Scholar]
- Zhang, B. Research on domestic high—Level talents: Theoretical perspective and latest development. Stud. Sci. Sci. 2018, 36, 1414–1420. [Google Scholar]
- Lacina, J.G. Preparing international students for a successful social experience in higher education. New Dir. High. Educ. 2002, 117, 21–28. [Google Scholar] [CrossRef]
- Abbott, M.; Doucouliagos, C. Competition and efficiency: Overseas students and technical efficiency in Australian and New Zealand universities. Educ. Econ. 2009, 17, 31–57. [Google Scholar] [CrossRef]
- Kaur, B.; Singh, J.M.; Garg, B.R.; Singh, J.; Singh, S. Causes and impact of labour migration: A case study of Punjab agriculture. Agric. Econ. Res. Rev. 2011, 24, 459–466. [Google Scholar]
- Liu, Y. Methods, Technology, and Application of Resource Monitoring of International Scientific Cooperation Based on Data Mining; Science Press: Beijing, China, 2013. [Google Scholar]
- Liu, Y.; Yang, F.J. An analysis of funding characteristics of China’s high—Level S & T talent program. Sci. Res. Manag. 2017, 38, 610–622. [Google Scholar]
- Li, F.; Miao, Y.; Yang, C. How do alumni faculty behave in research collaboration? An analysis of Chang Jiang Scholars in China. Res. Policy 2015, 44, 438–450. [Google Scholar] [CrossRef]
- Zhou, Y.; Guo, Y.; Liu, Y. High-level talent flow and its influence on regional unbalanced development in China. Appl. Geogr. 2018, 91, 89–98. [Google Scholar] [CrossRef]
- Batty, M. The geography of scientific citation. Environ. Plan. A 2003, 35, 761–765. [Google Scholar] [CrossRef]
- Basu, A. Using ISI’s’ Highly Cited Researchers’ to obtain a country level indicator of citation excellence. Scientometrics 2006, 68, 361–375. [Google Scholar] [CrossRef]
- He, S.H. Movement and Formation Mechanism of World Science Center: Based on the Analysis of Nobel Laureates; East China Normal University: Shanghai, China, 2019. [Google Scholar]
- Ren, Q.; Zhu, H.; Li, P. Geographical distribution and regional differentiation of female talents in modern and contemporary China. Acta Geogr. Sin. 2007, 62, 211–220. [Google Scholar]
- Nie, J.; Liu, H. Spatial pattern and the resulting characteristics of talent flows in China. Sci. Geogr. Sin. 2019, 38, 1979–1987. [Google Scholar]
- Zhang, J.; Du, D.; Jiang, H. Regional differences of S & T talents in Jiangsu province. Sci. Geogr. Sin. 2011, 31, 378–384. [Google Scholar]
- Zhang, P.; Zhao, Y.; Ma, Y. Intellectual resources development and regional competitiveness of northeast China. Sci. Geogr. Sin. 2003, 23, 513–518. [Google Scholar]
- Hunter, R.S.; Oswald, A.J.; Charlton, B.G. The elite brain drain. Econ. J. 2009, 119, F231–F251. [Google Scholar] [CrossRef]
- Zarifa, D.; Walters, D. Revisiting Canada’s brain drain: Evidence from the 2000 cohort of Canadian university graduates. Can. Public Policy 2008, 34, 305–319. [Google Scholar] [CrossRef]
- Wang, X.; Mao, W.; Wang, C.; Peng, L.; Hou, H. Chinese elite brain drain to USA: An investigation of 100 United States national universities. Scientometrics 2013, 97, 37–46. [Google Scholar] [CrossRef]
- Saxenian, A. BRAIN CIRCULATION. How high-skill immigration makes everyone better off. Brook. Rev. 2002, 20, 28–31. [Google Scholar] [CrossRef]
- Mulec, B. Brain Talent Circulation: A New Aim for Countries Connecting with Diasporas. DVE Domov. Homel. 2011, 33, 109–122. [Google Scholar]
- OCDE, O. International Migration Outlook 2016; OECD Publishing: Paris, France, 2016. [Google Scholar]
- Huang, K.G.; Ertug, G. Mobility, retention and productivity of genomics scientists in the United States. Nat. Biotechnol. 2014, 32, 953. [Google Scholar] [CrossRef]
- Li, R.; Wu, D.; Bao, J. Evolution of temporal and spatial pattern and driving mechanisms of agglomerative growth of senior science talents: A case study of academicians of CAS. Prog. Geogr. 2013, 32, 1123–1138. [Google Scholar]
- Luo, S.; Wang, A.; Gao, R. Analyses of factors of high-level falents’ migration and significance of establishing anti-selection mechanisms among regions. Sci. Geogr. Sin. 2009, 29, 779–786. [Google Scholar]
- Cowling, M.; Lee, N. How entrepreneurship, culture and universities influence the geographical distribution of UK talent and city growth. J. Manag. Dev. 2017, 36, 178–195. [Google Scholar] [CrossRef]
- Gao, X.; Fan, W.; Leng, S. Young scientist fund of the National natural science foundation of China in geography. Prog. Geogr. 2018, 37, 174–182. [Google Scholar]
- Appelt, S.; Van Beuzekom, B.; Galindo-Rueda, F.; De Pinho, R. Which Factors Influence the International Mobility of Research Scientists? Elsevier: Amsterdam, The Netherlands, 2015; pp. 177–213. [Google Scholar]
- Van Bouwel, L.; Lykogianni, E.; Veugelers, R. Mobility of European Researchers to the Us: Student Mobility vs. Researcher Mobility; Katholieke Univer-siteit Leuven: Leuven, Belgium, 2011. [Google Scholar]
- Keller, W. Geographic localization of international technology diffusion. Am. Econ. Rev. 2002, 92, 120–142. [Google Scholar] [CrossRef]
- Gaulé, P. Who comes back and when? Return migration decisions of academic scientists. Econ. Lett. 2014, 124, 461–464. [Google Scholar] [CrossRef]
- Conchi, S.; Michels, C. An analysis of Germany, Austria, France and Great Britain; Fraunhofer ISI: Karlsruhe, Germany, 2014. [Google Scholar]
- Fallick, B.; Fleischman, C.A.; Rebitzer, J.B. Job-hopping in Silicon Valley: Some evidence concerning the microfoundations of a high-technology cluster. Rev. Econ. Stat. 2006, 88, 472–481. [Google Scholar] [CrossRef]
- Saxenian, A. Silicon Valley’s new immigrant high-growth entrepreneurs. Econ. Dev. Q. 2002, 16, 20–31. [Google Scholar] [CrossRef]
- Walz, U. Innovation, foreign direct investment and growth. Economica 1997, 64, 63–79. [Google Scholar] [CrossRef]
- Duan, D.; Du, D.; Gui, Q. The geography of Chinese entrepreneurial development. Hum. Geogr. 2018, 33, 102–112. [Google Scholar]
- Sandström, U. Combining curriculum vitae and bibliometric analysis: Mobility, gender and research performance. Res. Eval. 2009, 18, 135–142. [Google Scholar] [CrossRef]
- Duan, D.; Liu, C.; Du, D. Spatial dependency of bus-line distribution based on bipartite network: A case study of Beijing city. Acta Geogr. Sin. 2016, 71, 2185–2198. [Google Scholar]
- Sen, P.; Dasgupta, S.; Chatterjee, A.; Sreeram, P.A.; Mukherjee, G.; Manna, S.S. Small-world properties of the Indian railway network. Phys. Rev. E 2003, 67, 36106. [Google Scholar] [CrossRef]
- Bastian, M.; Heymann, S.; Jacomy, M. Gephi: An open source software for exploring and manipulating networks. In Proceedings of the Third International AAAI Conference on Weblogs and Social Media, San Jose, CA, USA, 17–20 May 2009. [Google Scholar]
- Batagelj, V.; Mrvar, A. Pajek-program for large network analysis. Connections 1998, 21, 47–57. [Google Scholar]
- Van Eck, N.J.; Waltman, L. Text mining and visualization using VOSviewer. arXiv 2011, arXiv:1109.2058. [Google Scholar]
- Isserman, A.M. The location quotient approach to estimating regional economic impacts. J. Am. Inst. Plan. 1977, 43, 33–41. [Google Scholar] [CrossRef]
- Wu, D.; Liu, C.; Gu, S. Comparative analysis of senior scientific talents and senior technological talents-based on the case study of CAS and CAE members. Chin. Soft Sci. 2005, 8, 70–75. [Google Scholar]
- Lee, E.S. A theory of migration. Demography 1966, 3, 47–57. [Google Scholar] [CrossRef]
- Schultz, T.W. Investment in human capital. Am. Econ. Rev. 1961, 51, 1–17. [Google Scholar]
- Doeringer, P.B.; Piore, M.J. Internal Labor Markets and Manpower Analysis; ME Sharpe: New York, NY, USA, 1985. [Google Scholar]
- Rogers, A. Model migration schedules: An application using data for the Soviet Union. Can. Stud. Popul. 1978, 5, 85–96. [Google Scholar] [CrossRef]
- Trajtenberg, M.; Henderson, R.; Jaffe, A. University versus corporate patents: A window on the basicness of invention. Econ. Innov. New Technol. 1997, 5, 19–50. [Google Scholar] [CrossRef]
- Favell, A.; Feldblum, M.; Smith, M.P. The human face of global mobility: A research agenda. Society 2007, 44, 15–25. [Google Scholar] [CrossRef]
- Liu, Y.; Shen, J. Spatial patterns and determinants of skilled internal migration in China, 2000–2005. Pap. Reg. Sci. 2014, 93, 749–771. [Google Scholar] [CrossRef]
- Zhang, B.; Ding, J. Spatial distribution and change trend of high-level talent in China. J. Arid Land Resour. Environ. 2019, 33, 32–36. [Google Scholar]
- Dai, Y.; Kong, D.; Liu, S. Returnee talent and corporate investment: Evidence from China. Eur. Account. Rev. 2018, 27, 313–337. [Google Scholar] [CrossRef]
- Bersin, J.; Chamorro-Premuzic, T. New ways to gauge talent and potential. Mit Sloan Manag. Rev. 2019, 60, 7–10. [Google Scholar]
- Shi, Q.J.; Liu, T. Glimpsing China’s future urbanization from the geography of a floating population. Environ. Plan. A Econ. Space 2019, 51, 817–819. [Google Scholar] [CrossRef]
- Ding, J.; Liu, Z.; Cheng, D. Areal differentiation of inter-provincial migration in China and characteristics of the flow field. Acta Geogr. Sin. 2005, 1, 106–114. [Google Scholar]
- Wang, R.Y.; Huang, X.; Xue, D.S. Spatio-temporal Change of Facaulty Members of Higher Education Institute and Its Influential Factors in China in 2005–2015. Sci. Geogr. Sin. 2019, 39, 1199–1207. [Google Scholar]


© 2019 by the authors. Licensee MDPI, Basel, Switzerland. This article is an open access article distributed under the terms and conditions of the Creative Commons Attribution (CC BY) license (http://creativecommons.org/licenses/by/4.0/).