Implementation of Simple Strategies to Improve Wellfield Management in Arid Regions: The Case Study of Wadi Al Arab Wellfield, Jordan


 ,
,  and
and 
Abstract
:1. Introduction
2. Study Area
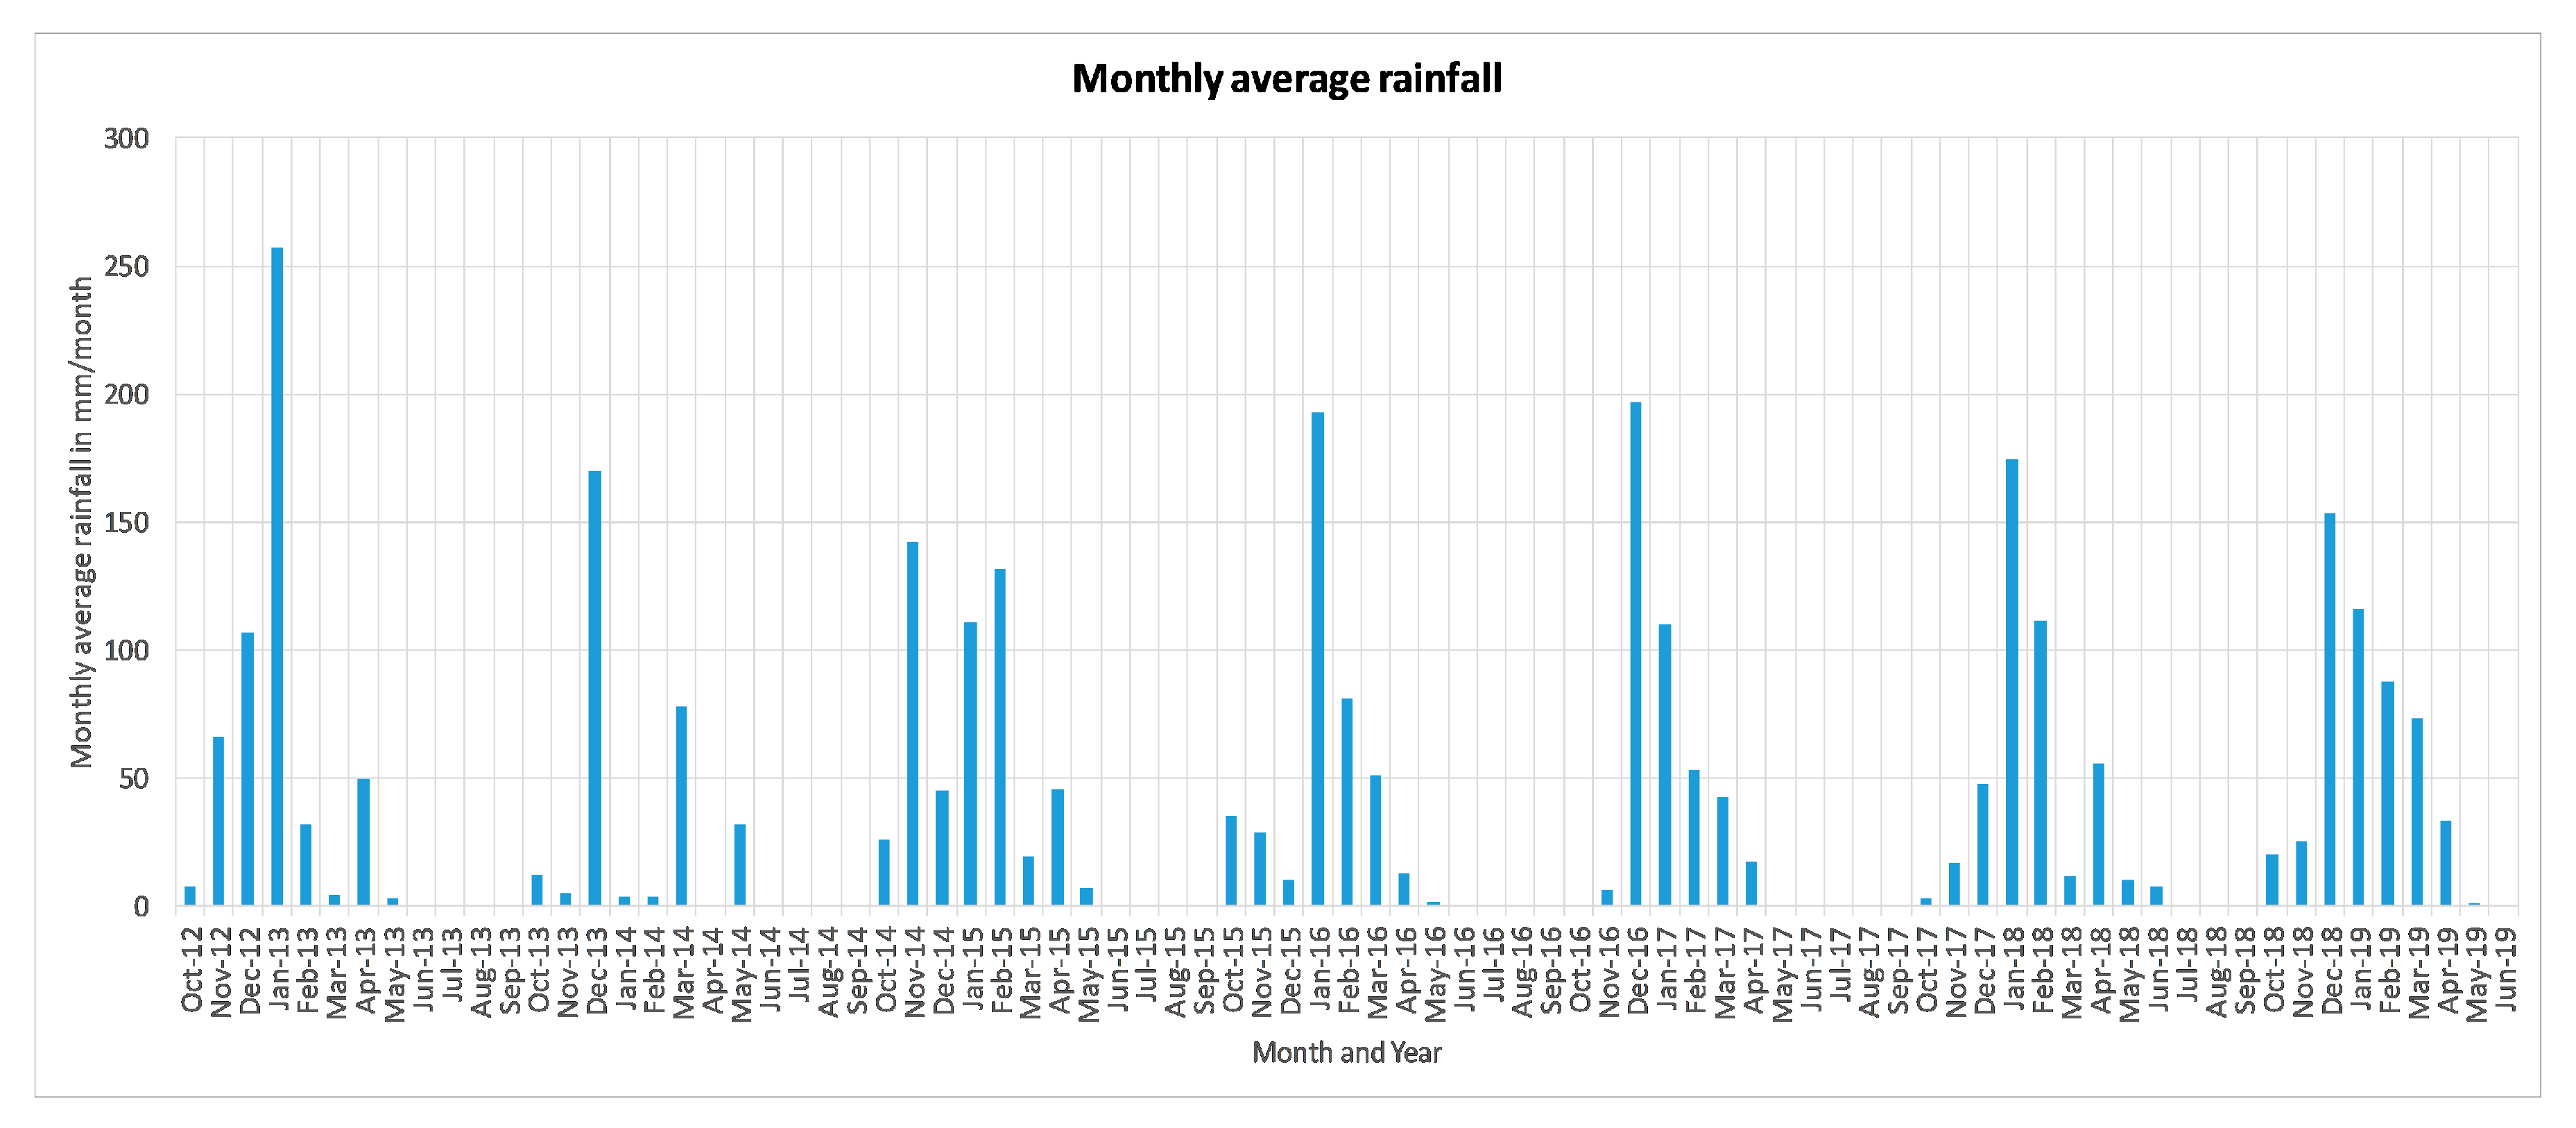
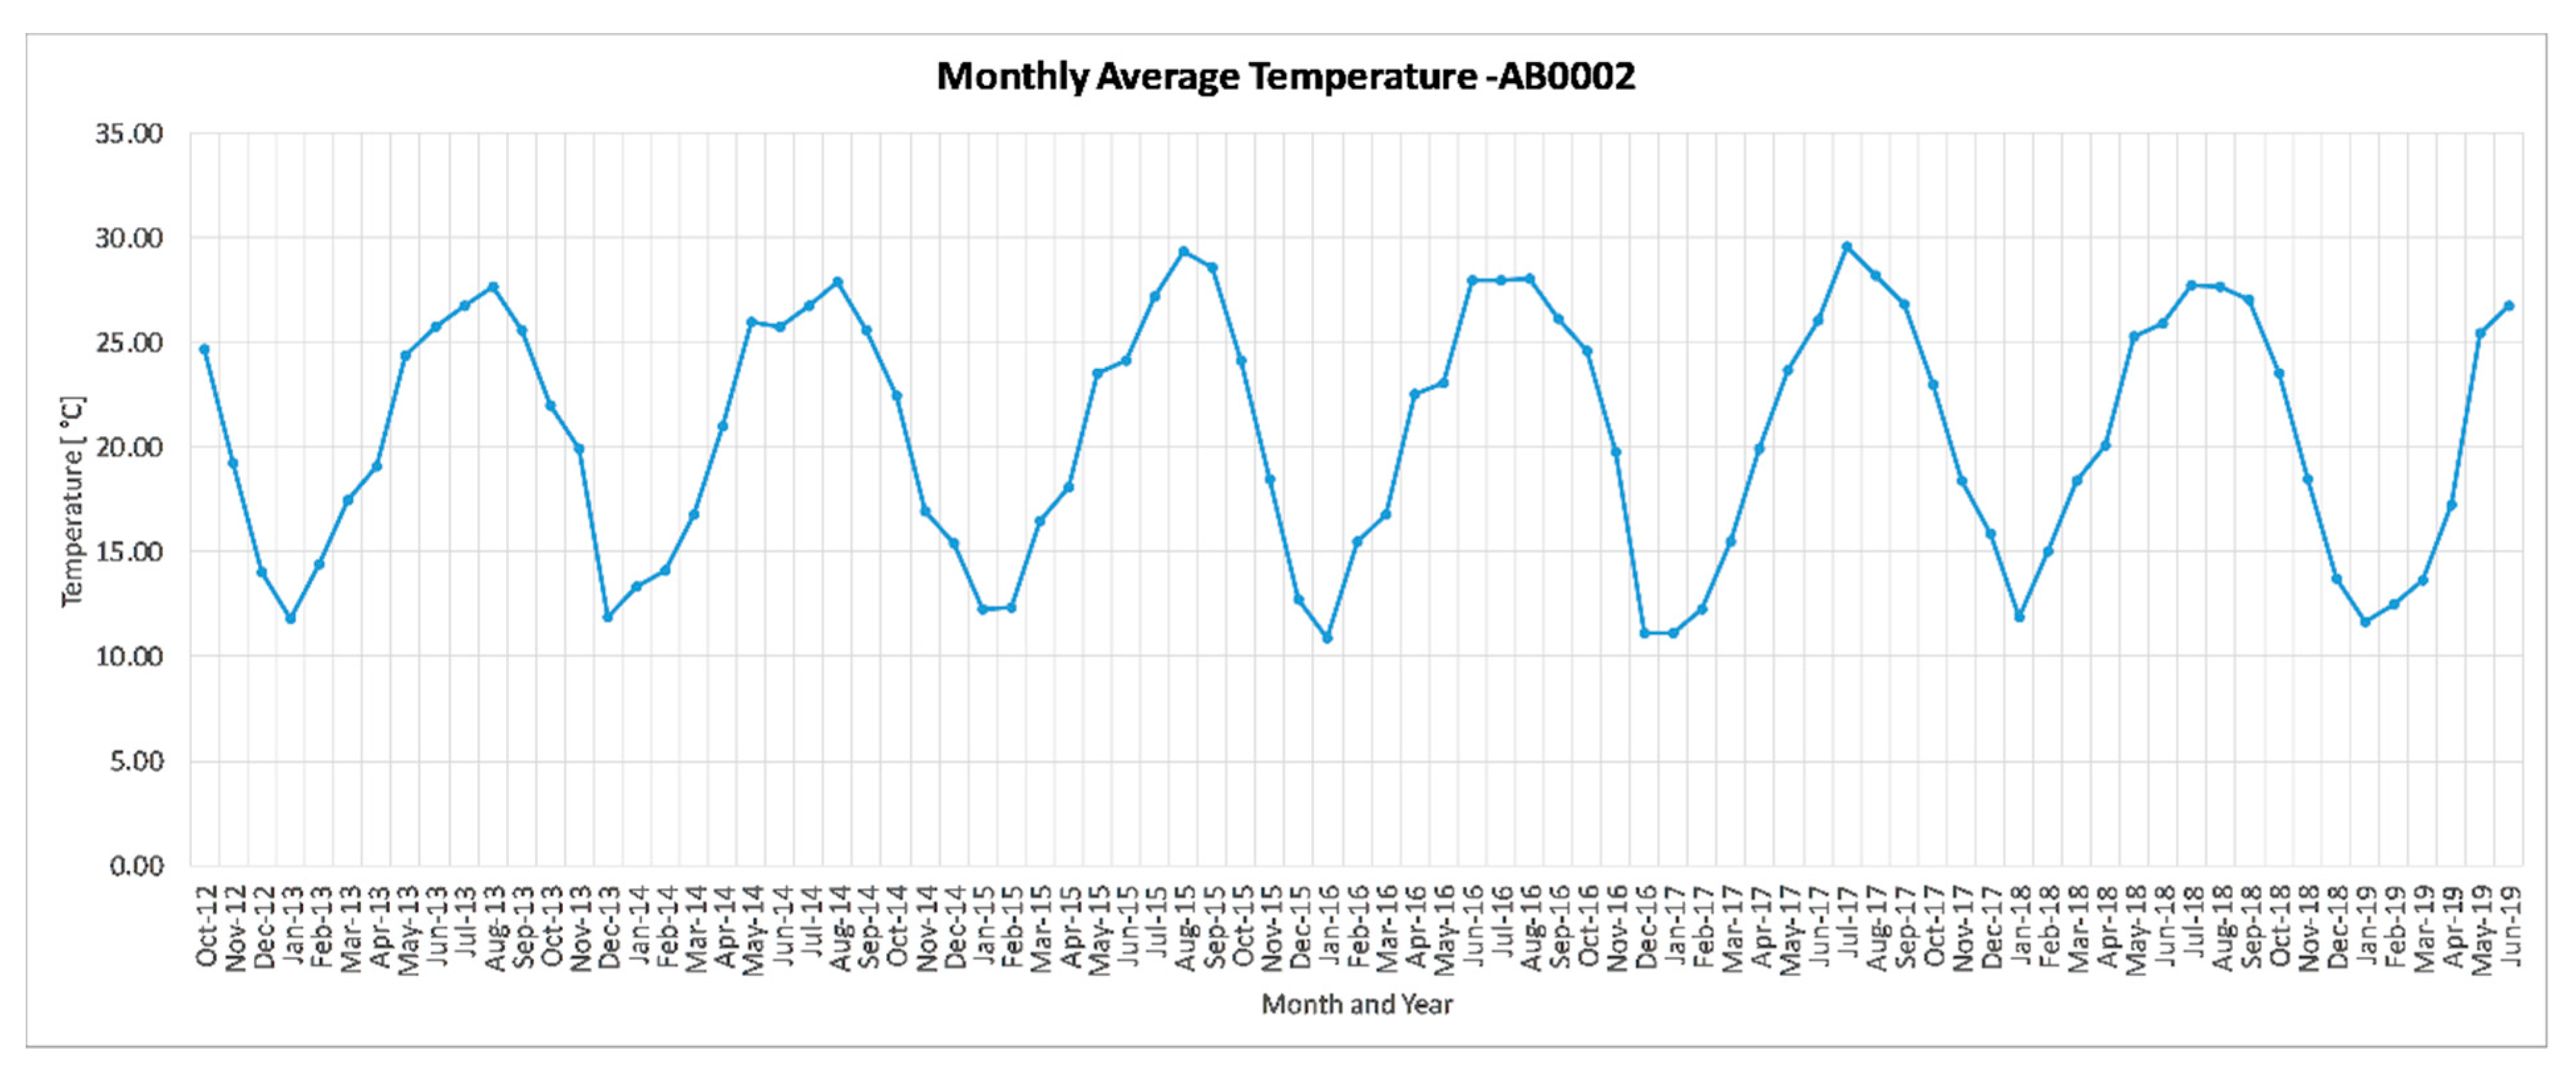
2.1. Rainfall and Temperature
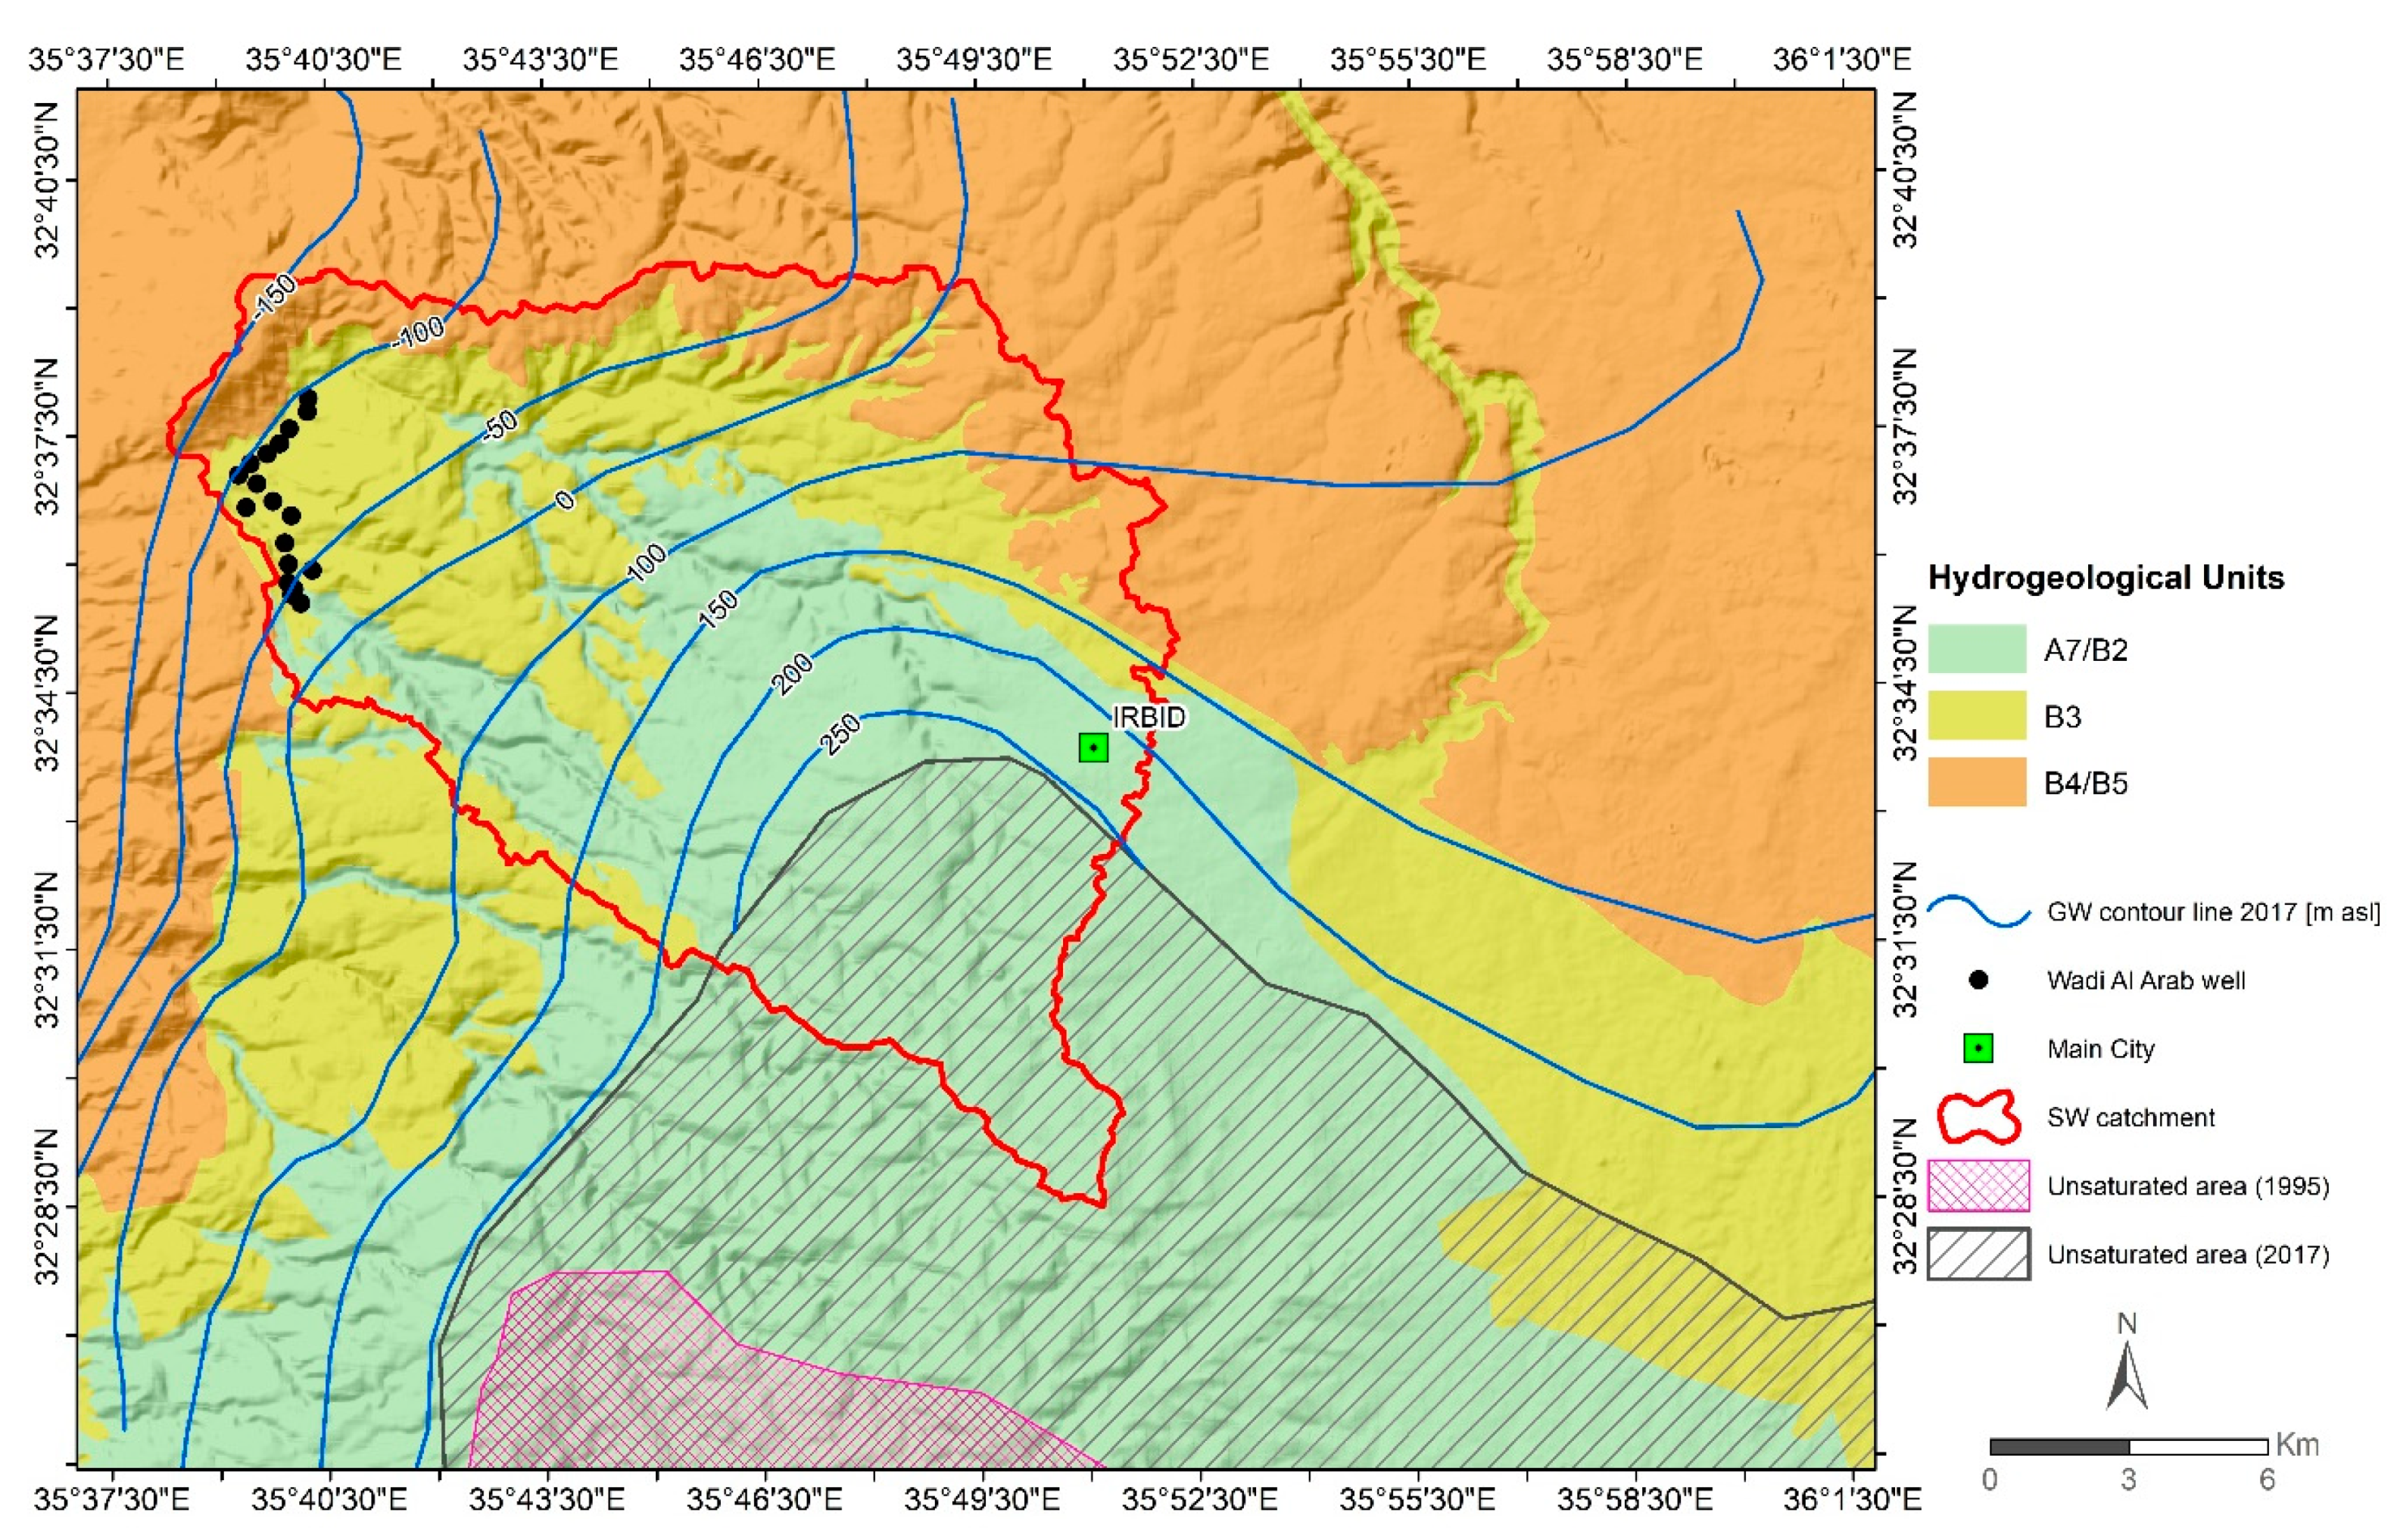
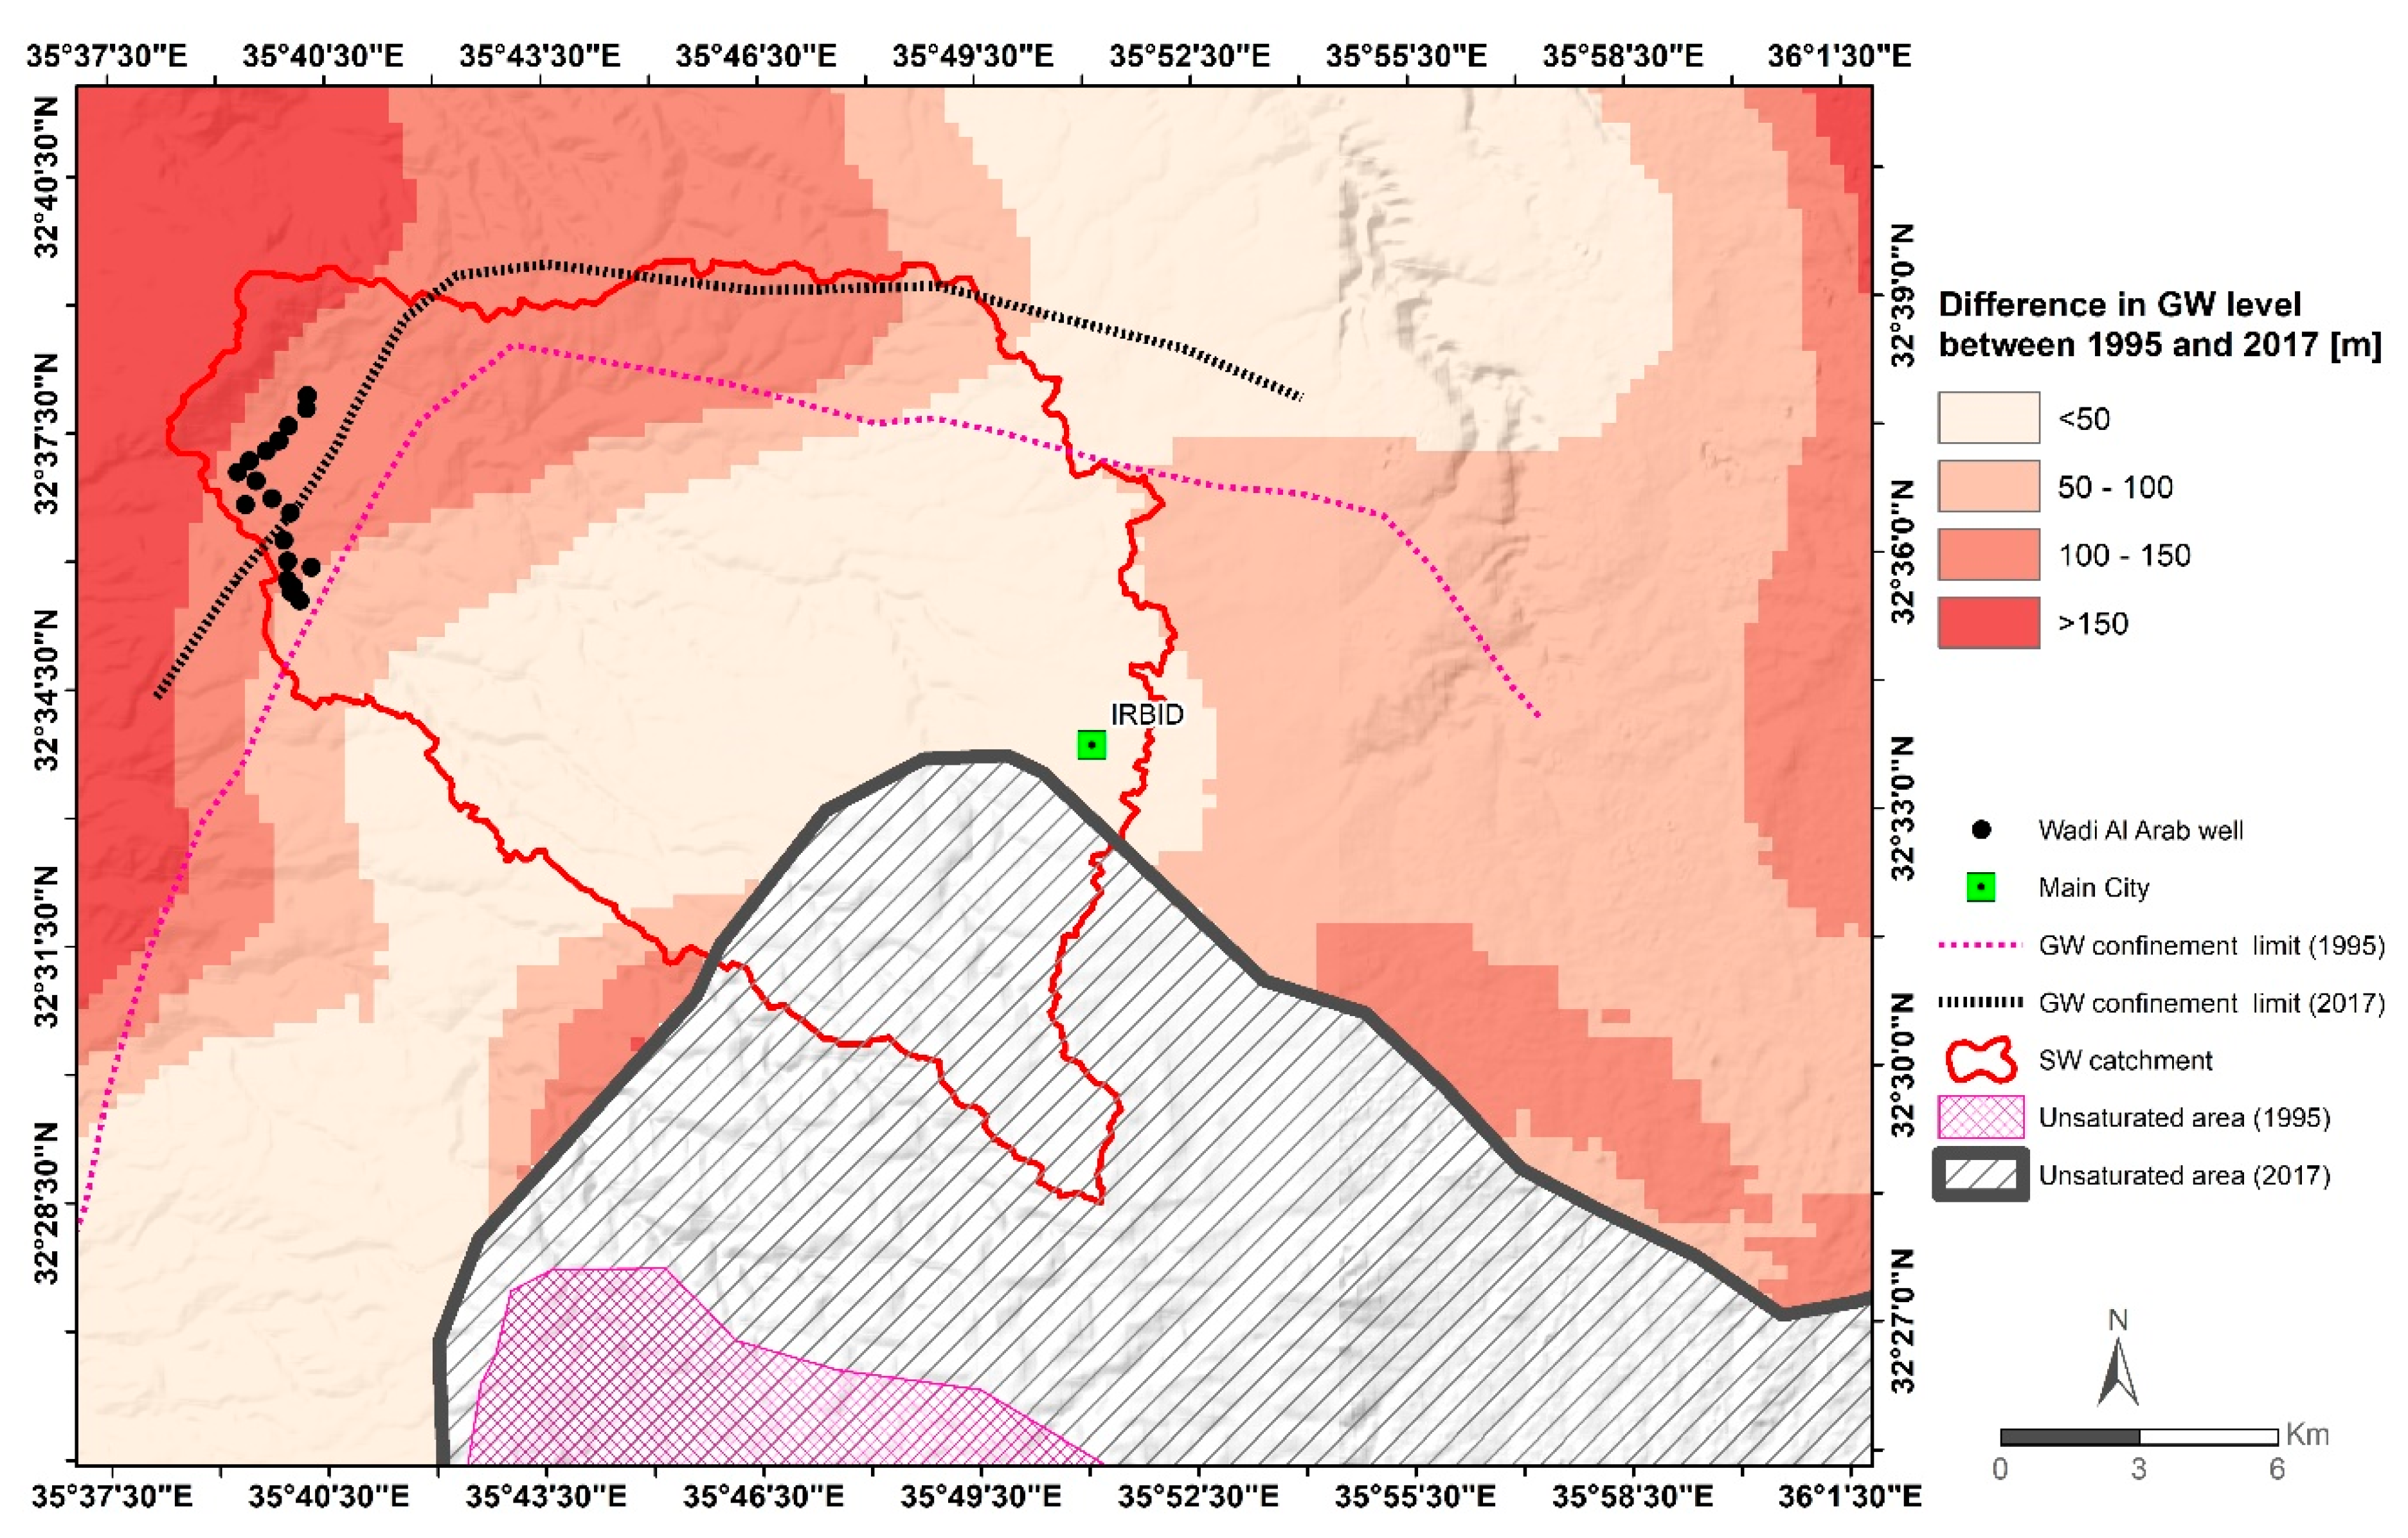
2.2. Hydrogeology
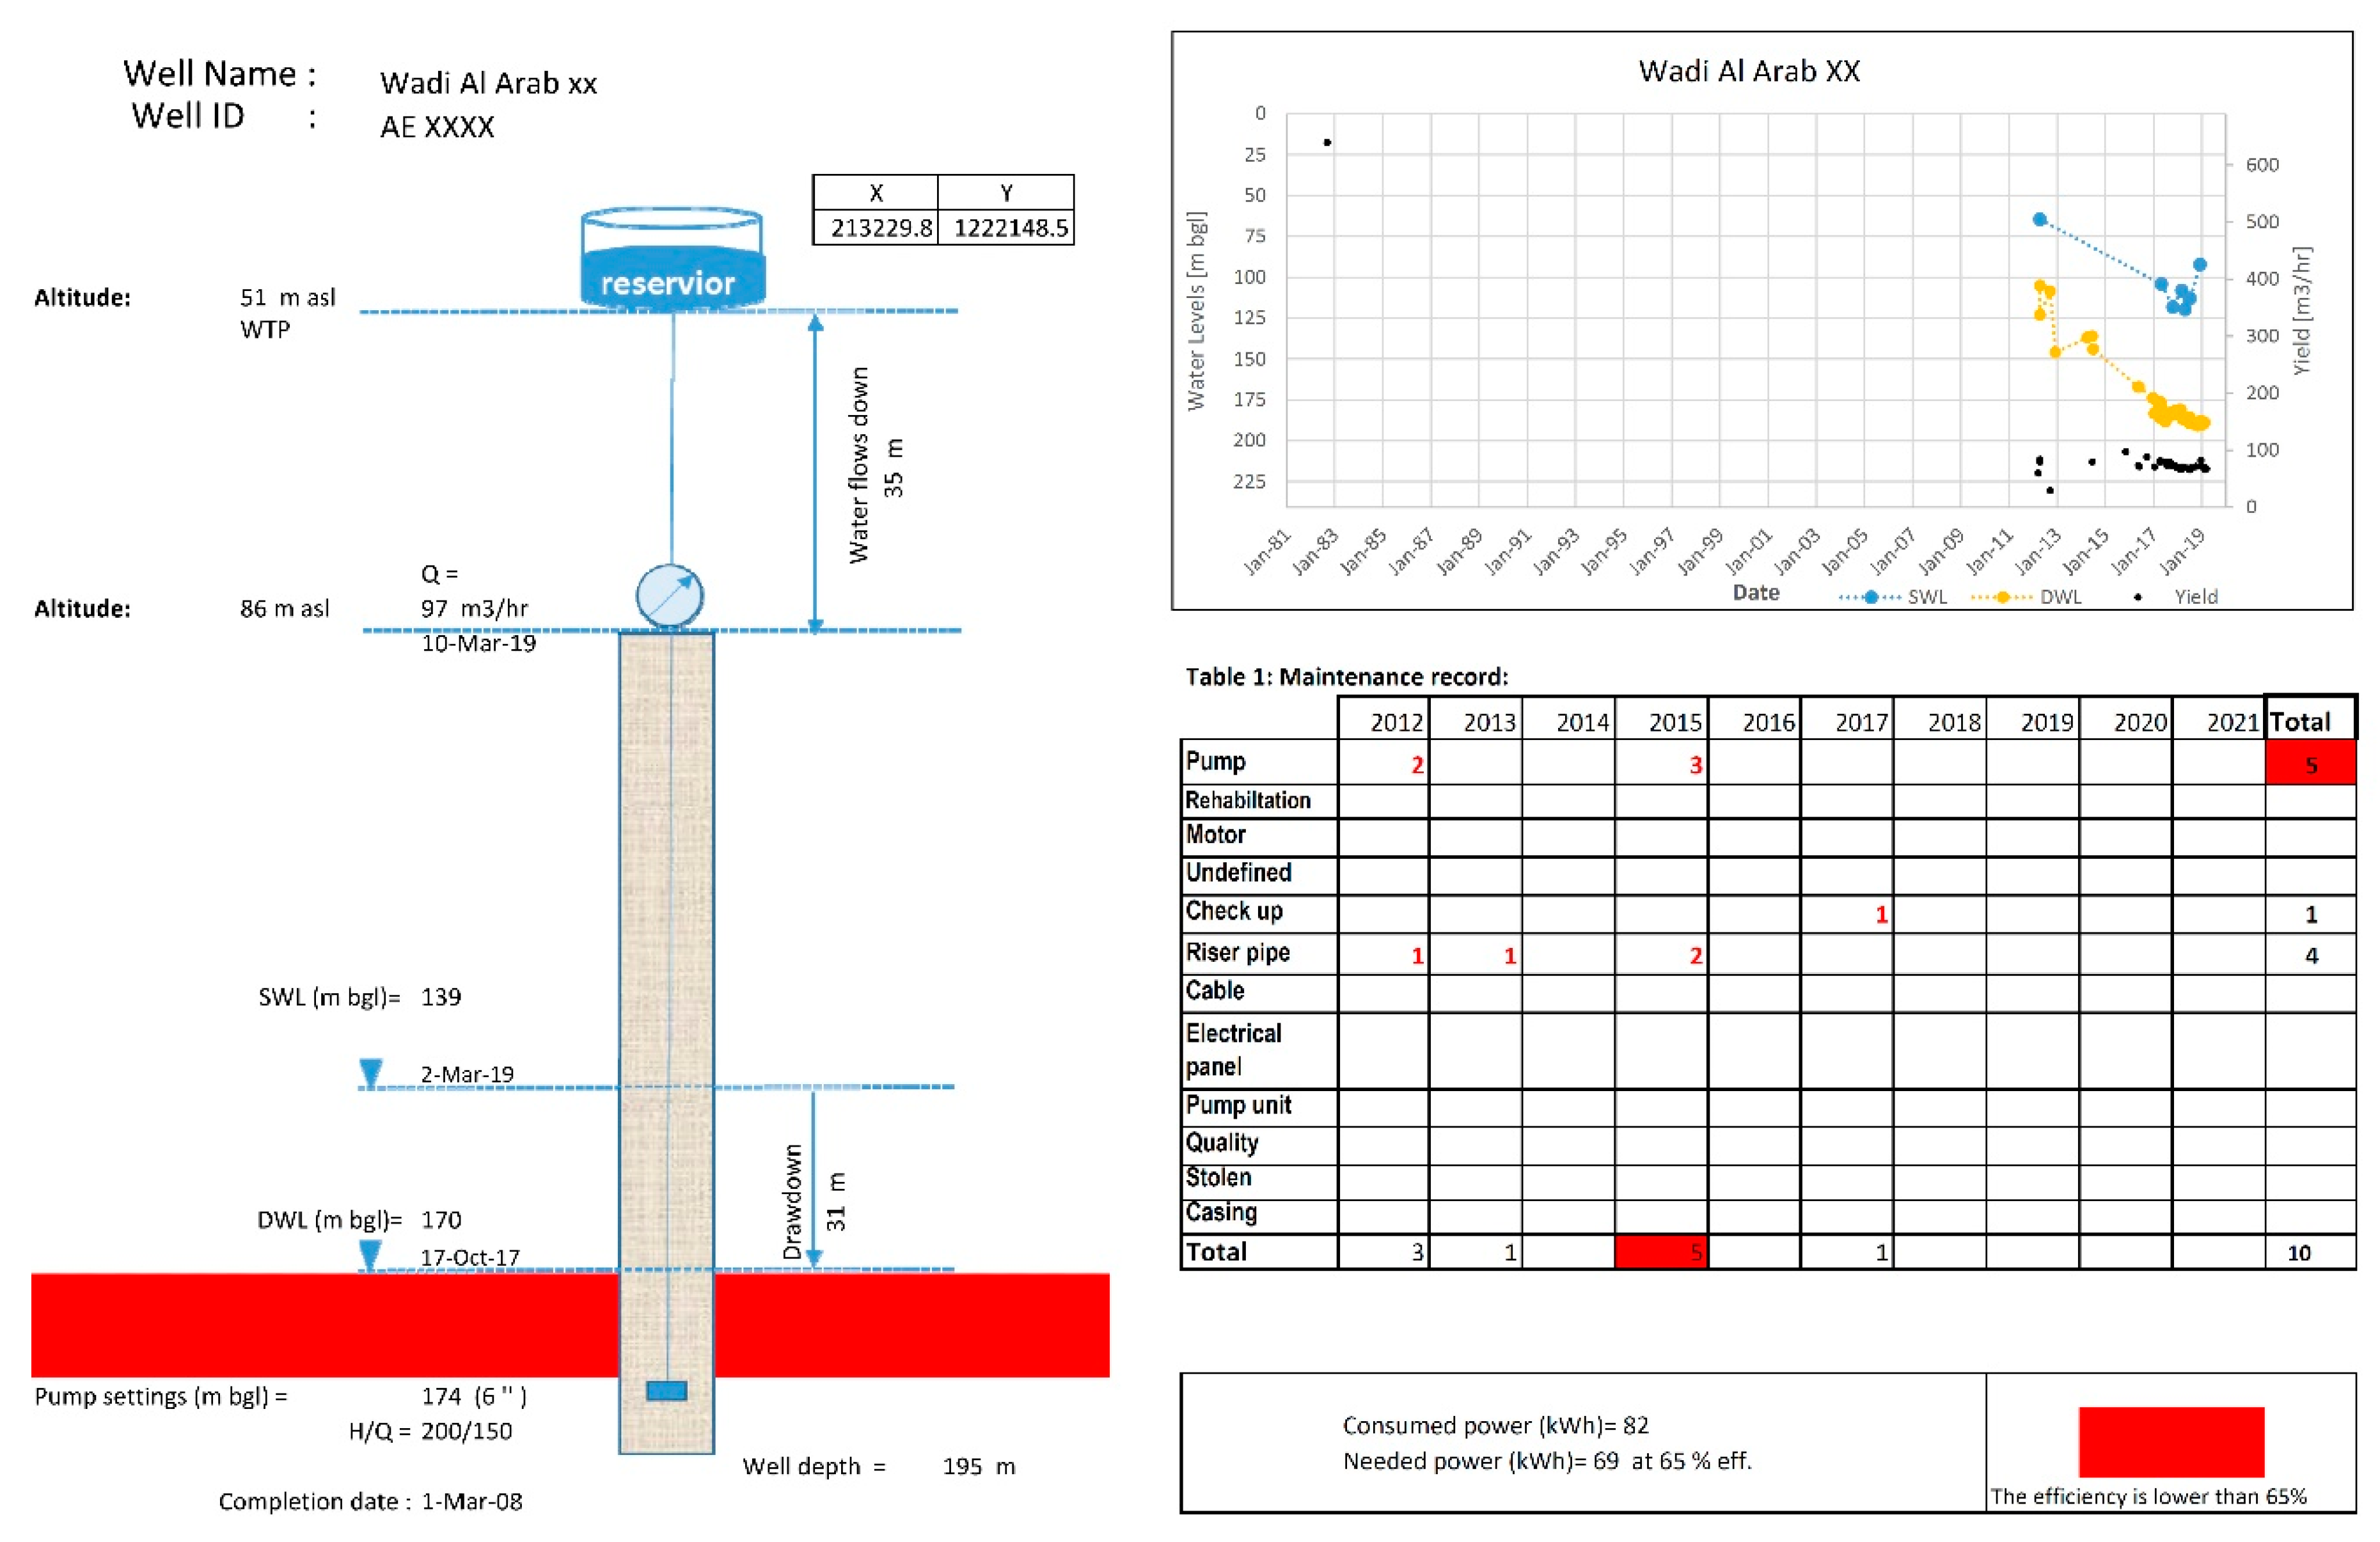
2.3. Wellfield Data
3. Methodology
3.1. Tools Development
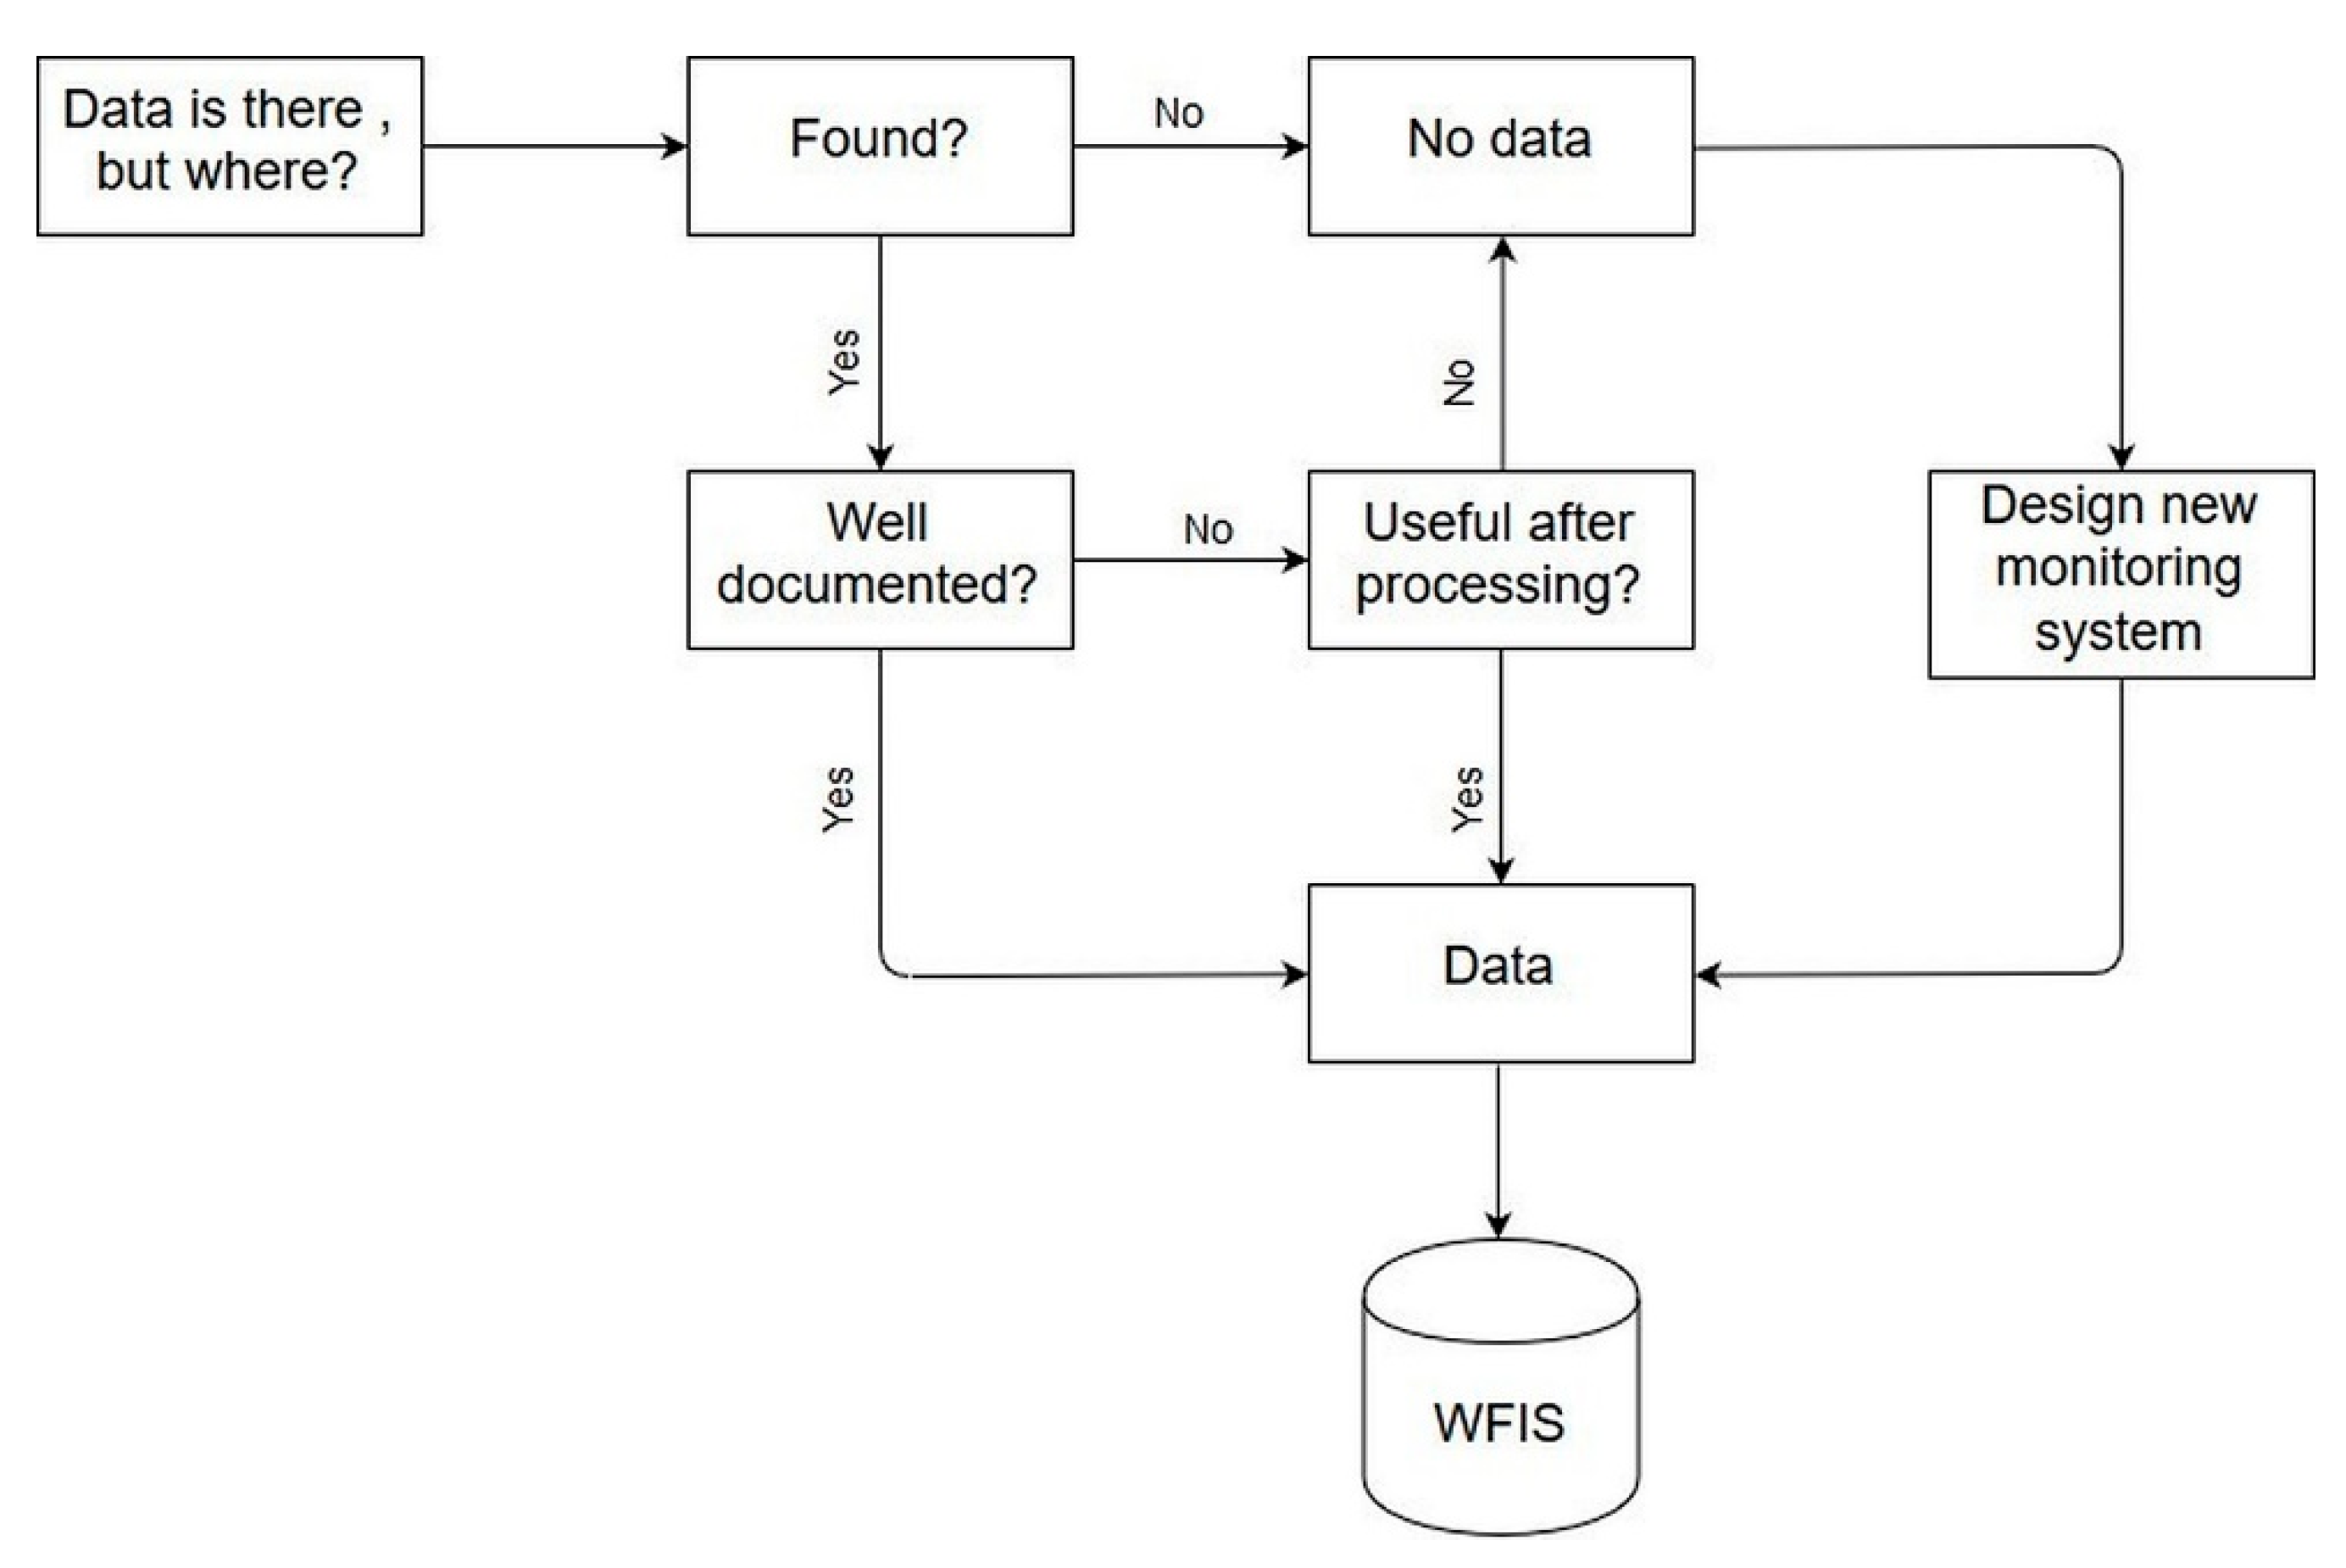
3.1.1. Wellfield Information System (WFIS)
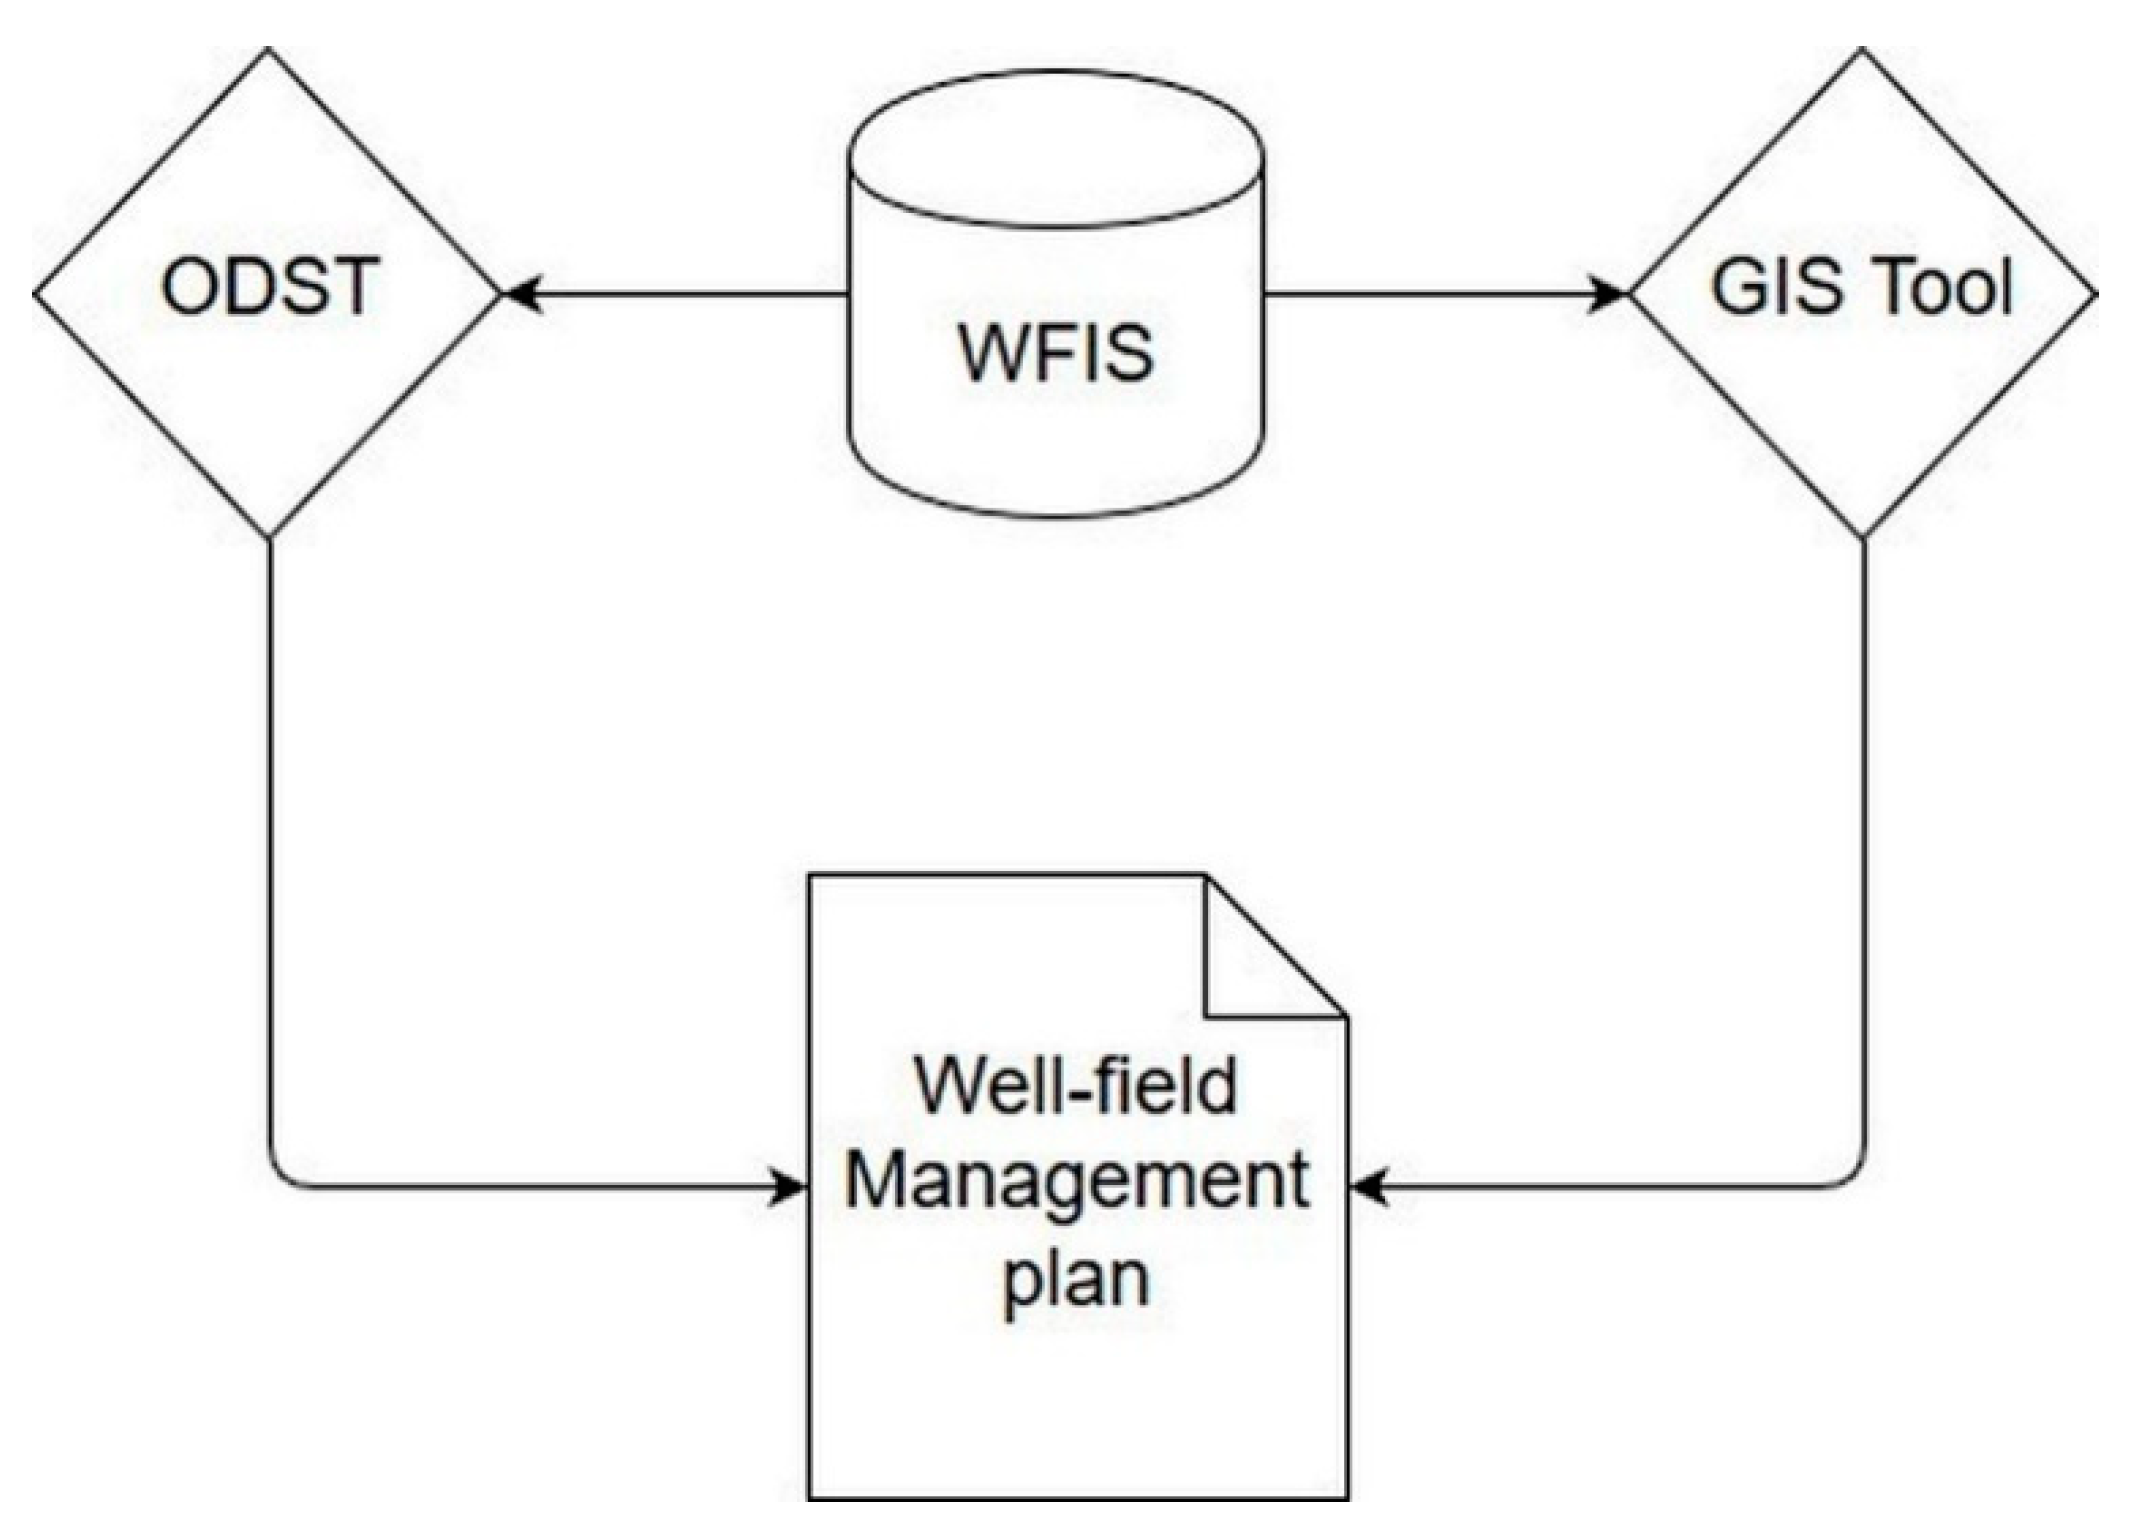
3.1.2. Operational Decision Support (ODST)
3.1.3. Wellfield Management Plan Report
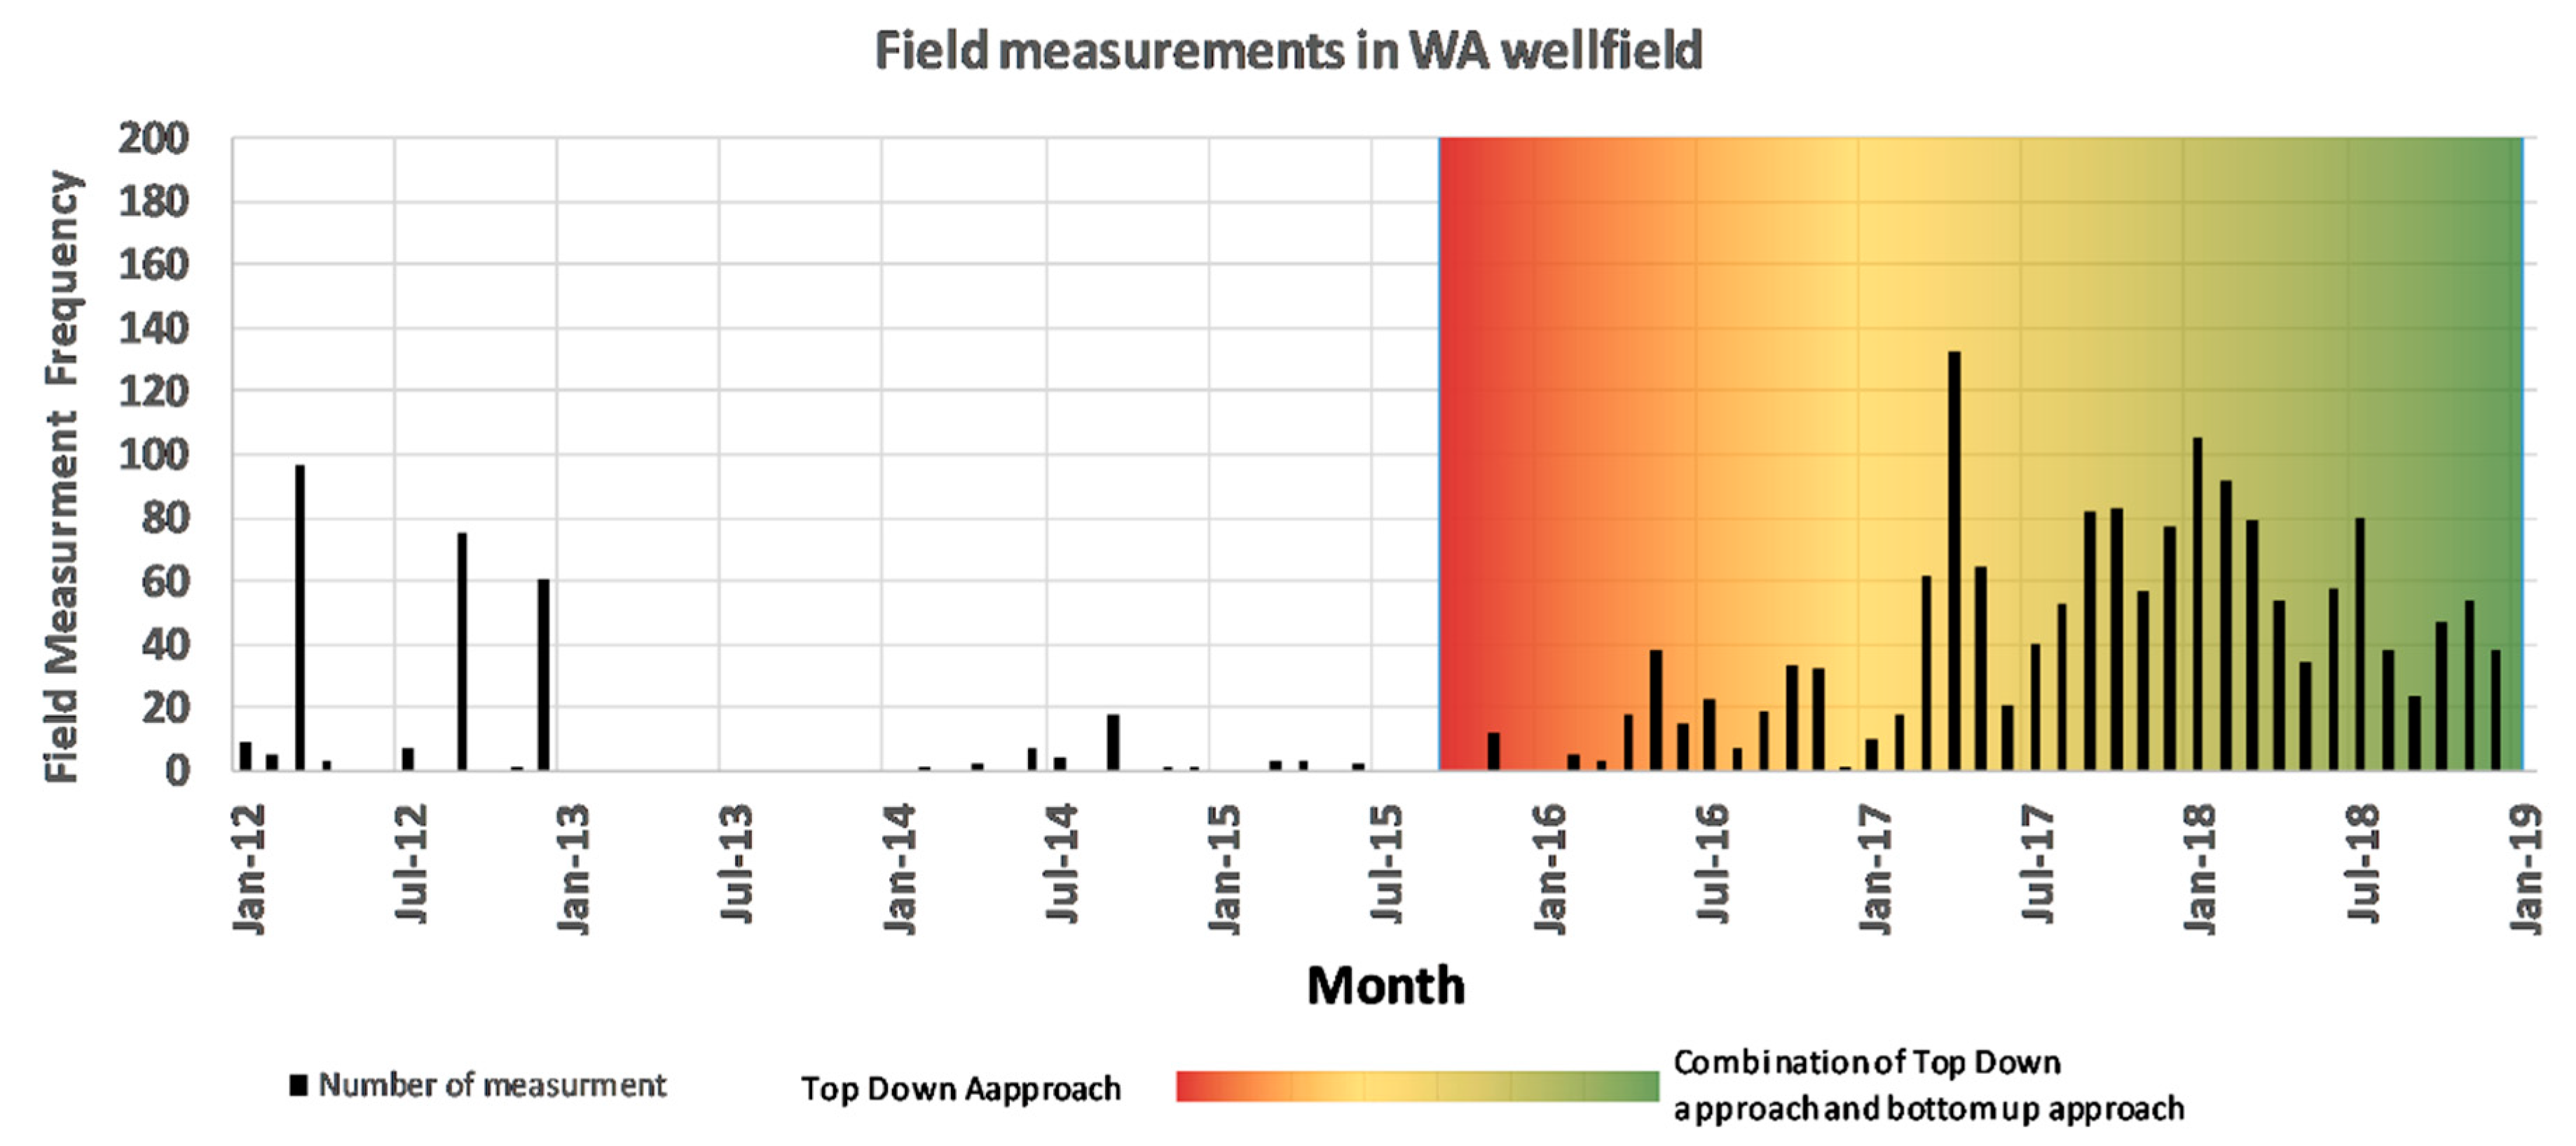
3.2. Measurement Procedure
3.3. Stakeholder Engagement
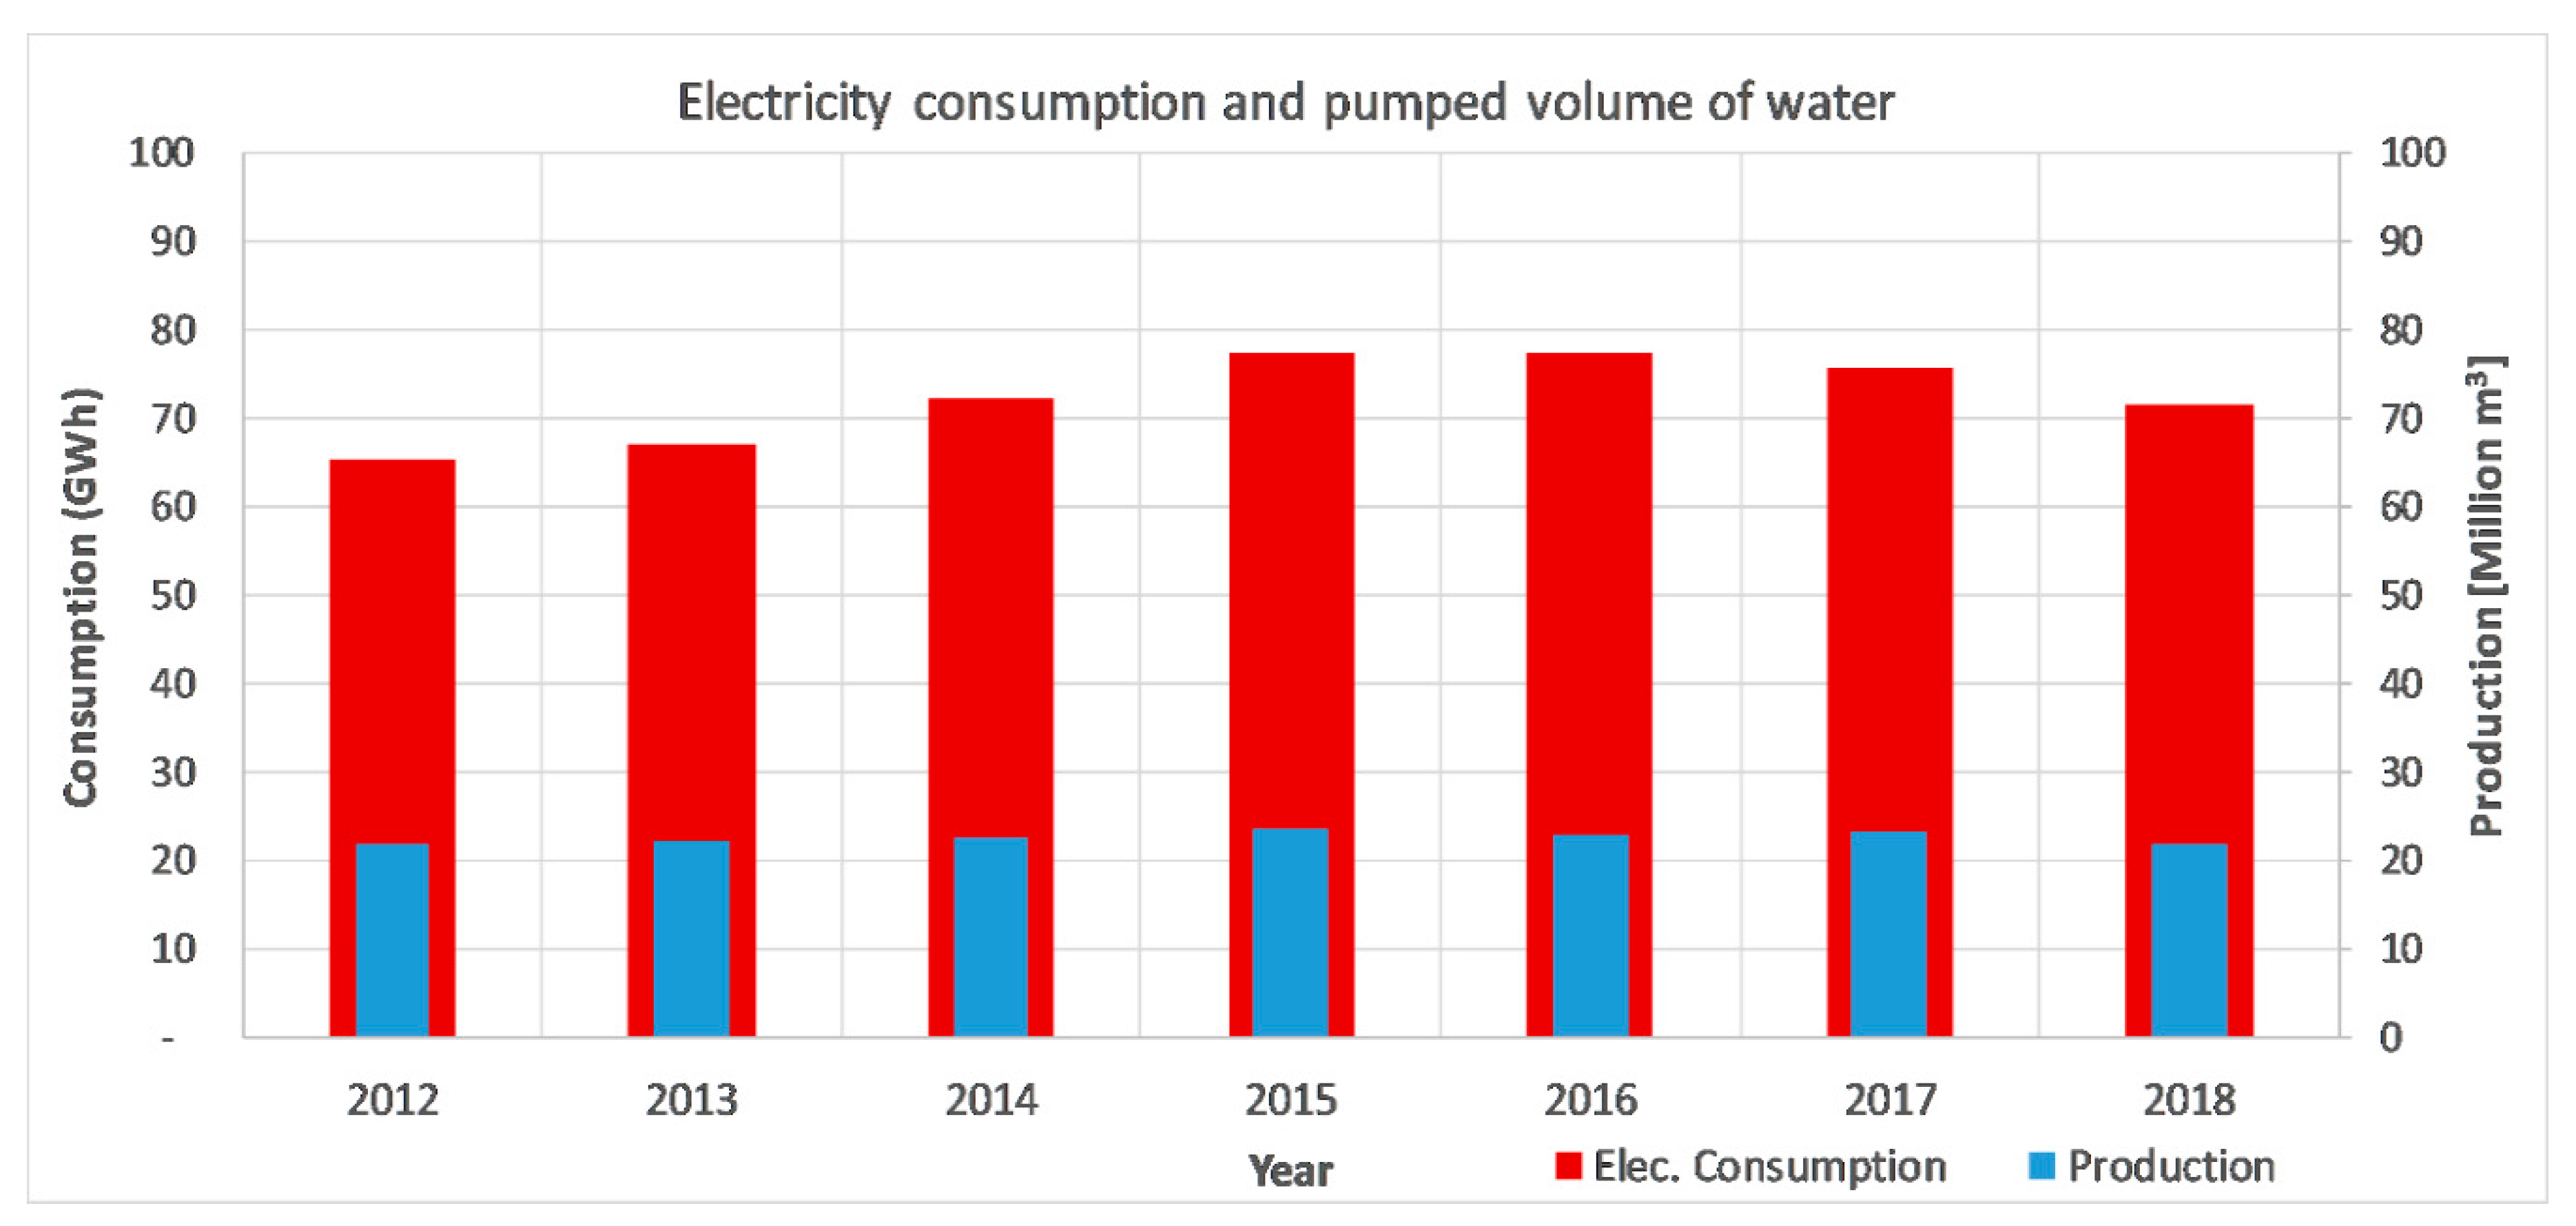
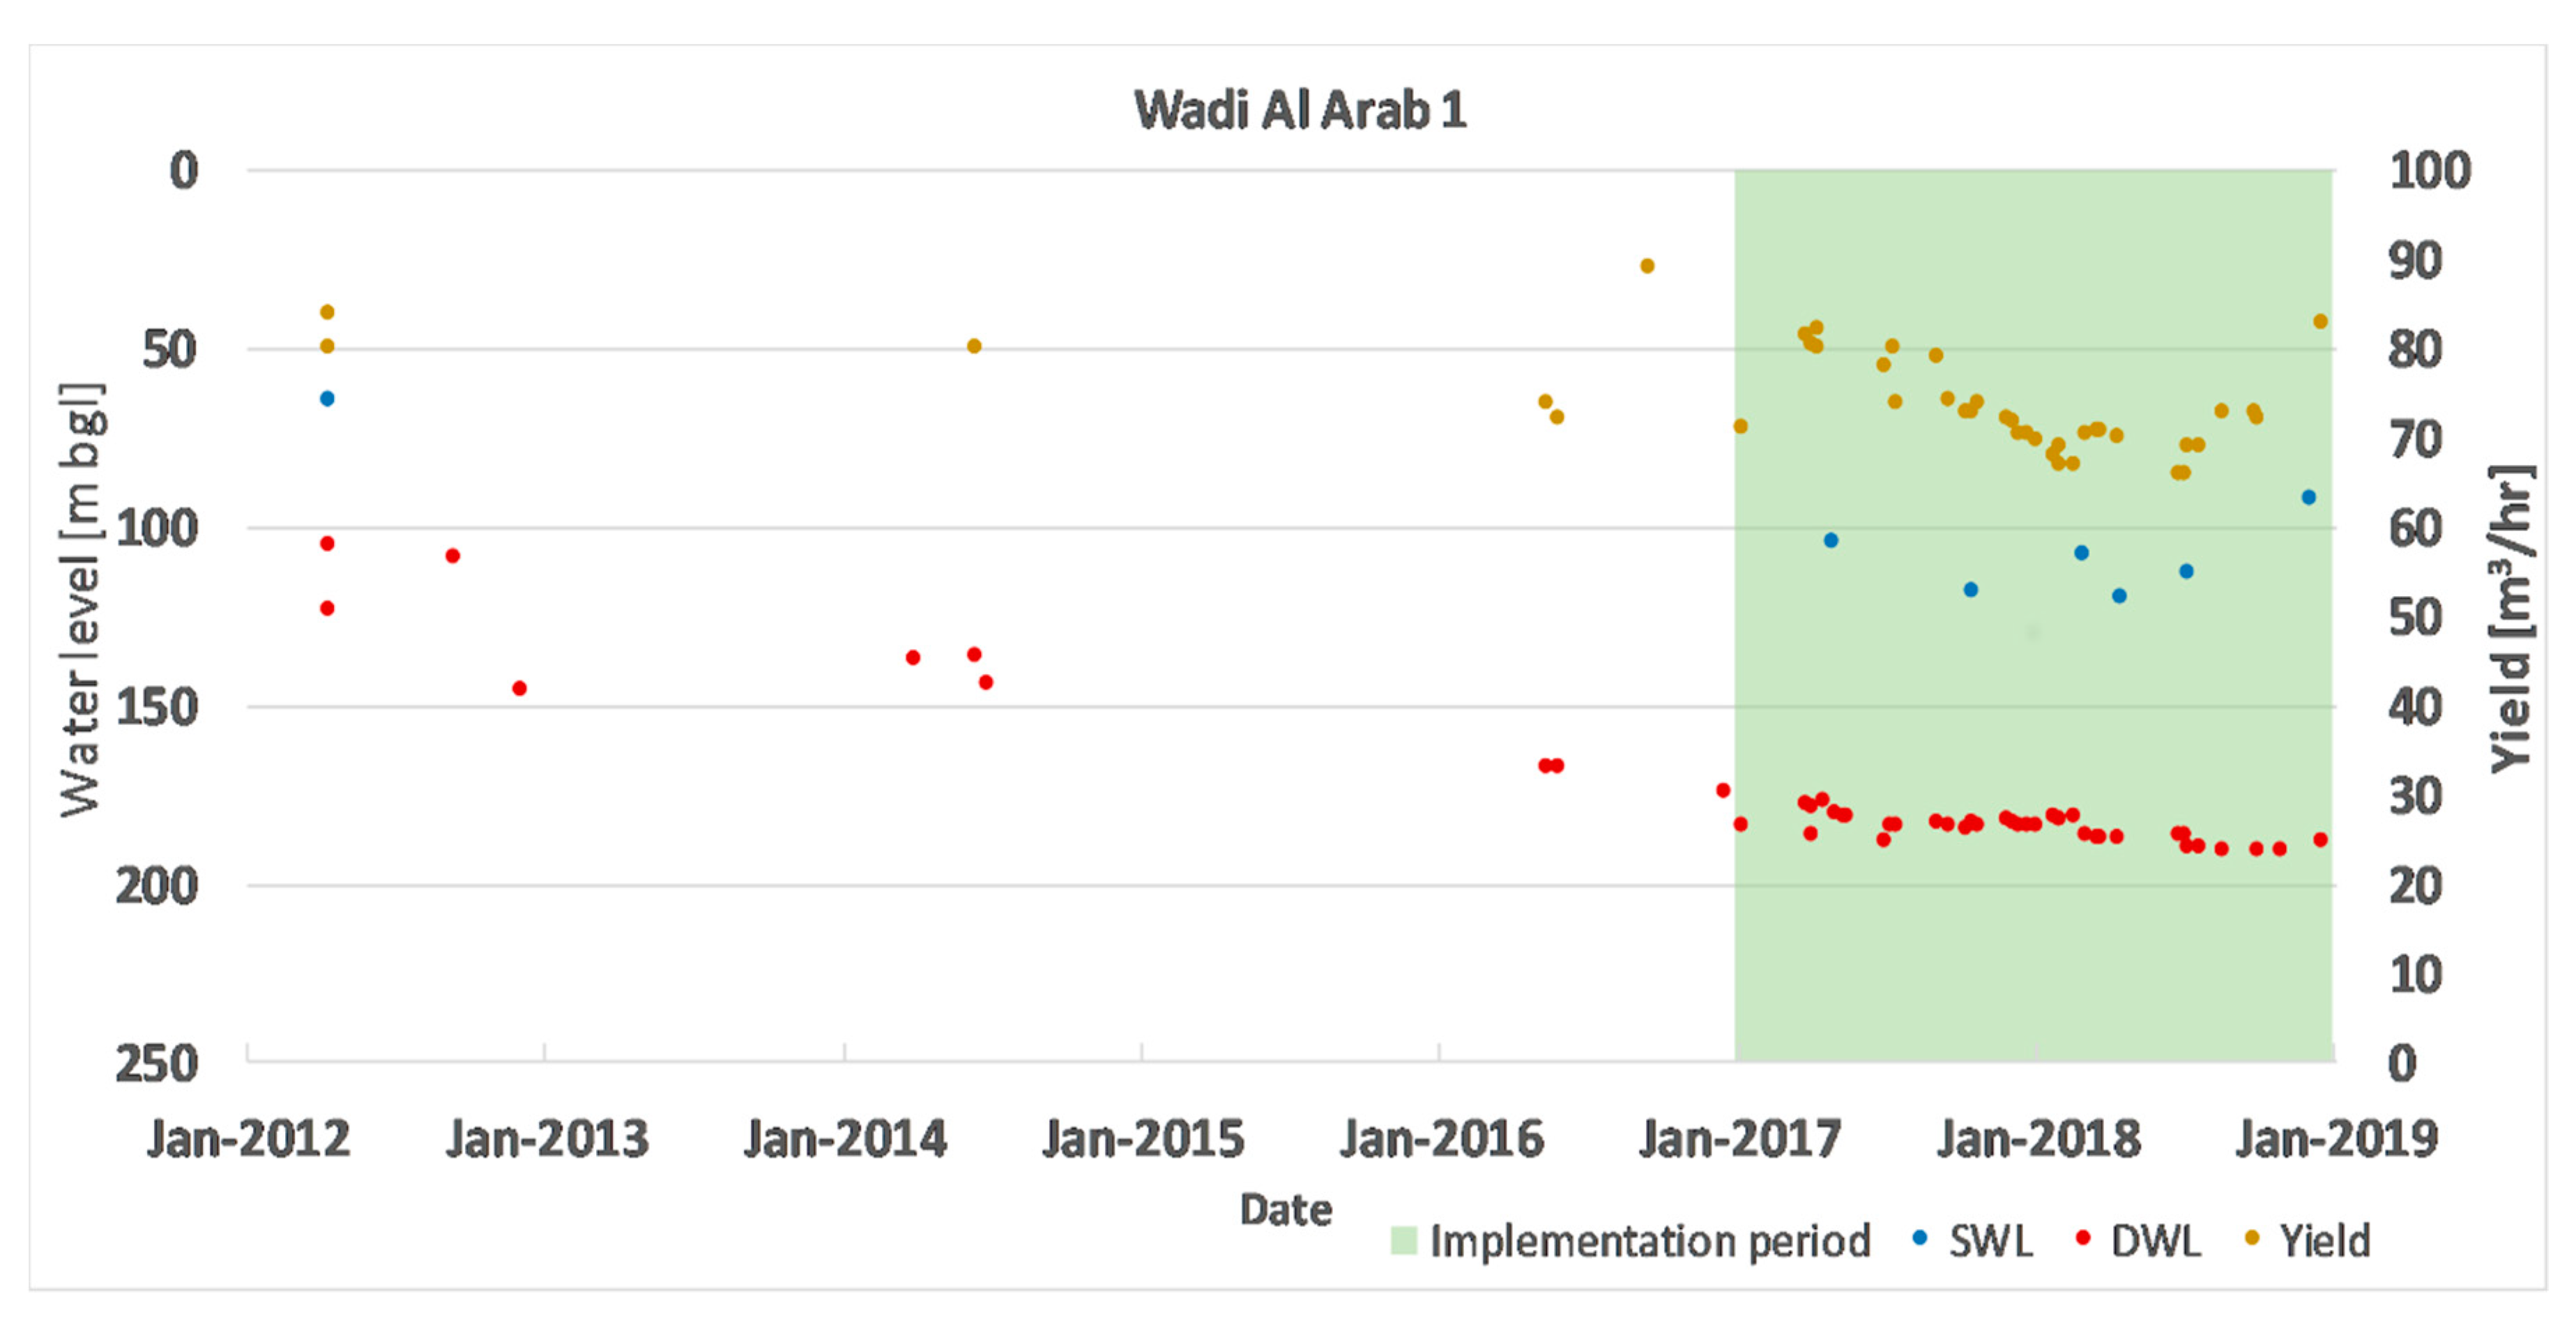
4. Results
5. Discussion
5.1. Improvement to Previous Situation
5.2. Strengths and Weaknesses
5.3. Application to Other Sites
6. Conclusions
Author Contributions
Funding
Acknowledgments
Conflicts of Interest
References
- Cudennec, C.; Leduc, C.; Koutsoyiannis, D. Dryland Hydrology in Mediterranean Regions—A Review. Hydrol. Sci. J. 2007, 52, 1077–1087. [Google Scholar] [CrossRef]
- Prinz, D.; Singh, A.K. Water Resources in Arid Regions and Their Sustainable Management. Ann. Arid Zone 2000, 39, 251–272. [Google Scholar]
- Redoloza, F.; Li, L. A novel method for well placement design in groundwater management: Extremal optimization. Adv. Water Resour. 2019, 132, 103405. [Google Scholar] [CrossRef]
- Cousquer, Y.; Pryet, A.; Delbart, C.; Valois, R.; Dupuy, A. Adaptive optimization of a vulnerable well field. Hydrogeol. J. 2019, 27, 1673–1681. [Google Scholar] [CrossRef]
- Gejl, R.; Rygaard, M.; Henriksen, H.; Rasmussen, J.; Bjerg, P. Understanding the impacts of groundwater abstraction through long-term trends in water quality. Water Res. 2019, 156, 241–251. [Google Scholar] [CrossRef]
- Kawo, N.S.; Zhou, Y.; Magalso, R.; Salvacion, L. Optimization of an Artificial-Recharge–Pumping System for Water Supply in the Maghaway Valley, Cebu, Philippines. Hydrogeol. J. 2018. [Google Scholar] [CrossRef]
- Marti, B.S.; Bauser, G.; Stauffer, F.; Kuhlmann, U.; Kaiser, H.-P.; Kinzelbach, W. An expert system for real-time well field management. Water Supply 2012, 12, 699–706. [Google Scholar] [CrossRef]
- Shekhar, S.; Rao, S.V.N. Groundwater Management in Palla Well Field of Delhi Using Numerical Modeling Technique—A Case Study. Silver Jubil. Publ. 2010, 25, 46. [Google Scholar]
- Bauser, G.; Franssen, H.-J.H.; Kaiser, H.-P.; Kuhlmann, U.; Stauffer, F.; Kinzelbach, W. Real-Time Management of an Urban Groundwater Well Field Threatened by Pollution. Environ. Sci. Technol. 2010, 44, 6802–6807. [Google Scholar] [CrossRef]
- Braune, E.; Xu, Y. Groundwater Management Issues in Southern Africa—An IWRM Perspective. Water SA 2008, 34, 699–706. [Google Scholar] [CrossRef]
- Wagner, B.J. Recent advances in simulation-optimization groundwater management modeling. Rev. Geophys. 1995, 33, 1021–1028. [Google Scholar] [CrossRef]
- Al-Weshah, R.A.-M. Jordan’s Water Resources: Technical Perspective. Water Int. 1992, 17, 124–132. [Google Scholar] [CrossRef]
- Jaber, J.O.; Mohsen, M.S. Evaluation of non-conventional water resources supply in Jordan. Desalination 2001, 136, 83–92. [Google Scholar] [CrossRef]
- Hamdan, I.; Margane, A.; Ptak, T.; Wiegand, B.; Sauter, M. Groundwater vulnerability assessment for the karst aquifer of Tanour and Rasoun springs catchment area (NW-Jordan) using COP and EPIK intrinsic methods. Environ. Earth Sci. 2016, 75, 1–13. [Google Scholar] [CrossRef]
- Al-Harahsheh, S.; Al-Adamat, R.; Abdullah, S. The Impact of Za’atari Refugee Camp on the Water Quality in Amman-Zarqa Basin. J. Environ. Prot. 2015. [Google Scholar] [CrossRef]
- Al Kuisi, M.; Al-Hwaiti, M.; Mashal, K.; Abed, A.M. Spatial distribution patterns of molybdenum (Mo) concentrations in potable groundwater in Northern Jordan. Environ. Monit. Assess. 2015, 187, 148. [Google Scholar] [CrossRef]
- Al Kuisi, M.; Mashal, K.; Al-Qinna, M.; Abu Hamad, A.; Margana, A. Groundwater Vulnerability and Hazard Mapping in an Arid Region: Case Study, Amman-Zarqa Basin (AZB)-Jordan. J. Water Resour. Prot. 2014, 6, 297–318. [Google Scholar] [CrossRef] [Green Version]
- Al Kuisi, M.; Abdel-Fattah, A. Groundwater Vulnerability to Selenium in Semi-Arid Environments: Amman Zarqa Basin, Jordan. Environ. Geochem. Health 2010, 32, 107–128. [Google Scholar] [CrossRef]
- Borgstedt, A.; Margane, A.; Subah, A.; Hajali, Z.; Almomani, T.; Khalifa, N.; Jaber, A.; Hamdan, I. Delineation of Groundwater Protection Zones for the Corridor Well Field; Ministry of Water and Irrigation (MWI): Amman, Jordan, 2007.
- El Naqa, A. Aquifer vulnerability assessment using the DRASTIC model at Russeifa landfill, northeast Jordan. Environ. Geol. 2004, 47, 51–62. [Google Scholar] [CrossRef]
- Hammouri, N.; El-Naqa, A. GIS Based Hydrogeological Vulnerability Mapping of Groundwater Resources in Jerash Area-Jordan. Geofísica Int. 2008, 47, 85–97. [Google Scholar]
- El-Naqa, A.; Al-Momani, M.; Kilani, S.; Hammouri, N.; El-Naqa, A.; Al-Momani, M. Groundwater Deterioration of Shallow Groundwater Aquifers Due to Overexploitation in Northeast Jordan. CLEAN-Soil Air Water 2007, 35, 156–166. [Google Scholar] [CrossRef]
- Alkhatib, J.; Engelhardt, I.; Ribbe, L.; Sauter, M. An integrated approach for choosing suitable pumping strategies for a semi-arid region in Jordan using a groundwater model coupled with analytical hierarchy techniques. Hydrogeol. J. 2019, 27, 1143–1157. [Google Scholar] [CrossRef]
- Jassim, A.H.M.; Alraggad, M.M. GIS Modeling of the Effect of Climatic Changes on the Groundwater Recharge in the Central Western Parts of Jordan. Jordan J. Civ. Eng. 2009, 3, 356–374. [Google Scholar]
- Al-Kharabsheh, A.; Al-Mahamid, J. Optimizing pumping rates of Hallabat-Khalidiya Wellfield using finite-difference model: A case study for evaluating overpumped aquifers in arid areas (Jordan). J. Arid Environ. 2002, 52, 259–267. [Google Scholar] [CrossRef]
- Salameh, E. Using environmental isotopes in the study of the recharge-discharge mechanisms of the Yarmouk catchment area in Jordan. Hydrogeol. J. 2004, 12, 451–463. [Google Scholar] [CrossRef]
- Al Kuisi, M.; El-Naqa, A. GIS Based Spatial Groundwater Recharge Estimation in the Jafr Basin, Jordan-Application of WetSpass Models for Arid Regions. Rev. Mex. Cienc. Geol. 2013, 30, 96–109. [Google Scholar]
- Ragab, R.; Prudhomme, C. Climate Change and Water Resources Management in Arid and Semi-Arid Regions: Prospective and Challenges for the 21st Century. Biosyst. Eng. 2002. [Google Scholar] [CrossRef]
- Suppan, P.; Kunstmann, H.; Heckl, A.; Rimmer, A. Impact of Climate Change on Water Availability in. In Climate and Land Degradation; Springer Science and Business Media LLC: Berlin, Germany, 2008; pp. 47–58. [Google Scholar]
- Al-Shayeb, A.; Momani, N.M.; Hamdi, M.R.; Abu-Allaban, M.; Jaber, M. Climate Change in Jordan: A Comprehensive Examination Approach. Am. J. Environ. Sci. 2009, 5, 58–68. [Google Scholar]
- Verner, D.; Lee, D.; Ashwill, M. Increasing Resilience to Climate Change in the Agricultural Sector of the Middle East: The Cases of Jordan and Lebanon; World Bank Publications: Washington, DC, USA, 2013. [Google Scholar]
- Sada, A.A.; Abu-Allaban, M.; Al-Malabeh, A. Temporal and Spatial Analysis of Climate Change at Northern Jordanian Badia. Jordan J. Earth Environ. Sci. 2015, 7, 87–93. [Google Scholar]
- Margane, A.; Borgstedt, A.; Subah, A. Water Resources Protection Efforts in Jordan and their Contribution to a Sustainable Water Resources Management. In Climatic Changes and Water Resources in the Middle East and North Africa; Springer: Berlin/Heidelberg, Germany, 2008; pp. 325–345. [Google Scholar]
- Rödiger, T.; Magri, F.; Geyer, S.; Morandage, S.T.; Subah, H.E.A.; Alraggad, M.; Siebert, C. Assessing Anthropogenic Impacts on Limited Water Resources under Semi-Arid Conditions: Three-Dimensional Transient Regional Modelling in Jordan. Hydrogeol. J. 2017, 25, 2139–2149. [Google Scholar]
- Salameh, E. Effects of Climatic Changes on Surface and Groundwater Resources in the Northwestern Part of Jordan. Int. J. Environ. Agric. Res. 2016, 2, 23–32. [Google Scholar]
- DoS. Jordan Statistical Yearbook; Department of Statistics (DoS): Amman, Jordan, 2017.
- Margane, A.; Alqadi, M.; Alkurdi, O. Updating the Groundwater Contour Map of the A7/B2 Aquifer in North Jordan; Ministry of Water and Irrigation (MWI): Amman, Jordan, 2015.
- Shammout, M.W.; Qtaishat, T.; Rawabdeh, H.; Shatanawi, M. Improving Water Use Efficiency under Deficit Irrigation in the Jordan Valley. Sustainability 2018, 10, 4317. [Google Scholar] [CrossRef]
- Bauer-Gottwein, P.; Schneider, R.; Davidsen, C. Optimizing Wellfield Operation in a Variable Power Price Regime. Groundwater 2016, 54, 92–103. [Google Scholar] [CrossRef] [PubMed]
- Vaux, H. Groundwater under Stress: The Importance of Management. Environ. Earth Sci. 2011, 62, 19–23. [Google Scholar] [CrossRef]
- MWI. Jordan Water Sector Facts and Figures 2013; Ministry of Water and Irrigation (MWI): Amman, Jordan, 2015.
- Kinzelbach, W.; Aeschbach, W.; Alberich, C.; Goni, I.B.; Beyerle, U.; Brunner, P.; Chiang, W.-H.; Rueedi, J.; Zoellmann, K. A Survey of Methods for Analysing Groundwater Recharge in Arid and Semi-Arid Regions; UNEP: Nairobi, Kenya, 2002; Volume 2, ISBN 92-80702131-3. [Google Scholar]
- Bahls, R.; Holzner, K.; Al Hyari, M.; Al Kurdi, O.; Al-Kordi, R.; Hani, M.; Sawryeh, K. Groundwater Resources Assessment of the A7/B2 Aquifer in Jordan; Ministry of Water and Irrigation (MWI): Amman, Jordan, 2018.
- Wolf, L.; Hötzl, H. Smart—Integrated Water Resources Management (IWRM) in the Lower Jordan Rift Valley; KIT Scientific Publishing: Karlsruhe, Germany, 2011; Volume 7597. [Google Scholar]
- ARD -Washington, DC, US, USAID -Washington, DC, US. Establishment of A Groundwater Monitoring and Enforcement Directorate At The Water Authority Of Jordan; ARD: Amman, Jordan, 2006. [Google Scholar]
- Water Innovation Technology 2018–2022. Available online: https://bit.ly/2knFT3d (accessed on 25 September 2019).
- Butler, J.R.A.; Wise, R.M.; Skewes, T.D.; Bohensky, E.L.; Peterson, N.; Suadnya, W.; Yanuartati, Y.; Handayani, T.; Habibi, P.; Puspadi, K.; et al. Integrating Top-Down and Bottom-Up Adaptation Planning to Build Adaptive Capacity: A Structured Learning Approach. Coast. Manag. 2015, 43, 346–364. [Google Scholar] [CrossRef]
- Sherman, M.H.; Ford, J. Stakeholder Engagement in Adaptation Interventions: An Evaluation of Projects in Developing Nations. Clim. Policy 2014, 14, 417–441. [Google Scholar] [CrossRef]
- Brown, V.A. Leonardo’s Vision: A Guide to Collective Thinking and Action; Brill Sense: Leiden, The Netherlands, 2008. [Google Scholar]
- Burns, D. Participatory Systemic Inquiry. IDS Bull. 2012, 43, 88–100. [Google Scholar] [CrossRef] [Green Version]
- Smeds, R.; Haho, P.; Alvesalo, J. Bottom-up or top-down? Evolutionary change management in NPD processes. Int. J. Technol. Manag. 2003, 26, 887. [Google Scholar] [CrossRef]
- Pahl-Wostl, C. A conceptual framework for analysing adaptive capacity and multi-level learning processes in resource governance regimes. Glob. Environ. Chang. 2009, 19, 354–365. [Google Scholar] [CrossRef]
- MWI. National Water Strategy of Jordan 2016–2025; Ministry of Water and Irrigation (MWI): Amman, Jordan, 2016.
- El-Naser, H. Groundwater Resources of the Deep Aquifer Systems in NW-Jordan: Hydrogeological and Hydrogeochemical Quasi 3-Dimensional Modelling. Ph.D. Thesis, Wurzburg University, Würzburg, Germany, 1991. [Google Scholar]
- Subah, A.; Hobler, M.; HajAli, Z.; Khalifa, N.; Momani, T.; Atrash, M.; Hijazi, H.; Ouran, S.; Jaber, A.; Tarawneh, R. Hydrogeological Proposal for the Delineation of a Groundwater Protection Area for the Wadi Al Arab Well Field; Water Authority of Jordan (WAJ) and Federal Institute for Geosciences and Natural Resources (BGR): Hannover, Germany, 2006.
- Danert, K.; Gesti Canuto, J. Professional Water Well Drilling: A UNICEF Guidance Note; The Rural Water Supply Network (RWSN): St. Gallen, Switzerland, 2016. [Google Scholar] [CrossRef]
- Harter, T. Water Well Design and Construction; University of California: Oakland, CA, USA, 2003; Volume 8086. [Google Scholar]
- Moh’d, B.K. The Geology of Irbid and Ash Shuna Ash Shamaliyya (Waqqas): Map Sheets No. 3154-II and 3154-III; Natural Resources Authority: Amman, Jordan, 2000. [Google Scholar]
- Rossetto, R.; De Filippis, G.; Borsi, I.; Foglia, L.; Cannata, M.; Criollo, R.; Vázquez-Suñé, E. Integrating free and open source tools and distributed modelling codes in GIS environment for data-based groundwater management. Environ. Model. Softw. 2018, 107, 210–230. [Google Scholar] [CrossRef]
- Alqadi, M.; Margane, A.; Hamdan, I.; Al Kordi, R.; Hiasat, T.; Al Wriekat, M.; Maharmeh, H.; Bali, A.; Taha, W.; Mrayyan, K.; et al. Wadi Al Arab Wellfield Management Report—Version 2; Ministry of Water and Irrigation (MWI): Amman, Jordan, 2018.
- NEPCO. National Electric Power Company: Annual Reprot 2017; NEPCO: Amman, Jordan, 2017. [Google Scholar]


| ID | Name | Latitude “N” | Longitude “E” | Elevation [m asl] | Completion Date |
|---|---|---|---|---|---|
| AE1007 | WA 1 | 32°36′41.05819” | 35°39′25.91936” | 9.42 | Sep 1982 |
| AE1008 | WA 2 | 32° 37′12.81401” | 35°39′30.96736” | −35.36 | Sep 1982 |
| AE1009 | WA 3 | 32° 37′26.67630” | 35°39′52.15763” | −26.08 | Nov 1982 |
| AE3020 | WA 3A | 32°37′26.37884” | 35°39′52.12241” | −25.87 | Jun 2009 |
| AE1010 | WA 4 | 32°37′57.04019” | 35°40′18.63580” | 19.56 | Sep 1982 |
| AE1011 | WA 5 | 32°35′48.60537” | 35°40′01.84178” | 47.00 | Jan 1983 |
| AE3001 | WA 6 | 32°35′43.46482” | 35°40′07.20160” | 63.57 | Oct 1999 |
| AE3005 | WA 8 | 32°37′01.94312” | 35°39′20.06533” | −14.89 | Oct 2002 |
| AE3006 | WA 9 | 32°35′41.63346” | 35°40′03.82200” | 79.287 | Feb 2003 |
| AE3016 | WA 10 | 32°35′33.11840” | 35°40′11.48428” | 85.63 | Mar 2008 |
| AE3017 | WA 11 | 32°36′01.24016” | 35°40′01.28220” | 74.65 | Dec 2007 |
| AE3034 | WA 11 A | 32°36′01.35869” | 35°40′00.81987” | 73.93 | Mar 2016 |
| AE3018 | WA 12 | 32°37′17.37891” | 35°39′44.09322” | −40.89 | Dec 2007 |
| AE3019 | WA 13 | 32°36′34.43015” | 35°40′04.71635” | 104.87 | Apr 2008 |
| AE3042 | WA 13A | 32°36′34.52057” | 35°40′04.92756” | 104.87 | Feb 2017 |
| AE3021 | WA 14 | 32°36′14.04827” | 35°39′58.57560” | 70.98 | Jun 2009 |
| AE3024 | WA 15 | 32°36′57.18547” | 35°39′35.25914” | 32.58 | Jul 2014 |
| AE3027 | WA 16 | 32°36′44.95781” | 35°39′48.68497” | 71.77 | Sep 2014 |
| AE3030 | WA 17 | 32°37′38.36044” | 35°40′06.67220” | −34.31 | Mar 2015 |
| AE3035 | WA 18 | 32°37′47.36505” | 35°40′17.02858” | 12.49 | Mar 2016 |
| AE3043 | WA 19 | 32°35′55.26102” | 35°40′18.24177” | 109.59 | May 2017 |
| Formation | Symbol | Lithology | Thickness [m] | Aquifer Unit |
|---|---|---|---|---|
| Wadi Shallala | B5 | Chalky and marly limestone with glauconite | 0–550 | B4/B5 |
| Um Rijam | B4 | Limestone, chalk, chert | 0–310 | |
| Muwaqqar | B3 | Chalky marl, marl, limestone chert | 80–320 | B3 |
| Amman-Al Hisa | B2 | Limestone, chert, chalk, phosphorite | 20–140 | A7/B2 |
| Wadi Um Ghudran | B1 | Dolomitic marly limestone, marl, chert, chalk | 20–90 | |
| Wadi As Sir | A7 | Dolomitic limestone, limestone, chert, marl | 60–340 |
| Measurement Type | Before Development | Aim to Be Achieved |
|---|---|---|
| Static water level | Measured but not recorded or recorded just in the drilling time | To be measured and recorded when the pump is turned off |
| Dynamic water level | Not systematic measurement | To be measured monthly |
| yield (m3/hr) | Not systematic measurement | To be measured monthly |
| Abstracted volume of each well | Not measured | The flow meter reading should be collected monthly |
| Electricity consumption of each well | Not recorded | To be measured monthly |
| Pressure | Not for all wells, not collected systematically | To be collected monthly |
| Well Name | 2012 | 2013 | 2014 | 2015 | 2016 | 2017 | 2018 |
|---|---|---|---|---|---|---|---|
| WA 1 | 2,6,14 | 3,2 | 19 | 5 | 3 | ** | 1,1 |
| WA 2 | 2,3 | 1 | 1 | – | 2,2 | 1 | ** |
| WA 3 | – | – | 1 | – | ** | ** | ** |
| WA 4 | 4,1 | – | – | 4,1,1 | ** | 1 | ** |
| WA 5 | 2,1,1 | 3,1 | – | – | ** | 1,1 | 1 |
| WA 6 | 7,3,3 | 6 | 2 | – | 2 | 2,1 | ** |
| WA 8 | 2 | – | 2,2 | 2,32,1,1,1 | 1 | 1,1,1 | 1 |
| WA 9 | 2,6 | – | 5,3 | – | ** | 1 | ** |
| WA 10 | 8,2,2 | 2 | – | 1,1,2,2 | ** | 1 | ** |
| WA 11 | 2,16 | – | 1,3 | – | ** | X | X |
| WA 12 | – | 5 | – | – | ** | 1 | ** |
| WA 13 | 4 | – | – | 1 | 3 | X | X |
| WA 3a | 18 | – | 3 | – | ** | 2,1 | 1 |
| WA 14 | 4,6,1,4,13,2 | 1,2 | 1 | 2,2,1 | ** | 1 | 1,2 |
| WA 16 | X | X | 2,2 | – | ** | 3 | ** |
| WA 15 | X | X | X | 3 | ** | 4 | 1 |
| WA 17 | X | X | X | ** | ** | ** | 1 |
| WA 11a | X | X | X | X | 3 | ** | ** |
| WA 18 | X | X | X | X | ** | 1,1 | 1 |
| WA 13a | X | X | X | X | X | ** | ** |
| Total well stop for maintenance [days] | 141 | 26 | 47 | 62 | 16 | 26 | 11 |
| Total maintenance intervals/Times | 27 | 10 | 13 | 18 | 7 | 19 | 10 |
| Average days stopped for each maintenance | 5.2 | 2.6 | 3.6 | 3.4 | 2.3 | 1.3 | 1.1 |
© 2019 by the authors. Licensee MDPI, Basel, Switzerland. This article is an open access article distributed under the terms and conditions of the Creative Commons Attribution (CC BY) license (http://creativecommons.org/licenses/by/4.0/).
Share and Cite
Alqadi, M.; Margane, A.; Al Raggad, M.; Subah, H.A.; Disse, M.; Hamdan, I.; Chiogna, G. Implementation of Simple Strategies to Improve Wellfield Management in Arid Regions: The Case Study of Wadi Al Arab Wellfield, Jordan. Sustainability 2019, 11, 5903. https://doi.org/10.3390/su11215903
Alqadi M, Margane A, Al Raggad M, Subah HA, Disse M, Hamdan I, Chiogna G. Implementation of Simple Strategies to Improve Wellfield Management in Arid Regions: The Case Study of Wadi Al Arab Wellfield, Jordan. Sustainability. 2019; 11(21):5903. https://doi.org/10.3390/su11215903
Chicago/Turabian StyleAlqadi, Mohammad, Armin Margane, Marwan Al Raggad, HE Ali Subah, Markus Disse, Ibraheem Hamdan, and Gabriele Chiogna. 2019. "Implementation of Simple Strategies to Improve Wellfield Management in Arid Regions: The Case Study of Wadi Al Arab Wellfield, Jordan" Sustainability 11, no. 21: 5903. https://doi.org/10.3390/su11215903
APA StyleAlqadi, M., Margane, A., Al Raggad, M., Subah, H. A., Disse, M., Hamdan, I., & Chiogna, G. (2019). Implementation of Simple Strategies to Improve Wellfield Management in Arid Regions: The Case Study of Wadi Al Arab Wellfield, Jordan. Sustainability, 11(21), 5903. https://doi.org/10.3390/su11215903