Article

Urbanisation of Protected Areas within the European Union—An Analysis of UNESCO Biospheres and the Need for New Strategies

1
School of Biology and Environmental Science, University College Dublin, Belfield, Dublin 4, Ireland
2
Parks and Landscape Services, Dublin City Council, Civic Offices, Wood Quay, Dublin 8, Ireland
3
School of Archaeology, University College Dublin, Belfield, Dublin 4, Ireland
4
Earth Institute, University College Dublin, Belfield, Dublin 4, Ireland
5
School of Architecture, Planning and Environmental Policy, University College Dublin, Belfield, Dublin 4, Ireland
*
Author to whom correspondence should be addressed.
Sustainability 2019, 11(21), 5899; https://doi.org/10.3390/su11215899
Submission received: 2 August 2019 / Revised: 6 October 2019 / Accepted: 16 October 2019 / Published: 24 October 2019
(This article belongs to the Special Issue Urban Sprawl and Sustainability)

Abstract

:
The UNESCO Biosphere Reserves (BRs) comprise core conservation areas supported by a buffer and transition zone of sustainable development. This zoning can help manage urbanisation around conservation areas. Although it is UNESCO policy to measure the number of BRs that have interactions with urban areas, there has been no systematic assessment of urban biospheres since 2008. This research addresses this deficit by measuring the extent of urbanisation of all designated BRs within the European Union (EU). Using the Copernicus Urban Atlas, the proximity of BRs to Functional Urban Areas (FUA) was determined. The results show that 46% (76/167) of BRs are situated within FUAs, including 11% (18/167) entirely within an FUA. The majority (64%) of EU-28 countries have BRs within FUAs. Urban influences on EU-28 BRs are extensive, as 90% are found within 50 km of an FUA. However, integration with urban areas may be lacking as 14% of EU BRs were adjacent to an FUA. Urban pressures are acute for 11% of EU BRs which had multiple FUAs within a 50 km radius. Therefore, urbanisation of BRs is a widespread challenge and recommendations are provided for BRs to function as an information sharing network and develop a new urban strategy.

1. Introduction

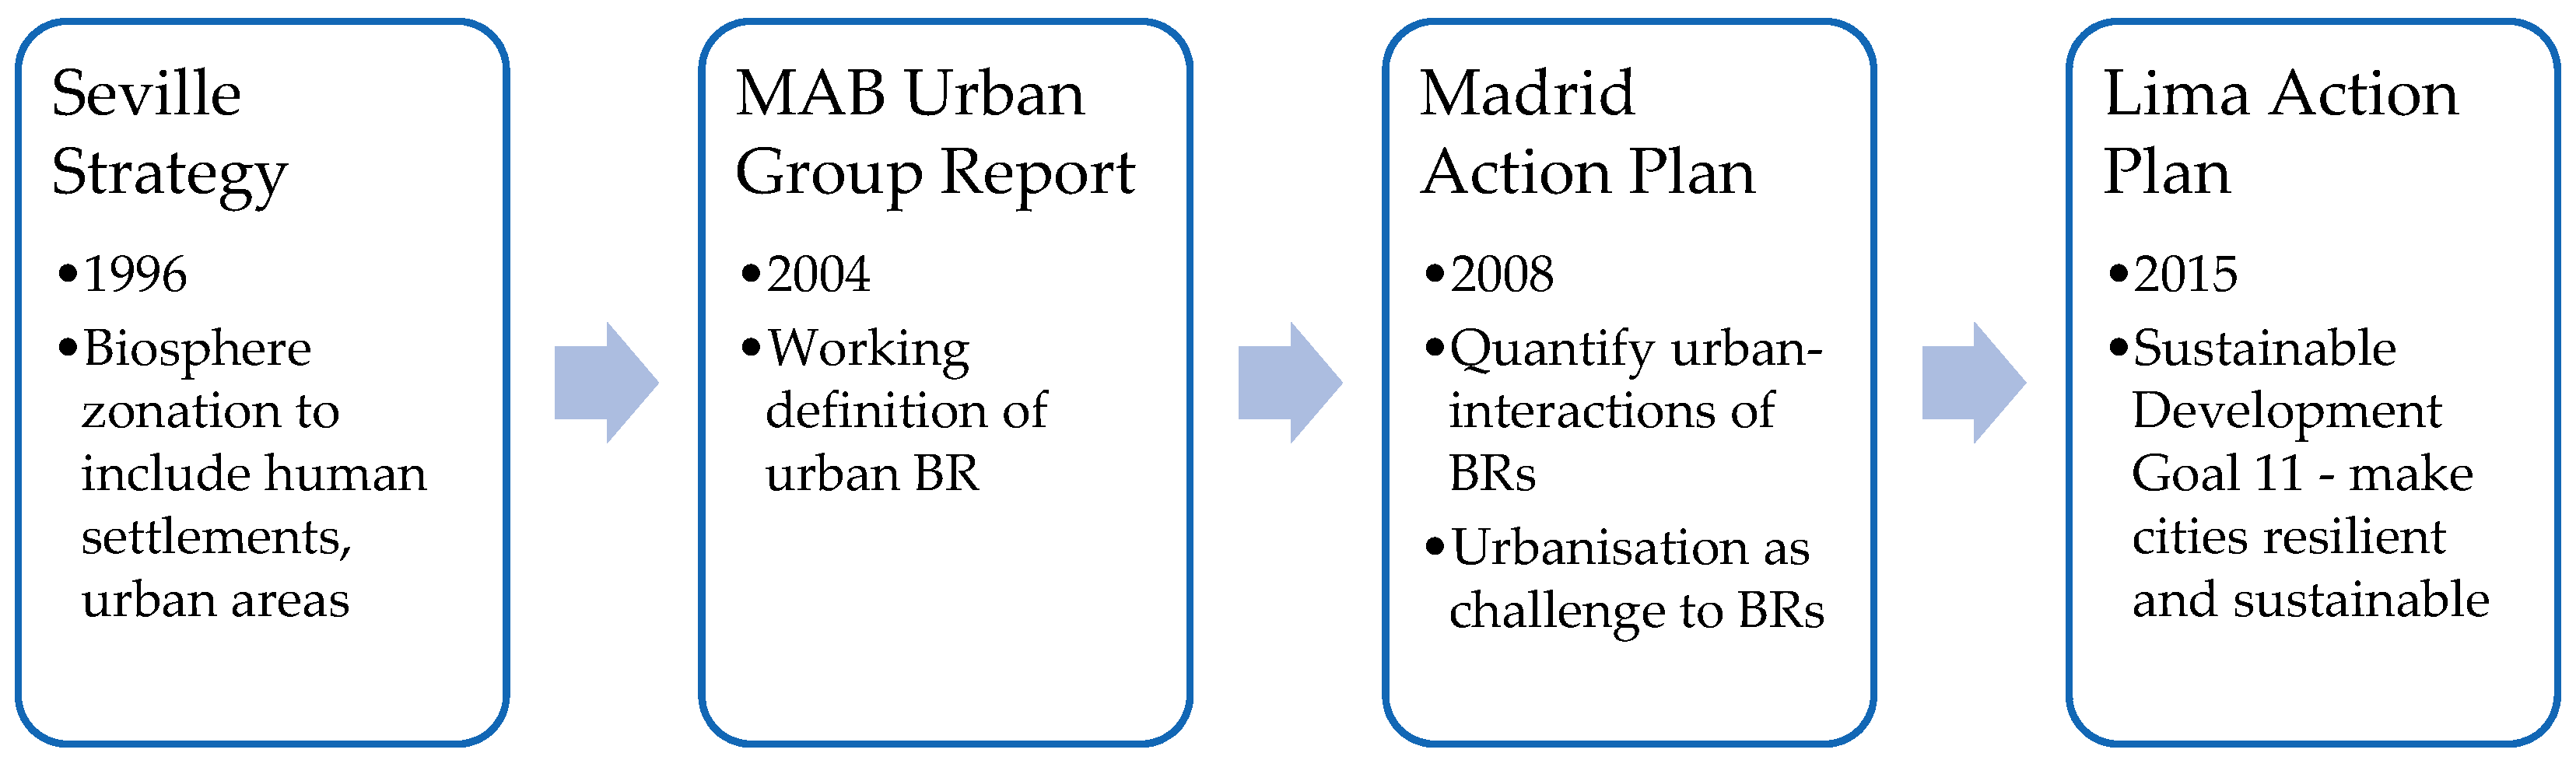
1.1. Application of the Concept of a UNESCO Biosphere Reserve to Urban Areas

The World Network of UNESCO Biosphere Reserves (BRs) comprises 701 sites in 124 countries as of 2019 [1] covering a surface area of over five million square kilometres [2]. Within the Europe Union, BRs are cornerstones of the network of protected areas (PAs) for nature conservation, along with national parks [3] and the Natura 2000 (N2000) sites [4] (“The aim of the Natura 2000 network is to ensure the long-term survival of Europe’s most valuable and threatened species and habitats, listed under both the EU Birds Directive (2009/147/EC) and the Habitats Directive (92/43/EEC)” https://ec.europa.eu/environment/nature/natura2000/index_en.htm. Natura 2000 sites are designated as either Special Protection Areas (SPAs) for the protection of endangered species of wild birds under the terms of the EU Birds Directive or Special Areas of Conservation (SACs) under the terms of the EU Habitats Directive. The term ‘Special Areas of Conservation’ is defined in article 1.1: “special area of conservation means a site of Community importance designated by the Member States through a statutory, administrative and/or contractual act where the necessary conservation measures are applied for the maintenance or restoration, at a favourable conservation status, of the natural habitats and/or the populations of the species for which the site is designated”). Biosphere reserves differ from other types of PAs, as they integrate human activities into PAs to provide a mutual benefit [5]. To achieve the integration of human activity with conservation, BRs are designed through a community-based, integrated approach [6] with a focus on interactions between core conservation zones, buffer zones and more intensively-used areas termed transition zones, which can include urban areas [7], as per the Seville Strategy for BRs [8] (Figure 1). Although it is believed that this approach could be widely used in managing environmental goods and services in towns and cities [8,9], there is a lack of data about the number of BRs that currently incorporate urban areas.
In this study, we investigated the degree of urbanisation across BRs within the twenty-eight countries of the European Union (referred to as EU-28) (The European Union comprised 28 countries as of April 2016, the date for the UNESCO list of BRs used for this study. These countries are: Austria, Belgium, Bulgaria, Croatia, Republic of Cyprus, Czech Republic, Denmark, Estonia, Finland, France, Germany, Greece, Hungary, Ireland, Italy, Latvia, Lithuania, Luxembourg, Malta, Netherlands, Poland, Portugal, Romania, Slovakia, Slovenia, Spain, Sweden and the United Kingdom. As of time of writing this paper, the United Kingdom is in the process of formally exiting the European Union). Previous research [10] analysed urbanisation of PAs, including UNESCO BRs, on a global scale and was an important contribution because it forecasted trends of urbanisation that caused local, but significant, degradation of biodiversity. Although comprehensive in sampling all BRs at that time (2008), the analysis relied on an assumption of concentricity of BRs using a consistent method of buffering of centroids [10]. In the literature, biospheres are depicted schematically as concentric circles [11]—like a “bullseye” or target diagram [12] or egg [13] with the core conservation zone in the centre. In practice, relatively few of the existing BRs are concentric [14,15] and multiple core zones may be designated [9,15,16,17], in accordance with UNESCO policy [8], particularly in an urban context where there is greater fragmentation of habitats [18]. An example of this is Collina Po BR, Turin, Italy (Figure 2a) where the Po River creates a spine for connecting several core zones, each with their own buffer zones, in an overall transition zone of the wider network of the Po valley and its tributaries (http://www.unesco.org/new/en/natural-sciences/environment/ecological-sciences/biosphere-reserves/europe-north-america/italy/collina-po/). The assumption that the BR centroid is within the most protected core zone for nature conservation is tested in our study (Section 2.2.5) through analysis of coincidence with Natura 2000 sites for nature conservation of European Union importance, as these would be expected to form the core zone in the EU-28 [18]. Since 2008, additional datasets with a greater degree of accuracy and consistency have been made available through UNESCO, the European Commission and others [19,20,21,22,23]. Thus, the EU-28 study area was chosen due to the availability of high-quality datasets and uniformity of nature conservation legislation through the Nature Directives and the network of Natura 2000 sites designated under these Directives [24]. This smaller sample allows examination in greater detail of configuration of individual BRs and develops further the analysis of urbanisation of PAs.
The sustainable development aims of BRs require a “bottom-up approach” that works with local conditions [25]. Recognising similarities and differences in BR designations with regard to their proximity to urban areas will hence allow UNESCO to coordinate BRs more effectively when it comes to managing urbanisation [26]. Under the current UNESCO Man and the Biosphere (MAB) programme, through the Lima Action Plan for Biosphere Reserves [27], BRs are committed to the implementation of the UN 2030 Agenda for Sustainable Development, including Goal 11 which states: “Make cities and human settlements inclusive, safe, resilient and sustainable” [28] (Figure 1). This study provides the necessary information to develop a coordinated approach to realising this goal across the network of BRs [18] and to ensure that the BR concept remains relevant to biodiversity conservation.

1.2. Definitions of “Urban” and “Urban Biosphere” in This Study

Designating urban areas as BRs (i.e., “urban biospheres”) has been viewed as a step-change in conceptualizing the BR designation [17,25]. The definition of an “urban biosphere” has been debated for many years by UNESCO [7,18], who established the MAB Urban Group in 1998 to study the the application of the BR principle to ‘urban areas and their hinterlands’ [7,29]. This Group published a working definition:
“…a Biosphere Reserve characterized by important urban areas within or adjacent to its boundaries where the natural, socio-economic and cultural environments are shaped by urban influences and pressures, and set-up and managed to mitigate these pressures for improved urban and regional sustainability.”
[29]
They further stated that “the mere existence of a city or a town in a Biosphere Reserve is not sufficient to call it an Urban Biosphere Reserve”. Every BR must have settlements within their transition zone and lack of resident human population is the main reason for withdrawal of European BRs from the World Network [30]. The MAB Urban Group stated that “the issue is of defining the relative importance of the urban elements in the Biosphere Reserve” [29]. They proposed that “relative importance” could possibly be assessed as a function of several measurable factors in the Biosphere Reserve: percentage of urban land cover, rate of urbanisation and urban sprawl, distance to major urban areas, percentage of people living in urban areas compared to the country side, impacts of urban areas and the urban population on the Biosphere Reserves [29]. Similarly, in the scientific literature an urban area has been defined as “a cultural landscape characterized by high population density and extensive impervious surface area, with different land use and land cover types together forming a dynamic patch mosaic” [31]. In most cases, “high human population density and extensive impervious surface area are two salient factors that sufficiently define what is urban and related to all major ecological and environmental characteristics of urban systems either directly or indirectly” [31]. Therefore, urban land use, proximity to major urban areas, and populations are key factors in both definitions.
In this study, the definition of “urban” is based on Functional Urban Area (FUA) units—a concept agreed between the OECD and the EU as:
“the contiguous set of municipalities which have at least 50% of their population in the urban centre (defined as the contiguous set of urban cells of 1 km2 with a population density of at least 1500 inhabitants/km2 and a total population of at least 50,000 inhabitants), plus the surrounding municipalities for which at least 15% of the employed persons commute to the main municipality of the urban agglomeration)… the gridded population data are used to define urbanised areas or ‘urban high-density clusters’ over the national territory, ignoring administrative borders, [and this data] comes from the Corine Land Cover dataset”.
[32]
This definition is both uniform and administratively applicable through the available data online [12]. A BR was classified as “urban” if it was partially or entirely contained within a functional urban Area (FUA). This distinguishes BRs with small settlements in their transition zones from ones that contain major urban centres. Thus, the extent and degree of urbanisation of BRs can be assessed and “urban biospheres” can be recognised as such.

1.3. Urbanisation Processes and Protected Areas

Urbanisation refers to the process by which rural areas take on urban characteristics and also refers to increased concentration of people in human settlements [33,34]. It is an important feature of the Anthropocene [35]. Urbanisation is one of the main threats to biodiversity globally [36] and within the EU where cities continue to expand [37]. The results of several pan-European studies agree that Europe has witnessed a widespread increase in urban sprawl, mainly in the form of “discontinuous urban fabric” [38] (“The discontinuous urban fabric class is assigned when urban structures and transport networks associated with vegetated areas and bare surfaces are present and occupy significant surfaces in a discontinuous spatial pattern… [that] range from 30 to 80 % land coverage. The discrimination between continuous and discontinuous urban fabric is set from the presence of vegetation visible in the satellite image illustrating either single houses with gardens or scattered apartment blocks with green areas between them. The density of houses is the main criterion to attribute a land cover class to the built-up areas or to any other class”) [38] (as defined by Corine Land Class Cover Level 3, land class 1.1.2.) [39]. Most people in the EU live in urban areas [37] and, therefore, their most probable and frequent interaction with nature will be through local urban ecosystems.
Urban effects on PAs range from global to local, with two-thirds of the effects essentially limited to within 50 km of an urban area [34]. Therefore, 50 km is considered to be a “zone of influence” of urbanisation and also a “reasonable distance to capture ecological interactions between the PA and its surroundings” [34,40]. Urbanisation alters the composition and spatial arrangement of landscape elements and these changes affect the biodiversity, ecosystem functioning and environmental quality, as well as human behaviour, community structure, and social organization [31]. As urban density and impervious surface area increases, sensitive species decrease while species that can exploit such conditions move in [41]. This necessitates a change in conservation strategies from land acquisition to restoration of managed and ruderal habitats [41]. If BRs are urbanising, adaptive management approaches are required to link social decision-making processes with landscape dynamics to continue to achieve conservation objectives [42].
The previous global UNESCO strategy for the management of BRs, known as the Madrid Action Plan [43], recognised rapid urbanisation as a “major challenge” for BRs and included an action to “facilitate the integration of urban areas into BRs” (Figure 1) [12]. Although it was a target of the Madrid Action Plan to quantify “the number of BRs with interactions with urban areas” [43], the current degree of urbanisation of BRs across the EU is still largely unknown [44]. Urbanisation of global PAs (including BRs) and of European N2000 sites has been analysed, but in these studies either the spatial arrangement of the PAs or the spatial arrangement of the urban area has been approximated [34,45]. Standardized methods and data for the EU are needed for assessing land cover change for biodiversity monitoring [39] and are increasingly available through EU initiatives [12]. Spatial analysis of BRs in relation to urban areas of the EU is necessary to: (a) find ways to standardize methods and data to assess land cover change within the EU for monitoring of habitats and biodiversity [39]; (b) understand how European BRs could function as an information-sharing network to influence and manage interactions between urban and PAs; (c) fulfil UNESCO’s strategy for BRs [43]; (d) identify pressures and impacts from urbanisation so as to protect biodiversity both within and near urban areas and (e) develop an urban strategy for BRs.
Vulnerability of PAs, such as BRs, is linked to several factors: (1) if a PA is small or poorly situated in relation to a few factors (species-area relationships, minimum dynamic size, catchment); (2) if a PA is, or is likely to be in future, in close proximity to dense human populations or intense land use; (3) if the surrounding human populations lack incentives or resources to further ecological goals for PA [46]. Periodic reviews have resulted in the extension of smaller, first-generation BRs to address the critical importance of species-area relationships [30]. Total BR area of urban and non-urban BRs is compared in this study to address the first factor. The second factor is analysed through measurement of proximity to FUAs and accessibility of BRs. Since 1996, under the Seville Strategy [8], UNESCO has promoted BRs as a tool to achieve sustainable development while furthering ecological goals and that the BR designation is an outcome of the “construction of a common view” through dialogue [6]. Incentives and resources for ecological goals can arise out of the BR designation [47]. European Union capital cities have some of the highest levels of global wealth, with the relative importance of the capital city in the national economy often inversely related to the population size of the EU Member State in question [37]. Therefore, BRs within capital cities were identified as they may be less vulnerable to negative effects of urbanisation than other urban BRs due to the fact of these advantages. These factors of the vulnerability of BRs to urbanisation effects are important to consider when developing a strategy to manage urbanisation across the BR network.

1.4. Objectives and Aims

Urbanisation has been identified as a principal driver to key ecosystem changes to UNESCO Biospheres (BRs) since 2008 [43]. However, the extent of urbanisation of BRs has not been quantified in relation to their current locations and zonation. The overall objective of this study is to analyse the current vulnerabilities of UNESCO Biospheres in the EU-28 to urbanisation in terms of key factors identified in the literature and UNESCO MAB policy (Figure 1). To address this, we described the spatial configuration of the network of BRs in the EU-28; and we quantified the degree of urbanisation of UNESCO Biosphere Reserves (BRs) within the European Union (EU-28) through analysis of the coincidence of BRs within the EU-28 with Functional Urban Areas (FUAs). Our specific aims were: (1) to analyse this coincidence in terms of regional, national, EU-wide and UNESCO policy contextual influences; (2) to test assumptions in the literature that BR centroids represent core nature conservation zones remote from human activities through spatial analysis of coincidence of them with Natura 2000 sites protected under EU law; (3) to measure potential urbanisation pressures on BRs through spatial analyses of BR size, proximity of one or multiple FUAs, accessibility of BRs from the city centre of the nearest FUA, population of nearest FUA and possible transboundary effects from FUAs in other countries. It is necessary that the UNESCO BR network in Europe is aware of these realities regarding the interaction of BRs with urban areas in Europe to develop an evidence-based integrated urban strategy for addressing biodiversity conservation in BRs.

2. Materials and Methods

2.1. Datasets

It has been recognized by UNESCO that clear maps are a necessity for carrying out the essential functions of a BR and for monitoring and understanding key challenges—including urbanisation—of the Madrid Action Plan [48]. In the periodic review process, BRs are required to submit digital map files since 2013 [49]. However, they are unavailable from UNESCO in downloadable format for analysis in GIS [22]. The datasets used in this study to compile a pan-EU database of UNESCO BRs and their attributes are all freely available. All BR descriptions are licensed under the CC-BY-SA IGO 3.0 license and, therefore, the database created for this study is available in Supplementary Materials. Data consulted are listed below in Table 1.
Biosphere Smart (Table 1, B) is an open platform. It is currently the most comprehensive spatial dataset of the boundaries and zonation of BRs globally [44] and UNESCO MAB approved it as a key communication tool for BR research and mapping [48,50]. Biosphere Smart is advantageous to use for analysis as BR boundaries are based on the available information submitted to UNESCO via periodic review reports and national MAB Committees [51,52] and, therefore, the accuracy of these is good [44]. Biosphere Smart offers a choice of base layers (Google road and Google satellite maps) to analyse the landscape features of a BR. Its functions include a measurement tool which provides the ability to accurately determine the distance in kilometres between the BR boundary and other features, including the extent of the nearest FUA through comparison with the Urban Atlas 2012 (Table 1, H).
There were several challenges and limitations of the data sources encountered in this study (Section 2.2.2). Updates of central databases are dependent on information which can vary in quality and currency supplied by national MAB committees to UNESCO [52] and by each partner organisation to the WDPA (Table 1, F). The UNESCO database (Table 1, A) is updated annually [22]. The WDPA (Table 1, F) is updated monthly [21]. Populations of BRs are collected by UNESCO through the periodic review process [49] but are not disseminated [22]. Analysis using Biosphere Smart has limitations due to lack of updates and that the BR boundary (polygon) data cannot be downloaded. The BR layer (polygon dataset) has not been fully updated [51] since 2013. The BR centroids layer (point data) was last updated in 2015–2016 [52] following the report of 9 June 2015 by the International Co-ordinating Council of MAB based on the figures stated in the Legend of the portal [50]. All EU BRs in the UNESCO database from April 2016 (Table 1, A) are included in Biosphere Smart following updates in 2016 and 2017 [52]. However, boundaries were unavailable for 26 BRs (16%), as 22 BRs had centroids only and 4 BRs had out-of-date boundaries mapped. For these, the BR boundary had to be located by reference to maps downloaded in a .pdf format from either UNESCO MAB webpages (17/167) (Table 1, C) or official BR websites (Table 1, D) or reports (9/167) obtained using Google Scholar and listed in Supplementary Materials. Official websites of UNESCO BRs to obtain BR boundaries (all accessed in May 2019) include: Bulgarian Ministry for the Environment website and report obtained in English with hyperlinks to official websites; Archipelago Sea Area and North Karelia BR websites in Finland; Gorges du Gardon BR website; Wadden Sea UNESCO World Heritage Site website; Tuchola Forest BR website; Paúl do Boquilobo BR website; and Santana Madeira BR website.

2.2. Methods to Determine Attributes of BRs

2.2.1. Centroid Location

Centroid of each BR was established by converting latitude/longitude coordinates from the UNESCO database (Table 1, A) into decimal degrees and mapping in ArcMap 10.4. This resulted in the discovery and correction of errors in the UNESCO data which were notified to UNESCO MAB in 2017. Centroids were checked with latitude and longitude from point data in Biosphere Smart and by viewing these against Google Maps (terrain view) in Biosphere Smart [50]. Biosphere reserves with centroids located on islands (Table 1, C) are listed in Appendix A.

2.2.2. Boundary

Based on methods of a previous study [1], we attempted to obtain polygon data for BR boundaries from the WDPA [21] (Table 1, F). This was challenging, as the WDPA contained 5 different terms in the column for designations in English (DESIGN_ENG) for describing UNESCO BRs (Table 2). To select only those within the EU-28, a query containing the ISO-3 codes for all EU countries (“AUT”, “BEL”, “BGR” … “SWE”) was used. Polygon files were available for only 19% (31/167) of EU BRs upon last download (August 2018). Furthermore, it was discovered that there are considerable time lags involved in updating the WDPA database, due to the delays in when information was submitted to WDPA, as they rely on national authorities to update them on changes in protected areas [21]. Therefore, both the WDPA polygon and point datasets were not useful for this study. Polygon data were unavailable for download from UNESCO [53]. Following these unsuccessful attempts to obtain consistent boundary data, the boundary for each BR was located using the viewer in Biosphere Smart [50] or by using maps from supplementary sources (Section 2.1).

2.2.3. Area

The total area in hectares for each BR was obtained from the UNESCO MAB database [22] (Table 1, A). Errors were encountered for two German BRs—due to the fact of an error in data entry [54] and the other due to the fact of an increase in the transition area following a periodic review in 2014 [55] which had not yet been updated on the UNESCO MAB database [22]. Areas of BRs designated after 2013 were checked against those in Biosphere Smart to determine any discrepancies which could affect boundary measurements. It was necessary to use centroids to compare locations of the 13% (22/167) of BRs for which boundaries were unavailable in Biosphere Smart [50] with other official map sources to verify data on BR area. Comments on BR size criteria in the scientific literature were used to categorise BRs by area (Table 3). Variation in BR area was analysed on a regional basis, over time and with regard to degree of urbanisation (Section 2.3).

2.2.4. Year of Designation or Last Periodic Review

Every ten years, a BR has to undertake a periodic review process to keep its UNESCO designation [8] and reflect and report on progress made in terms of knowledge, skills and expertise regarding resource and ecosystem management [30,49]. This allows nations to adjust BR boundaries and revise zonation to support the implementation of new UNESCO policies [30]. The UNESCO policies on urban biospheres have changed over time (Figure 1). Therefore, the year of last periodic review may influence BR characteristics such as: location, size, and proximity to urban areas. These characteristics were analysed in relation to the relevant UNESCO policy based on information in the UNESCO database (Table 1, A) on the latest year of periodic review or, for BRs which have never had a periodic review, year of designation [22]. The results are reported in Section 3.1.3.

2.2.5. Coincidence with Natura 2000 Sites

There has been an assumption in the literature of concentric zonation of BRs following a centripetal model [56,57], where the core zone of an “ideal biosphere” forms the centre and is an area (or set of multiple areas) meant to secure long-term protection from development, ideally by legal means [56]. An example of this is Gorge of Samaria BR on the Greek island of Crete (Figure 2c), an older BR where the core zone is surrounded by buffer and transition zones in the classic “bullseye” pattern. A previous study of BRs and urbanisation on a global level used centroid data to generate circular forms based on known BR areas [10]. We tested coincidence of BR centroids with N2000 sites (Table 1, G) designated under the EU Habitats and Birds Directives [16], to examine if the BR centroid is actually in the zone of highest legal protection for the EU. Distance from the BR centroids to the nearest N2000 site was measured at intervals (1; 100; 500; 1000; 2000 m) to identify the nearest N2000 sites within that geographic range of the BR centroid (Supplementary Materials). Biosphere centroids within 1 m and 100 m of N2000 boundaries were interpreted as being within the sites to address possible issues with spatial resolution [20].

2.3. Indicators for Determining Degree of Urbanisation of BRs

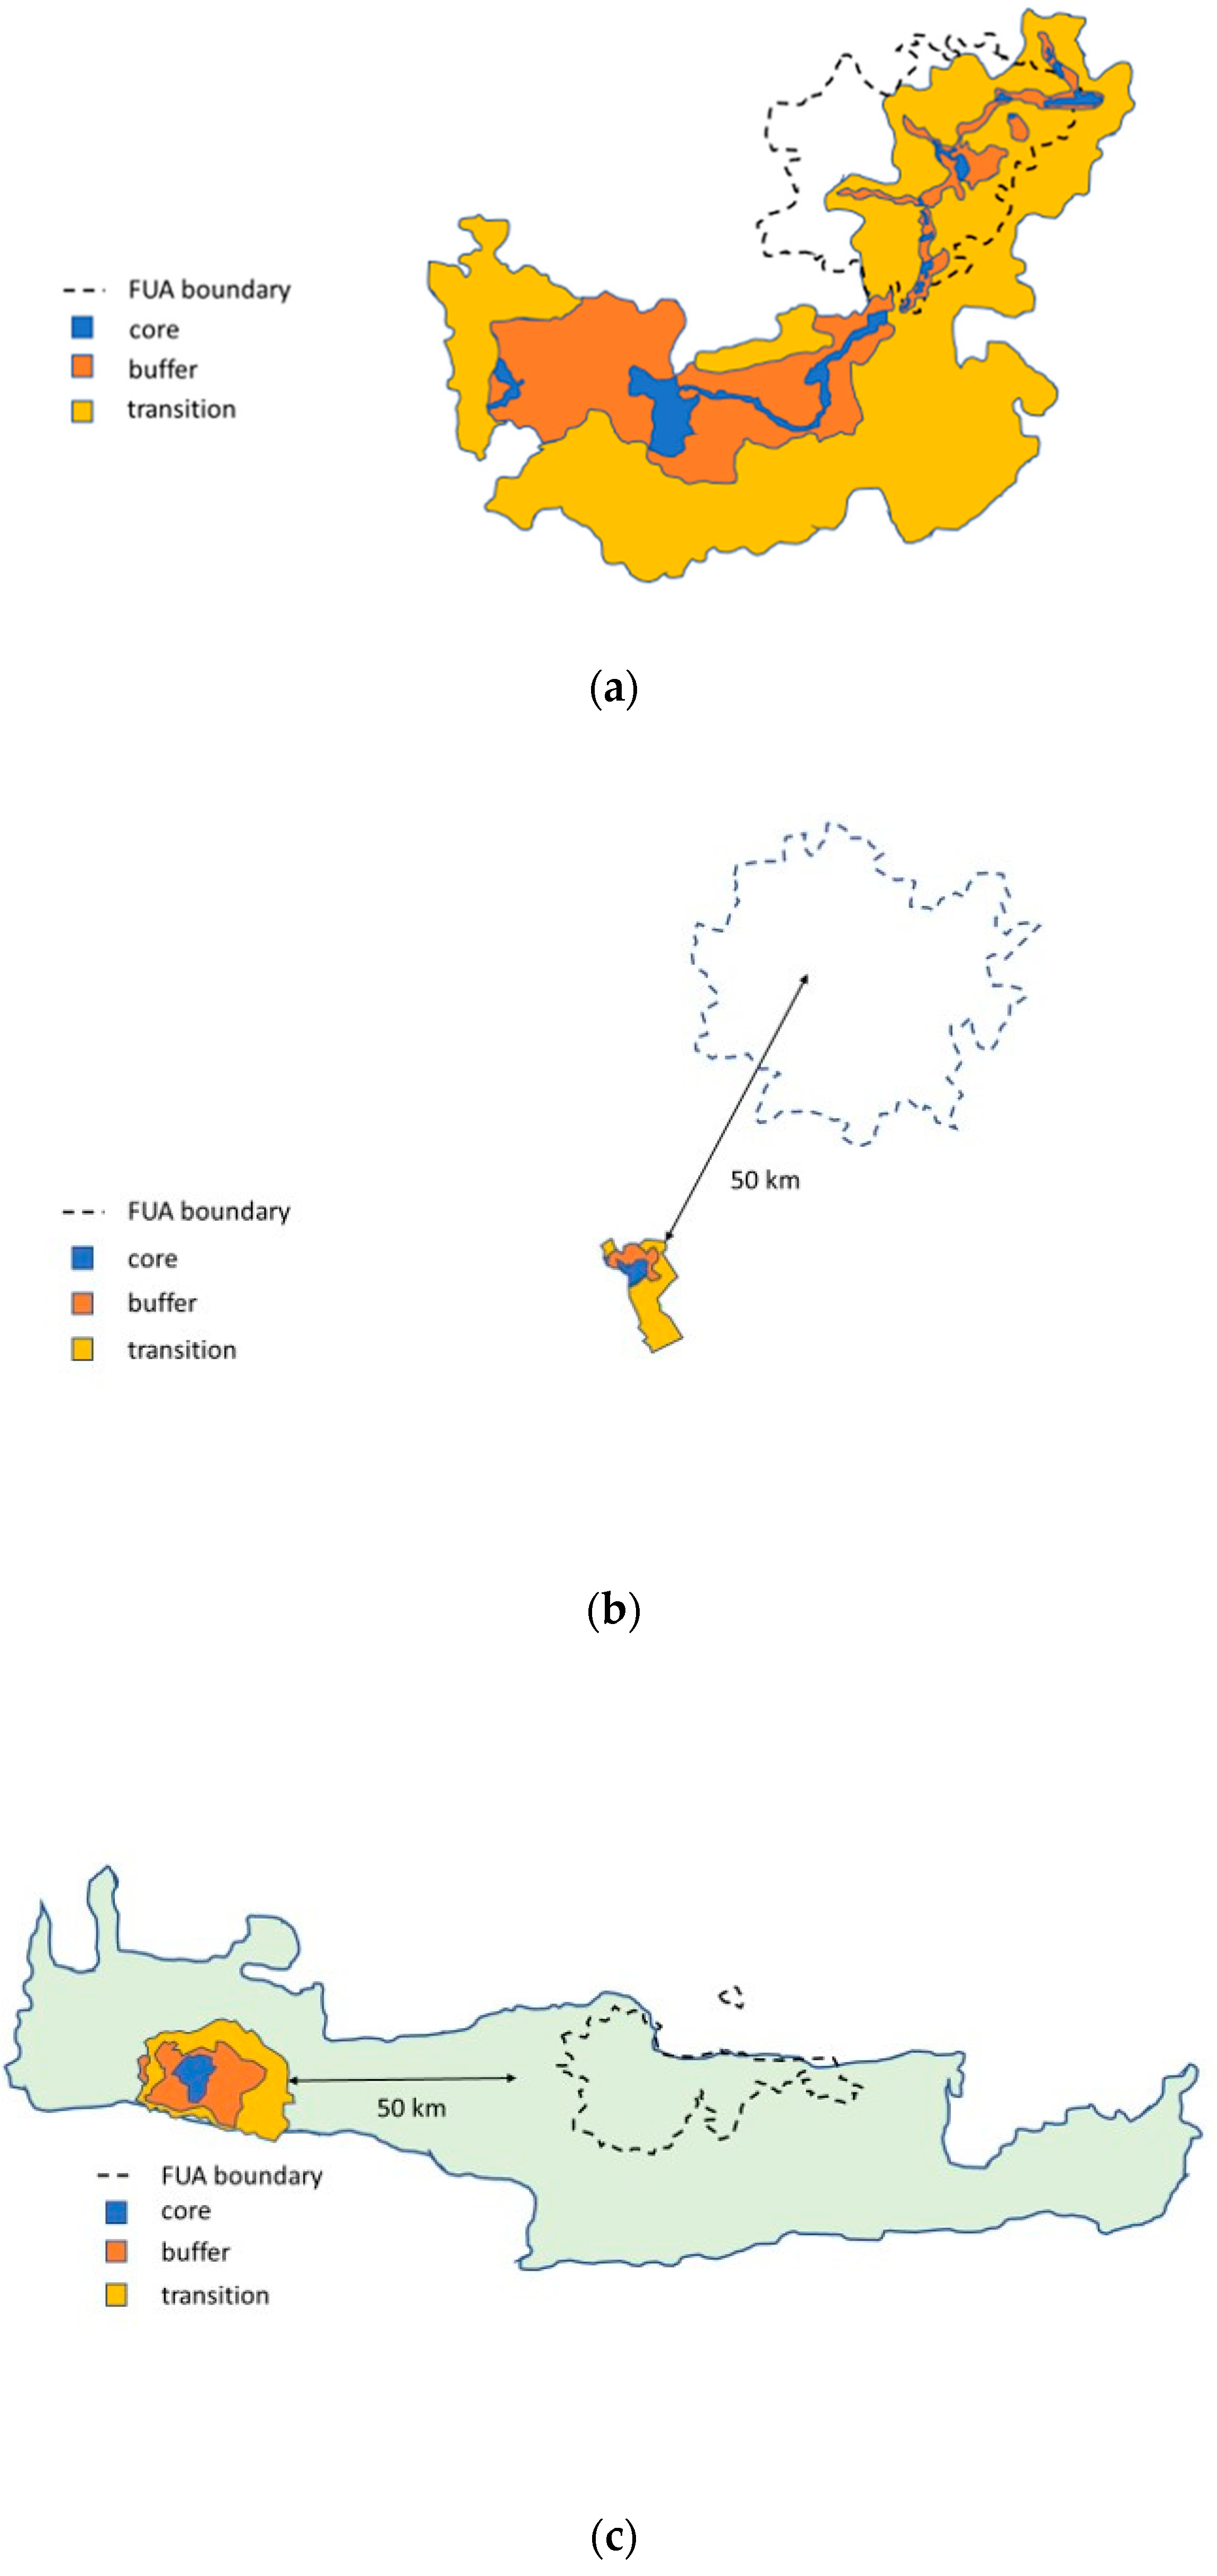
2.3.1. Proximity to FUAs and Urban Status of BRs

Urban status was defined by coincidence of any portion of a BR with an FUA (Figure 2a), and such BRs were recorded as “urban”, whereas those with no coincidence at all were recorded as “non-urban”. Biospheres which were entirely within an FUA were noted as a subcategory, but degree of urbanisation could not be measured without access to polygon data. If a BR was outside of the FUA (Figure 2b,c), the settlements on the boundary of that BR were located in Biosphere Smart (Google Maps layer) [50] in all cardinal directions using either boundaries already mapped in Biosphere Smart or supplementary official BR maps (Section 2.1). Next, the closest settlement within an FUA was located using the Urban Atlas 2012 viewer [19] (Table 1, H), and distance in kilometres “as the crow flies” from this FUA settlement to the outermost settlement of the BR was recorded using the measurement tool in Biosphere Smart. Those BRs which are greater than the “zone of influence” of 50 km of an FUA are recorded separately (Figure 2c). If two or more FUAs were found to be within the “zone of influence” of urbanisation of 50 km [34,40] of a BR, they were all recorded to illustrate multiple pressure points of urbanisation, and the closest FUA was listed first (Table 4). Where two FUAs were found to be equidistant (within a range of 1 km), the FUA with the highest population was listed first to indicate the highest scale of urbanisation processes.
Examples of biosphere zones—core, buffer, and transition—and the spatial relationships between BRs, FUAs, and the “zone of influence” are illustrated below (Figure 2a–c) using three BRs included in this study: Collina Po BR, Italy; Babia Gora BR, Poland; and Gorge of Samaria BR, Greece.

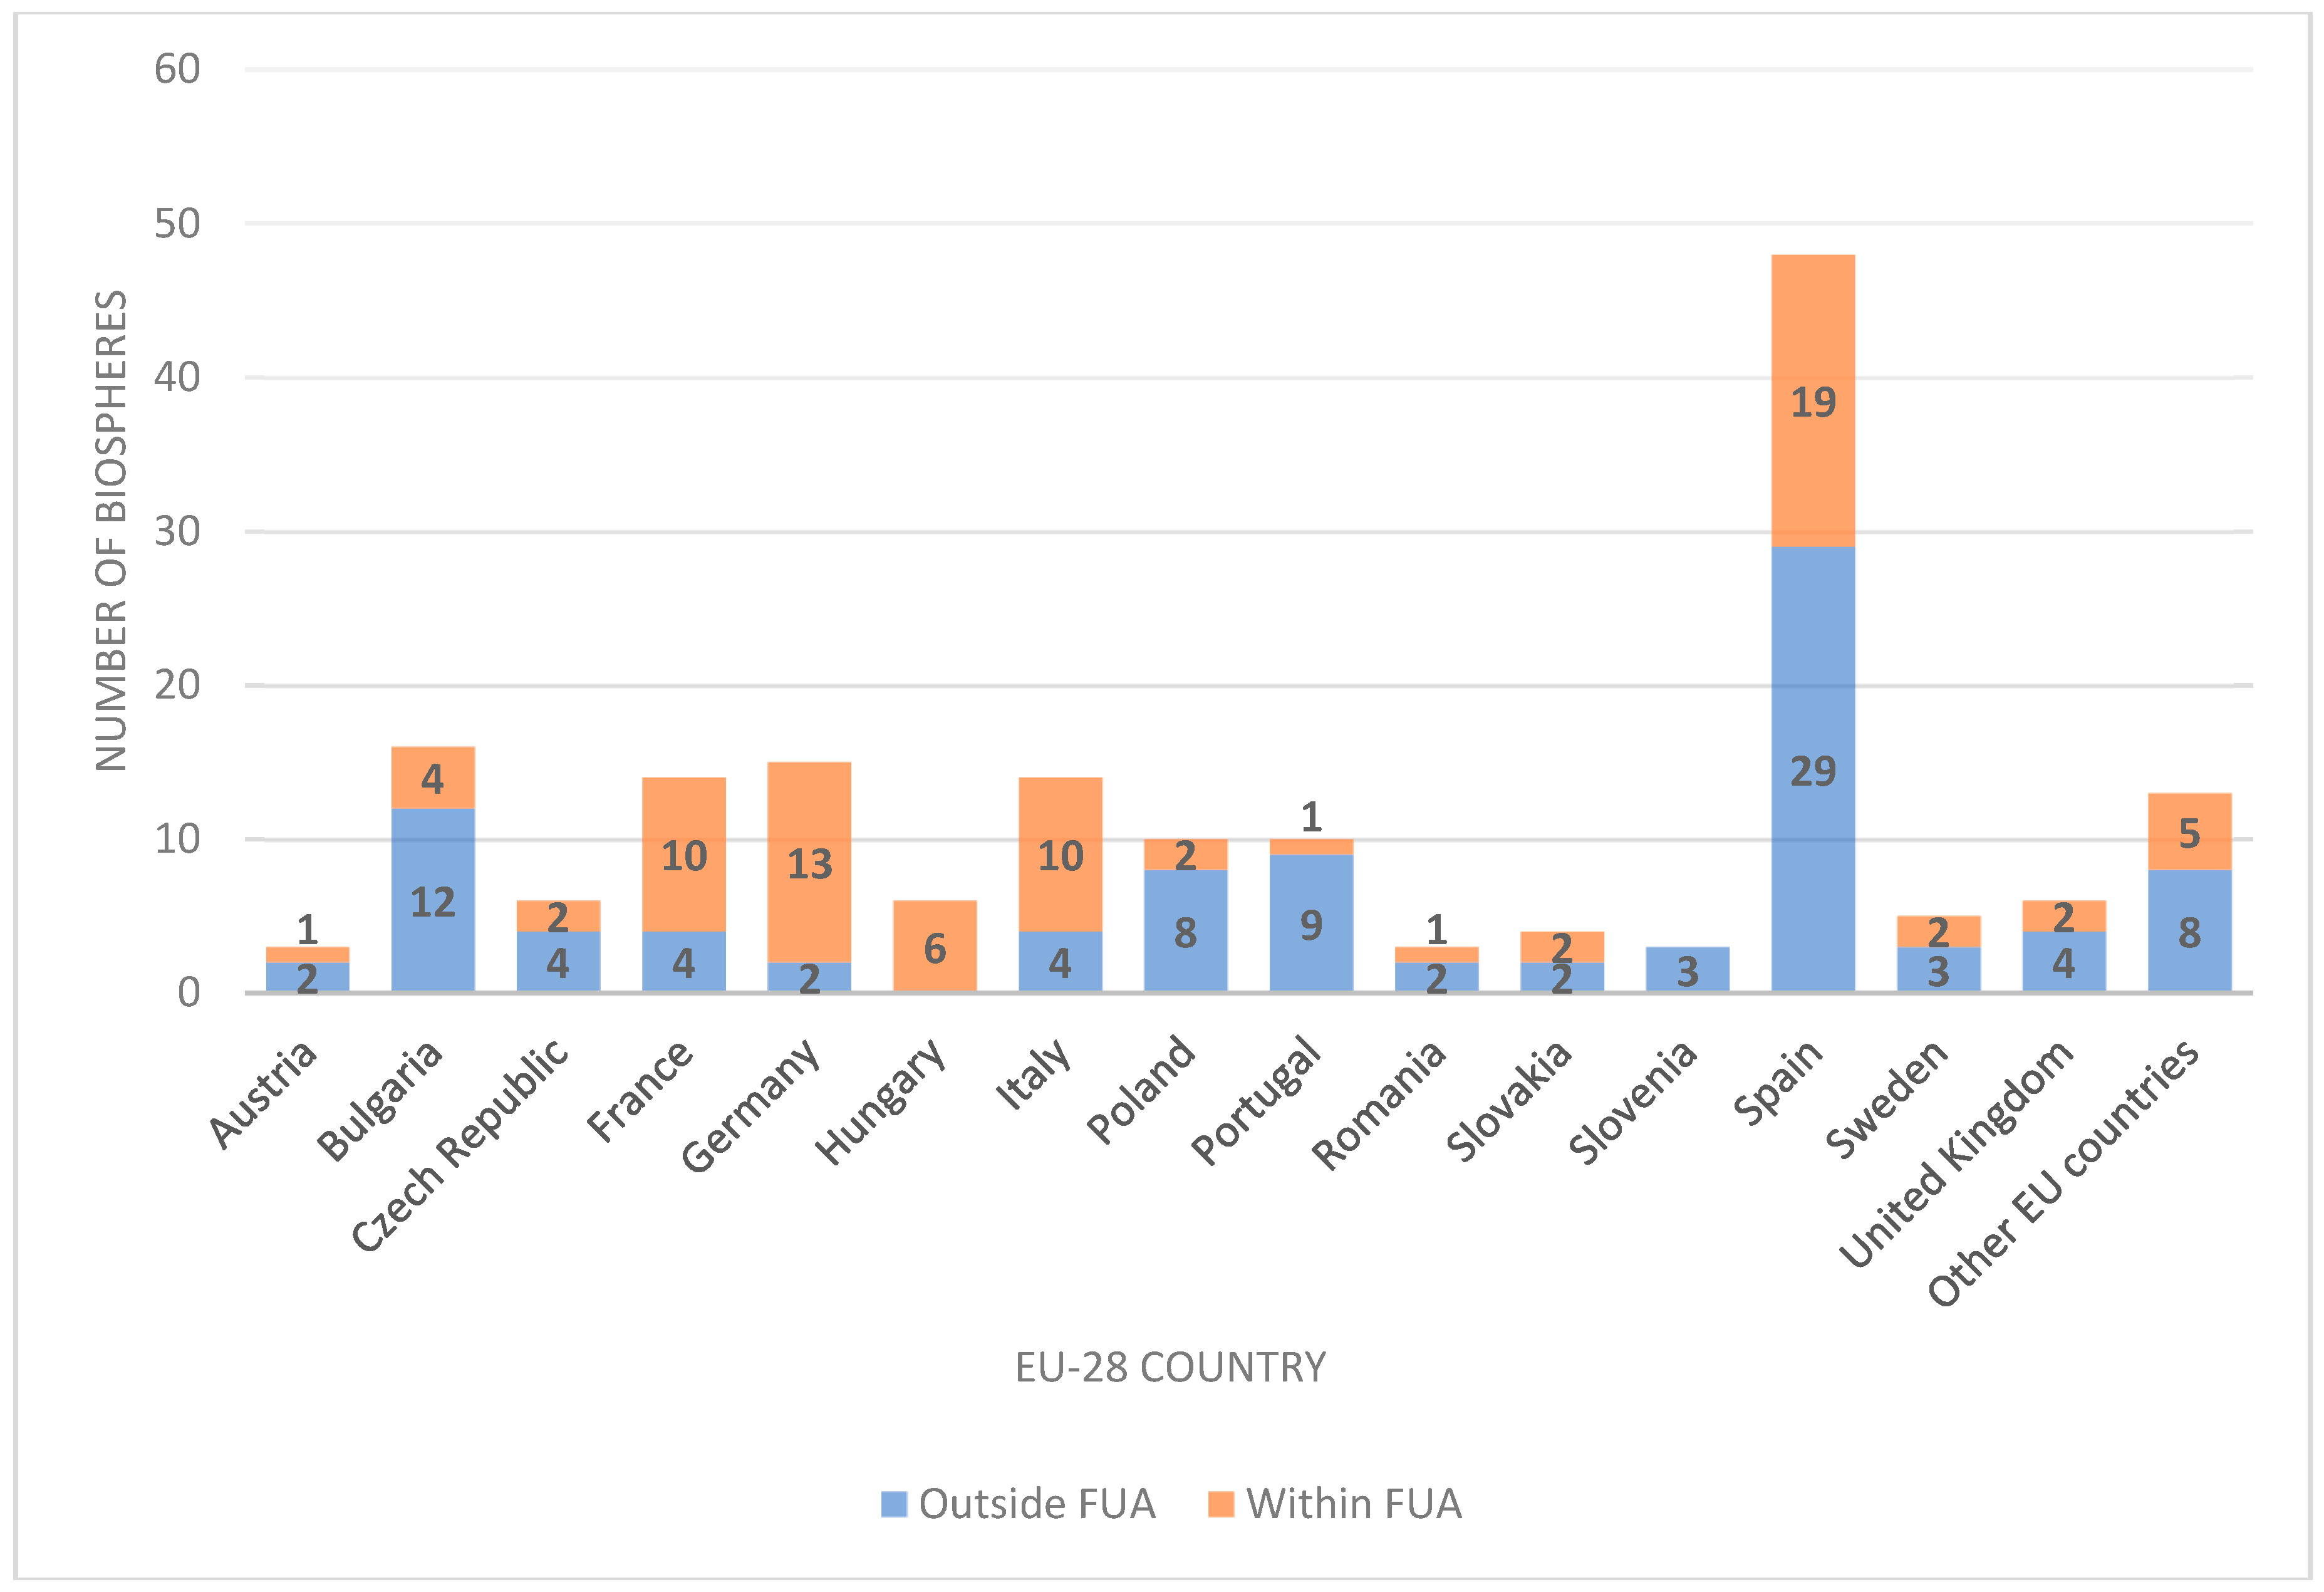
2.3.2. Percentage of Urban BRs by EU Country and Subregion

The number of BRs within FUAs was counted for each country based on UNESCO MAB database (Table 1, A) and a percentage calculated and mapped using ESRI ArcMap 10.4. An official transboundary BR is counted for each country that it occurs in and if it is within an FUA in any country, it is counted as urban for all countries. Regional urbanisation of BRs was examined by calculating the percentage of BRs within FUAs for all countries within each subregion of Europe as classified by the United Nations World Urbanisation Prospects (WUP) [58]. Percentage of urban population per country from 2012 [59] was used to compare with the national percentages of urban BRs.

2.3.3. Transboundary Urbanisation Effects

For some BRs, the nearest FUA was located in a different country. Designated transboundary BRs (Table 1, A) have formal governance structures and joint cooperation in sustainable development to manage pressures of urbanisation. However, where BRs are providing natural resources for cities in another country, issues of governance and sustainable development controls arise. Transboundary urbanisation impacts on BRs are identified as a subset (Table 5) to highlight the issue for future research and international cooperation.

2.3.4. Accessibility

Analysis of accessibility is based on the “travel cost” method, using observations on the amount of travel time and travel expenditure to calculate the overall travel cost [60]. The travel cost method is used to estimate site-level demand for recreation by modelling the relationship between visitation and the implicit price of visiting the site (the travel cost) [61]. This method has been used extensively in the context of more remote recreational open space (e.g., state and national parks), where there is ample variation in the cost visitors incur to reach the sites due to their varying points of origin [61]. Choice of origin point—for example, using approximate rather than actual origin and methods of modelling distances and travel time to a green space—will introduce errors and, therefore, bias into the results, with bias likely to be larger in an urban setting [61]. However, researchers are often forced to make such approximations [61].
This study uses an approximate point of origin—the centroid of the named city of the nearest FUA (or, in some cases more than one FUA may be equally accessible), as determined by a Google Maps search (Table 1, E), irrespective of the FUA centroid. City centre is selected as greater numbers of visitors are likely to obtain transport from the city centre where tour operators, transport hubs and accommodations are usually concentrated, offering the greatest opportunities for access by the highest number of people. “Accessibility” was measured using Google Maps-Directions as distance in kilometres of the quickest driving route from the city centroid of the city for each FUA to the centroid of BR [22]. This was measured during off-peak times (10:00–02:00 GMT) to estimate the minimum travel effort. Google Maps is a cost-effective method to collect recent data comparable across the study area [62]. Google Maps uses Dijkstra’s Algorithm [63] of finding the shortest paths between nodes in a graph, which may represent, for example, road networks [64]. This takes into consideration on the ground realities and barriers such as rivers or mountain ranges to determine accessibility. For islands, the nearest landfall to the EU territory “as the crow flies” was checked by using Google Maps (Table 1, E) to measure accessibility.

2.3.5. Populations of Nearest Urban Settlements

Population of the FUA nearest each BR was obtained using the UA (Table 1, H), which provides the estimated resident population for each polygon if an FUA is within the European Union [65]. Where two or more FUAs were found to be equidistant (within a range of 1 km) the FUA with the highest population was selected to indicate maximum degree of urbanisation. The UA doesn’t account for higher daytime populations of major cities [65], which therefore will underestimate population impacts for some highly urbanised BRs.

2.4. Statistical Analyses

The area of the BRs and the population of the nearest FUA of each BR was log transformed and compared between World Urbanisation Prospects 2018 (WUP) Code regions, proximity to FUA and year of latest review (or designation if no periodic review submitted) of the BR using a multi-variate linear model in R. Any differences between groups of BRs (e.g., urban versus non-urban) were also assessed with the same method. The R script is provided in Supplementary Materials.

3. Results

3.1. Attributes of the Network of UNESCO Biosphere Reserves under EU-28 Jurisdiction

3.1.1. Boundary

The network (as of April 2016) comprises one hundred and sixty-seven designated UNESCO Biosphere Reserves (BRs) within the EU (Supplementary Materials). The number of BRs by country varies from none (Belgium, Cyprus, Luxembourg, Malta) to one or two BRs in nine countries (Denmark, Estonia, Latvia, Lithuania, Netherlands, Croatia, Finland, Greece, Ireland) and to three or more BRs in the fifteen remaining countries (Figure 3). Forty-eight BRs are found in Spain, which constitutes 29% of all BRs in the EU (including three transboundary BRs between Spain and Portugal and one BR shared between Spain and Morocco). This is due in part to the designation of individual islands within archipelagos as BRs by Spain (Appendix A) which results in higher numbers of BRs overall as compared with other countries of similar size. The majority of Portuguese BRs (6/10) are islands (Appendix A). Overall, there are 15% (25/167) of EU BRs where the centroids are on islands in ten countries (Appendix A) as noted in Supplementary Materials (see column, “Island”). Three of these island BRs have autonomous governments (Isle of Man, North East Greenland and Santana Madeira), but are listed by UNESCO under the reporting national MAB Committee and are categorised in the same way for this study (Supplementary Materials).
Twelve BRs are designated as transboundary reserves. Four BRs are designated between an EU and a non-EU country, namely, Ukraine (3), Belarus (1), and Morocco (1), and two of these are designated among three countries (Supplementary Materials). There are formal plans to extend Mura Drava BR, an existing transboundary BR, from two to five countries, including a non-EU country (Serbia), to encompass the Mura-Drava river catchment [66].

3.1.2. Area

The EU BRs range widely in area from less than 10,000 hectares to over 500,000 hectares but are mostly between 30,000 and 150,000 hectares (Table 3). Twenty-five of the BRs are less than 10,000 hectares, which is considered too small to meet zonation requirements (Table 3). Sixteen of these are located in Bulgaria. Reflecting the prevalence of small BRs in Bulgaria, BRs are generally smaller than average in Eastern Europe and larger than average in Northern Europe. Northern Europe includes the largest BR—North-East Greenland (Denmark)—covering an area of 97,200,000 hectares. The BR area varies with WUP region [58] and the last year of periodic review (or designation if no periodic review was submitted) [22], but not with proximity to FUA (F-statistic = 15.96, p < 0.01, R2 = 0.33).

3.1.3. Influence of UNESCO MAB Policies on Urban Characteristics of BRs

In both Eastern and Northern Europe, those BRs that had been designated or reviewed more recently tended to be larger in size than those designated at an earlier date. BRs tended to be smaller when first designated in the late 1970s (except for Northeast Greenland BR, but recently have become more variable in size. The second largest BR, the Bassin de la Dordogne (France), which covers the entire catchment of the river Dordogne (2,397,190 ha), was designated in 2012 [22]. No relationship was evident between the last periodic review (or year of designation if no periodic review was submitted) of a BR and population size of the nearest FUA (F = 1.65, p = 0.2, R2 = 0.001). While BR area varies with year of designation (or year of designation if no periodic review submitted), it does not vary with proximity to FUA (F-statistic = 15.96, p < 0.01, R2 = 0.33).

3.1.4. Coincidence of UNESCO Biosphere Reserves with Natura 2000 Network

The majority (57%) of BR centroids were within 1 meter of a N2000 site (95/167) and an additional 3 BRs centroids were coincident within 100 m of N2000 sites. Overall, 73% (122/167) of all European BRs had centroids within 1 km of N2000 sites and this rate was unchanged at 2 km. In terms of N2000 site types, 22% (37/167) of BR centroids were within 2 km of a Special Protection Area, 37% (62/167) within 2 km of a Special Area of Conservation and 14% (23/167) of BR centroids were coinciding within 2 km of both types of designated sites.

3.2. Indicators of Urbanisation

3.2.1. Proximity to FUAs and Urban Status of BRs

Urbanisation of EU BRs is common, with 46% (76/167) situated within FUAs. This includes 11% (18/167) which are entirely within an FUA, of which four are transboundary BRs. Ten BRs are located within the FUA of nine capital cities (Vienna, Sofia, Prague, Paris, Berlin with two BRs, Budapest, Dublin, Warsaw, and Madrid). The island BRs which are within FUAs are found only in Spain (Supplementary Materials). BRs are delineated adjacent to the FUA boundary at a distance of 1 km or less (14%), where the margin of error of 100 m in the Urban Atlas (2012) [20] may be important for determination of alignment with an FUA. Proximity of 1–10 km to an FUA was found for 7%. Ninety percent of all EU BRs are within 50 km of an FUA, the “zone of influence” of urban settlements on conservation areas [30,57]. An example of this is Babia Gora BR in Poland (Figure 2b). Only 9% (15/167) of all EU-28 BRs are greater than 50 km distant from an FUA, and four-fifths of these (12/15) are situated on islands. Further analysis of this 9% shows 55% (9/15) are greater than 100 km distant from an FUA, all of them on islands. When island BRs are excluded from the results, the maximum distance for a BR to an FUA is 90 km, at Wester Ross BR, UK (Supplementary Materials).

3.2.2. Percentage of Urban BRs by EU Country and Subregion

Of the twenty-four EU countries which have BRs, nineteen have BRs within FUAs. All BRs in Croatia (2), Hungary (6), and the Netherlands (1) are within FUAs. Five countries have more than 50% of their BRs in FUAs (Figure 4): Germany (87%), France (75%), Italy (71%), Austria and the Czech Republic (66%). Several countries with few BRs have half of their BRs in FUAs—Finland (2), Ireland (2), and Slovakia (4). Spain has only 40% of its national total in FUAs (Figure 4), including the only island BRs (3/167) within FUAs in the EU-28. Five countries—Denmark, Estonia, Greece, Latvia and Lithuania—have no BRs within FUAs (these countries are included in ‘other countries’ in Figure 3). Regional differences in urbanisation of BRs between WUP European subregions [46] were observed but were statistically insignificant. Western Europe has the highest level of urbanisation, with 79% of all BRs are within FUAs, whereas Southern (42%), Eastern (38%) and Northern (32%) subregions are similar.

3.2.3. Proximity to Multiple FUAs

Proximity to more than one FUA within 50 km radius was noted in 11% (19/167) of BRs (Table 4). Of these, two percent (3/167) of BRs are nearly equidistant to three or more different FUAs (Table 4) and impacted by urbanisation on multiple fronts. The average population of the nearest FUAs of this category of BRs is 501,659 and the median population is 319,357.

3.2.4. Transboundary Urbanisation Effects

Not only are EU BRs highly urbanised, but this urbanisation can arise from areas outside the country in which the BR is designated. For 7% of BRs (11/167), the nearest FUA was in another country or outside of the EU (Table 5).

3.2.5. Accessibility

EU BRs are highly accessible (Table 6) as 18 BRs (11%) are within “walking/cycling distance” from a city centre and 35% are accessible by “short driving distance” from the city centre (58 BRs). Almost all EU BRs (97%) are within a “day-trip excursion” (162 BRs), i.e., less than 300 km distant from the city centre of an FUA.
The distances of EU BRs on islands are likely to be under-estimated because they are measured as the crow flies to the nearest point on the EU landmass and there may not be direct flights between the BRs and these FUAs. Furthermore, such off-shore BRs are likely to have visitors from both EU and non-EU cities, as many are global tourism destinations.

3.2.6. Populations of Nearest Urban Settlements

The median population size of FUAs coinciding with BRs is higher (319,240 inhabitants) than that of FUAs external to BRs (239,942 inhabitants), and this difference is statistically significant (p = 0.014). This may be due to the quarter (19/76) of urban BRs coinciding with FUAs of greater than 1 million, whereas only 9% (8/91) of non-urban BRs are near such large European cities. Most BRs are situated within (30% of urban BRs) or near (36% of non-urban BRs) FUAs with a population of 100,001–250,000. The largest FUAs are near BRs in Western Europe, including nine cities greater than 1 million inhabitants (Mannheim, Dresden, Aix-en-Provence, Turin, Vienna, Stuttgart, Hamburg, Berlin with two BRs and Paris). The Paris FUA is the largest near any BR with over 11 million inhabitants. As anticipated by the significant difference in the median population size of FUAs near urban BRs in comparison to non-urban BRs, the distance to FUA was negatively correlated with its population size (r = 0.05).

4. Discussion

The results of this study show that the extent of urbanisation of BRs within the EU is more widespread than the literature suggests. Traditional concepts of BRs need to be questioned. The expectation that the centroid of a BR represents the most highly protected and remote location for conservation isn’t the case for over one-quarter of BRs centroids that do not occur within two kilometres of any EU Natura 2000 sites. The transition zones of many BRs now comprise the urban zones of major cities (Section 3.2.1), not the traditional model of towns and villages depending on the natural resources of a BR. Many EU BRs have become entirely urbanised or function as recreational areas for one or more large cities. The overwhelming majority of EU BRs are within the zone of influence of urban areas (Section 3.2.1). Even BRs outside of FUAs are under pressure from tourism from major cities due to ease of accessibility. Urgent attention is needed for 11% of EU BRs that are under multiple pressures and squeezed between 2–4 metropolitan areas (Table 4). A further subset of 7% EU BRs is managed within one country but are impacted by major cities in another country which may even be outside of the EU (Table 5) and will have different land use policies and governance. Another subset of 15% of EU BRs is on islands (Appendix A), most of which are not urbanised. Many BRs are continuous with FUAs but exclude them from the designation (Section 3.2.1). These issues have not been explored in previous research and are not elaborated in current UNESCO MAB policies.
This study shows that just under half of EU BRs are within urban areas (Section 3.2.1). This may demonstrate that BRs are often designated such that urban development interests can be integrated with conservation interests [17]. Urban growth pressures can result in a greater perceived need to protect remaining areas of biodiversity [69], which may stimulate populations to initiate a BR designation process [17]. However, this study also revealed some BRs where integration with nearby urban areas is not fully recognized and addressed (Section 3.2.1). There are both opportunities and threats to conservation associated with urbanisation. Given the inconsistent approach to urbanisation across the network revealed in this study (Section 3.2.2), the UNESCO MAB programme needs to embrace strategies that explore the potential of BRs to integrate human with conservation interests.

4.1. Distribution of UNESCO Biosphere Reserves within the European Union

Distribution of BRs does not align with patterns of high biodiversity or rarity because national policies, the history and philosophy of planning, and conservation management have had strong influences on the spatial distribution of PAs, especially in Europe, where national biases become evident [4]. Regional differences in urbanisation were anticipated to affect urban status of BRs based on the earlier study [1]. Differences in urbanisation by WUP subregion were observed but statistically insignificant (Section 3.2.2), when accounting for the variation between countries for each region. As both the literature [18] and our results (Section 3.1.4) show, the core zone of many EU BRs comprises one or more N2000 sites. There needs to be greater analysis within UNESCO and the EU of how the results of this study (Section 3.1.2 and Section 3.2.2) and the EU evaluation report [70] indicate regional urban pressures on the BR network. There are considerable variations in the status of ecosystems by biogeographical and marine regions and the impacts of urbanisation across the EU [71] which could be examined in relation to BRs that are designated to manage N2000 sites.
The evidence presented here shows that the biosphere concept is being actively applied to urban and accessible ecosystems, contrary to the scientific literature on isolationism of BRs [71]. However, its application is without any specific strategies for designation of urban BRs [72] and is arising from the expansion of nearby urban settlements as highlighted in a case study [73] and inward migration toward cities within the EU. The analysis identified a subset of BRs (Appendix A) located in archipelagos that would seem to support the assertions of isolationism [71] in sites designated as BRs and contradict the view that biospheres “are not islands” [35]. Such disparities in the BR network illustrate the diverging views on designation of BRs, and perhaps of PAs generally, within the EU.
Area of BRs within the EU-28 varies (Section 3.1.2), but the dominant size (38%) is 30,000–150,000 ha, the “ideal size” for BRs as per the German MAB criteria [68] (Table 3). The EU BRs have increased since the Seville Strategy [8] (Figure 1) by the extension or amalgamation of smaller, first-generation BRs [30]. Since the early days of the MAB programme, determining the desirable size of a BR has been a challenging question for UNESCO [16] and is still not specified in current UNESCO strategy [27], but a BR must be of an appropriate size to serve the three requisite functions [8]. Batisse [16] contends that “size of each BR constitutes a fundamental issue” and that it should be linked to factors for managing genetic diversity. A study of EU PAs—including UNESCO biospheres and N2000 sites—found that conservation value was often disconnected from the size of PA and declined due to the presence of other factors: poor management effectiveness, growing human pressures and insufficient governmental support [3]. However, a review of N2000 sites found that size was a significant predictor of land cover changes in the past two decades, with changes higher in smaller N2000 sites [74]. This suggests that the zonation of BRs could be a useful tool to manage these changes for N2000 sites within BR core zones. The large variability in size of BRs found in this study (Section 3.1.2) may reflect that contradictory views between UNESCO MAB Committees and regional networks, with Afri-MAB asserting that the small size (approximately 14,200 ha) and population of an island BR designated in 2012 “make [it] a suitable natural and social laboratory” [47], whereas German MAB criteria require an area of 30,000–150,000 ha (Table 3), although BRs across trans-federal states can be larger [68].
Spatial coincidence between BR centroids and Natura 2000 sites (Section 3.1.4) was somewhat weaker than would be expected from the concentric zonation concept of BRs in the literature [10,56]. Only 59% of BR centroids were coincident within 100 m of a Natura 2000 site. For 27% of EU BRs, the core zone is either located more than 2 km away from the BR centroid or is a national—not EU—nature conservation site. Therefore, methods of analysis that assume a concentric zonation [34] may be unreliable for study of urbanisation of EU BRs. The purposes of collection of centroid data in periodic reviews should be re-evaluated.
Both types of N2000 sites coincide with BRs centroids, but those designated as Special Areas of Conservation for their habitats are more coincident than those as Special Protection Areas for birds. For 14% of BR centroids, both types of N2000 sites coincided within 2 km, illustrating that BRs are protecting the most sensitive EU sites. Of BR centroids that were coincident within 1 m of a N2000 site (95/167), 48% (46/95) were for BRs that were also within FUAs (Supplementary Materials). The BR designation should be a tool to manage the pressures of urbanisation on these N2000 sites.

4.2. Proximity of UNESCO Biosphere Reserves to Functional Urban Area (FUAs)

Human settlements are expected within BR transition zones under UNESCO criteria [8]. An earlier study reported that 43.3% of all PAs in Europe were within 10 km of small urban areas (25,000 persons) [34]. However, we found (Section 3.2.1) that two-thirds (110/167) of EU BRs are within 10 km of larger FUAs (50,000 persons), with only 3% of these (5/167) on islands (Appendix A). Furthermore, the results (Section 3.2.1) show that 90% of the EU BRs are within a ‘zone of influence’ of 50 km of urban settlements [34,40]. As a BR boundary is usually in the transition zone [75], these results suggest that many European BRs are now contiguous with large urban settlements and conurbations. Urbanisation is a widespread phenomenon across the EU BR network and a systematic coordinated approach to urbanisation within UNESCO would be beneficial.
Some of the findings of our study point to a lack of a coordinated approach to urbanisation in EU BRs. Configuration of a BR should be based on ecosystem rather than administrative boundaries and the network includes transboundary BRs for this purpose [76]. However, this research shows that 14% of EU BRs boundaries of BRs are designated within 1 km of an FUA boundary (Section 3.2.1). This suggests a purposeful avoidance of urban areas and raises questions about public engagement with urban citizens in the active management of conservation areas on their doorstep. Such avoidance may result in a missed opportunity for BRs to garner support for managing urbanisation in an integrated way. Having high levels of population can indirectly the drive ecosystem plan’s quality higher, support the presence of environmental NGOs, and boost the collective capacity of the planning process [69]. In addition, we found that 7% of BRs are located in or close to an FUA/s in a different country (Section 3.2.1). The transboundary BR concept can be used to overcome such administrative challenges for PAs.
Differences in the urbanisation of BRs among EU nations arise from various factors, including:
  • Geographical context. More densely populated EU countries would be expected to have more urban BRs. Countries in central Europe may have greater levels of urbanisation than peripheral ones due to historic trade and transport routes [77]. National urban population trends [58] appear unrelated to percentage of urban BRs in each country;
  • Historical development. There is considerable variability in land consumption patterns between European countries which derives from their history, tradition, and consistency of the territorial management tools [78];
  • Political context and governance. Among EU members, stronger national planning policies may influence development controls and reduce land consumption of urbanisation [78] and the existence of regional planning can counter landscape fragmentation [77];
  • Socioeconomic factors influencing development. Higher per capita incomes, higher educational attainment, and lower unemployment rates are positively correlated with higher landscape fragmentation in many EU regions [77]. Distinct land consumption patterns along geographical and socioeconomic gradients within the EU have been determined [78];
  • National MAB Committee policies. Within UNESCO, each national MAB Committee is responsible for strategies for selection and proposal of sites for biospheres, periodic review reporting and establishing national legislative supports for biosphere protection [27]. Some EU nations, e.g., Germany have prepared their own national guidance on and interpretation of UNESCO criteria [68], while other countries have weak MAB committees. This influence of national policies is borne out by the lack of correlation between the last periodic review and the population of those nearest to the FUA to BRs in our results.
These different factors influencing urbanisation will have to be addressed in any network-wide strategy, and flexibility with regard to local implementation is essential [25].

4.3. Effects of Urbanisation on UNESCO Biosphere Reserves

Urbanisation impacts on biodiversity are usually negative [79], but urban PAs may have several governance advantages, such as: higher wealth, easier access to public support and political centres of power [80]. These advantages can provide resources for biodiversity conservation to counter other factors in the vulnerabilities of urban PAs [46]. Urbanisation can bring opportunities to communities in rural remote areas where BRs are situated [73]. Strategies are needed to harness these advantages for urbanising BRs, as inadequate financing of PAs is becoming increasingly prevalent in some of the richest countries, where major reductions in staffing levels and funding have been recently observed [81]. The area occupied by predominantly urban regions across the EU is generally quite small, but with a high concentration of economic activity and highest median income in these regions [37]. Urban areas are also centres of knowledge, innovation, and productive resources that could be harnessed by BRs [35]. Incentives and resources for ecological goals can arise out of the BR designation [47]. It has previously been suggested that urban BRs could act as long-term ecological research (LTER) sites [82]—similar to a US federal network which includes two urban sites [42] or provide a thematic or subs network to monitor biodiversity changes and ecosystem services through Biodiversity Observation Networks (BONs) [83]. Our study identifies specific urban BRs for the development of strategic networks within the EU.
Protected areas can be drivers for urbanisation, as they may exert an “attractive effect” on urban development [73,84]. Increased human population growth in unprotected areas surrounding PAs can result in “edge effects” in proportion to urban population densities that cause loss of biodiversity and ecosystem function [46,85] and reduce the effective area of a BR [73]. Designating a BR can serve to address this issue by focusing governance toward furthering ecological goals through sustainable development [43], if BRs include the urban areas that exert pressure on the core zones. For 11% of the BRs that are situated within the zone of influence of multiple FUAs (Table 4), the coordination of multiple municipalities is required to achieve this. Evidence from the analysis of three BRs in France, Spain and Portugal has shown strong intensification changes and conversion of agricultural lands and natural areas to artificial surfaces in BR buffer zones from the expansion of existing nearby urban centres during 1990–2006 [73]. Our results show that two of these three BRs are now within FUAs (Supplementary Materials), one of which was not considered to be the nearest city previously [73].
Urbanisation may result in increased land values within BRs. The high value of land in many European cities, particularly capital cities, invites investment by global entities and incentivises maximisation of all available space for development and intensification of existing land uses [37]. This intensification will further pressurise the maintenance of BR zonation, and the distance of the land use gradient of BRs may decrease. These pressures will strongly affect the 66% of EU BRs that are within 10 km of an FUA and those located within or close to FUAs with higher populations. Biosphere management plans will have to adapt, as policies of setting aside lands purely for nature conservation may be curtailed [41].
Recreational pressure from urban populations is a known conservation threat to PAs [70] and must be managed in accordance with objectives and PA category [5]. Transportation networks can greatly influence travel costs and road networks stimulate urbanisation of PAs [70,73]. For example, even the formerly remote areas of Ireland’s western seaboard—including areas protected for native Irish language status and for biodiversity such as Kerry BR—are now marketed as a day trip from Dublin (347 km one way) to an “unspoilt region” on tourism websites due to the upgrading of the motorway network under EU structural funds. The maximum distance for all EU biospheres—excluding islands—is 90 km (Supplementary Materials, see Wester Ross BR, UK) (Section 3.2.1). This indicates that they are all potentially a day trip from cities (Table 6). Eighty-six percent of BRs are within easy driving distance from FUAs (Section 3.2.5). The management of recreational pressures is, therefore, one of the most important issues to be addressed across the urbanising BRs in Europe.
It is evident that EU BRs are providing ecosystem services for cities with large populations, as this study showed that one-quarter of BRs that are located within FUAs (19/76) are of resident populations greater than one million (Section 3.2.6). Many European cities have even higher tourist populations and demands on BRs, many of which are tourist attractions in their own right, and which may be under-estimated by using only FUA populations. Currently, UNESCO has not set any criteria for population thresholds to define urban BRs, but it would seem that the BRs identified in this analysis would qualify.

5. Conclusions

The objectives of the study were to quantify the extent of urbanisation of UNESCO Biospheres in the EU-28 and to analyse the current vulnerabilities of these BRs to urbanisation. The recent development of mapping tools and databases publicly available within the EU have made it possible to analyse the degree to which BRs in the EU-28 are urbanised. The results show that the majority of BRs within the EU are facing urbanisation pressures, but some of the BRs are not appropriately designed to account for these urban pressures right outside their boundary. This suggests that the UNESCO strategy for BRs needs to give much more serious consideration to the management of these pressures and specific measures for conservation of urban ecosystems.

6. Recommendations

As urbanisation is now affecting the majority of EU BRs, our recommendations for development of a new urban strategy for BRs and to improve overall functioning of the network are:
Recommendation 1: Strengthen channels for communication for urban BRs:
  • Expand the UNESCO Biosphere Urban Working Group to include all European BRs that were identified as urban in this study.
  • Initiate a collaboration on long-term research and planning among the 9 EU capital cities which were identified as having BRs within their FUAs.
Recommendation 2: Include nearby FUAs through revised BR zoning and governance arrangements:
  • Consider expanding the transition zones of BRs to include those FUAs detected in proximity to BRs but not currently included in these designations, particularly where the relevant FUAs are in a different country or even outside the EU (Table 5).
  • Examine if FUAs in neighbouring countries identified in this paper (Table 5) should be involved in cooperative governance of BRs through formal transboundary designations or other mutually agreed structures.
Recommendation 3: Improve data collection, accessibility, and exchange in MAB to manage for urbanisation:
  • Update the periodic review form to include more data collection on urbanisation trends in BRs.
  • Publish population data from periodic review reports to assist in calculating population densities of BRs. This would assist in analysis of vulnerabilities due to urbanisation.
  • To determine which BRs are under greatest pressure from urbanisation, further research on population trends and urban expansion rate for these different FUAs would be useful. Topography of surrounding areas is relevant, as lowlands dominated by an agricultural and urban matrix are where high land consumption due to population expansion has been observed in the EU [73,84,86].
  • Update Biosphere Smart and provide a means for BR researchers to download data from it.
  • Develop and provide support for an internet-based server for UNESCO BRs to access and upload data on BRs including mapping of zonation to allow researchers to analyse spatial data submitted through periodic reviews and to encourage BRs to provide updates more frequently than the ten-year review process. This would foster adaptive management practices at various levels and assist greatly in analysis of urbanisation of BRs and urban interactions. It would enable BRs to share data without putting all of the onus on UNESCO to maintain updates, when it is “in a time of austerity” [82].
  • Develop a standard survey of BR visitors [61] to provide more specific data on origin points of visitors and reduce errors in travel cost estimates. This would serve to test to what extent the BRs are meeting recreational demands of FUAs and becoming more urbanised. It would also permit more accurate analysis of accessibility.
  • Update the database produced for this research study to reflect land use changes in the future through use of updates to the Urban Atlas (2012) in conjunction with data obtained in future periodic reviews. It is hoped by the authors that this study can serve as a baseline to assist future monitoring and research for BRs within the EU and inform policy within UNESCO and the EU for PAs.

Supplementary Materials

The following are available online at https://www.mdpi.com/2071-1050/11/21/5899/s1.

Author Contributions

Conceptualization, M.H. and T.H., K.F. and C.C.; methodology, M.H., T.H., C.C. and T.B.; software, M.H.; validation, M.H., T.H. and C.C.; formal analysis, M.H., T.H.; investigation, M.H.; resources, M.H.; data curation, M.H. and T.H.; writing—original draft preparation, M.H, T.H.; writing—review and editing, M.H., T.H., C.C., K.F. and T.B.; visualization, M.H.; supervision, T.H., C.C., K.F.; project administration, T.H.; C.C., K.F., T.B. funding acquisition, T.H. and K.F.

Funding

This research was funded by the Science, Technology, Research and Innovation for the Environment (STRIVE) Program 2007–2013 under Grant Ref. No. 2365. The program is financed by the Irish Government under the National Development Plan 2007–2013. It is administered on behalf of the Department of the Environment, Community and Local Government by the Environmental Protection Agency which has the statutory function of coordinating and promoting environmental research http://www.epa.ie/pubs/reports/research/.

Acknowledgments

We are grateful to the consortia that produced the datasets we used in this study for making their data freely available. The authors wish to acknowledge the sources of various datasets used in the analysis for this study: WUP data: United Nations, Department of Economic and Social Affairs, Population Division (2018). World Urbanisation Prospects: The 2018 Revision, Online Edition. Copyright © 2018 by United Nations, made available under the Creative Commons license CC BY 3.0 IGO: http://creativecommons.org/licenses/by/3.0/igo/. UNESCO EuroMAB (2016) for the database of UNESCO Biospheres within the European Union obtained from their website: http://www.unesco.org/new/en/natural-sciences/environment/ecological-sciences/biosphere-reserves/europe-north-america/ and which was used to create maps. Copyright © 2016 by UNESCO, all biosphere reserve descriptions are made available under a Creative Commons license CC-BY-SA IGO 3.0 from https://creativecommons.org/licenses/by-sa/3.0/igo/. Eurostat (EU) (2018) for shape files of European Union Functional Urban Areas. Version 22 February 2018. Downloaded 3 February 2019. Eurostat (c) European Union, 1995–2018. Eurostat (EU) 2018 for shape files of EU (and world) boundaries of countries. Downloaded on 2 February 2019. Eurostat (c) European Union, 1995–2018. Copyright notice: EN: © EuroGeographics for the administrative boundaries. https://ec.europa.eu/eurostat/statistics-explained/index.php?title=Urban_Europe_%E2%80%94_statistics_on_cities,_towns_and_suburbs_%E2%80%94_the_dominance_of_capital_cities#The_dominance_of_capital_cities. European Environment Agency for datasets: The spatial and written data for all Natura 2000 sites dated end 2016 and last modified 30 Oct 2017 from EEA website: https://www.eea.europa.eu/data-and-maps/data/natura-8#tab-gis-data. Joint Research Centre (JRC) for datasets: Urban Atlas (2016) Copernicus https://land.copernicus.eu/local/urban-atlas/urban-atlas-2012/view JRC LUISA Reference Scenario (2016) for Share of GI by FUA (2010–2050). World Database of Protected Areas https://www.protectedplanet.net/. We also wish to acknowledge: Meriem Bouamrane, EuroMAB, UNESCO, and Peter Dogse, Climate Office, UNESCO, for responses to queries about the UNESCO database; Cipriano Marin, Coordinator Biosphere Smart Initiative, UNESCO CAN, Canary Islands, Spain, for responses to queries about the Biosphere Smart database; Glen Hyman, Sciences Po, for clarification of his research with Pete Frost, UK MAB; Mura Drava BR for additional information; the Joint Research Centre for responses to queries about the Urban Atlas 2016; Martin Price, UK MAB Vice-Chair and UNESCO Chair in Sustainable Mountain Development, for advice; colleagues in Dublin Bay BR for their support and two anonymous reviewers for their comments on the manuscript.

Conflicts of Interest

The authors declare no conflict of interest. The funders had no role in the design of the study; in the collection, analyses, or interpretation of data; in the writing of the manuscript, or in the decision to publish the results.

Appendix A

List of UNESCO Biosphere Reserves on islands:
  • North-East Greenland (Denmark)
  • Archipelago of Guadeloupe (France)
  • Commune de Fakarava, French Polynesia (France)
  • Iles et Mer d’Iroise (France)
  • Vallée du Fango (France)
  • West Estonian Archipelago (Estonia)
  • Archipelago Sea Area (Finland)
  • Gorge of Samaria (Greece)
  • Tuscan Islands (Italy)
  • Azores Islands (Portugal)—four BRs, each separately designated Corvo Island, Flores Island, Fajãs of São Jorge Island and Graciosa Island
  • Berlengas (Portugal)
  • Santana Madeira (Portugal)
  • Canary Islands (Spain) archipelago—seven BRs, each separately designated: Fuerteventura, Gran Canaria, Isla de El Hierro, La Gomera, La Palma, Lanzarote, Macizo de Anaga in Tenerife
  • Minorca, Balearic Islands (Spain)
  • Blekinge Archipelago (Sweden)
  • Isle of Man (United Kingdom)

References and Notes

  1. UNESCO. UNESCO Man and the Biosphere Programme Website. Available online: http://www.unesco.org/new/en/natural-sciences/environment/ecological-sciences/biosphere-reserves/ (accessed on 25 July 2019).
  2. UNESCO. Lessons from Biosphere Reserves in the Asia-Pacific Region, and a Way Forward: A regional Review of Biosphere Reserves in Asia & the Pacific to Achieve Sustainable Development; UNESCO Office Regional Science Bureau for Asia & the Pacific: Jakarta, Indonesia, 2010; p. 79. [Google Scholar]
  3. Hoffmann, S.; Beierkuhnlein, C.; Field, R.; Provenzale, A.; Chiarucci, A. Uniqueness of Protected Areas for Conservation Strategies in the European Union. Sci. Rep. 2018, 8, 6445. [Google Scholar] [CrossRef] [PubMed]
  4. EC. Financing the Natura 2000 network. Environ. Eur. 2012, 46, 12. [Google Scholar]
  5. Dudley, N. Guidelines for applying protected area management categories. In Guidelines for Applying Protected Area Management Categories; IUCN: Grang, Switzerland, 2008; p. 106. [Google Scholar]
  6. Bouamrane, M. Dialogue in Biosphere Reserves—References, Practices and Experiences. 2007. Available online: https://unesdoc.unesco.org/ark:/48223/pf0000159164 (accessed on 1 December 2015).
  7. Frost, P.; Hyman, G. Urban areas and the biosphere reserve concept. In The Routledge Handbook of Urban Ecology, 1st ed.; Douglas, I., Goode, D., Houck, M., Maddox, D., Eds.; Routledge: London, UK, 2010; pp. 549–560. [Google Scholar] [CrossRef]
  8. UNESCO. Biosphere Reserves: The Seville Strategy and the Statutory Framework of the World Network; UNESCO: Paris, France, 1996; p. 21. [Google Scholar]
  9. Douglas, I.; Box, J. The Changing Relationship between Cities and Biospheres: A Report Prepared for the Urban Forum of the United Kingdom Man and the Biosphere Committee and Derived from a Workshop Held in Manchester in 1994; UK Urban Forum MAB Committee: London, UK, 2000; p. 32. [Google Scholar]
  10. McDonald, R.I.; Kareiva, P.; Forman, R.T. The implications of current and future urbanization for global protected areas and biodiversity conservation. Biol. Conserv. 2008, 141, 1695–1703. [Google Scholar] [CrossRef]
  11. Du, W.; Penabaz-Wiley, S.; Njeru, A.; Kinoshita, I. Models and Approaches for Integrating Protected Areas with Their Surroundings: A Review of the Literature. Sustainability 2015, 7, 8151–8177. [Google Scholar] [CrossRef] [Green Version]
  12. Brunckhorst, D. Building capital through bioregional planning and biosphere reserves. Ethics Sci. Environ. Politics 2001, 1, 19–32. [Google Scholar] [CrossRef]
  13. Lourival, R.; Watts, M.; Pressey, R.L.; Mourão, G.D.M.; Padovani, C.R.; Da Silva, M.P.; Possingham, H.P. What is missing in Biosphere Reserves Accountability? Nat. Conserv. 2011, 9, 160–178. [Google Scholar] [CrossRef]
  14. Batisse, M. Biosphere Reserves: A Challenge for Biodiversity Conservation & Regional Development; Taylor & Francis Group: Washington, DC, USA, 1997; Volume 39, pp. 6–33. [Google Scholar]
  15. Solecki, W.D.; Rosenzweig, C. Biodiversity, Biosphere Reserves, and the Big Apple: A Study of the New York Metropolitan Region. In Urban Biosphere and Society: Partnership of Cities; Alfsen-Norodom, C., Lane, B.D., Corry, M., Eds.; New York Academy of Sciences: New York, NY, USA, 2004; Volume 1023, pp. 105–124. [Google Scholar]
  16. Batisse, M. The Biosphere Reserve: A Tool for Environmental Conservation and Management. Environ. Conserv. 1982, 9, 101–111. [Google Scholar] [CrossRef]
  17. Dogse, P. Towards urban biosphere reserves. Ann. N. Y. Acad. Sci. 2004, 1023, 10–48. [Google Scholar] [CrossRef]
  18. Frost, P. Urban biosphere reserves: Re-integrating people with the natural environment. Town Ctry. Plan. 2001, 70, 1–5. [Google Scholar]
  19. EEA. European Urban Atlas. 2012. Available online: http://land.copernicus.eu/local/urban-atlas/urban-atlas-2012/view (accessed on 24 February 2017).
  20. Copernicus. Mapping Guide for a European Urban Atlas; European Commission: Copenhagen, Denmark, 2016; p. 39. [Google Scholar]
  21. UNEP-WCMC; IUCN. The World Database on Protected Areas (WDPA): October 2012. Available online: www.protectedplanet.net (accessed on 11 August 2018).
  22. UNESCO. UNESCO Biospheres of Europe and North America 2016. Available online: http://www.unesco.org/new/en/natural-sciences/environment/ecological-sciences/biosphere-reserves/europe-north-america/ (accessed on 24 February 2017).
  23. EEA. Natura 2000 Data—The European Network of Protected Sites. Available online: https://www.eea.europa.eu/data-and-maps/data/natura-8#tab-gis-data (accessed on 20 November 2017).
  24. Jackson, A. Conserving Europe’s Wildlife: Law and Policy of the Natura 2000 Network of Protected Areas; Routledge: Abingdon, Oxon, UK, 2018; ISBN 9781138203655. [Google Scholar]
  25. Elbakidze, M.; Hahn, T.; Mauerhofer, V.; Angelstam, P.; Axelsson, R. Legal framework for biosphere reserves as learning sites for sustainable development: A comparative analysis of Ukraine and Sweden. Ambio 2013, 42, 174–187. [Google Scholar] [CrossRef]
  26. Alfsen-Norodom, C. Urban Biosphere and Society: Partnership of Cities—Introduction. In Urban Biosphere and Society: Partnership of Cities; Alfsen-Norodom, C., Lane, B.D., Corry, M., Eds.; New York Academy of Sciences: New York, NY, USA, 2004; Volume 1023, pp. 1–9. ISBN 1-57331-554-0. [Google Scholar]
  27. UNESCO. Lima Action Plan for UNESCO’s Man and the Biosphere (MAB) Programme and its World Network of Biosphere Reserves (2016–2025); EuroMAB, Ed.; UNESCO: Lima, Peru, 2016; p. 11. [Google Scholar]
  28. UN. Transforming Our World: The 2030 Agenda for Sustainable Development; United Nations: New York, NY, USA, 2015; pp. 1–41. [Google Scholar]
  29. UNESCO. Urban Biosphere Reserves in the context of the Statutory Framework and the Seville Strategy for the World Network of Biosphere Reserves: Report from the MAB Urban Group. In Proceedings of the International Co-ordinating Council of the Man and the Biosphere (MAB) Programme Eighteenth Session, Paris, France, 25–29 October 2004; p. 10. [Google Scholar]
  30. Price, M.F.; Park, J.J.; Bouamrane, M. Reporting progress on internationally designated sites: The periodic review of biosphere reserves. Environ. Sci. Policy 2010, 13, 549–557. [Google Scholar] [CrossRef]
  31. Wu, J. Urban ecology and sustainability: The state-of-the-science and future directions. Landsc. Urban Plan. 2014, 125, 209–221. [Google Scholar] [CrossRef]
  32. OECD. Definition of Functional Urban Areas (FUA) for the OECD Metropolitan Database; OECD: Paris, France, 2013; p. 9. [Google Scholar]
  33. Tryzna, T. Global Urbanization and Protected Areas—Challenges and Opportunities Posed by a Major Factor of Global Change—And Creative Ways of Responding; California Institute of Public Affairs: Sacramento, CA, USA, 2007; Available online: http://www.interenvironment.org/home2.html (accessed on 14 February 2016).
  34. McDonald, R.I.; Forman, R.T.; Kareiva, P.; Neugarten, R.; Salzer, D.; Fisher, J. Urban effects, distance, and protected areas in an urbanizing world. Landsc. Urban Plan. 2009, 93, 63–75. [Google Scholar] [CrossRef]
  35. Stoll-Kleeman, S.; O’Riordan, T. The Challenges of the Anthropocene for Biosphere Reserves. Parks 2017, 23, 89–100. [Google Scholar] [CrossRef]
  36. MEA. Ecosystems and Human Well-Being: Biodiversity Synthesis; World Resources Institute: Washington, DC, USA, 2005. [Google Scholar]
  37. Brandmüller, T.; Lupu, I.; Önnerfors, Å.; Corselli-Nordblad, L.; Coyette, C.; Johansson, A.; Strandell, H.; Wolf, P. Urban Europe: Statistics on Cities, Towns and Suburbs; Eurostat: Luxembourg, 2016; Volume 2016, p. 286.
  38. Kosztra, B.; Büttner, G.; Hazeu, G.; Arnold, S. Updated CLC Illustrated Nomenclature Guidelines; Service Contract No 3436/R0-Copernicus/EEA.56586 Task 7, D7.2–Part 1; European Environment Agency, Ed.; Environment Agency Austria: Vienna, Austria, 2017. [Google Scholar]
  39. Gerard, F.; Petit, S.; Smith, G.; Thomson, A.; Brown, N.; Manchester, S.; Wadsworth, R.; Bugar, G.; Halada, L.; Bezák, P.; et al. Land cover change in Europe between 1950 and 2000 determined employing aerial photography. Prog. Phys. Geogr. Earth Environ. 2010, 34, 183–205. [Google Scholar] [CrossRef] [Green Version]
  40. De Fries, R.; Hansen, A.; Newton, A.C.; Hansen, M.C. Increasing isolation of protected areas in tropical forests over the past twenty years. Ecol. Appl. 2005, 15, 19–26. [Google Scholar] [CrossRef]
  41. McKinney, M.L. Urbanization, Biodiversity, and Conservation. BioScience 2002, 52, 883–890. [Google Scholar] [CrossRef]
  42. Niemelä, J. Ecology of urban green spaces: The way forward in answering major research questions. Landsc. Urban Plan. 2014, 125, 298–303. [Google Scholar] [CrossRef]
  43. UNESCO. Madrid Action Plan for Biosphere Reserves (2008–2013); Man and the Biosphere Programme Office, Ed.; UNESCO: Paris, France, 2008. [Google Scholar]
  44. Dogse, P. Interview with Peter Dogse, UNESCO, via Skype at His Office in Paris on Mapping of UNESCO Biospheres and the Biosphere Smart Tool. ed.; Harris, M., Ed.; Interview with Peter Dogse, UNESCO MAB: Paris, France, 2019.
  45. Sundseth, K.; Raeymaekers, G. Biodiversity and Natura 2000 in Urban Areas, Nature in Cities across Europe: A review of key issues and experiences. In Division of Nature; Gryseels, M., Ed.; Bruxelles Environnement-IBGE/Leefmilieu Brussel-BIM: Brussels, Belgium, 2006; p. 89. [Google Scholar]
  46. Hansen, A.J.; De Fries, R. Ecological mechanisms linking protected areas to surrounding lands. Ecol. Appl. 2007, 17, 974–988. [Google Scholar] [CrossRef]
  47. Pool-Stanvliet, R.; Clusener-Godt, M. AfriMAB—Biosphere Reserves in Sub-Saharan Africa: Showcasing Sustainable Development; Department of Environmental Affairs, South Africa and UNESCO Division of Ecological and Earth Sciences: Capetown, South Africa, 2013; p. 350.
  48. ICC; MAB. Main Conclusions and Recommendations of the Twenty-Fourth Session of the International Coordinating Council (ICC) of the Man and the Biosphere (MAB) Programme; UNESCO MAB: Paris, France, 2012; p. 80. [Google Scholar]
  49. UNESCO. Periodic Review for Biosphere Reserve Form; MAB, Ed.; UNESCO: Paris, France, 2013; p. 29. [Google Scholar]
  50. Biosphere Smart Initiative (BSI) Foundation; Spanish MAB National Committee: Madrid, Spain, 2012. Available online: http://www.biospheresmart.org/ (accessed on 5 May 2019).
  51. Marin, C. Metadata for Biosphere Smart; Reply to query by email; Harris, M., Hochstrasser, T.; UCD: Dublin, Ireland, 2019; p. 1.
  52. Marin, C. Update of Biosphere Smart Centroids. Further Reply to Email Queries on Updates of Biosphere Smart ed.; Harris, M., Hochstrasser, T.; UCD: Dublin, Ireland, 2019; p. 1.
  53. Bouamrane, M.; Personal Communication with Meriem Bouamrane, EuroMAB. Personal Communication via Email in March 2019 and in Personal Conversations at EuroMAB Conference in Dublin 2–5 April 2019. Personal Communication, 2019.
  54. German UNESCO Commission. Swabian Alb Biosphere Reserve. Available online: https://www.unesco.de/en/node/2391 (accessed on 18 February 2017).
  55. Rhön Biosphere Reserve. Rhön Biosphere Reserve Zonation. Available online: https://biosphaerenreservat-rhoen.de/zonierung (accessed on 17 February 2017).
  56. Matysek, K.A.; Stratford, E.; Kriwoken, L.K. The UNESCO Biosphere Reserve Program in Australia: Constraints and opportunities for localized sustainable development. Can. Geogr. 2006, 50, 85–100. [Google Scholar] [CrossRef]
  57. Guevarra, S.; Laborde, J. The Landscape Approach: Designing New Reserves for Protection of Biological and Cultural Diversity in Latin America. Environ. Ethics 2009, 30, 251–262. [Google Scholar] [CrossRef]
  58. Department of Economic and Social Affairs, Population Division; United Nations. World Urbanization Prospects (WUP): The 2018 Revision, Online Edition; United Nations, Ed.; United Nations: Paris, France, 2018; Available online: https://population.un.org/wup/Download/ (accessed on 5 June 2019).
  59. UN. Urban Population (Percent of Total) (2012). Available online: https://data.worldbank.org/indicator/sp.urb.totl.in.zs (accessed on 17 September 2018).
  60. Bateman, I.J.; Brainard, J.S.; Lovett, A.A.; Garrod, G.D. The impact of measurement assumptions upon individual travel cost estimates of consumer surplus: A GIS analysis. Reg. Environ. Chang. 1999, 1, 24–30. [Google Scholar] [CrossRef]
  61. Hanauer, M.M.; Reid, J. Valuing urban open space using the travel-cost method and the implications of measurement error. J. Environ. Manag. 2017, 198, 50–65. [Google Scholar] [CrossRef] [PubMed]
  62. Vandeviver, C. Applying Google Maps and Google Street View in criminological research. Crime Sci. 2014, 3, 1. [Google Scholar] [CrossRef]
  63. Dijkstra, E.W. A note on two problems in connexion with graphs. Numer. Math. 1959, 1, 269–271. [Google Scholar] [CrossRef] [Green Version]
  64. Lanning, D.R.; Harrell, G.K.; Wang, J. Dijkstra’s Algorithm and Google Maps. In Proceedings of the 2014 Association for Computing Machinery (ACM) Southeast Regional Conference, Kennesaw, GA, USA, 28–29 March 2014; Association for Computing Machinery (USA): New York, NY, USA, 2014; pp. 1–3. [Google Scholar]
  65. Silva, F.B.E.; Poelman, H. Mapping Population Density in Functional Urban Areas—A Method to Downscale Population Statistics to Urban Atlas Polygons; European Commission: Brussels, Belgium, 2016; p. 28.
  66. Mohn, A.; Nikowitz, T. Saving the “Amazon of Europe”-Mura-Drava-Danube: Rivers at the Crossroads between Protection and Destruction; Austria WWF, Ed.; WWF: Vienna, Austria, 2016; pp. 1–8. [Google Scholar]
  67. Van Cuong, C.; Dart, P.; Hockings, M. Biosphere reserves: Attributes for success. J. Environ. Manag. 2017, 188, 9–17. [Google Scholar] [CrossRef]
  68. Möller, L. Criteria for German Biosphere Reserves. UNESCO today. J. Ger. Comm. UNESCO 2007, 2007, 46–50. [Google Scholar]
  69. Brody, S.D. Measuring the Effects of Stakeholder Participation on the Quality of Local Plans Based on the Principles of Collaborative Ecosystem Management. J. Plan. Educ. Res. 2003, 22, 407–419. [Google Scholar] [CrossRef] [Green Version]
  70. EEA. State of Nature in the EU. Results from Reporting Under the Nature Directives 2007–2012; European Environment Agency: Luxembourg, 2015; ISBN 978-92-9213-586-7. [Google Scholar]
  71. Bargheer, S. Conserving the future: UNESCO biosphere reserves as laboratories for sustainable development. In Endangerment, Biodiversity and Culture; Vidal, F., Dias, N.I., Eds.; Routledge: Abingdon, UK, 2016; pp. 115–133. ISBN 9781138847415. [Google Scholar]
  72. De La Vega-Leinert, A.C.; Nolasco, M.A.; Stoll-Kleemann, S. UNESCO Biosphere Reserves in an Urbanized World. In Environment; Taylor & Francis Group: Abingdon, UK, 2012; Volume 54, pp. 26–37. [Google Scholar] [CrossRef]
  73. Calvache, M.F.; Prados, M.-J.; Lourenço, J.M. Assessment of National Parks affected by naturbanization processes in Southern Europe. J. Environ. Plan. Manag. 2016, 59, 1629–1655. [Google Scholar] [CrossRef]
  74. Hermoso, V.; Morán-Ordóñez, A.; Brotons, L. Assessing the role of Natura 2000 at maintaining dynamic landscapes in Europe over the last two decades: Implications for conservation. Landsc. Ecol. 2018, 33, 1447–1460. [Google Scholar] [CrossRef]
  75. Ishwaran, N.; Persic, A.; Tri, N.H. Concept and practice: The case of UNESCO biosphere reserves. Int. J. Environ. Sustain. Dev. 2008, 7, 118. [Google Scholar] [CrossRef]
  76. Hadley, M. Forty years of field laboratories in sustainability science. World Sci. 2011, 9, 2–11. [Google Scholar]
  77. Jaeger, J.A.G.; Tomáš, S.; Madriñán, L.F.; Schwick, C.; Kienast, F. Landscape Fragmentation in Europe. (FOEN); European Environment Agency (EEA), Swiss Federal Office for the Environment (FOEN), Eds.; European Environment Agency: Copenhagen, Denmark, 2011; Volume 2011, p. 92. [Google Scholar]
  78. Salvati, L.; Zambon, I.; Chelli, F.M.; Serra, P. Do spatial patterns of urbanization and land consumption reflect different socioeconomic contexts in Europe? Sci. Total. Environ. 2018, 625, 722–730. [Google Scholar] [CrossRef] [PubMed]
  79. Sánchez-Bayo, F.; Wyckhuys, K.A. Worldwide decline of the entomofauna: A review of its drivers. Boil. Conserv. 2019, 232, 8–27. [Google Scholar] [CrossRef]
  80. McNeely, J.A. Cities and protected areas: An oxymoron or a partnership? Parks 2001, 11, 1–3. [Google Scholar]
  81. Watson, J.E.M.; Dudley, N.; Segan, D.B.; Hockings, M. The performance and potential of protected areas. Nature 2014, 515, 67–73. [Google Scholar] [CrossRef] [PubMed]
  82. Bridgewater, P. The Man and Biosphere programme of UNESCO: Rambunctious child of the sixties, but was the promise fulfilled? Curr. Opin. Environ. Sustain. 2016, 19, 1–6. [Google Scholar] [CrossRef]
  83. Navarro, L.M.; Fernandez, N.; Guerra, C.; Guralnick, R.; Kissling, W.D.; Londoño, M.C.; Muller-Karger, F.; Turak, E.; Balvanera, P.; Costello, M.J.; et al. Monitoring biodiversity change through effective global coordination. Curr. Opin. Environ. Susnatain. 2017, 29, 158–169. [Google Scholar] [CrossRef]
  84. Brambilla, M.; Ronchi, S. The park-view effect: Residential development is higher at the boundaries of protected areas. Sci. Total. Environ. 2016, 569, 1402–1407. [Google Scholar] [CrossRef]
  85. Woodroffe, R.; Ginsberg, J.R. Edge Effects and the Extinction of Populations Inside Protected Areas. Science 1998, 280, 2126–2128. [Google Scholar] [CrossRef] [Green Version]
  86. Martínez-Harms, M.J.; Bryan, B.A.; Balvanera, P.; Law, E.A.; Rhodes, J.R.; Possingham, H.P.; Wilson, K.A. Making decisions for managing ecosystem services. Boil. Conserv. 2015, 184, 229–238. [Google Scholar] [CrossRef] [Green Version]
Figure 1. Evolution of UNESCO Man and the Biosphere (MAB) Strategies [8,27,29,43] for managing urbanisation of biospheres.
Sustainability 11 05899 g001
Figure 2. Examples of BRs in relation to Functional Urban Area (FUA). (a) An urban BR—Collina Po BR and the FUA of Turin, Italy. The FUA overlaps with all three zones of Collina Po BR. (b) A non-urban BR within a zone of influence—Babia Gora BR and the FUA of Krakow, Poland. The FUA boundary is <50 km from the BR boundary and urbanisation impacts may be present. (c) A non-urban BR outside of the zone of influence of urbanisation—Gorge of Samaria BR and the FUA of Heraklion, Greece on the island of Crete. The BR boundary is >50 km from the FUA boundary.
Sustainability 11 05899 g002
Figure 3. Number of UNESCO Biosphere Reserves (BRs) in EU-28 countries. The nine countries which have only one or two BRs are grouped under “Other EU countries”. Transboundary reserves were counted for each country that they occur within. The blue bars indicate the number of BRs outside Functional Urban Areas (FUAs) and the orange bars indicate the number of BRs within an FUA.
Sustainability 11 05899 g003
Figure 4. Percentage of BRs that are located within a Functional Urban Area (FUA) as defined by the Urban Atlas [12] by country. The darker red the colour of the country is, the higher the percentage of urbanised BRs. Centroids of UNESCO Biosphere Reserves (BRs) in the EU-28 are shown. The EU-28 countries that do not have BRs at all were excluded (country boundaries are from Eurostat European Union, 1995–2018).
Sustainability 11 05899 g004
Table 1. Datasets used in this study.
DatasetSourceDateInformation Obtained
AOfficial list from the UNESCO MAB website of all BRs (n = 167)[22]April 2016Names, countries of each BR, year of designation, year of last review and hyperlinks to sources (C) and (D);
BBiosphere Smart[50]May 2019BR boundaries; to measure distance to the nearest FUA; verify BR centroids
CUNESCO webpages for individual BRs[22]Feb–Mar 2017BR centroids and geographic coordinates; area (hectares), geography; maps (where unavailable in B)
DOfficial websites of UNESCO BRsnoteMay 2019Maps of BR boundaries (if unavailable in B)
EGoogle MapsnoteFeb–Mar 2017Verify BR locations and geographic features in C; measure accessibility of BRs from cities
FWorld Database of Protected Areas (WDPA)[21]August 2018Verify BR centroids in C and boundaries in B
GEuropean Union Natura 2000 sites database[23]October 2017Coincidence of BR centroids [15] with N2000 sites
HCopernicus Urban Atlas (UA) 2012 viewer[19]May 2019proximity, accessibility and population of FUAs
Table 2. Five different terms for UNESCO biospheres which were mapped as polygons in the WDPA dataset [21], both globally and within countries of the EU.
Term for UNESCO BRNo. in GlobalNo. in EUEU Countries (ISO-3) and Number of Polygons by Country
Biosphere Park44AUT(4)
Biosphere Polygon3030LTU(30)
Biosphere Reserve993ESP(1), LTU(1), LVA (1)
Biosphere Reserve and Indigenous Territory100
UNESCO-MAB Biosphere Reserve28325BGR(1), CZE(6), DEU(3), ESP(2), FRA(1), GBR(1), GRC(2), GRL/DNK(1), HRV(2), IRL(2), ITA(1), POL(2), PRT(1)
Total for polygon files of UNESCO BRs4176262
Note: There is only one UNESCO BR in Lithuania as of April 2016. Therefore, the 30 polygons referred to here are the components of just one BR.
Table 3. Number of UNESCO Biosphere Reserves (BRs) in the EU-28 within each area category derived from the scientific literature.
Area (a) in hectaresNumber of BRsComments
a ≤ 10,00025Too small to meet zonation requirements [30,67]
10,000 < a ≤ 30,00029Ideal as “living laboratory” [47]
30,000 < a ≤ 150,00064Ideal size of biospheres unless transboundary [68]
150,000 < a ≤ 500,00040Large or transboundary BRs [68]
a > 500,0009Very large BRs
Table 4. BRs with multiple FUAs and their attributes.
Country (EU)Biosphere NameNearest FUAsDistance to FUA (km)FUA Population
BulgariaKoupenaPlovdiv; Pazardzhik8556,902
BulgariaTchervenata SténaPlovdiv; Asenovgrad0556,902
Czech RepublicLower MoravaBrno; Prague; Vienna; Bratislava1733,005
FranceBassin de la DordogneBrive la Guillarde; Bordeaux0122,918
FranceCamargue (delta du Rhône) *Nimes; Avignon; Montpellier0315,314
FranceGorges du GardonNimes; Avignon0315,314
FranceLuberon-LureAix-en-Provence; Marseilles01,659,942
France and ItalyMont Viso Transboundary BRTurin; Nice01,754,424
GermanySchaalseeLubeck; Hamburg0409,515
GermanyWaddensea of HamburgBremerhaven; Hamburg0319,357
ItalyAppennino Tosco-EmilianoParma; La Spezia0298,946
ItalySilaCosenza; Cantanzaro0219,603
LatviaNorth VidzemeRiga; Tartu1725,909
NetherlandsWaddensea AreaLeeuwarden; Groningen0467,594
SloveniaJulian Alps/Triglav National Park *Klagenfurt; Ljublana; Udine1246,563
SpainBabiaLeón; Oviedo28212,119
SpainDoñanaHuelva; Jerez de la Frontera0421,122
Spain (and Morocco)Intercontinental BR MediterraneanAlgeciras; Ceuta0129,628
SpainValle de Laciana *Ponferrada; Oviedo; Leon2566,447
Note: The asterisk (*) indicates BRs under the influence of three or more FUAs. Nearest FUAs are listed in order of shortest distance first. For “FUA Population”, the population is of that FUA which is listed first. Distance to FUA is the shortest distance (km) between the outermost settlement within the BR transition zone to the boundary of that FUA which is listed first.
Table 5. Biospheres with FUAs in another country.
Biosphere NameCountry (EU-28)Nearest FUAFUA PopulationDistance to City Centre (km)Distance to FUA Boundary (km)
Grosses WalsertalAustriaSt. Gallen, Switzerland142,0617827
SrébarnaBulgariaCalarasi, Romania82,9602513
Tchoupréné/ChupreneBulgariaNiš, Serbia427,84712918
Lower MoravaCzech RepublicBrno; Prague; Vienna, Austria; Bratislava, Slovakia733,005531
SumavaCzech RepublicPassau, Germany239,492561
Berchtesgadener LandGermanySalzburg, Austria343,055251
AggtelekHungaryKošice, Slovakia359,362460
Julian Alps/Triglav National ParkSloveniaLjublana, Slovenia; Udine, Italy246,563871
The KarstSloveniaTrieste, Italy232,097262
Kozjansko & ObsoteljeSloveniaZagreb, Croatia1,132,952611
Ordesa-ViñamalaSpainPau, France258,79612320
Note: For “FUA Population”, the population is of that FUA which is listed first. Distance to FUA boundary is the shortest distance (km) from the outermost settlement within the BR transition zone to the boundary of that FUA which is listed first.
Table 6. Number of BRs in each band of accessibility (distance (d) from City Centre in km).
Distance (km)Number of BRsAccessibility from City Centre of FUA
011in FUA
11adjoining FUA
1 < d ≤ 105walking/cycling distance from urban neighbourhoods
10 < d ≤ 5041within short driving distance at urban speeds
50 < d ≤ 10065short day trip
100 < d ≤ 30039day-trip excursion
300 < d ≤ 5000weekend destination to countryside
500 < d5distant destination

