Abstract
Life cycle assessment is a crucial tool in evaluating systems performances for sustainability and decision-making. This paper provided environmental impact of integrating renewable energy systems to the utility-grid based on a baseline optimized energy production data from “HOMER” for renewable systems modelling of a site in northern Nigeria. The ultimate goal was to ascertain the best hybrid option(s) in sustaining the environment. Different assumptions and scenarios were modelled and simulated using Ganzleitlichen Bilanz (GaBi). Uncertainty analysis was ensured to the impact data based on pedigree-matrix and Excel-program, as well as overall policy relevance. The results of the impact categories revealed first scenario (i.e., conventional path-based) with the highest impacts on global warming potential (GWP), acidification potential (AP), human toxicity potential (HTP), and abiotic depletion potential (ADPfossils). The lowest impacts arise in the renewable-based scenarios for all the considered categories except the Ozone-layer depletion potential Category where the highest contribution falls in the third scenario (i.e., photovoltaic (PV)/biomass-biogas system) although all values being infinitesimal. In quantitative terms, the reduction in the GWP from the highest being the first scenario to the lowest being the fourth scenario (i.e., wind/biomass-biogas system) was 96.5%. Hence, with the outstanding contributions of the hybrid renewable systems, adopting them especially the lowest impact scenarios with expansions is relevant for environmental sustainability.
1. Introduction
Energy production and utilization are strongly necessary for development, and are considered as key indicators to industrialization. The kind of energy services to pursue has a strong impact on sustainable development. Therefore, by definition, sustainable development is an improvement that fulfils the need of the present, as well as the future generation without compromising their ability [1]. The sustainable development fundamentally covered three pillars, that is social, economic and environmental pillars. The environmental concerns in this regard are being focused on, as the research was solely based them. It is evident that the global population continues to rise drastically, ultimately leading to drastic increase in energy demand, which requires energy supply and ensuring a sustainable environment for socio-economic development at all levels [2]. It is strongly noted that human survival and their living standard level strongly depend on their environment either directly or indirectly. Hence it is obvious as to how the three pillars are strongly intertwined.
In ascertaining the full sustainable impact of a system or a product, life cycle assessment (LCA) is a key. Therefore, LCA basically entails holistic evaluations of a material, product, process, or service on its environmental impacts over its whole life cycle, that is from cradle to death [3]. There are fundamentally two basic approaches to the LCA, that is attributional, describing the physical flows to and from the LCA system, and the consequential approach describing the environmental consequences of possible future altering of physical flows from and to an LCA system [4]. Different stages are thus necessary in realizing the LCA, namely the goal and scope definition, inventory analyses, impact assessment and overall interpretations in accordance with the ISO 14040 [5]. On the basis of the brief description, many software packages with extensive databases comprising of inventory data sets in a wide range of areas necessary and sufficient for conducting any LCA have been developed. The Environmental Protection Agency (EPA) has identified and vividly described around 25 software packages each having different features but similar concepts; however, the most commonly used ones are the Ganzheitliche Bilanz (GaBi), System for Integrated Environmental Assessment of Products (SIMAPRO), Umberto LCA+, and openLCA [3,6]. In addition, LCA approach has been reported according to the works by Kelly and Bruijn et al. [3,7] to be applied in different domains; namely, research and industrial measures, complex business strategies, policy environment, and specifically for products, services and behavioral life style choices.
On the basis of the literature search, it was observed that many research works have been conducted and published in the field of LCA in the global context, including the domain of renewable energy. Bringing in some of the studies while restricting to only the renewable energy-based is necessary in ascertaining the uniqueness of this research contribution. Luo et al. [8] conducted a comparative life cycle assessment of photovoltaics electricity generation by different multi-crystalline silicon technologies applied in Singapore. The study was on the basis of energy payback periods and greenhouse gas emissions. A regional life cycle assessment for sustainability of solar photovoltaics in the north east of England has been addressed by Li et al. [9]. The study focused on three categories or indicators namely the techno-economic, environmental, and social impacts. Liptow et al. [10] accounted for the effect of carbon flows in LCA of biomass-based products considering the case of Sweden for wood to ethylene and Brazil for sugarcane to ethylene via different routes. The global warming potentials and land use impacts were the analyzed indicators in the life-cycle. Jones et al. [11] applied the benefits and limitations qualitative measures to a prospective and consequential LCA and net energy analyses (NEA) of decentralized electricity generation. They concluded that a combined LCA and NEA approach are appropriate, provided a number of policy related issues are addressed. A comparative study of the environmental life cycle impacts of nuclear, wind, and hydropower plants in Ontario, Canada has been conducted by Siddiqui and Dincer [12]. The study was done using GaBi tool, with the LCIA Method of the Institute of Environmental Sciences of the University of Leiden (CML) 2015 considered and different life cycle impact categories analyzed. Uddin and Kumar [13] compared the performance of vertical and horizontal wind turbine in Thailand on an LCA basis using SimaPro. The approach considered involved analyzing the LCA embodied energy, as well as environmental and emission impacts.
Additionally, Atilgan and Azapagic [14] worked on the life cycle environmental impacts for renewable electricity in Turkey. Different power plants were considered in the country both large and small, and ranging from hydropower to wind and to geothermal in different locations. The analyses were conducted using GaBi tool via a CML 2001 approach and the impact categories were evaluated. Rajput et al. [15] carried out an LCA of 3.2 kW cadmium telluride PV system in India. The study approach was based on energy performance and costing, where parameters such as energy payback period, energy production factor, life cycle conversion efficiency, and life cycle cost were analyzed. Santoyo-Castelazo and Azapagic [16] offered a sustainability assessment of energy systems of different scenarios in the future energy supply of Mexico. The approaches put forward in the study were environmental LCA and life cycle costs (LCC), social sustainability and multi-criteria decision analyses. Life cycle assessment of substituting natural gas for biofuels in industrial heat generation was studied by Repele and Bazbauers [17] in Latvia. Different biofuels where considered in the substitution including biogas, first- and second-generation biofuels with the environmental impacts analyzed using SimaPro based on Recipe and EcoIndicator 99 approaches. To proceed further, Menoufi et al. [18] proposed a life cycle assessment in comparing building added concentrated photovoltaics (BACPV) and conventional building integrated photovoltaics (BIPV) system in Spain. The authors applied the energy performance measures namely energy payback and energy return factor, coupled with the environmental impact indicators.
Basing on the reviewed studies on hybrid-based systems, Ristimaki et al. [19] made their investigations on LCA for a new residential district energy system in Finland. The approach employed involved linking the life cycle carbon emission with life cycle costing, with different systems such as heating and electricity including hybrid and renewables incorporation considered. Ayodele et al. [2] conducted a life cycle assessment of waste to energy technologies for electricity generation in Nigeria. Different scenarios that include hybrids were considered in the study for the waste processing techniques, with the analytical approach being electricity generation potentials and environmental impacts. Additionally, the life cycle assessment and life cycle costing analyses have been addressed by Petrillo et al. [20], for an off-grid hybrid renewable energy system in Egypt. The authors considered different scenarios both singly and in hybrid using reciprocating diesel engine, solar PV, and fuel cell based on the Eco-indicator 99 method. Wang et al. [21] conducted a study on the life cycle analyses optimization of a solar-aided hybrid trigeneration system (i.e., combined cooling, heating and power (CCHP)) in Beijing, China. The hybrid consisted of grid-connected solar PV and natural gas power plants with additional solar thermal systems for the energy demand side of the site. The optimization approach was on configuration and load operation variability in minimizing the environmental impact. The summary of all the reviewed studies have been provided in Table 1 at the end of the section.

Table 1.
Summary of the studies consulted in comparison to the study in this paper. [CCHP, combined cooling, heating, and power; PV, photovoltaics; BACPV, building added concentrated PV; BIPV, conventional building integrated PV; GaBi, Ganzheitliche Bilanz; NEA, net energy analyses; AP, acidification potential; BAU, business as usual; CdTe, cadmium telluride].
Having seen some of the past works in the research domain, focusing the argument on the African context, and specifically on Nigeria, the dominance of conventional energy sources is obvious specifically the fossil fuels in the electricity mix with less or no diversification to clean energy services. The overdependence on the fossil energy has been proved by many researchers to have potential detrimental impact to the environment. Hence, the need to diversify sources with clean energy, while lowering the fossil fuel uptake level for their ability to last a long time. This is in view of the depleting nature of fossil energy resources.
Therefore, the purpose of this paper was to see the environmental impact on life cycle ground, for grid-integration of hybrid renewable energy systems into an existing grid in the Nigerian context, focusing on a specific site in the northern part. This was with an ultimate goal of observing the best hybrid option(s) in sustaining the environment based on least impacts. That was achieved based on different model scenarios with different assumptions analyzed, uncertainty evaluation addressed and a wrap-up policy relevance assessment. The renewable energy systems covered were solar PV, wind turbine, and biomass-biogas systems on the baseline of HOMER optimization results. The novelty of this paper is on the strong linkage to HOMER tool energy system modelling, and the uniqueness of the different hybrid systems considered especially in the case study country where such aspects have not been addressed so far. On a final note, the motivation behind the study was generally on the need to address natural resources depletion as well as environmental degradation in making a proper decision as to what is appropriate and sustainable for the environment.
The manuscript is structured in sections following the introduction as follows: The study site is clearly described in Section 2. Section 3 deals with the adopted research methods in much details with an accompanied summarized block diagram of the different deliverables. The results and discussion, covering the elementary mass balance, the different environmental impact categories, the uncertainty evaluations, and overall policy relevance has been addressed in Section 5. Lastly, the conclusion comes in Section 5.
As a final point, the limitation of the research lies in the solely environmental impact analyses without any economic impact or life cycle costing evaluations in the study site. This is therefore strongly recommended as a future work in line with this study. A further limitation stems on the nature of the data collected in the modelling, which were mostly of broader applications beyond the study site. However, this limitation was addressed in the pedigree matrix uncertainty analyses conducted.
2. Study Site Description
Nigeria is a country blessed with abundant fossil fuel resources, specifically oil and natural gas. It is ranked as the leading country in terms of the natural gas reserve, and is second after Libya in oil reserve in the African continent. It must be stated also that abundant renewable energy resources exist in the country namely biomass, wind, solar, and hydro although being site specific. It is unfortunate that the level of utilization of the renewable sources to final energy generation is chronically poor. Instead, overdependence on fossil resources for final energy services particularly electricity as our central focus has been a habitual thing despite their depleting nature and some environmental consequences. In this context as a strong view, integrating the renewable energy resources is very crucial in line with the low carbon development transition target, and most significantly for the environmental concerns. This study focusing on the northern part of the country is driven by the existence of high potential for climate-data related renewable energy resources namely the solar irradiation and wind speed. The other resource of interest namely the biomass in the form of waste is considered to be virtually everywhere and in abundance in the whole country. It is considered a resource in disguise, and needs to be utilized in an efficient manner for environmental benefits. Moving specifically to the study location in the northern part of the country, Zaria, it is a municipal area with Coordinate 11.085° N and 7.72° E. The site is situated on a plateau at an elevation of 670 m above sea level [22], and has a total area of 563 km2 with a population of about 975,200 during 2015 [23]. The site’s climate is tropical wet and dry caused by movement of the inter-tropical discontinuity under two air mass influences, that is tropical continental and tropical maritime [24]. To specify further the tropical wet and dry climate nature, the wet season (i.e., summer) lasts from April to October whereas, the dry season (i.e., winter) lasts from November to March. Figure 1 and Figure 2 give the climate-based data, that is solar and wind resources. This is accompanied by the biomass broad classification in Figure 3, as well as the specific biogas resources, that is the animal wastes quantification considered for the biogas fuel production applicable to power generations in Table 2. These are fundamental in modelling the power generations useful for analyzing the environmental life cycle impact.
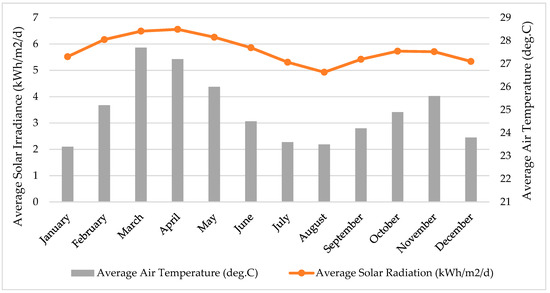
Figure 1.
Average monthly solar irradiation and air temperature for the site of Zaria, Nigeria [25].
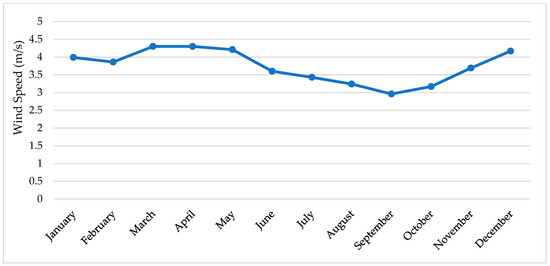
Figure 2.
Average monthly wind speed for the site of Zaria, Nigeria at 50 m [25].
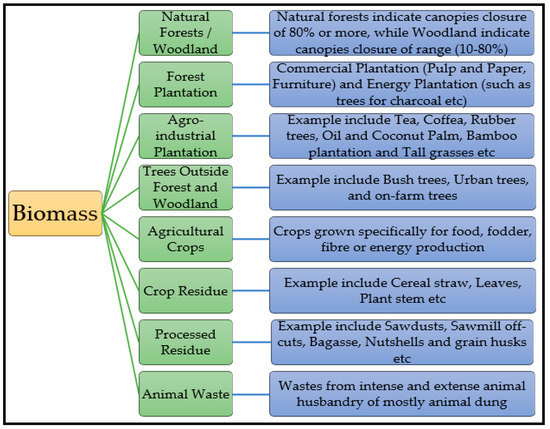
Figure 3.
Biomass resource broad classification with specifications [26].
Table 2.
Nigerian cumulative biomass production and the analyzed values on average for the site of Zaria in 2014 (animal wastes) [27,28,29,30,31].
3. Research Methodology
The research methodology followed an exemplary life cycle stages based on the “ISO 14044”. This standard defined in much details, the goal and scope, as well as the inventory analyses with its broad discussions, leading to the different LCA impact parameters evaluation.
3.1. Goal and Scope Definition
The ultimate goal of the research defined already in the introduction part was to investigate in details, the best hybrid option(s) for the grid integration in ascertaining environmental sustainability on a life cycle ground. This is in favor of better decision making in energy operations. The Functional Unit (FU) that defines the reference flow for the systems and models’ comparison was scaled down to “unit kWh of electricity generation’’, with all the arguments in the analyses being based on this.
Regarding the scope, of all the different scenarios analyzed in the inventory part, the overall mass balance analysis for different elementary flows was looked in to, coupled with in-depth environmental impact categories evaluations based on the selected “LCIA-CML 2015 attributional-based approach”. The selected impact categories within the limit of this research were the global warming potential (GWP), acidification potential (AP), Ozone-layer depletion potential (ODP), eutrophication potentials (EP), human toxicity potential (HTP), and abiotic depletion potential (ADPfossils). The impact data uncertainty analysis was also incorporated. In all cases, the analyses have been on a cradle to grave basis. The different components or technologies in the scenarios were based on medium operational conditions for production in the mix, having being predicted by researchers to be the main world market. Regarding the system boundary, different materials and energy inputs and outputs were incorporated as the life cycle flows. These include agricultural-related materials, radioactive-based materials, water, organic-based materials, volatile organic compounds, halogenated materials, heavy metals, as well as all the necessary energy inputs and the electricity outputs of the different processes involved in the different models and so on. Lastly, an overall wrap-up policy relevance analysis was ensured.
3.2. Inventory Analyses
The inventory analyses for the research begin with the collection and analyses of the Nigerian electricity generation data of a given 2014 baseline year, which is 29,729 GWh, having a mix of ~60% natural gas, ~20% oil, and ~20% hydropower as obtained from the work of [32]. However, the overall task was based on the optimization results of HOMER software for grid-connected solar PV, wind turbine, and biomass-gasified power components of the power system exercise done. This was based on the resource data obtained and other various input specifications and evaluations. Only the optimization results have been brought forth for the LCA analyses. The optimized results were in an attempt to supply energy to 200 households (1200 persons in total) in the considered site, with a peak load of 4MW. The annual analyzed load profile for the site is shown Figure 4, and the optimization results summary in addressing the load demand as applicable to the environmental life cycle analyses is shown in Table 3.
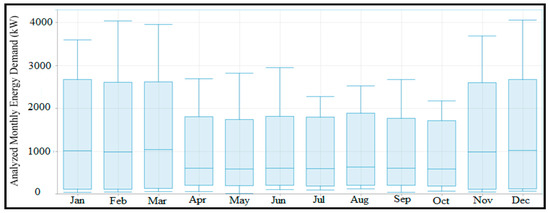
Figure 4.
The site’s analyzed monthly energy demand data for the HOMER optimization.
Table 3.
HOMER optimization results for the site as input to the LCA assessment.
From the optimization results presented, with the cumulative energy production of about 16.53 GWh/yr., and the shares of the subsystem components, different scenarios were formulated. The first being the conventional system scenario based on the country’s baseline generation data of 2014, and considered as the grid-only power case. The other scenarios were the hybrid renewable grid-integration scenario, based on the shares of contributing subsystems to the total for each case in the optimization results of the Table 3. The analyses of the different scenarios with the assumptions made were presented in Table 4.
Table 4.
The different scenarios with their analyzed mix ratios. [HFO, heavy fuel oil; NG, natural gas.]
The block diagrams of all the concerned scenarios analyzed in Table 3 of the environmental life cycle assessment have been provided in Figure 5 as the analyzed GaBi models.
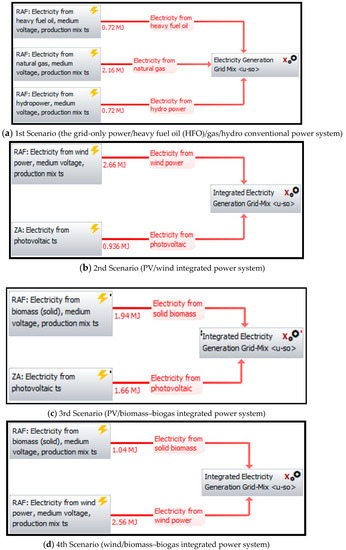
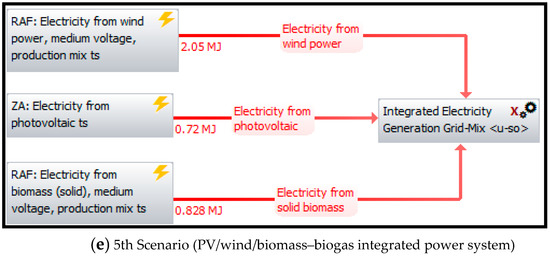
Figure 5.
Models for the different scenarios developed in Ganzheitliche Bilanz (GaBi). [Note: The 1 kWh functional unit (FU) is equivalent to the 3.6 MJ total reference flow in each of the scenarios shown]. (ZA, South African data; RAF, data for Africa on average; PV, photovoltaics.).
In line with the different analyzed mix data shown in Figure 4, the GaBi software electricity processes data used for the different technologies involved were electricity generation from natural gas, electricity generation from hydropower, electricity generation from solar PV, electricity generation from wind power, and electricity generation from biomass-biogas power. These were mostly ‘’RAF’’ data, that is data for the African continent on average, however, for the photovoltaic process, the South African data (ZA) was incorporated, being also African-based data because of the absence of RAF data in that regard. The specified year interval from the database was from 2014 to 2020, hence a six-year validity. The application of the RAF data throughout, coupled with the application of South African data (ZA) for the photovoltaic process becomes necessary and worth doing. This is because the analyzed data are from African continent, and based on African regulations, efficiency of operations, and equipment. Overall, this was because of the absence of data specifically for the case study country point of view.
Lastly, in view of the nature of the data collected for the concerned processes highlighted in the preceding paragraph, uncertainty analyses were conducted based on the pedigree matrix data, coupled with the Excel program, in accounting for the different variations in the impact data as a quality measure. This incorporates basic uncertainties, as well as the different default uncertainty factors with their level assignments for the different processes in getting the overall uncertainties and standard deviations that are applicable for the band estimations of the impacts data. The data distributions considered were lognormal and normal, based on a confidence interval of 68%.
The overall and summarized methodology for the environmental life cycle assessment task has been presented in Figure 6, in a block flow for more clarity to the readers.
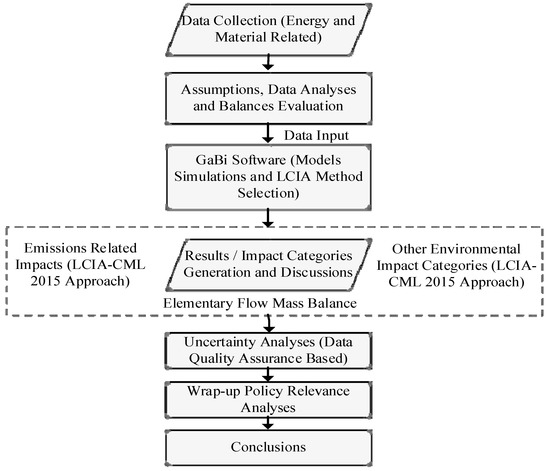
Figure 6.
LCA Summarized flow steps adopted in the research.
4. Results and Discussion
The results of the defined LCA scope, namely the elementary mass balance results, as well as the results of the considered impact categories for the different hybrid scenarios were successful as displayed and discussed next.
4.1. Elementary Mass Flow Balance and Interpretations
The elementary flow balance based on the already explained participating parameters and indicators for all the considered scenarios of the LCA system were successfully procured, as presented in Table 5. It became obvious from the estimated total resource values for the different scenarios that first scenario (i.e., the conventional system path) has the largest value, which is 1.84 × 10³ kg/kWhelec., and is mostly attributable to the hydro portion of it, showing its high materials and specific energy requirement. The scenario with the lowest resource input is the fourth one, specifically the hybrid wind/biomass-biogas power considerations in the study location, with its value being 32 kg/kWhelec. Moving to the output parameters of the balance, beginning with the aggregate deposited goods, third scenario (i.e., hybrid PV/biomass-biogas power) is considered with the highest value, while the first scenario has the lowest. On the aggregate emissions to air, the same third scenario was considered to have the highest value compared with others, which is in contrast to the aggregate emissions to freshwater where the first scenario contributes the most, leaving the third scenario with the lowest contribution. third scenario is seen as having largest contribution on the other output indicators namely the aggregate emissions to seawater, aggregate emissions to agricultural soils, and aggregate emissions to industrial soil. These remaining indicators leave the first scenario with the least share but with the exception of the aggregate emissions to agricultural soil where the second scenario was seen with the least contribution. Therefore, it can finally be deduced, as reflected in the hybrid system, that, based on specific technologies, solar PV contributes the most on the aggregate deposited goods, emissions to industrial soil, and emissions to seawater. Whereas, the biomass-biogas power system is seen with major contributions to the aggregate emissions to air and agricultural soil. Emissions to fresh water major impact linked to the conventional system could be attributed to hydropower participation. The wind power system is seen with low and moderate impacts of all the indicators.
Table 5.
The grid power mix mass balance for all the consecutive scenarios.
4.2. Impact Categories Results and Interpretations
The results in specifics for the various environmental impact categories selected namely GWP, AP, EP, ODP, HTP, and ADPfossils, for the comparative assessment of the different scenarios considered were successfully procured as depicted and analyzed next.
4.2.1. Global Warming Potential (GWP) Results
The global warming potential arising from the release of greenhouse gases (i.e., CO2, CH4, N2O, and VOC among others, but majorly CO2) is a critical criterion in the power systems decision. This is owing to climate variability and climate change and their strong negative consequences to the environment. The results of this analysis are presented in Figure 7. It is obvious that first scenario where the conventional systems pattern was taken in maintaining the BAU trajectory has the highest GWP, valued at 507 g CO2-eq./kWhelec. This was largely because of the fact that the natural gas and oil power plants are fossil-based, with high direct emissions during the operational stage in the life cycle. However, on the renewables-integration scenarios, the value has decreased significantly to some extent throughout. The fourth scenario, i.e., the scenario with the hybrid wind/biomass-biogas power system consideration was found to have the lowest GWP value, which is 17.8 g CO2-eq./kWhelec. The renewable-based scenario with relatively the highest relative GWP value was found to be 52.9 g CO2-eq./kWhelec. for the hybrid PV/biomass-biogas power system in the third scenario. This is a clear indication that the indirect greenhouse gas emissions associated with all the processes involved in the entire life cycle assessment of the renewable-based scenarios favour wind power generations in the systems architecture as compared with solar PV being the biggest contributor to the GWP in the renewable scenarios, and the biomass-biogas power system with intermediate greenhouse gas emissions impact. On a final note, the GWP of the renewable integration in the fifth scenario, where the complete hybrid system exists based on the full share of each in the HOMER optimization results was noted as 27.4 g CO2-eq./kWhelec.
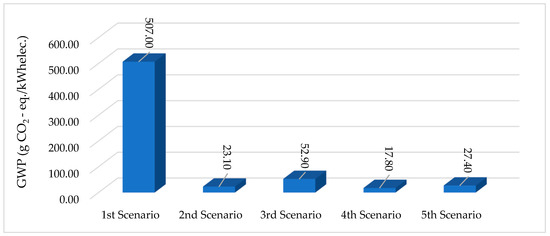
Figure 7.
Global warming potential (GWP) results for all the scenarios.
4.2.2. Acidification Potential (AP) Results
Regarding the acidification potential (AP), which is based on the air pollutants viz. such as SO2, HCl, NH3, and HF gases, the result is obvious with the obtained values for all the scenarios in Figure 8. It is evident that first scenario which has the hybrid conventional sources incorporated in its system architecture contributes the most in the AP indicator, valued at 5.32 g SO2-eq./kWhelec. This is because of the complexity in the system where the fossil-based subcomponents are associated with acidification impact air pollutants apart from the greenhouse gas emissions largely in the operational level of the life cycle. The third scenario (hybrid PV/biomass-biogas) has got the second largest contribution to this impact category, owing to the presence of the biomass-biogas complex system that also causes the release of direct acidification impact air pollutants, apart from the direct greenhouse gas emissions at the operational level for power generation. However, the share of the biomass-biogas in the hybrid renewable system scenarios with such is not strong enough to compete with the share and complexity of the conventional system scenario, into which the oil and the large natural gas-based subsystems are incorporated. The existence of the biomass-biogas system impact also reflected in the fourth and fifth scenarios making them the third and fourth highest contributors in the category respectively. The second scenario being the hybrid PV/wind power system is considered with the lowest contribution in the impact.
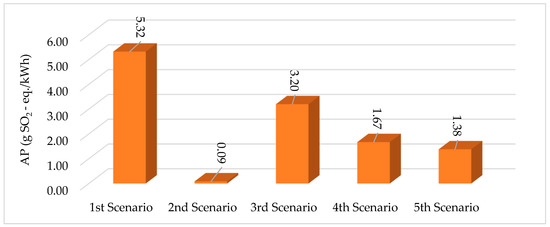
Figure 8.
Acidification potential (AP) results for all the consecutive scenarios.
4.2.3. Eutrophication Potentials (EP) Results
Figure 9 depicts the eutrophication potential (EP) of the different scenarios. This impact is to water bodies for oxygen depletion owing to excessive minerals and nutrients such as N2, NOx, NH4+, PO43−, and P. The major contributor to the EP impact was found to be the third Scenario having the hybrid PV/biomass power system. The value was 0.38 g Phosphate-eq./kWhelec. The second scenario with the incorporation of the hybrid PV/wind power system is seen with the lowest impact where its EP value was around 0.01 g Phosphate-eq./kWhelec. It can be implied that the biomass-biogas power system has a greater negative impact to the EU category as the third scenario reflected in the fourth and fifth scenarios owing to its existence, making them also high. Although the first scenario also has got a relatively high contribution and specifically the third-most, contributing to the impact category. Therefore, it can be deduced that the more the biomass-biogas power in a hybrid system, the more the potential release of the minerals and nutrients inducing the excessive growth of aquatic plants, especially algae, as the nutrients and minerals have a high tendency of contacting water bodies, and ultimately a higher tendency for oxygen depletion in the water bodies.
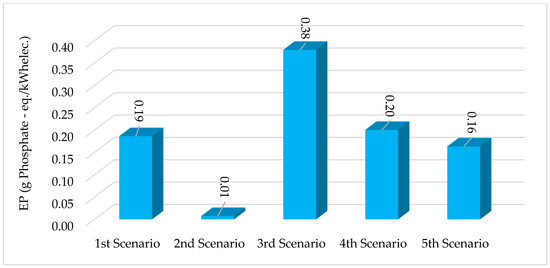
Figure 9.
Eutrophication potential (EP) results for all the consecutive scenarios.
4.2.4. Ozone layer Depletion Potentials (ODP) Results
Moving to the ozone-layer depletion potential (ODP) impact category as a crucial concern, the results are presented in Figure 10 of the different scenarios and basically associated with the release of tri-chloro fluoro carbon (CFC) and other halogenated compounds. It must first be stated that anthropogenic activities being energy-related in this case, could have a strong impact on the stratospheric component of the ecosystem depending on the emitting gases on overall processes in systems life cycle. The results clearly show values ranging from 2.74 × 10⁻¹³ g R11-eq./kWhelec. for the first scenario to the 1.73 × 10⁻¹⁰ g R11-eq./kWhelec. for the third scenario. Although it could be said that all the values were negligible and in extremely smaller fractions, hence, the impact to the ozone layer might be infinitesimal. In a nutshell, it can be said that technologically-speaking, as a reflection to what is seen in the hybrids, the solar PV component is the worst of all in the impact category due to its high potential release of the ozone depleting gases. This could be attributed to the measures put in place mainly during the fabrication stage of the materials of the component. Hence the more the share of the PV component to the system, the greater the tendency for the release of ozone depleting gases in the entire life cycle, based on negligible fractions.
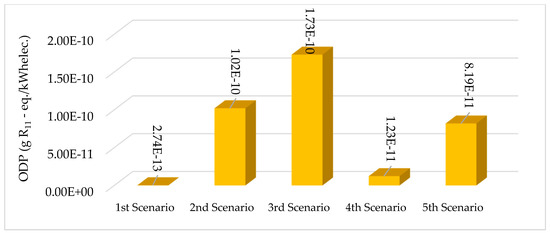
Figure 10.
Ozone layer depletion potential (ODP) results for all the consecutive scenarios.
4.2.5. Human Toxicity Potential (HTP) Results
The human impact from anthropogenic activities for energy generation is worthy of consideration as well. The potential release of harmful substances into the components of the ecosystem namely soil, water, and air, which ultimately affects the quality of human health was analyzed with the results presented in Figure 11. It is obvious from the results that the first scenario has got a value of around 177 g DCB-eq./kWhelec., which exceeded all the values for the renewable integration scenarios, hence the major contributor to this impact category. On the renewable integration scenarios that is from second to fifth scenarios, third scenario (hybrid PV/biomass-biogas power system) followed the first scenario, with an evaluated value of 83.9 g DCB-eq./kWhelec. This makes the fifth and fourth scenarios consisting of the biomass-biogas component to respectively follow the third scenario with values 37.9 g DCB-eq./kWhelec. and 35.6 g DCB-eq./kWhelec. respectively. Hence the biomass system could be seen with high impact on the renewable integration scenarios, and could be attributed to a greater release of toxic substances mainly heavy metals - to air, water, or soil during its fabrication stages. Also, because of the tendency of the release of harmful gases in operation stage to the humans, which is similar to the conventional case-participating fossils as compared with the solar PV and wind power components.
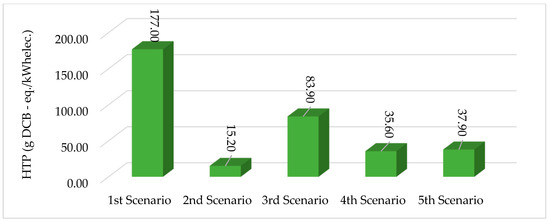
Figure 11.
Human toxicity potential (HTP) results for all the consecutive scenarios.
4.2.6. Abiotic Depletion Potentials (ADPfossils) Results
These evaluations differ from the preceded impacts evaluations, as it carried the unit of energy with the software default setting of Mega Joule (MJ). On the basis of the already known definition of this impact category however, in this regard, relating to fossil fuels, which is the fossil energy utilized throughout the entire life cycle of each of the sub-components in the overall systems, the results obtained of all the scenarios are presented in Figure 12. It is evident that the first scenario has got the largest value, which is 7.46 MJ/kWhelec., obviously because of the higher consumption of fossil energy in the life cycle of the considered sub-components of the system, especially the oil and natural gas-based system subcomponents, that majorly needed fossil fuels specifically oil and natural gas in operational stage to generate electricity on a Rankine cycle basis. Moving to the scenarios for renewable integration, it is noted that third scenario (hybrid PV/biomass-biogas power) followed the first scenario with a value of around 0.6 MJ/kWhelec. The fourth scenario (hybrid wind/biomass-biogas) has the lowest of all, with a value of 0.2 MJ/kWhelec. This could be deduced technologically speaking as reflected in the hybrids that solar PV consumes more fossil energy, while wind power consumes the lowest, and the biomass-biogas power system is intermediate. These fossil energies consumptions assigned to the hybrid renewable systems majorly arise during fabrications of components of the systems as machines powered by fossil fuels are needed, and hence are considered indirect fossil energy consumptions in the life cycle analyses.
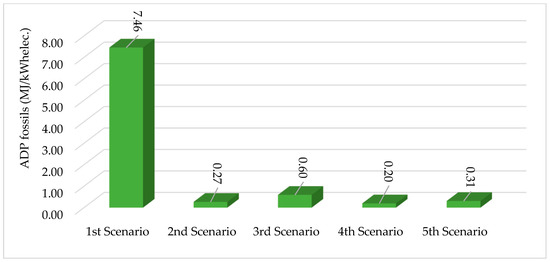
Figure 12.
Abiotic depletion potential (ADPfossils) results for all the consecutive scenarios.
4.3. Uncertainty Analyses Results
The baseline pedigree matrix employed in the uncertainty analyses was developed by Funtowiez and Ravetz in 1990 as a tool for coding a qualitative assessment of data due to uncertainty challenges [33]. Table 6 provided the default uncertainty factors applicable. Table 7 describes in much detail, the pedigree matrix and the evaluation approach in the Excel program for the uncertainties linked to the environmental impact data.
Table 6.
Default uncertainty factors incorporated in the uncertainty evaluations [34].
Table 7.
Overall pedigree matrix for the uncertainty evaluations program.
The results of the different impact categories based on the upper and lower limits and in view of having the data as normally distributed and lognormally distributed are given in Table 8 and Table 9 respectively. The ranges specified include the actual or true value of the impact categories for the specified case study examined. It is evident from the bands that the normal distribution in virtually all the analyzed data have a larger band gap from the top cap to the mid values than the lognormal distribution. On the other hand, meanwhile, the lognormal distribution case has a larger gap from the mid values to the bottom cap. This is because of the orientations of the distributions as the normal is symmetrical whereas the lognormal is right-skewed. This shows the advantage and disadvantage of the two data distribution cases depending on different circumstance, as the normal distribution tends to give ranges with proximity and ease to the exact values when falling on the lower cap than the lognormal distribution, and vice versa.
Table 8.
The analyzed impact categories band (normal distribution case).
Table 9.
The analyzed impact categories band (lognormal distribution case).
On the basis of the obtained results regarding the different aspects addressed, it is important to note that policy implication is very fundamental. Implementing the different hybrid systems especially the ones observed with the lowest impacts on the environment, requires strong policy back-up and political will. This goes back to the renewable policy instruments both regulatory and economic-based, as well as environmental-related policy concerns. This has helped many advanced countries in boosting their renewable energy supply. Currently, integration of renewable systems singly or in hybrid to the utility grid of the Nigerian context is yet to be realized except for the conventional hydro existing with the fossils in the electricity mix. This is because of many challenges among which is the policy framework. Regulatory instruments, principally the feed-in tariff and net-metering are very necessary for such transition. Although, the country already has the feed-in tariff instrument in force but pending impact. What is strongly required in ensuring the activeness of this instrument, as well as bringing in the net-metering in to force are the appropriate designs that ensure favorable pricing mechanisms and other strong features of the instruments. The relevance of the net-metering policy is because of the fact that the renewable energy developers can be consumers at the same time just like the energy system modelling task done as a linkage to this environmental LCA. This cluster of instruments can be made more effective by further incorporating the appropriate economic-based policy instruments, specifically the fiscal policies and the incentives and financing schemes for additional motivations to the private enterprise energy producers. The support schemes should be in such a way that technology transfer and capacity building with ultimate innovations target are strongly covered in the renewable energy domain as strong indicators of research and development (R&D). In addition to these, environmental compliance support schemes and codes should be assigned in order of merits to the development of projects in boosting the power sector. The merit order should reflect the observed environmental impacts of the different energy systems analyzed here and beyond. Furthermore, suitable policies are necessary, enabling the reduction in the pace of conventional energy sources extraction and utilization. Above all, as a final note, public awareness programs are fundamental, regarding the environmental consequences of the energy operation trajectory, as well as the need for changing the narrative.
5. Conclusions
This paper offered in much detail, the environmental impact of integrating renewable energy systems to grid-mix in the northern part of Nigeria. This begins with the conventional generation system case, taking the country’s BAU path as a grid-only power to renewable energy integration on the basis of the obtained result of the techno-economic optimization exercise conducted with HOMER software. Different scenarios in hybrid were considered with different assumptions made, and balances evaluations on the baseline HOMER result input data to the life cycle assessment. Different data sets for the African continent were applied of the different renewable energy as well as the conventional energy processes applicable to the systems modelling. Simulations were done with the impact categories and elementary mass balances all obtained using the GaBi software. Lastly, an uncertainty analysis was conducted on the impact data based on the pedigree matrix and Excel program as well as a wrap-up policy relevance discussion. It is noted that the whole scenarios where scaled down to a functional unit of 1 kWh as the electricity reference flow for the comparison.
Regarding the elementary mass flow balance, it was observed that the third scenario had the highest contributions in output indicators, namely aggregate deposited goods, aggregate emissions to air, aggregate emissions to seawater, aggregate emissions to agricultural soil, and aggregate emissions to industrial soil. Only one output indicator was observed with first scenario having highest share, which was the aggregate emissions to freshwater.
On the specific environmental impact categories analyzed, it could be said that scenarios in which the considered renewables appeared in the different hybrid configurations that contributed the most on the impacts applied to the ODP, and EP categories. This arises with values obtained majorly during the materials extractions, processing and components fabrication phase of the systems, such as the release of heavy metals, ozone-depleting gases and so on. However, other pollutants and gases emissions aside from the greenhouse gases are also peculiar to the biomass-biogas system in system operations. Notwithstanding, the grid-integration of the renewable energy systems in the case study country on a low carbon development basis, which ensures reduction in the uptake level of fossil fuels, is important for environmental sustainability. This is owing to the outstanding features they offered based on minimization of the GWP, HTP, AP, and ADP impacts from the conventional scenario path. The hybrid system idea in linking the different renewable systems to the grid to allay possible drawbacks on any environmental impact inherent in one is worth doing especially giving preference to the scenarios that appeared with the lowest contributions of all, in some of the impact categories.
Author Contributions
Conceptualization, R.B. and I.A.J.; methodology, I.A.J.; software, I.A.J.; formal analysis, I.A.J.; investigations and data curation, I.A.J.; writing—original draft preparation, I.A.J.; review, corrections and overall supervision, R.B. and A.Z.
Funding
This research was carried out under the project ‘’Water and Energy Security in Africa (WESA-ITT)’’, that is financially supported through the German Ministry of Education and Research (BMBF) via its project management agency (DLR).
Conflicts of Interest
The authors declare no conflict of interest.
Nomenclature
| Acronyms and Abbreviations | Units, Symbols and Chemical Formulas |
| AP—Acidification Potential | GWh—Giga Watt Hour |
| ADP—Abiotic Depletion Potential | kg—Kilogram |
| BACPV—Building Added Concentrated Photovoltaics | kW—Kilo Watt |
| BIPV—Conventional Building Integrated Photovoltaics | Wh—Kilo Watt Hour |
| BAU—Business as Usual | MJ—Mega Joule |
| BOD—Biochemical Oxygen Demand | |
| COD—Chemical Oxygen Demand | Mol H+—Mole of Hydrogen Ion |
| CFC-11/R-11—Trichloro Fluoro Methane | m3—Cubic Meters |
| CML—LCIA Method | Yr.—Year |
| DCB—1,4 Di-chlorobenzene | |
| DCP—Di-chlorophenol | |
| Eq.—Equivalence | |
| EPA—Environmental Protection Agency | |
| EP—Eutrophication Potential | As—Arsenic |
| FAETP—Freshwater Aquatic Ecotoxicity Potentials | C—Carbon |
| FU—Functional Unit | Ce—Cesium |
| GaBi—Ganzleitlichen Bilanz (Holistic Balance) | Cd—Cadmium |
| Ghg—Greenhouse Gases | Cr—Chromium |
| GWP—Global Warming Potential | Fe—Iron |
| HFO—Heavy Fuel Oil | H—Hydrogen |
| HOMER—Hybrid Optimization Model for Electric Renewables | Hg—Mercury |
| HTP—Human Toxicity Potentials | Pb—Lead |
| ICE—Inventory of Carbon and Energy | Sb—Antimony |
| ISO—International Standard Organization | TI—Thallium |
| LCA—Life Cycle Assessment | U235—Uranium |
| LCC—Life Cycle Costing | |
| LCIA—Life Cycle Impact Assessment | |
| LCI—Life Cycle Inventory | |
| MAETP—Marine Aquatic Ecotoxicity Potentials | CO2—Carbon Dioxide |
| N/A—Not Applicable | CH4—Methane |
| NEA—Net Energy Analyses | HCl—Hydrogen Chloride |
| NG—Natural Gas | HF—Hydrogen Fluoride |
| ODP—Ozone Layer Depletion Potential | NH3—Ammonia |
| PAF—Potentially Affected Fraction | N2O—Nitrous Oxide |
| PM—Particulate Matter | NOx—Nitrogen Oxide(s) |
| PV—Photovoltaics | N2—Nitrogen Gas |
| R&D—Research and Development | NH4+—Ammonium Ion |
| RAF—Data for Africa on Average | PO42−—Phosphate Ion |
| ReCiPe—LCIA Method | SO2—Sulfur Dioxide |
| TETP—Terrestrial Ecotoxicity Potential | |
| TOC—Total Organic Carbon | |
| TRACI—LCIA Method | |
| SIMAPro—System Integrated Environmental Assessment of Products | |
| VOC—Volatile Organic Compounds | |
References
- Elliot, J.A. An Introduction to Sustainable Development, 3rd ed.; Routledge Taylor and Francis Group: New York, NY, USA, 2006. [Google Scholar]
- Ayodele, T.R.; Ogunjuyigbe, A.S.O.; Alao, M.A. Life cycle assessment of waste-to-energy (WtE) technologies for electricity generation using municipal solid waste in Nigeria. Appl. Energy 2017, 201, 200–218. [Google Scholar] [CrossRef]
- Kelly, B. A Life Cycle Assessment of a Diesel Generator Set. Master’s Thesis, Digital Commons @ Montana Tech, Montana, MT, USA, 2016. [Google Scholar]
- Anoop, S.; Olsen, I.S.; Pant, D. Life Cycle Assessment of Renewable Energy Sources; Springer: Berlin, Germany, 2013; p. 16. [Google Scholar]
- Howe, J.; Pepke, E.; Fernholz, K. A Review of Life Cycle Assessment Tools; Dovetail Partners, Inc.: Minneapolis, MN, USA, 2017. [Google Scholar]
- Menke, D.M.; Gari, A.D.; Vigon, B.W. Evaluation of Life Cycle Assessment Tools; n.pub; Environment, Canada: Gatineau, QC, Canada, 1996. [Google Scholar]
- Bruijn, H.D.; Duin, R.V.; Huijbregts, M.A.; Lindeijer, E. Handbook on Life Cycle Assessment Operational Guide to the ISO Standards; Kluwer Academic Publishers: Dordrecht, The Netherlands, 2002; Volume 7, p. 687. [Google Scholar]
- Luo, W.; Khoo, S.Y.; Kumar, A.; Chong Low, S.J.; Li, Y.; Tan, S.Y. A comparative life-cycle assessment of photovoltaic electricity generation in Singapore by multicrystalline silicon technologies. Sol. Energy Mater. Sol. Cells 2018, 174, 157–162. [Google Scholar] [CrossRef]
- Li, T.; Roskilly, P.A.; Wang, Y. A Regional Life Cycle Sustainability Assessment Approach and its Application on Solar Photovoltaic. Energy Procedia 2017, 105, 3320–3325. [Google Scholar] [CrossRef]
- Liptow, C.; Janssen, M.; Tillman, A.-M. Accounting for effects of carbon flows in LCA of biomass-based products—Exploration and evaluation of a selection of existing methods. Int. J. Life Cycle Assess. 2018, 23, 2110–2125. [Google Scholar] [CrossRef]
- Jones, C.; Gilbert, P.; Raugei, M.; Mander, S.; Lecissi, E. An approach to prospective consequential life cycle assessment and net energy analysis of distributed electricity generation. Energy Policy. 2017, 100, 350–358. [Google Scholar] [CrossRef]
- Siddiqui, O.; Dincer, I. Comparative Assessment of the Environmental Impacts of Nuclear, Wind and Hydro-Electric Power Plants in Ontario: A Life Cycle Assessment. J. Clean. Prod. 2017, 164, 848–860. [Google Scholar] [CrossRef]
- Uddin, S.M.; Kumar, S. Energy, emissions and environmental impact analysis of wind turbine. J. Clean. Prod. 2014, 69, 153–164. [Google Scholar] [CrossRef]
- Atilgan, B.; Azapagic, A. Renewable electricity in Turkey: Life cycle environmental impacts. Renew. Energy 2016, 89, 649–657. [Google Scholar] [CrossRef]
- Rajput, P.; Singh, K.Y.; Tiwari, G.N.; Sastry, O.S.; Dubey, S.; Pandey, K. Life cycle assessment of the 3.2 kW cadmium telluride (CdTe) photovoltaic system in composite climate of India. Sol. Energy 2018, 159, 415–422. [Google Scholar] [CrossRef]
- Santoyo-Castelazo, E.; Azapagic, A. Sustainability assessment of energy systems: Integrating, economic, and social aspects. J. Clean. Prod. 2014, 80, 119–138. [Google Scholar] [CrossRef]
- Repele, M.; Bazbauers, G. Life cycle assessment of renewable energy alternatives for replacement of natural gas in building material industry. Energy Procedia 2015, 72, 127–134. [Google Scholar] [CrossRef]
- Menoufi, K.; Chemisana, D.; Rosell, J.I. Life cycle assessment of a building added concentrating photovoltaic system (BACPV). Energy Procedia 2017, 128, 194–201. [Google Scholar] [CrossRef]
- Ristimaki, M.; Saynajoki, A.; Heinonen, J.; Junnila, S. Combining life cycle costing and life cycle assessment for an analysis of a new residential district energy system design. Energy 2013, 63, 168–179. [Google Scholar] [CrossRef]
- Petrillo, A.; Felice, F.D.; Janelli, E.; Autorino, C.; Minutillo, M.; Lavadera, A.L. Life cycle assessment (LCA) and life cycle cost (LCC) analysis model for a stand-alone hybrid renewable energy system. Renew. Energy 2016, 95, 337–355. [Google Scholar] [CrossRef]
- Wang, J.; Yang, Y.; Mao, T.; Sui, J.; Jin, H. Life cycle assessment (LCA) optimization of solar-assisted hybrid CCHP system. Appl. Energy 2015, 146, 38–52. [Google Scholar] [CrossRef]
- Stephen, I.O.; Egwuonwu, G.; Osazuwa, I. Delineation of All-Season-Recharged Ground Water Reservoir from Two Valleys, Zaria, Nigeria. J. Environ. Hydrol. 2012, 20, 11. [Google Scholar]
- Population.City. Zaria Population. 2015. Available online: http://population.city/nigeria/zaria/ (accessed on 20 November 2017).
- Samuel, Y. Assessment of Water Quality of Hand-Dug Wells in Zaria LGA of Kaduna State, Nigeria. Int. J. Eng. Sci. 2013, 2, 01–04. [Google Scholar]
- National Aeronautics Space Administration (NASA). Surface Meteorology and Solar Energy. Available online: https://eosweb.larc.nasa.gov/sse/RETScreen/ (accessed on 20 October 2017).
- Biomass Users Network (BUN). Biomass Assessment Hand Book: Bioenergy for a Sustainable Environment; Franl, R., Peter, G., Hemstock, S., Jeremy, W., Eds.; EarthScan: London, UK, 2007. [Google Scholar]
- Food and Agricultural Organization (FAO). Crops Data. 2017. Available online: http://www.fao.org/faostat/en/#data (accessed on 20 October 2017).
- United Nations Environmental Program (UNEP). Technologies for Converting Waste Agricultural Biomass to Energy; United Nations Environmental Program (UNEP): Osaka, Japan, 2013. [Google Scholar]
- Paul, D.; Nicolae, F.; Matei, F. Main factors affecting biogas production—An overview. Rom. Biotechnol. Lett. J. 2014, 19, 9283–9296. [Google Scholar]
- Simonya, K.; Fasina, O. Biomass Resources and Bioenergy Potentials in Nigeria. Afr. J. Agric. Res. 2013, 8, 4975–4989. [Google Scholar]
- Moral, R.; Moreno, J.; Perez, M. Characterisation of the organic matter pool in manures. J. Bioresour. Technol. 2004, 96, 153–158. [Google Scholar] [CrossRef] [PubMed]
- The Shift Project. Nigerian Electricity Production. Available online: http://www.tsp-dataportal.org/ (accessed on 20 April 2017).
- Ciroth, A.; Muller, S.; Weidema, B. Empirically based uncertainty factors for the pedigree matrix in ecoinvent. Int. J. Life Cycle Assess. 2016, 21, 1338–1348. [Google Scholar] [CrossRef]
- Ecoinvent. Methodology of Ecoinvent 3; Ecoinvent Technoparkstrasse 1: Zurich, Switzerland, 2001; Available online: https://www.ecoinvent.org/support/faqs/methodology-of-ecoinvent-3/how-to-interpret-the-uncertainty-fields-in-ecoinvent.html (accessed on 20 August 2019).


© 2019 by the authors. Licensee MDPI, Basel, Switzerland. This article is an open access article distributed under the terms and conditions of the Creative Commons Attribution (CC BY) license (http://creativecommons.org/licenses/by/4.0/).