1. Introduction
In recent decades, sustainability has been an increasing concern for a society that involves everything from countries to companies and consumers. Sustainability can be assessed in relation to different scopes, such as a sector, supply chain, company, supplier, and/or product. Many decision-making problems deal with this concept from different perspectives. Life Cycle Assessment (LCA) is a common approach in the scientific literature dealing with product sustainability evaluation. Nevertheless, LCA is not an appropriate tool to support decision making in Sustainable Supply Chain Management (SSCM) [
1]. The Multiple Criteria Decision Making (MCDM) approach is suitable to aggregate different dimensions of sustainability and provides a wide range of methods, which allow us to tackle a wide range of issues and support decision making [
2].
Literature offers a huge number of research works focused on supplier evaluation, as well as well-structured reviews on this topic. The main approaches are Data Envelopment Analysis (DEA), Analytic Hierarchy Process (AHP), Analytic Network Process (ANP), Technique for Order Performance by Similarity to Ideal Solution (TOPSIS), Simple Multi-Attribute Rating Technique (SMART), Preference Ranking Organisation Method for Enrichment Evaluation (PROMETHEE), ELimination Et Choix Traduisant la REalité (ELECTRE) and Linear, Mixed Integer, Goal, and Multiobjective Programming. The applications are concentrated in various manufacturing sectors, such as the automotive, electrical, and electronics sectors, among others [
3,
4,
5,
6,
7,
8,
9,
10].
The SSCM concept involves integrating all three dimensions of sustainability. Nevertheless, published research has mainly been focused on economic and environmental criteria, with scarce contributions that included social criteria. It is also interesting to point out that research has solved the supplier selection problem for one product only, although this situation is not frequent [
11,
12,
13,
14,
15,
16,
17,
18,
19]. In practice, companies buy several products from several suppliers and the same supplier provides several products. Moreover, the majority of case studies used data based on opinions, judgements, and/or direct ratings from experts or managers [
20,
21,
22]. There is a proposal for supplier evaluation for several products, applied to the food industry, in which decision making integrates historical data and expert knowledge [
23].
There are many applications of MCDM methods to supplier evaluation for selection and segmentation in manufacturing companies, some in food industries [
6,
7,
8,
9,
10,
11,
12,
13,
14,
15,
16,
17,
18,
19,
20]. Nevertheless, this situation contrasts with the lack of proposals for the food distribution business, such as supermarket chains. The food supply chain is different from other supply chains when it comes to sustainable management, due to the continuous change in the quality of products until the point of final consumption. In addition to sustainability, consumers demand quality and safety as important food attributes [
24,
25]. Lau et al. (2017) carried out the only research that applies MCDM to fresh food supplier evaluation in a supermarket chain in Australia. They applied Fuzzy AHP to obtain the weights of criteria, ELECTRE to rank the supplier performance with respect to food safety, as a non-compensatory criterion, and TOPSIS to rank suppliers qualified previously by the safety criterion [
26]. Evaluating food suppliers from a sustainable perspective requires the definition of specific criteria and indicators, such as those that are applied to measure food safety [
27]. This criterion can be included in the social dimension [
3], although some authors propose defining food sustainability based on five dimensions: social, environmental, economic, health and ethical [
28].
The aim of this research is to measure the sustainability of products and suppliers in food distribution companies through a multiple criteria approach. For this purpose, a decision support system was designed in order to first obtain product indicators, which allow the companies both to accept/reject products and to assess the quality of food. These product indicators are subsequently included in a global supplier evaluation from a sustainable perspective, which takes into account economic, environmental, and social criteria.
The main contribution of this paper is related to product and supplier evaluation in the last part of the fresh food supply chain, based on multiple criteria techniques, integrating historical and objective data on product and supplier performance rather than the judgements and direct rating from managers alone. This approach also allows us to classify suppliers by analyzing the historical and reliable indicators needed in a decision support system to inform decision making at operational, tactical, and strategic levels. This research innovates in proposing and validating a model to evaluate an important part of the fresh food supply chain from a sustainable perspective, based on historical and objective data. To our knowledge, this is a new and original proposal that allows us to generate information useful for making sustainable decisions on a regular basis in supermarket chains. This supply chain differs from others due to the change in the quality of products until they are consumed. In addition, new social criteria related to food safety are proposed in a novel and unified approach to dealing with sustainable fresh food and supplier evaluation in distribution companies, such as supermarket chains.
The rest of the paper is organized as follows:
Section 2 briefly presents the methodology used and the decision support system proposed for food and supplier evaluation, which is based on several compensatory and non-compensatory multiple criteria techniques. The system proposed has been validated in a real company, a supermarket chain, as explained in
Section 3 and
Section 4. In
Section 3, criteria related to fresh food (fruits) are defined and their utility functions established in order to obtain quality indicators for products by applying Multi-Attribute Utility Theory (MAUT) methodology. The case study allows validation of the model, which is based on data about different varieties of yellow peach and from several suppliers.
Section 4 presents the results of sustainable evaluation of suppliers, by integrating quality indicators of products with food safety, logistic, commercial, and environmental criteria. This sustainable evaluation of suppliers is carried out through PROMETHEE and MAUT. Outcomes from these two methodologies are compared, highlighting their key strengths and weaknesses. Finally, a discussion of results and conclusions is presented in the last two sections, respectively.
2. A Multiple Criteria System for Sustainable Evaluation of Food and Suppliers in Distribution Companies
Multiple Criteria Decision Making (MCDM) techniques stand out among the huge volume of literature focused on supplier evaluation [
3,
5,
6,
8]. When sustainability is taken into account, the MCDM approach is essential to integrate conflicting objectives in the analysis appropriately. Although there is quite a number of well-established methods, selection of the most suitable is a relevant issue. The nature of the real problem to be solved, data availability and type (qualitative/quantitative), uncertainty and decision makers, as well as the chance of success in actual implementation are some of the basic issues to consider. In addition, real problem solving often requires innovative contributions in developing models for decision making.
The system proposed to evaluate fresh food and suppliers is based on at least two multiple criteria methods: MAUT and PROMETHEE, which are adequate and meet the needs for sustainable decision making in fresh food supply chain management. On the one hand, MAUT is easier for managers and decision makers in companies to understand and apply than PROMETHEE. On the other, MAUT is a compensatory method and PROMETHEE is non-compensatory, which is essential in aspects such as food safety, in addition to providing other advantages. For a detailed explanation of both methods, see Belton and Stewart [
29]. The seminal work of Keeney and Raiffa [
30] contributed the foundations and operational mechanics of MAUT. In addition, Brans and Mareschal [
31] provides all versions of the PROMETHEE method, which has been applied to many fields [
32,
33], but only some articles to supply chain management [
20,
23,
34,
35,
36]. AHP is the discrete multiple criteria method most applied on this topic so far, to both elicit weights of criteria and select suppliers, with a fuzzy version also used to deal with uncertainty [
4,
5,
8,
37,
38]. In contrast, MAUT barely appears in the literature, although it is appropriate for qualifying products and suppliers [
3,
23].
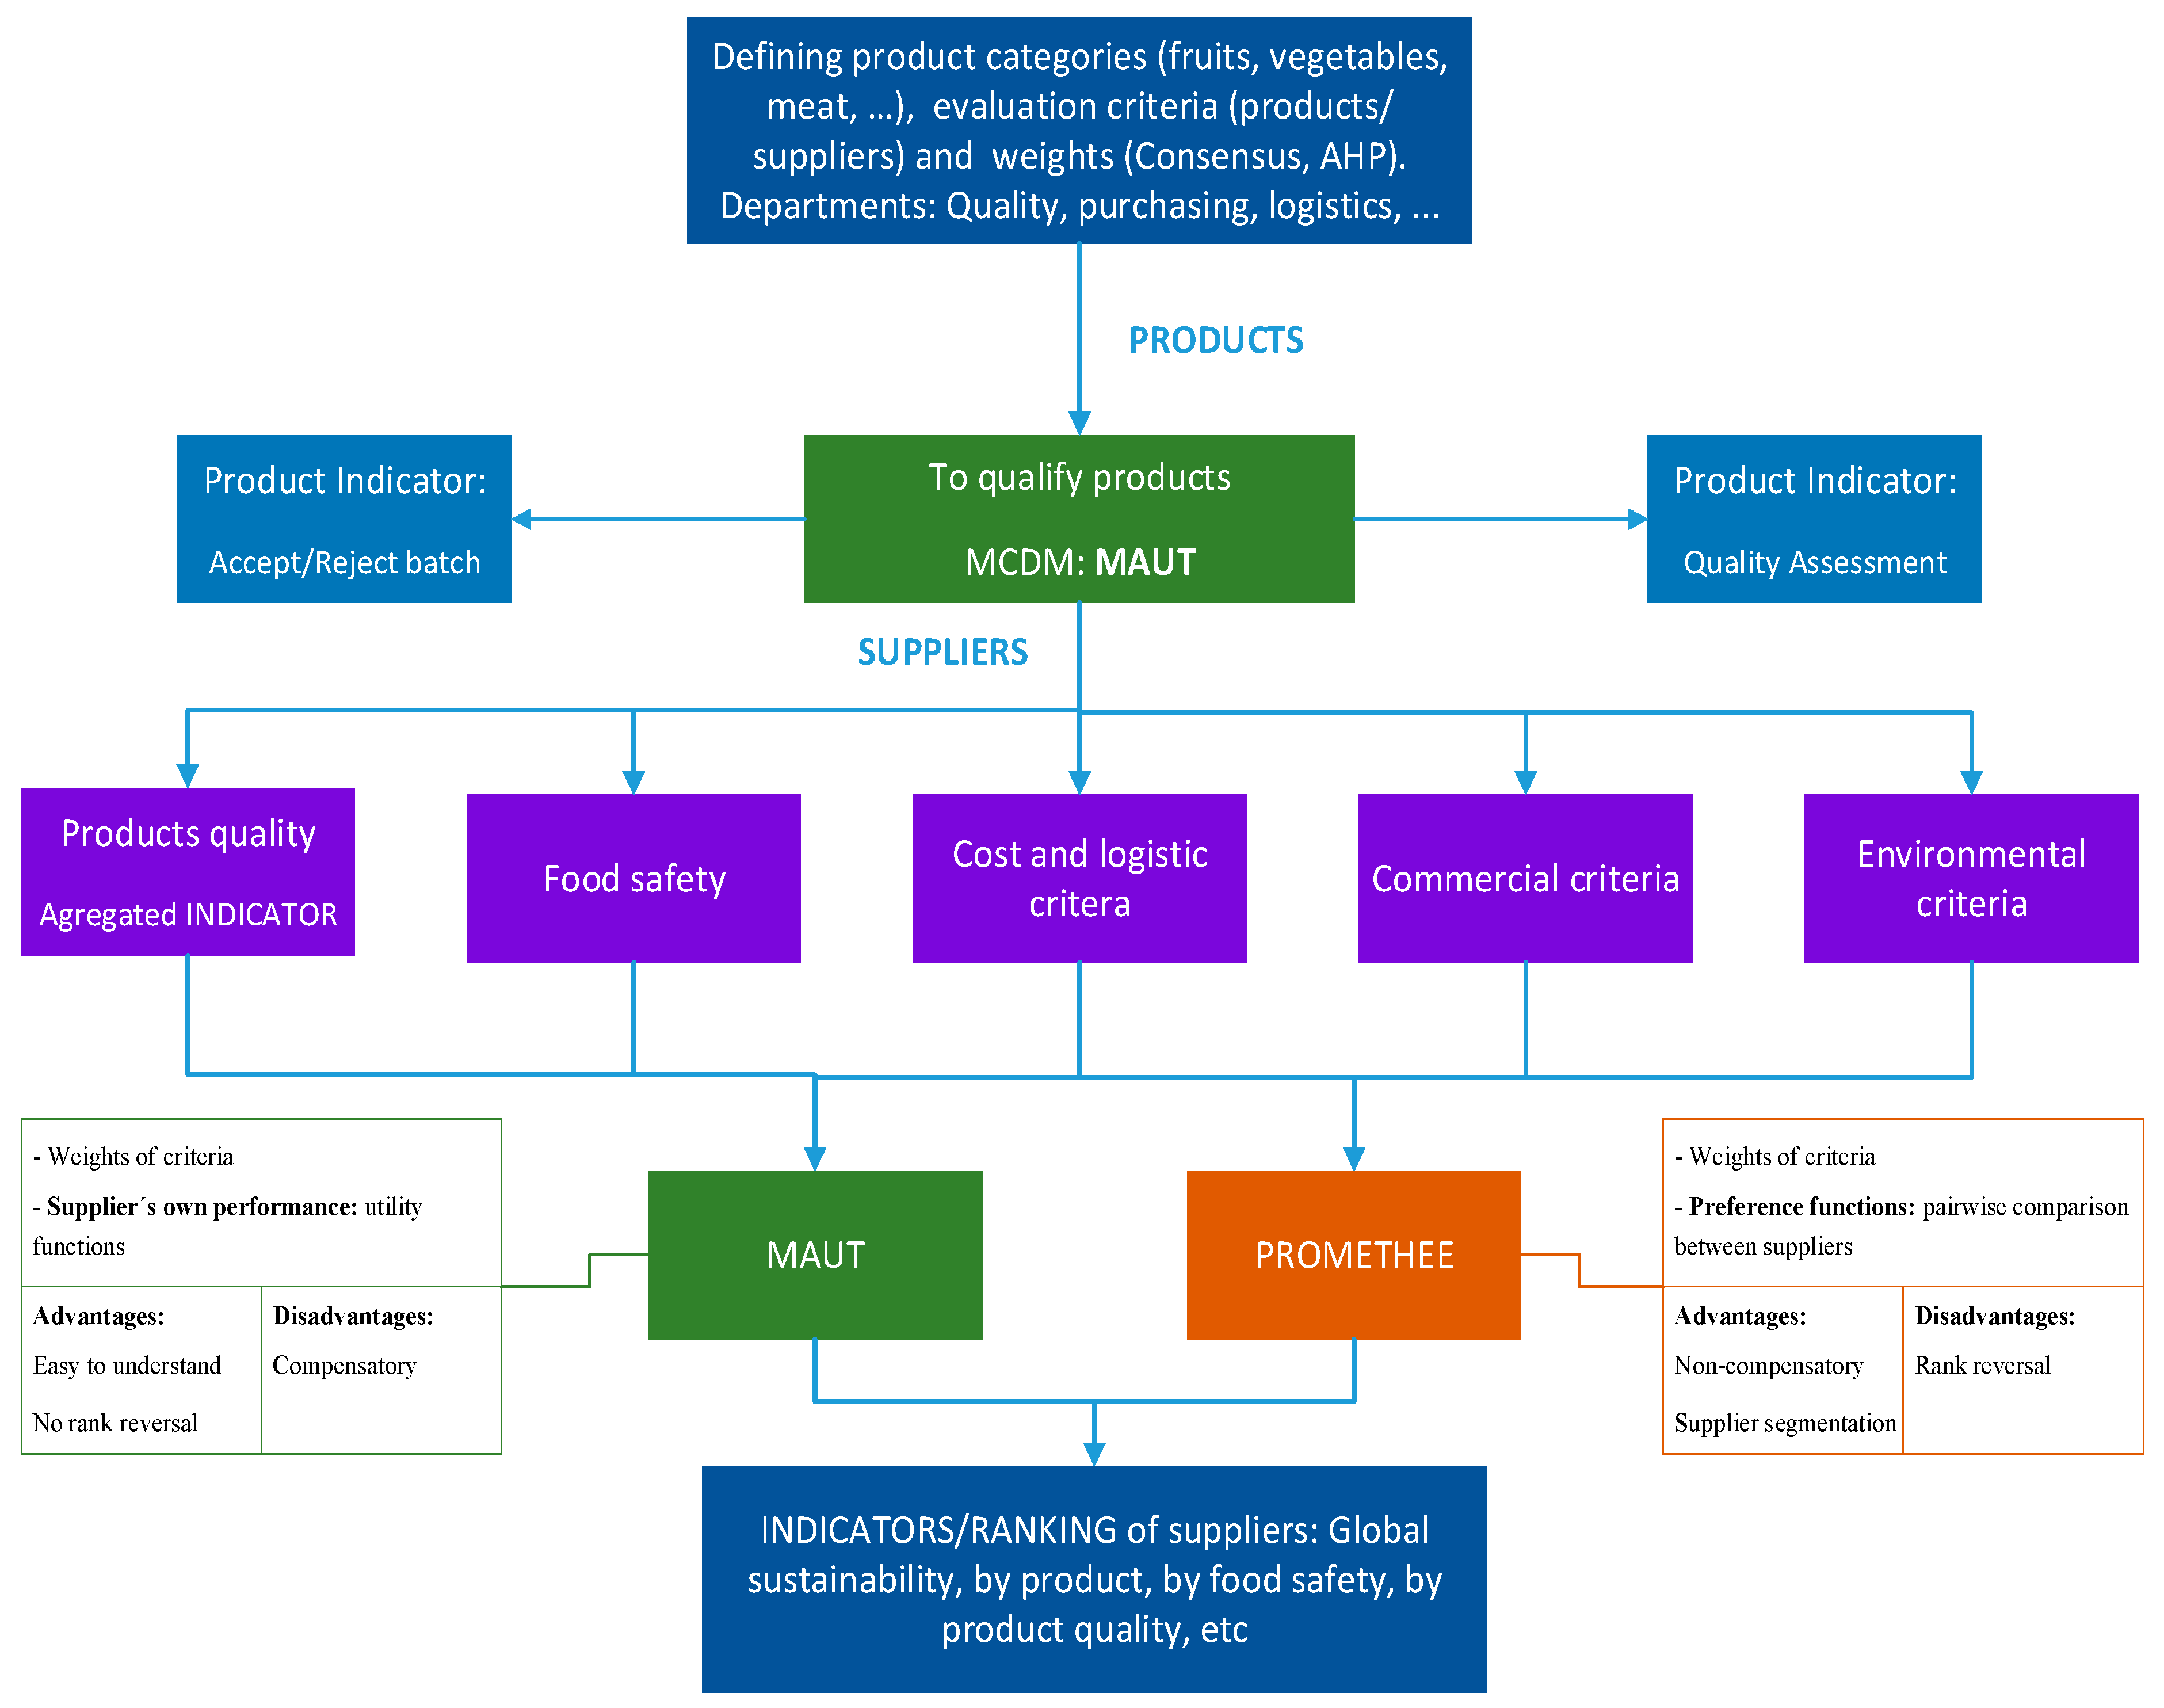
Figure 1 shows the flowchart of the multiple criteria system for sustainable evaluation of food and suppliers in distribution companies proposed in this research. The first step consists of defining product categories, such as fruits, vegetables or meat. Then, focused on a specific category of homogenous products, the second step is to establish the evaluation criteria for products and suppliers. In food distribution companies, the departments involved are quality, purchasing and logistics, among others, depending on organisational structure. The weights of criteria play a very important role in many MCDM methods, and in particular in MAUT and PROMETHEE. Thus, the weights should take the company objectives and strategy into account. There are several ways to assign the weights of criteria. Determining weights by consensus among managers from the main departments or management board involved is one proposal that increases the real implementation of results in decision making. The AHP method, another multiple criteria approach, provides a robust mechanism to elicit the criteria weight collaboratively [
39,
40,
41].
After defining the criteria and grouping them in a hierarchy, as well as determining their weights, the second step is to qualify products. Food distribution companies have logistic platforms where products are checked to decide whether to accept or reject them according to conformity to specifications following established protocols. MAUT is the multiple criteria method to qualify and evaluate the quality of products. Therefore, the values of the criteria for each product are required, as well as the utility function for each criterion. Experts provide the information needed to draw up the specific utility functions. The global score of an alternative obtained by MAUT depends on its own performance, while the score from PROMETHEE is based on the pairwise comparisons among alternatives. As the quality of a product only depends on its performance according to the criteria, PROMETHEE is not applicable in this phase, as an objective quality of a product is not related to the quality of other products.
The third step is supplier evaluation, as shown in
Figure 1. The scores of products provided by suppliers to assess are aggregated and then, together with other groups of criteria, considered for supplier evaluation. These additional criteria are food safety, cost and logistical criteria, commercial criteria, and environmental criteria. Food safety is a social criterion with an increasingly important role in the food supply chain, which can be measured by using sub criteria. The same applies for other criteria of suppliers, as shown in the case study in
Section 4.
Global indicator of suppliers and their ranking are obtained by applying MAUT and PROMETHEE. Both have strengths and weaknesses, as they show complementary perspectives of the evaluation. Both require the weights of criteria; MAUT needs the utility functions that measure the supplier’s own performance, while PROMETHEE uses pairwise comparison between suppliers through preference functions. Being easy for managers to understand is one of the main advantages of MAUT. In addition, it does not present the rank reversal problem, while PROMETHEE does. The compensatory nature of MAUT is its principal disadvantage, whereas the outranking method PROMETHEE is a non-compensatory approach. This is linked with the more discriminant power of the latter, which allows a segmentation mechanism that is very useful in supply chain management. Finally, this system provides indicators of suppliers by product, by food safety, as well as segmentation of suppliers by specific criteria, which is essential for decision making about the best relationship between the company and the supplier, such as for disqualifying suppliers, partnerships, and long-term contracts.
3. Results of the Quality Evaluation of Products
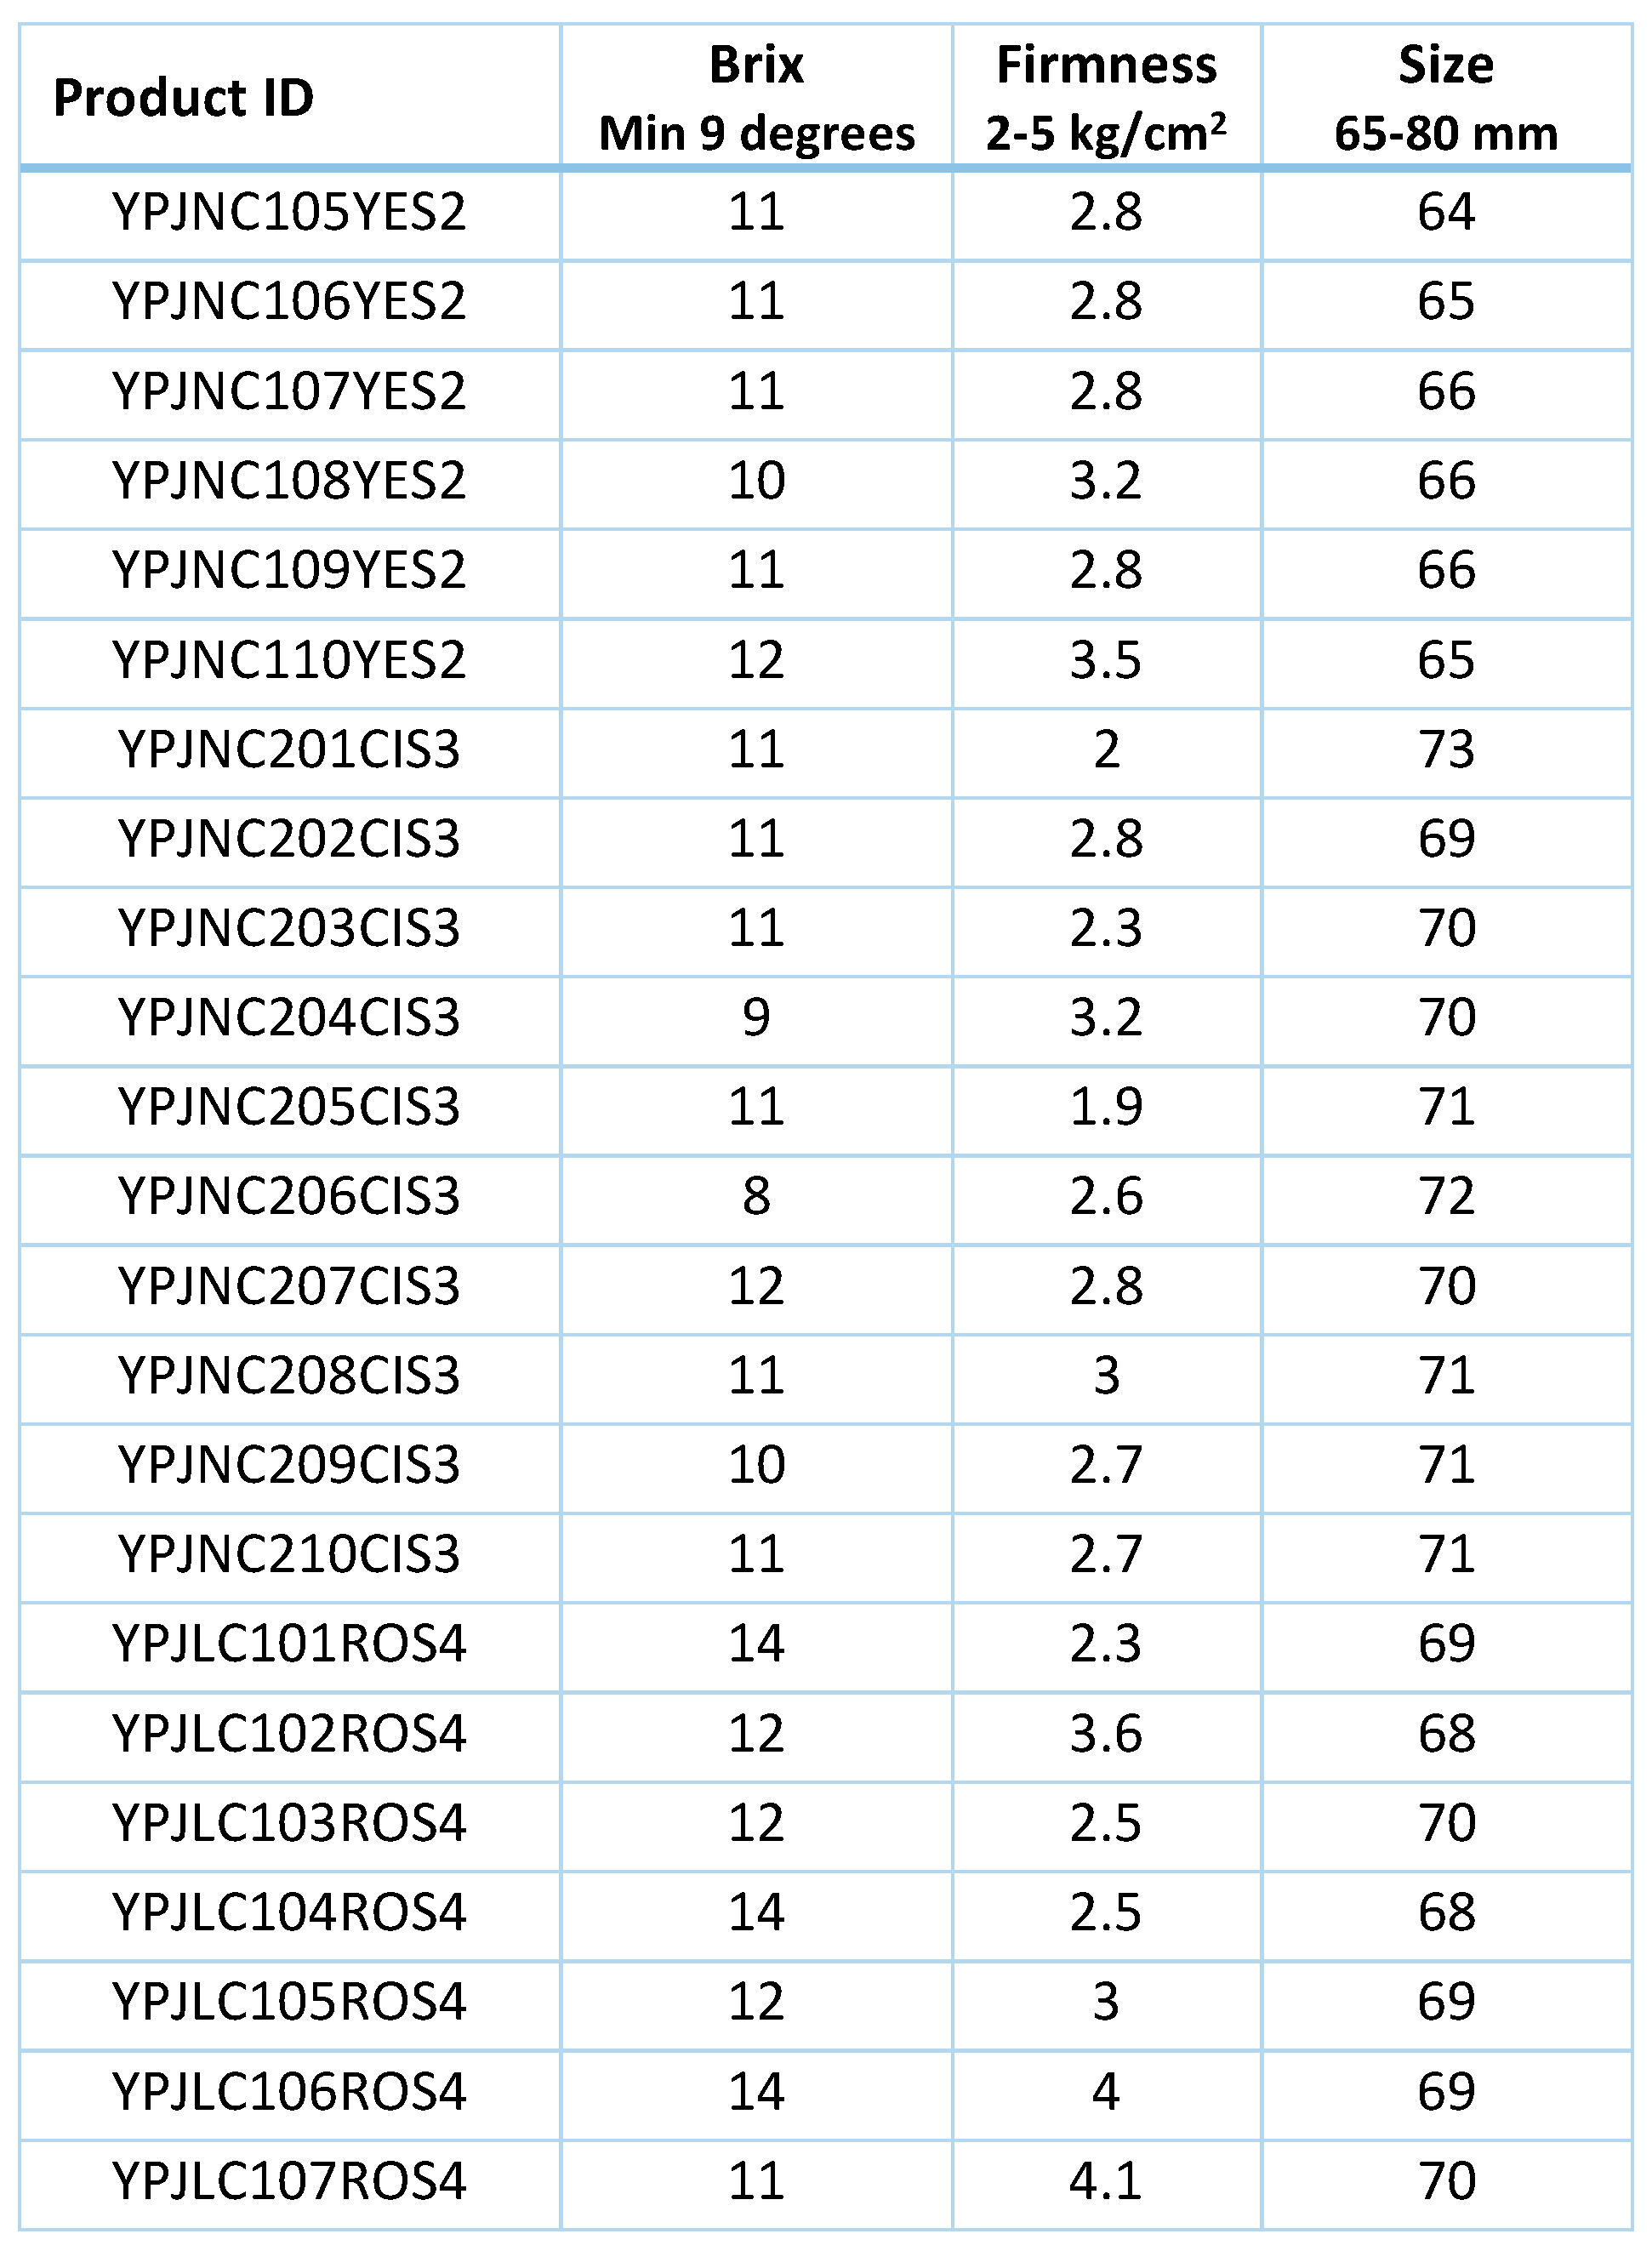
The multiple criteria approach explained in the previous section was applied to evaluate fresh fruits and suppliers in a supermarket chain with 740 stores located in Spain in order to improve the operations management of the company. This section shows the indicators of the quality of yellow peach provided by suppliers in the whole season from May to October 2018, whose data distribution from controls in the logistic platform is in
Table 1. There are 10 varieties of yellow peach from six suppliers.
Following a protocol, the company carries out regular inspections and measures the conformance to specification through three characteristics from ten pieces per batch: the quantity of sugars (Brix degrees), firmness (kg/cm
2) and size (mm). Due to the large amount of data,
Figure 2 only shows some of them, together with minimum and maximum values for these specifications (
supplementary material provides complete data). Brix degrees should be 9 as the minimum level to be acceptable, firmness should be between 2 and 5 kg/cm
2, and peach size between 65 and 80 mm. Based on the compliance level, yes/no for each characteristic, the company assigns a 1/0 indicator, respectively. The global indicator for the fruit inspected is 1 when the three specifications have a value of 1, and zero otherwise. If more than 20% of the fruits score zero, then the batch is rejected. This procedure does not assess the fruit quality. Therefore, it does not distinguish among peaches with minimum, maximum or optimum firmness, which is a criterion whose performance changes over time until the fruit is consumed. The system proposed in the previous section overcomes this weakness by applying a multicriteria approach to decide whether to accept/reject the fruit batch and gauge the product quality. The latter should provide important data for supplier evaluation.
The evaluation table used to apply MAUT and obtain a robust indicator for peach quality was built with data shown in
Figure 2 and the
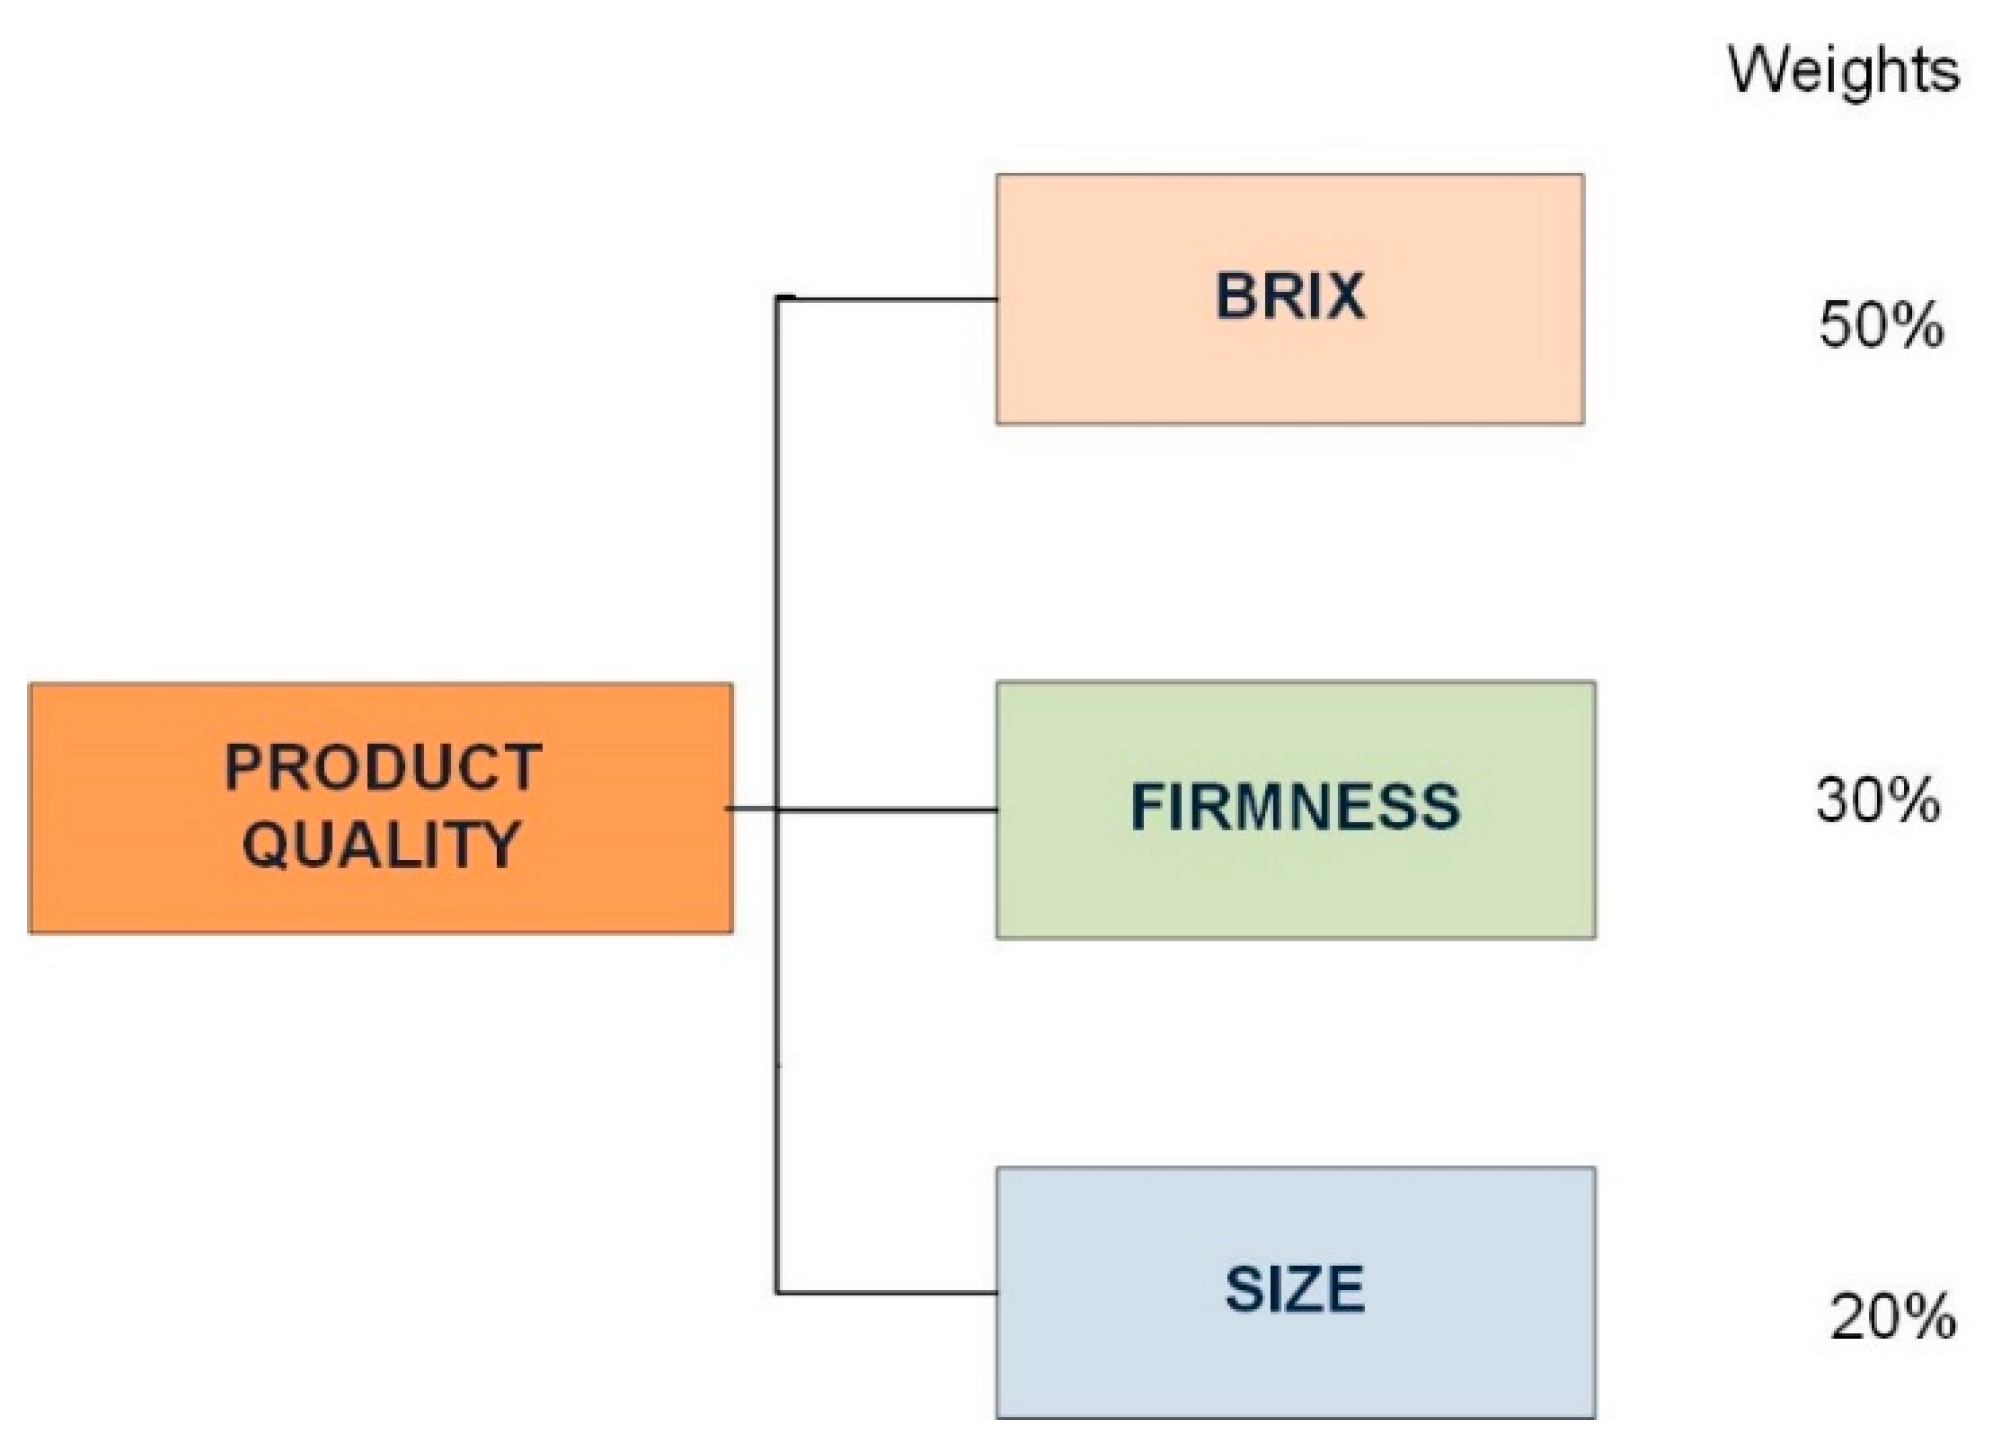
supplementary material. In addition to the evaluation table, MAUT needs the weights of criteria, as shown in
Figure 3, which were set by consensus in the quality department.
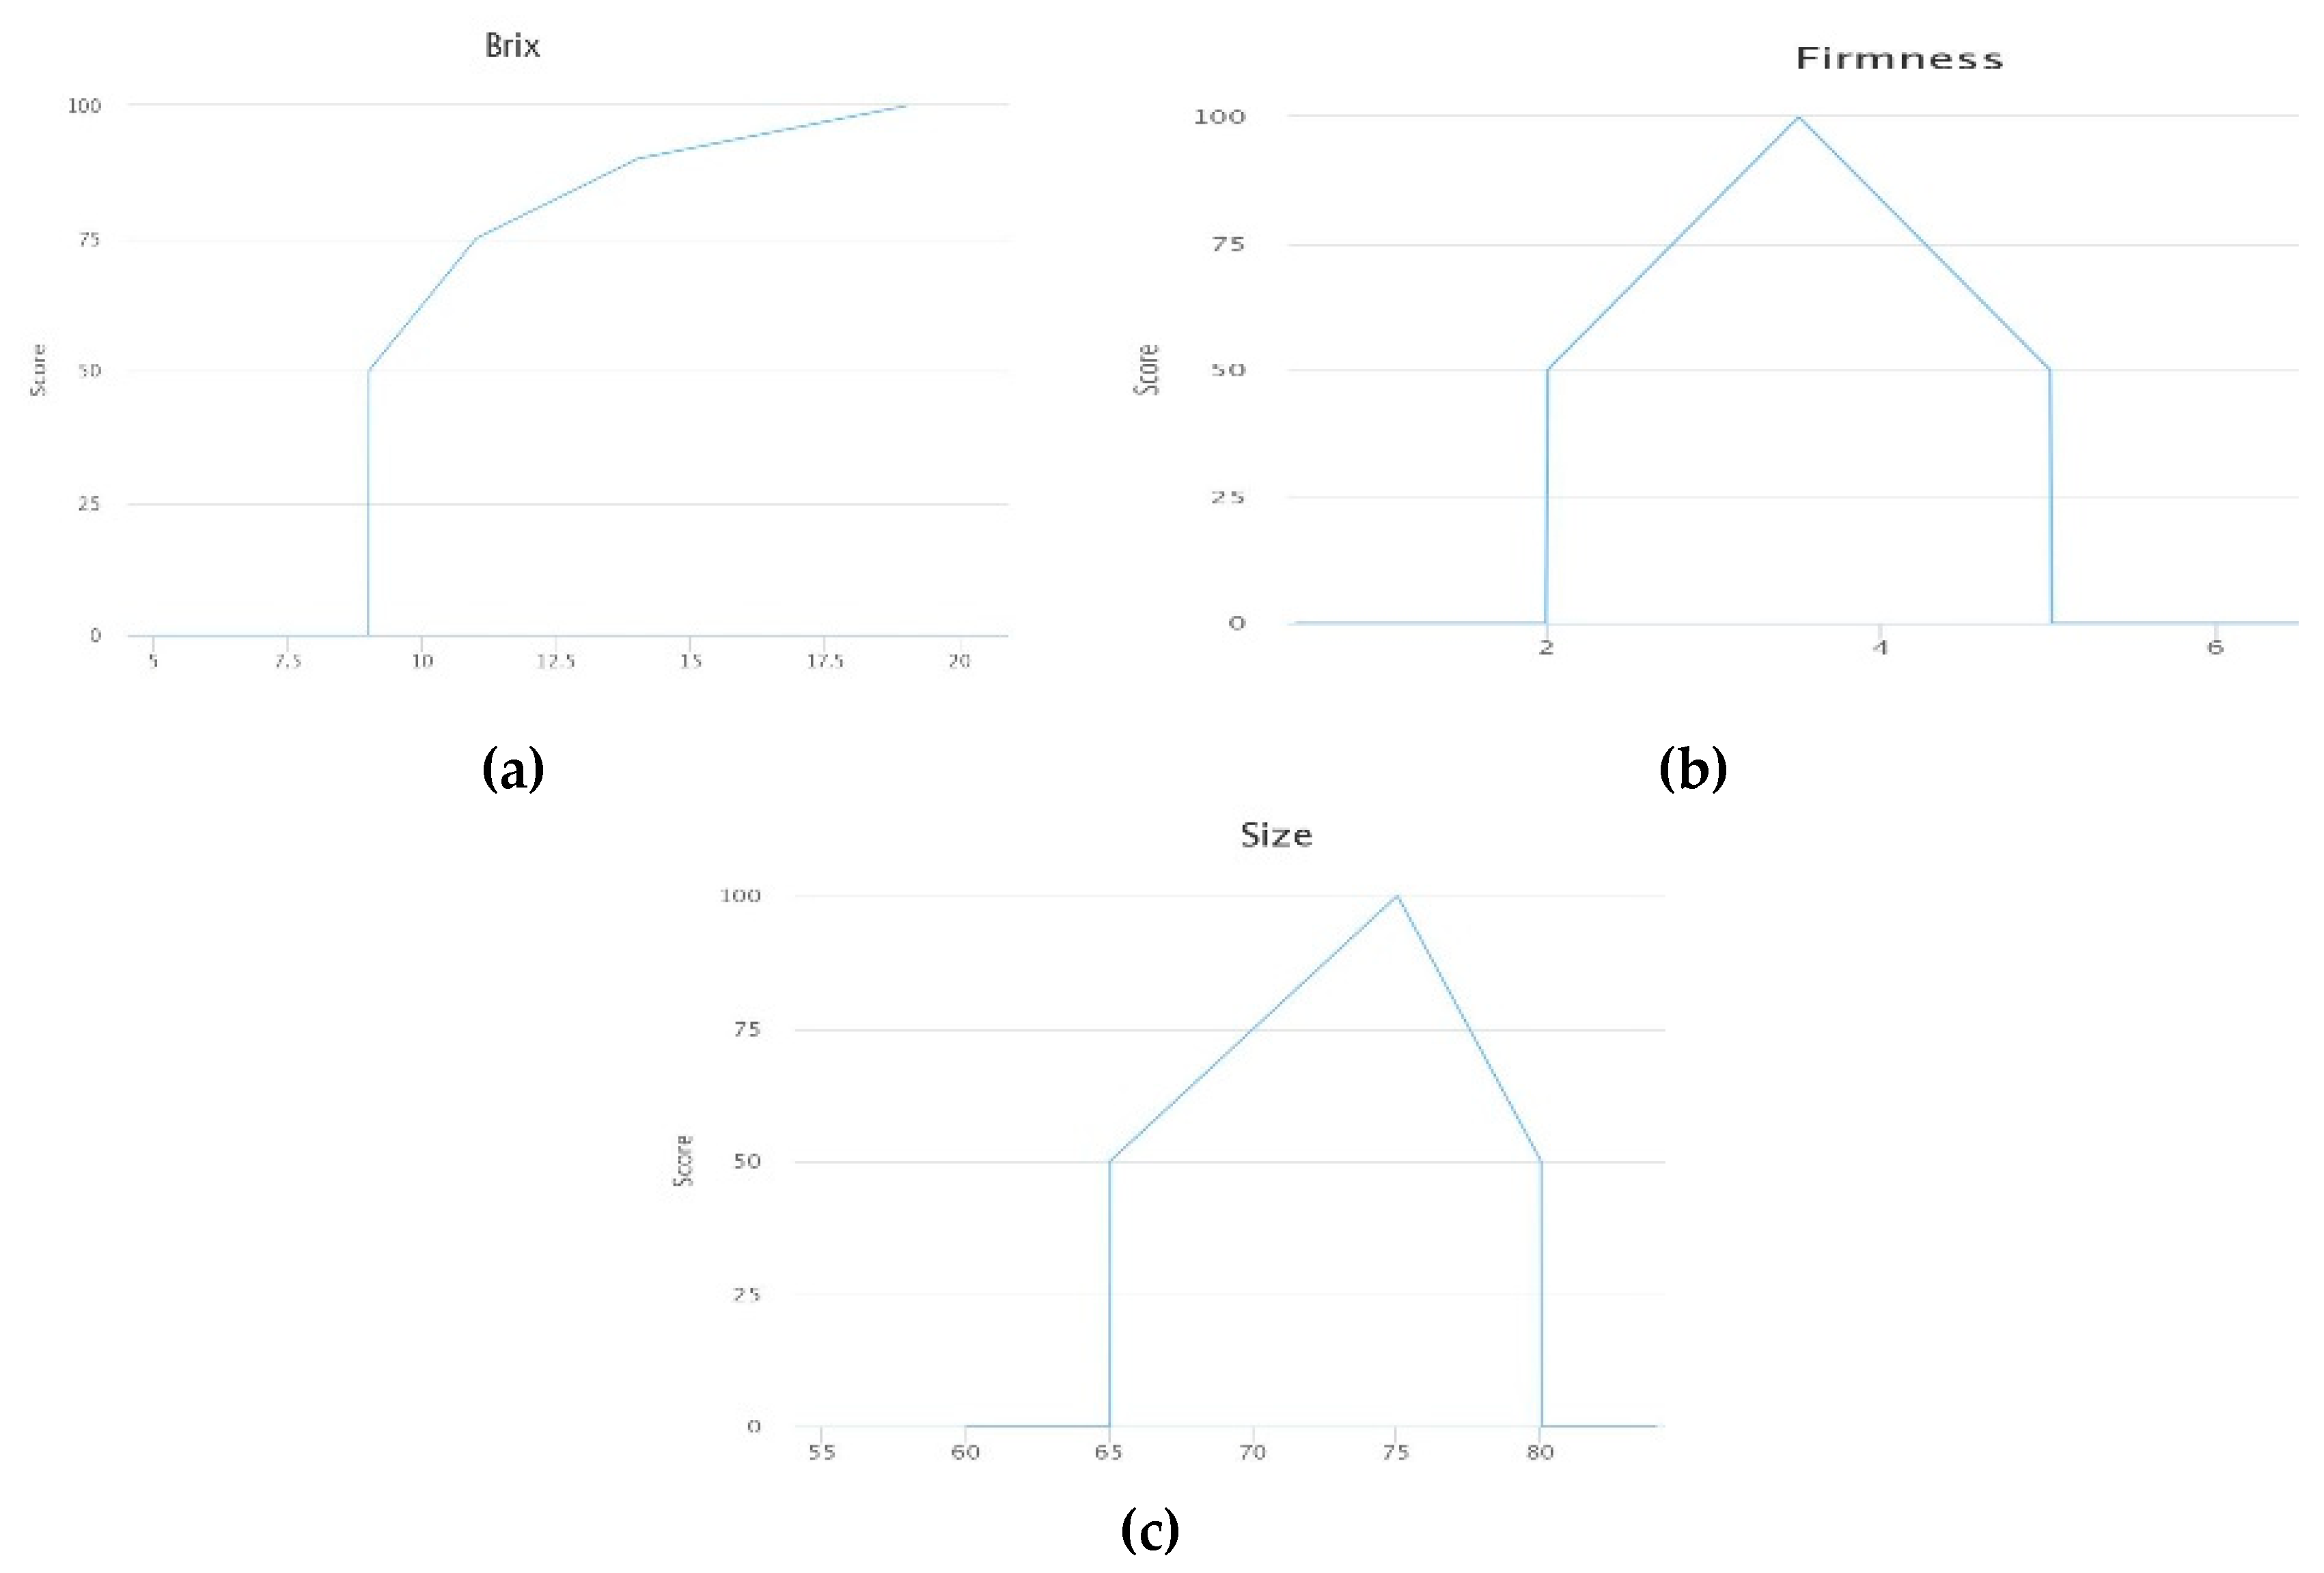
Finally, it also necessary to establish the utility function for each criterion through the information provided by experts from the supermarket chain quality department. They provided direct assessment of partial value function for each criterion in several interviews. Using a global scale from zero to 100, the experts were questioned about assessing the value from the performance of products against each criterion [
29].
Figure 4 shows the utility functions of criteria to evaluate the quality of fresh yellow peach. Brix degrees quantify sugars in the fruit and have great influence on its flavor. As shown in utility function (a), the company specifies a minimum value for this criterion, for which a greater value is ideal. When Brix degrees are very high, increases in their value provide fewer quality improvements than when the Brix degrees are lower.
Figure 4b represents the utility function of firmness and (c) the utility function of size. In both cases, specifications set minimum and maximum values. Thus, values outside of this range have a score of zero. Inside this range, there are two sections. In the first one, the function increases until the most preferred value is reached. The utility function decreases more for greater criterion values.
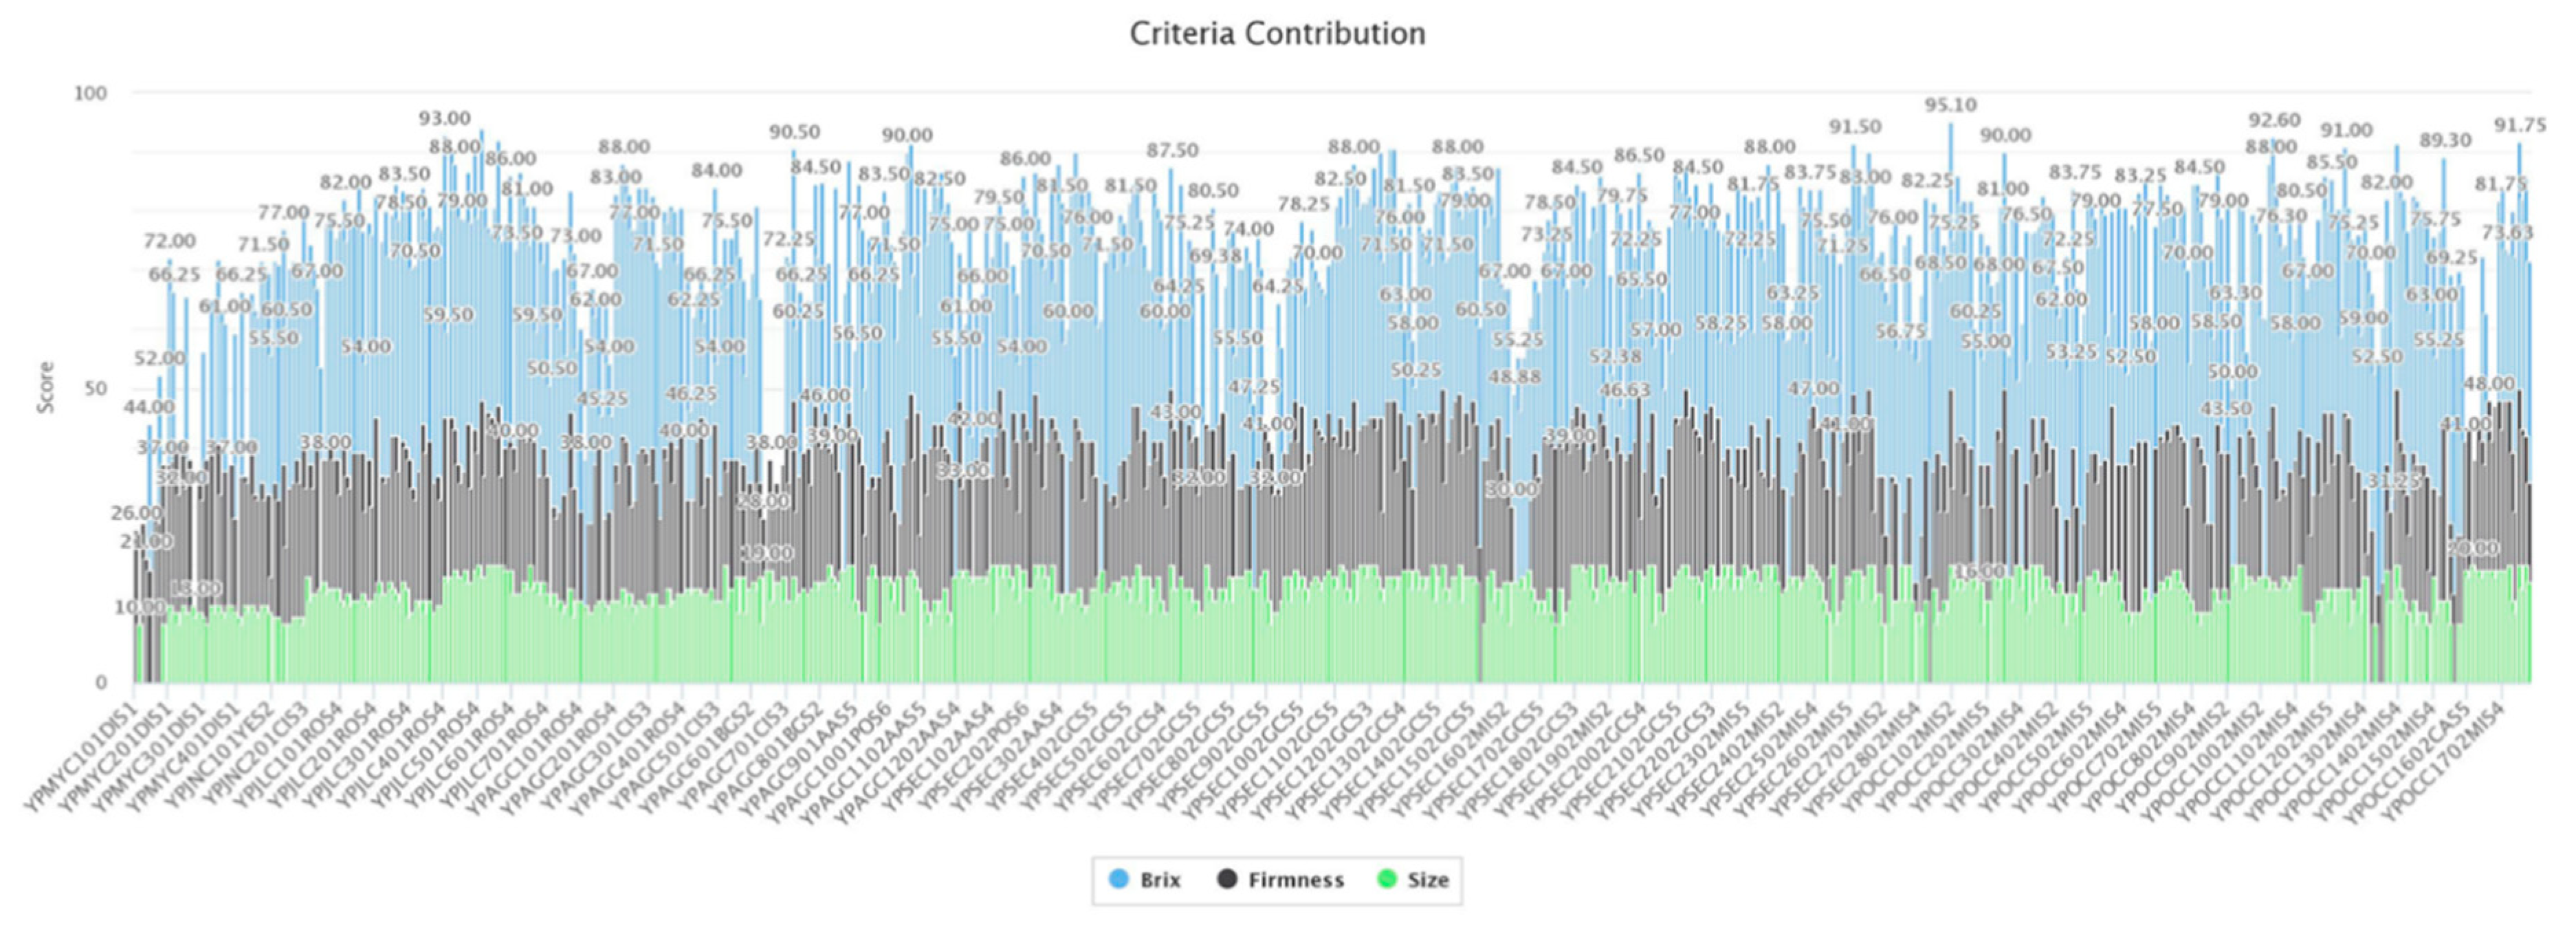
Applying MAUT with all this real information, indicators for the quality of yellow peach are obtained.
Figure 5 illustrates the results of the global score and the individual criterion contribution, represented by different colours. Brix degree is the most important criterion, as it has the highest weight (50%), followed by firmness (30%) and size (20%). The usefulness of these results is twofold. Firstly, they are useful at an operational level in the logistic platform, in order to reject those batches with the worst scores. Secondly, they are useful at a tactical/strategic level, when the company is evaluating and monitoring supplier performance.
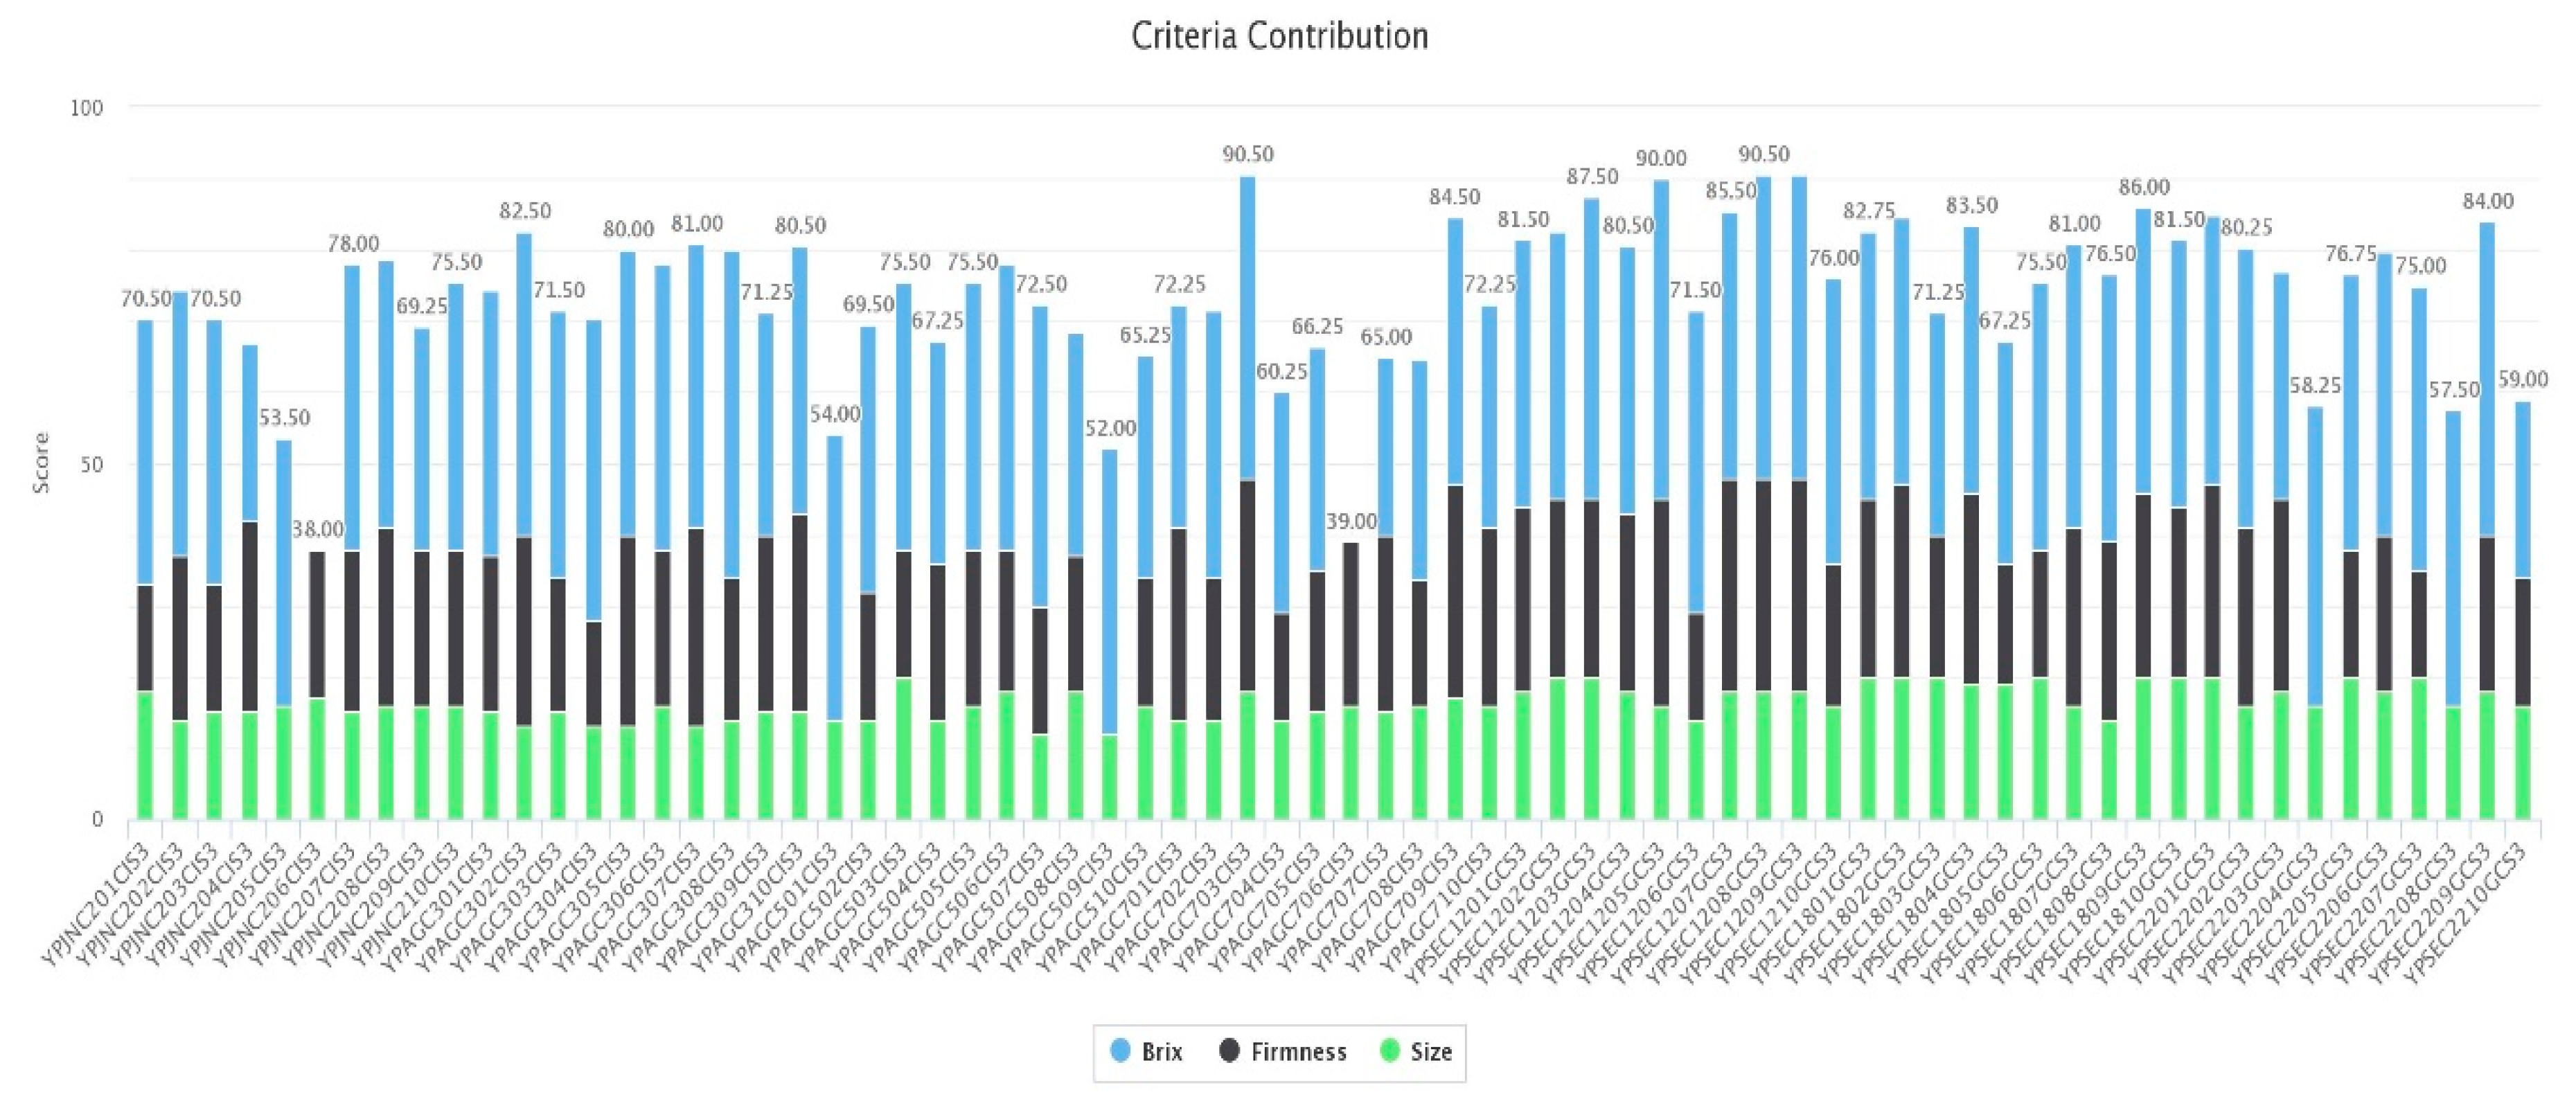
Figure 6 presents the same information as
Figure 5 for only one supplier (S3). In this case, it is easier to note that in general the worst scores are for products that do not meet the specification for at least one criterion, whose value is below minimum or above maximum. As MAUT compensates for the performance of all criteria, an acceptable score is also feasible when some criteria have a very good performance, but one criterion does not satisfy the technical specifications. In this case, the company indicator would be zero.
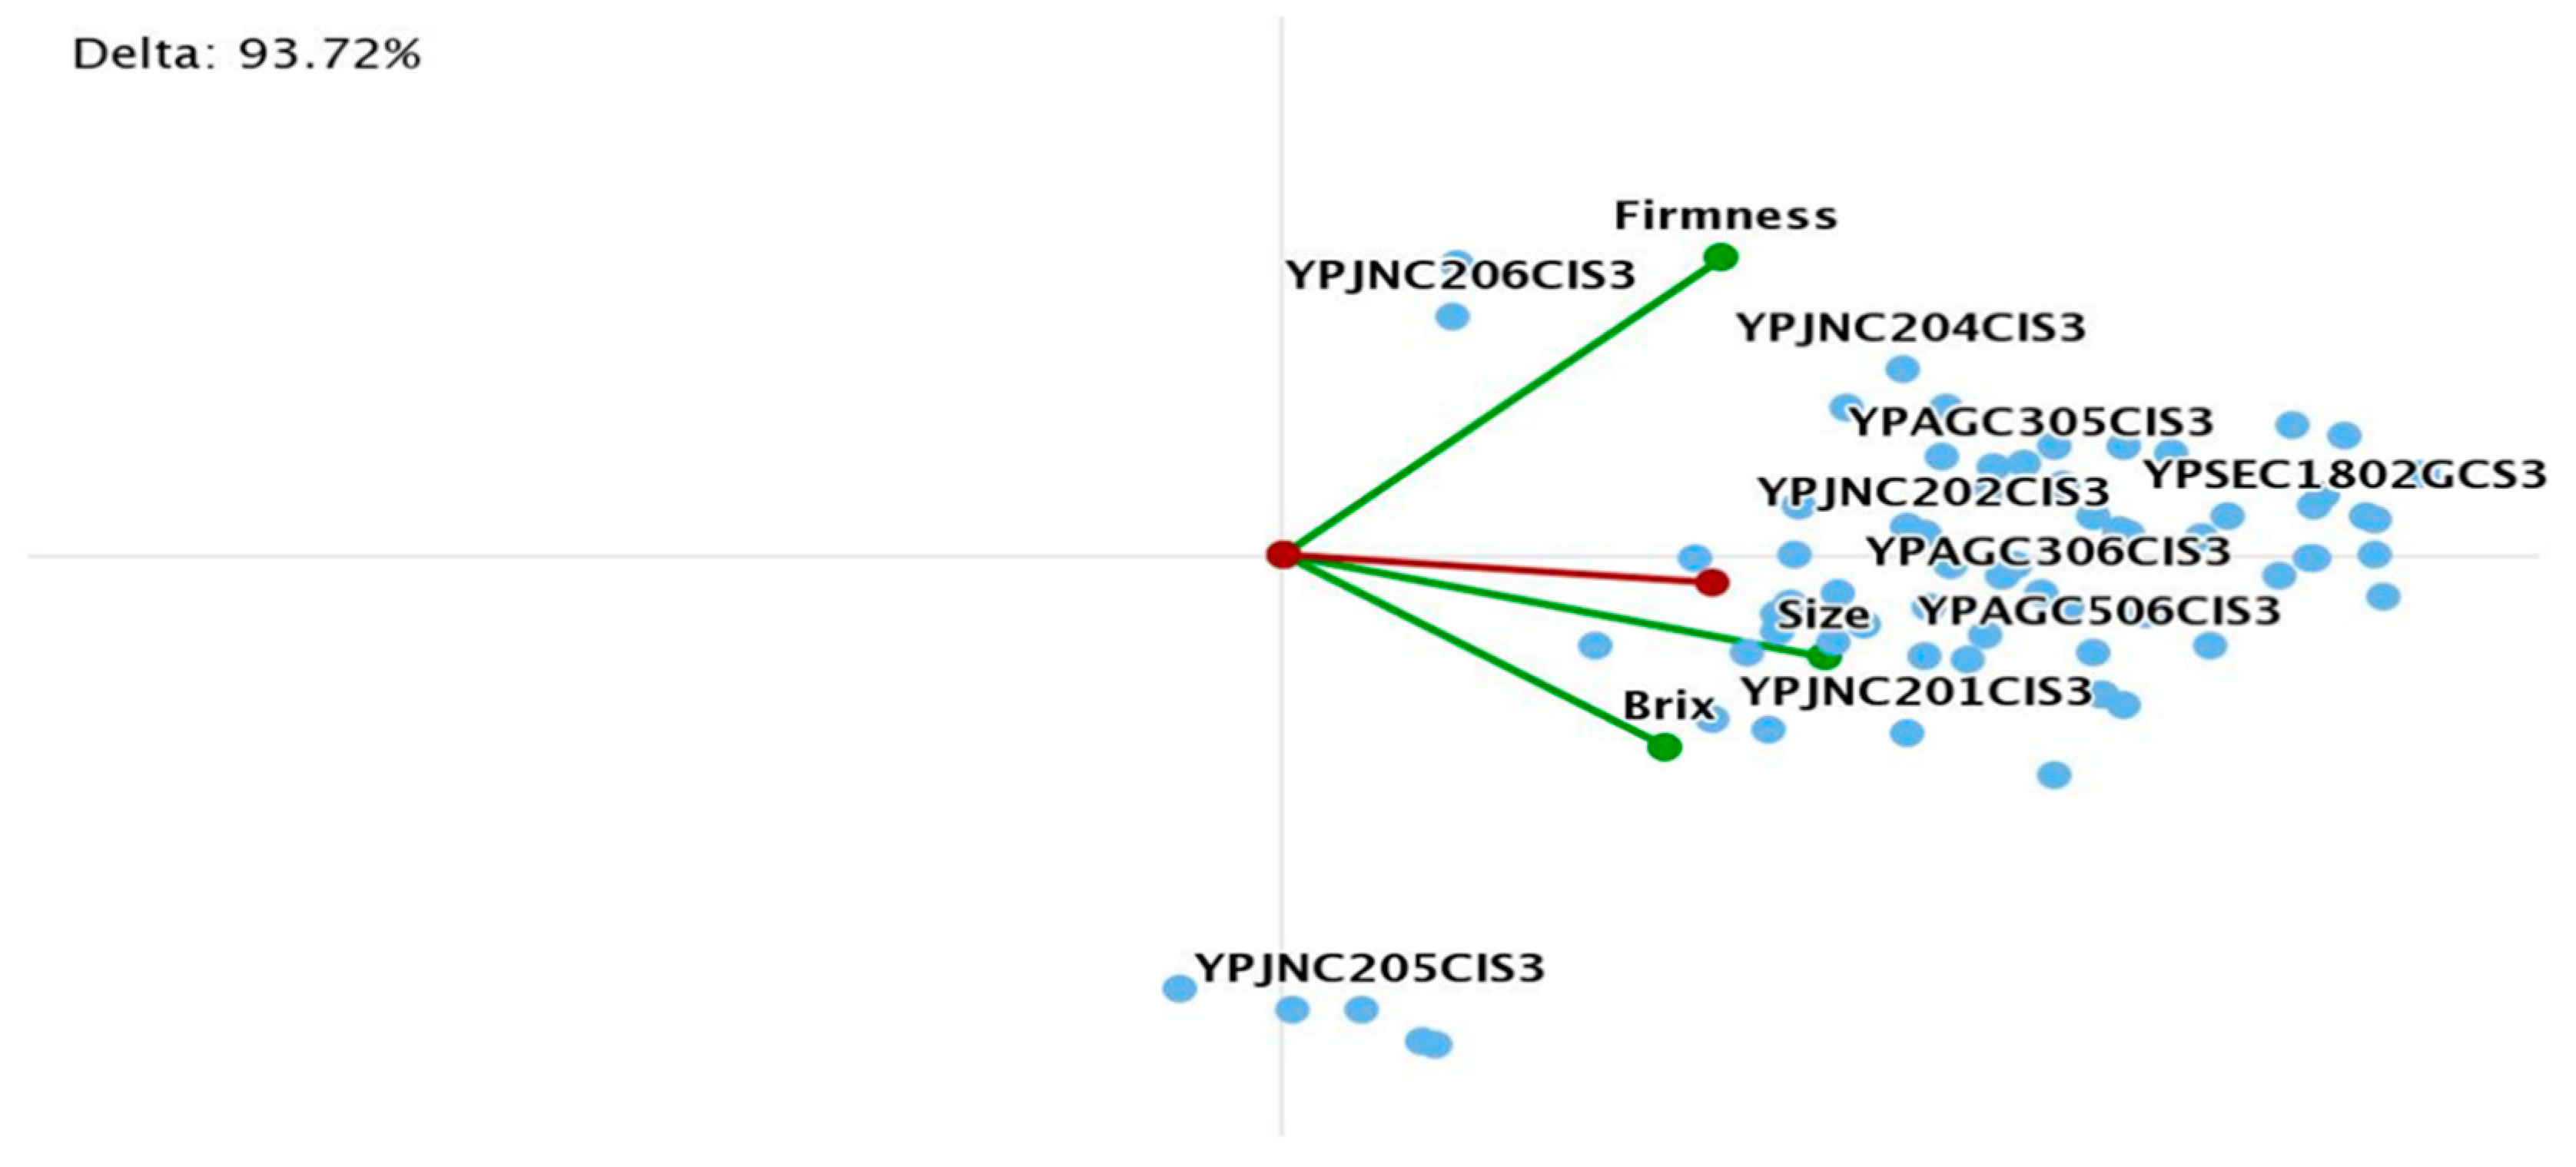
The Global Visual Analysis is a very useful tool for the analyst, as it provides a different perspective on the results (
Figure 7). The points represent products and the criteria are the green axes. Close points represent products with similar quality levels. Products with good performance with regard to a criterion are located in the direction of the axis of this criterion.
4. Results of Sustainable Supplier Evaluation: Comparing MAUT and PROMETHEE Approaches
4.1. Criteria for Sustainable Supplier Evaluation of Fresh Fruits
The performance of fresh food suppliers in supermarket chains depends on the quality of products provided by suppliers, in addition to other criteria needed to assess them from a sustainable perspective. In particular, the company assesses the fruit suppliers based on three main groups of criteria: logistic, commercial and “product quality”. Logistic criteria are stockout, rejections (in logistic platform), and service capability. Commercial criteria include product innovation, conflict resolution, collaboration, and administrative functions. The “product quality” that a company evaluates is a subjective assessment of product quality made by a manager, followed by withdrawal when food safety problems occur. These criteria have some weaknesses; for example, they do not consider objective measures of the quality of products, but only consider the judgements/opinions of managers about the general performance of suppliers with respect to this issue. The manager evaluations for all criteria are measured on a scale from zero to 10. The company wants to improve its procedure to assess the food safety of suppliers and this paper provides new criteria for this purpose. In addition, another shortcoming of the company procedure consists of not including environmental criteria, with the exception of environmental certification or HACCP implementation as a prerequisite.
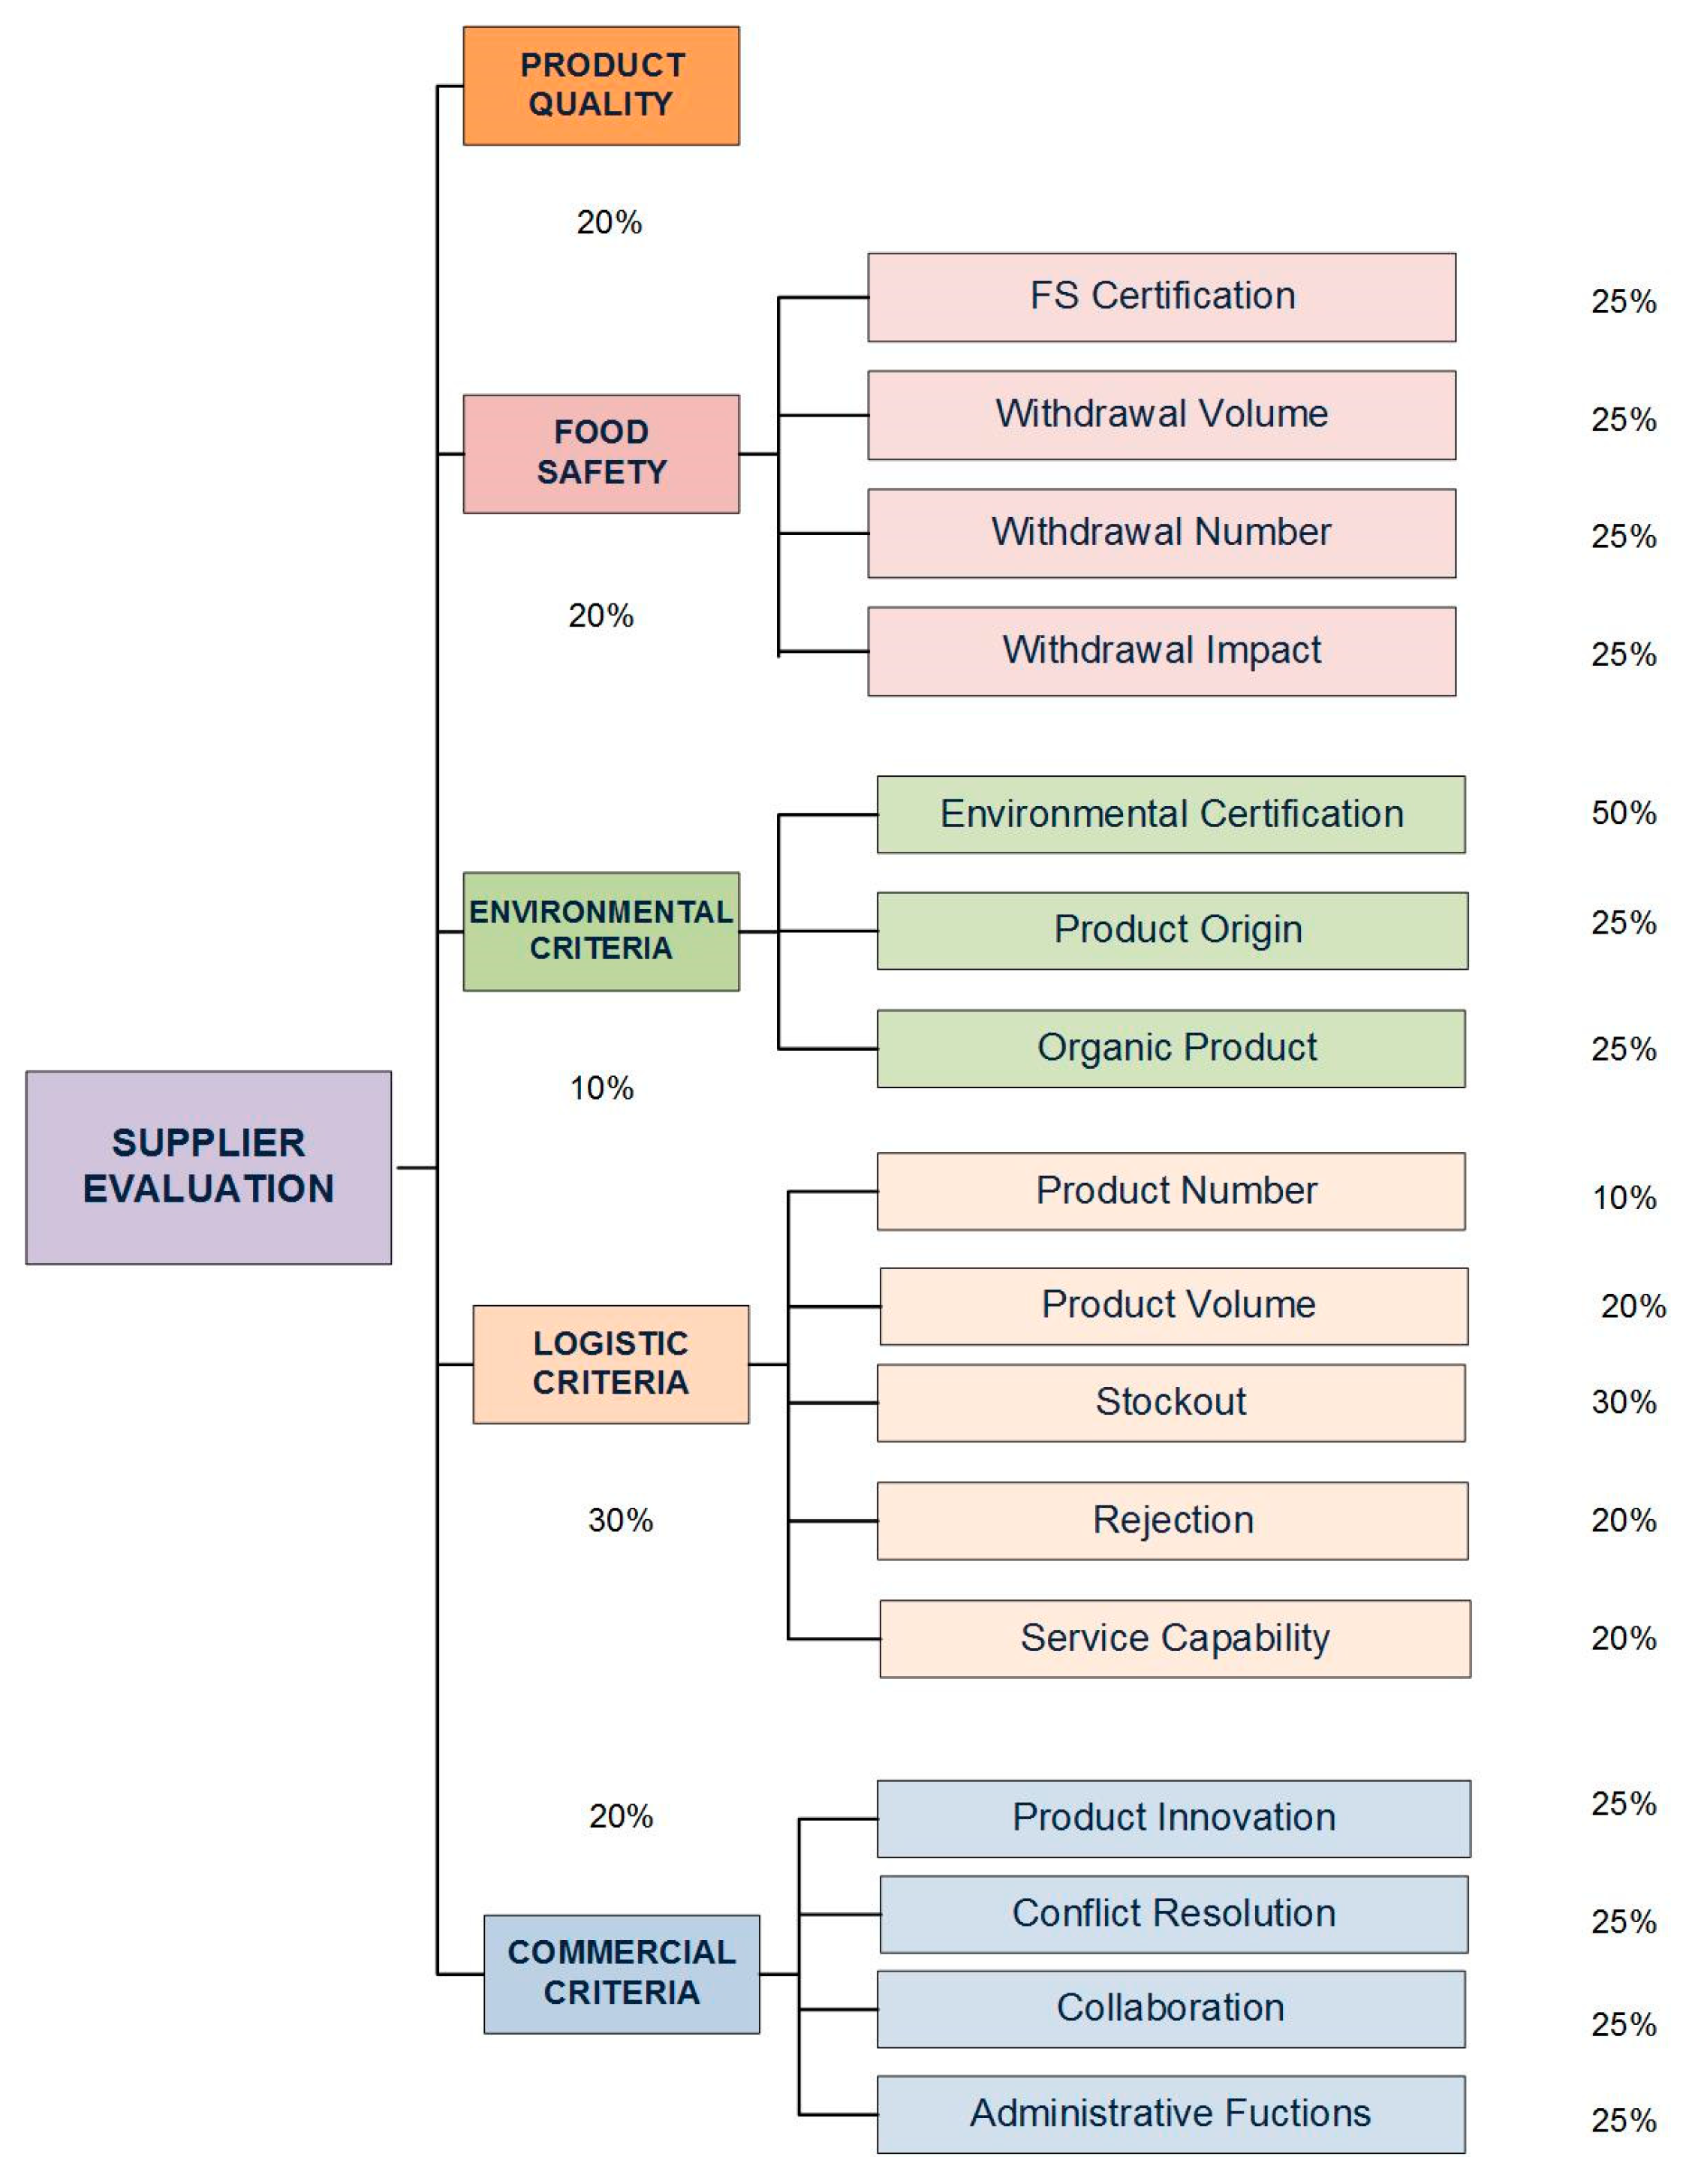
Sustainability requires taking into account economic, environmental, and social factors.
Figure 8 presents a criteria hierarchy for sustainable supplier evaluation in fresh fruits that contributes significantly to both the literature and company management. To select the criteria, the authors have taken a literature review into account [
26,
42], as well as the results of a survey with managers of supermarket chains and interviews with experts. The survey included questions about the current system for evaluating fresh products and their suppliers and distinguished between criteria already applied and those that would be of interest to apply in the future. The criteria selection also considered the availability of reliable data in practice. The aggregated indicator of the quality of products provided by a supplier is the average of all product indicators from this supplier plus the standard deviation.
Food safety is the most relevant criterion in food supply chain management. In general, food distribution companies qualify suppliers if they have food safety certifications. Nevertheless, from time to time crises arise due to food safety issues, which are difficult to manage by the companies affected and have great impacts from social and economic standpoints. Thus, the indicator of food safety from suppliers is measured through four sub criteria: food safety certification, withdrawal volume due to food safety issues, number of withdrawals, and withdrawals impact. If a supplier has at least one food safety certification, it receives the best value (100) in the evaluation table. When the supplier has HACCP implemented, the value is 50 and zero when it has neither of these options. HACCP implementation is necessary when the provider does not have any food safety certification. Withdrawal volume is expressed in percentage with respect to total quantity provided by the supplier. Finally, the following scale is used to assess the impact: none (100), low (75), medium (30), and high (0).
The model proposes as environmental criteria: environmental certification, product origin, and organic product. These criteria are qualitative, and are translated into numerical values for the multicriteria evaluation table as follows. If the supplier has environmental certification, the value assigned is 100 and is zero otherwise. The origin criterion distinguishes among local, national, or international sources (100, 75, 50). Organic products have better value than non-organic products, scoring 100 and 75, respectively.
The logistic criteria are the product number, product volume, stockout, rejection, and service capability. The number of varieties of yellow peach provided by a supplier is the number of products in this case study. All these data are quantitative and from databases of the company related to supplier performance in the logistic platform. Stockout and rejection criteria are measured in percentages over the quantity of product. The company monitors the degree of compliance with the day and time in order to measure the service capability of suppliers, which is the average of both percentages.
Finally, the commercial criteria group includes product innovation, conflict resolution, collaboration and administrative functions of suppliers. Managers of the company rate the supplier performance for these criteria using a scale from zero to ten.
Following the flowchart in
Figure 1, the second step is to carry out the supplier evaluation taking into account the scores (indicators) of all products provided by each supplier, as well as other relevant supplier criteria for the company.
Figure 8 shows all criteria included in sustainable evaluation, as well as their weights, for applying MAUT and PROMETHEE.
4.2. Supplier Performance and Contribution of Criteria
A company provided the data to complete the evaluation table with the performance of three suppliers, S1, S3, and S5, for all criteria, as well as information to build the utility functions to apply MAUT and the preference functions in PROMETHEE. This company assesses all the supplier performance criteria on a scale from zero to ten. In particular, the evaluation of the subjective quality from company is zero for S1, nine for S3, and eight for S5. The system proposed based on a MAUT methodology gives the following scores for the objective product quality with a scale from zero to 100: 64.16 for S1, 84.71 for S3, and 85.86 for S5.
This section presents the main results on supplier performance and the contribution of criteria to the global score of suppliers obtained by MAUT and PROMETHEE. It is necessary to highlight that the multicriteria approach to evaluate suppliers included the same four commercial criteria as the company used, with the same performance data. Nevertheless, the proposal presented considers ten new criteria: product quality, four criteria related to food safety, three environmental criteria, and two more logistic criteria in addition to stockout, rejection, and service capability. These new criteria allow the assessment of suppliers from a sustainability perspective.
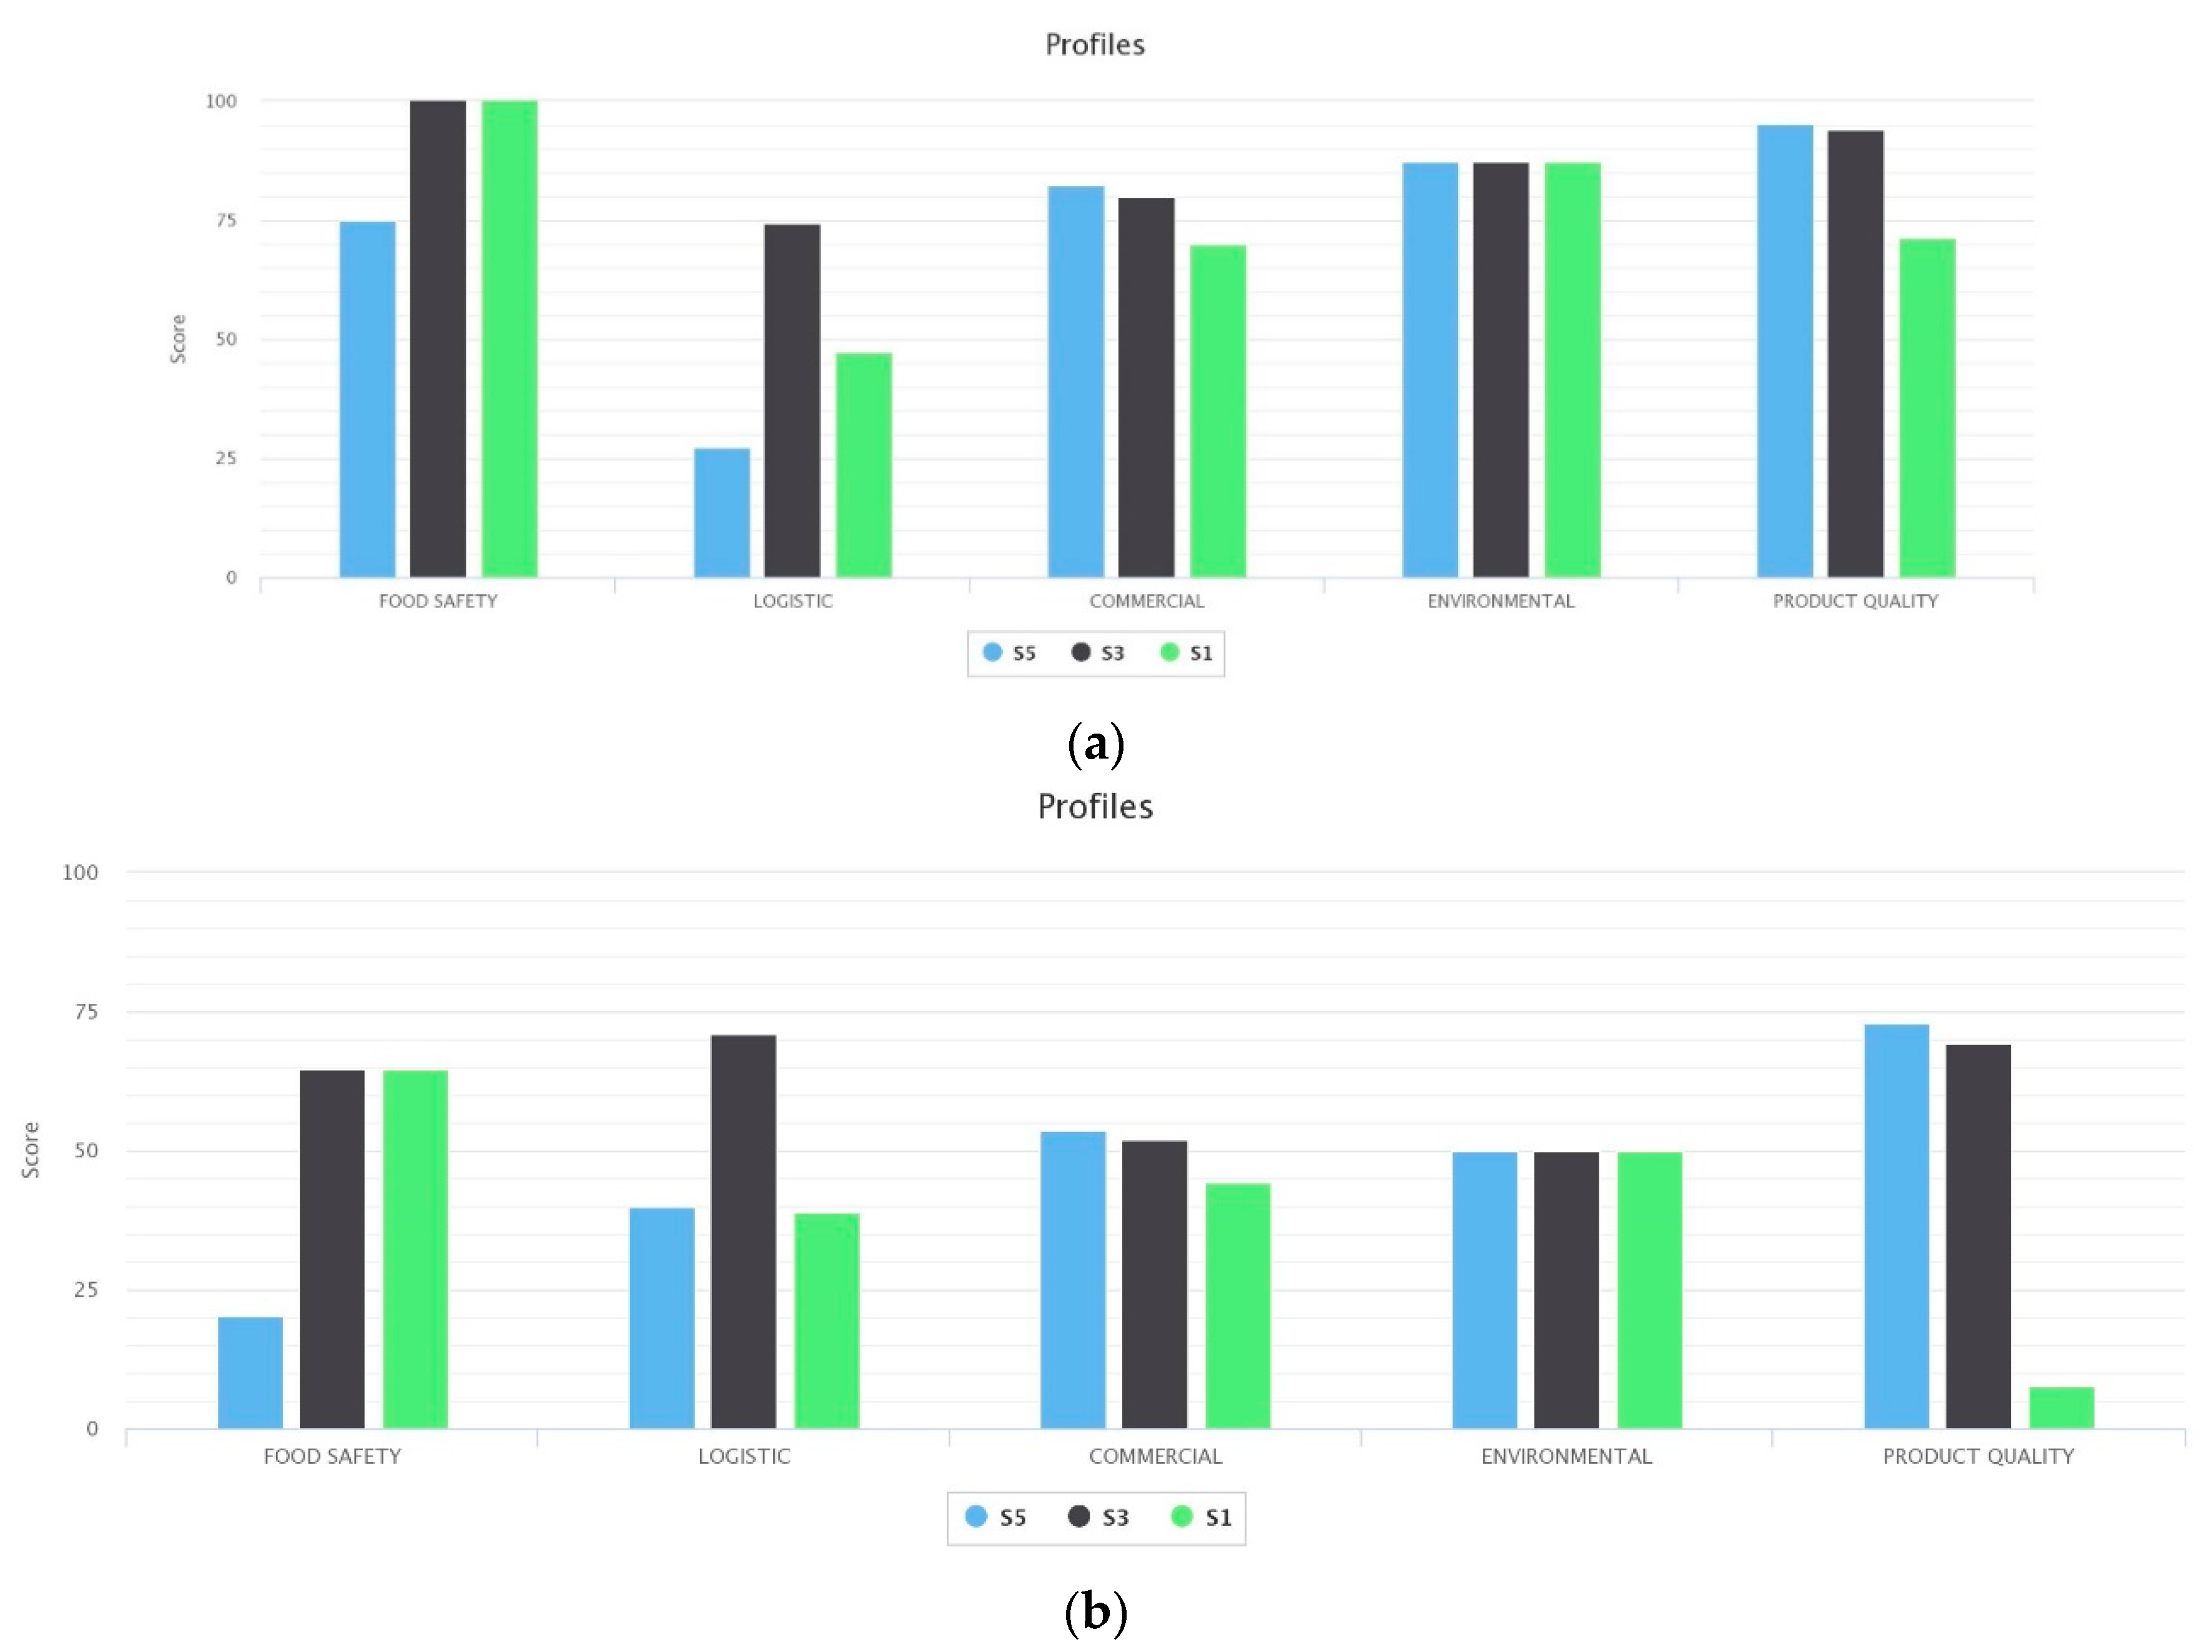
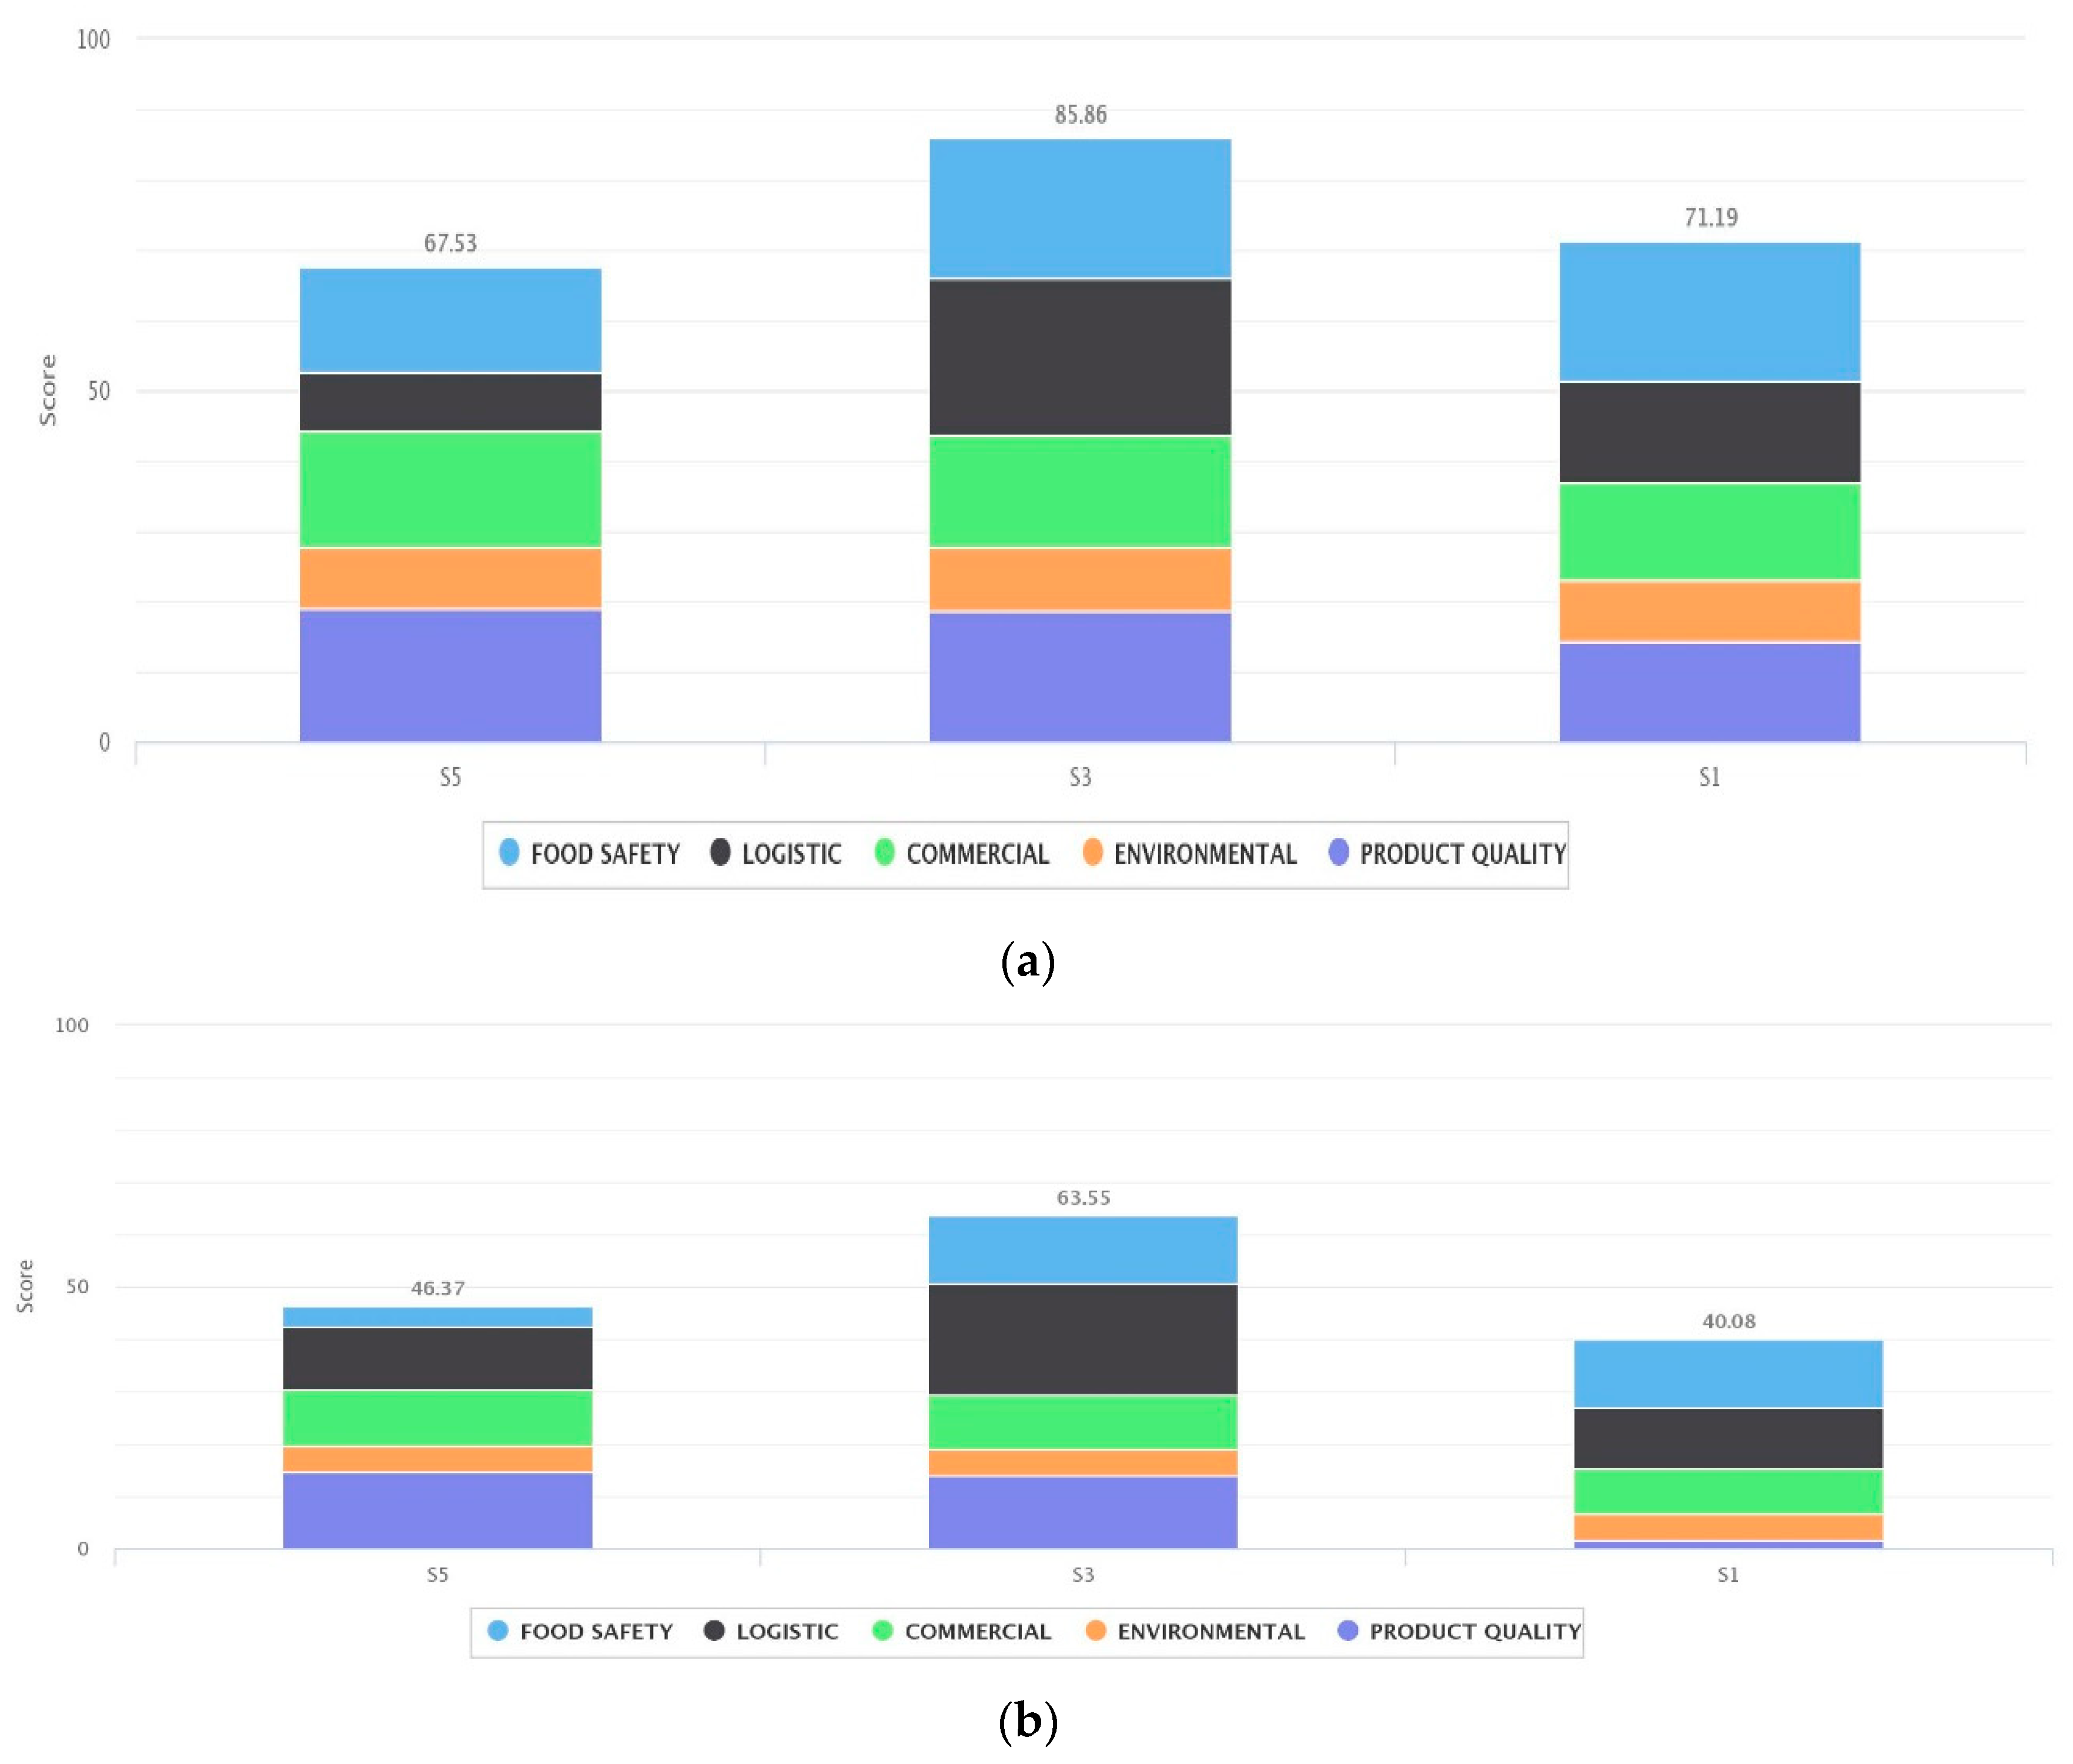
Figure 9 shows the global indicators derived from multicriteria approach obtained by D-Sight software. The score value represents the supplier performance measured in a scale from zero to 100. MAUT has greater values than those obtained from PROMETHEE. The best supplier is the same in both multicriteria methods, S3 with a score of 85.86 from MAUT and 63.65 in PROMETHEE. Nevertheless, the ranking is different, as S1 is the second and S5 is the third in MAUT, while the order is S5 and S1 in PROMETHEE. The company attributes the following scores to these suppliers in a scale from zero to ten with the criteria indicated previously: 8.58 for S3, 5.70 for S1, and 5.30 for S5. Thus, supplier S3 is the best supplier according to company procedure and both multicriteria approaches, mainly because of the good logistic performance and the weight of this criterion (40% in a company system and 30% in a multicriteria approach). Although the company assigns a very good score to the subjective product quality of S5 and the worst to S1, the global score of S1 is better than S5.
Figure 9 also shows the relative contribution of each group of criteria to the global score of suppliers that present important differences. This is mainly noticeable in food safety and product quality. The compensatory nature of MAUT, in which bad performance in one criterion can be compensated for by good scores in other criteria, explains these results. In contrast, PROMETHEE, a non-compensatory method, is based on pairwise comparisons of suppliers.
Figure 9 also highlights the greater discriminant power of the PROMETHEE method, especially for food safety and product quality.
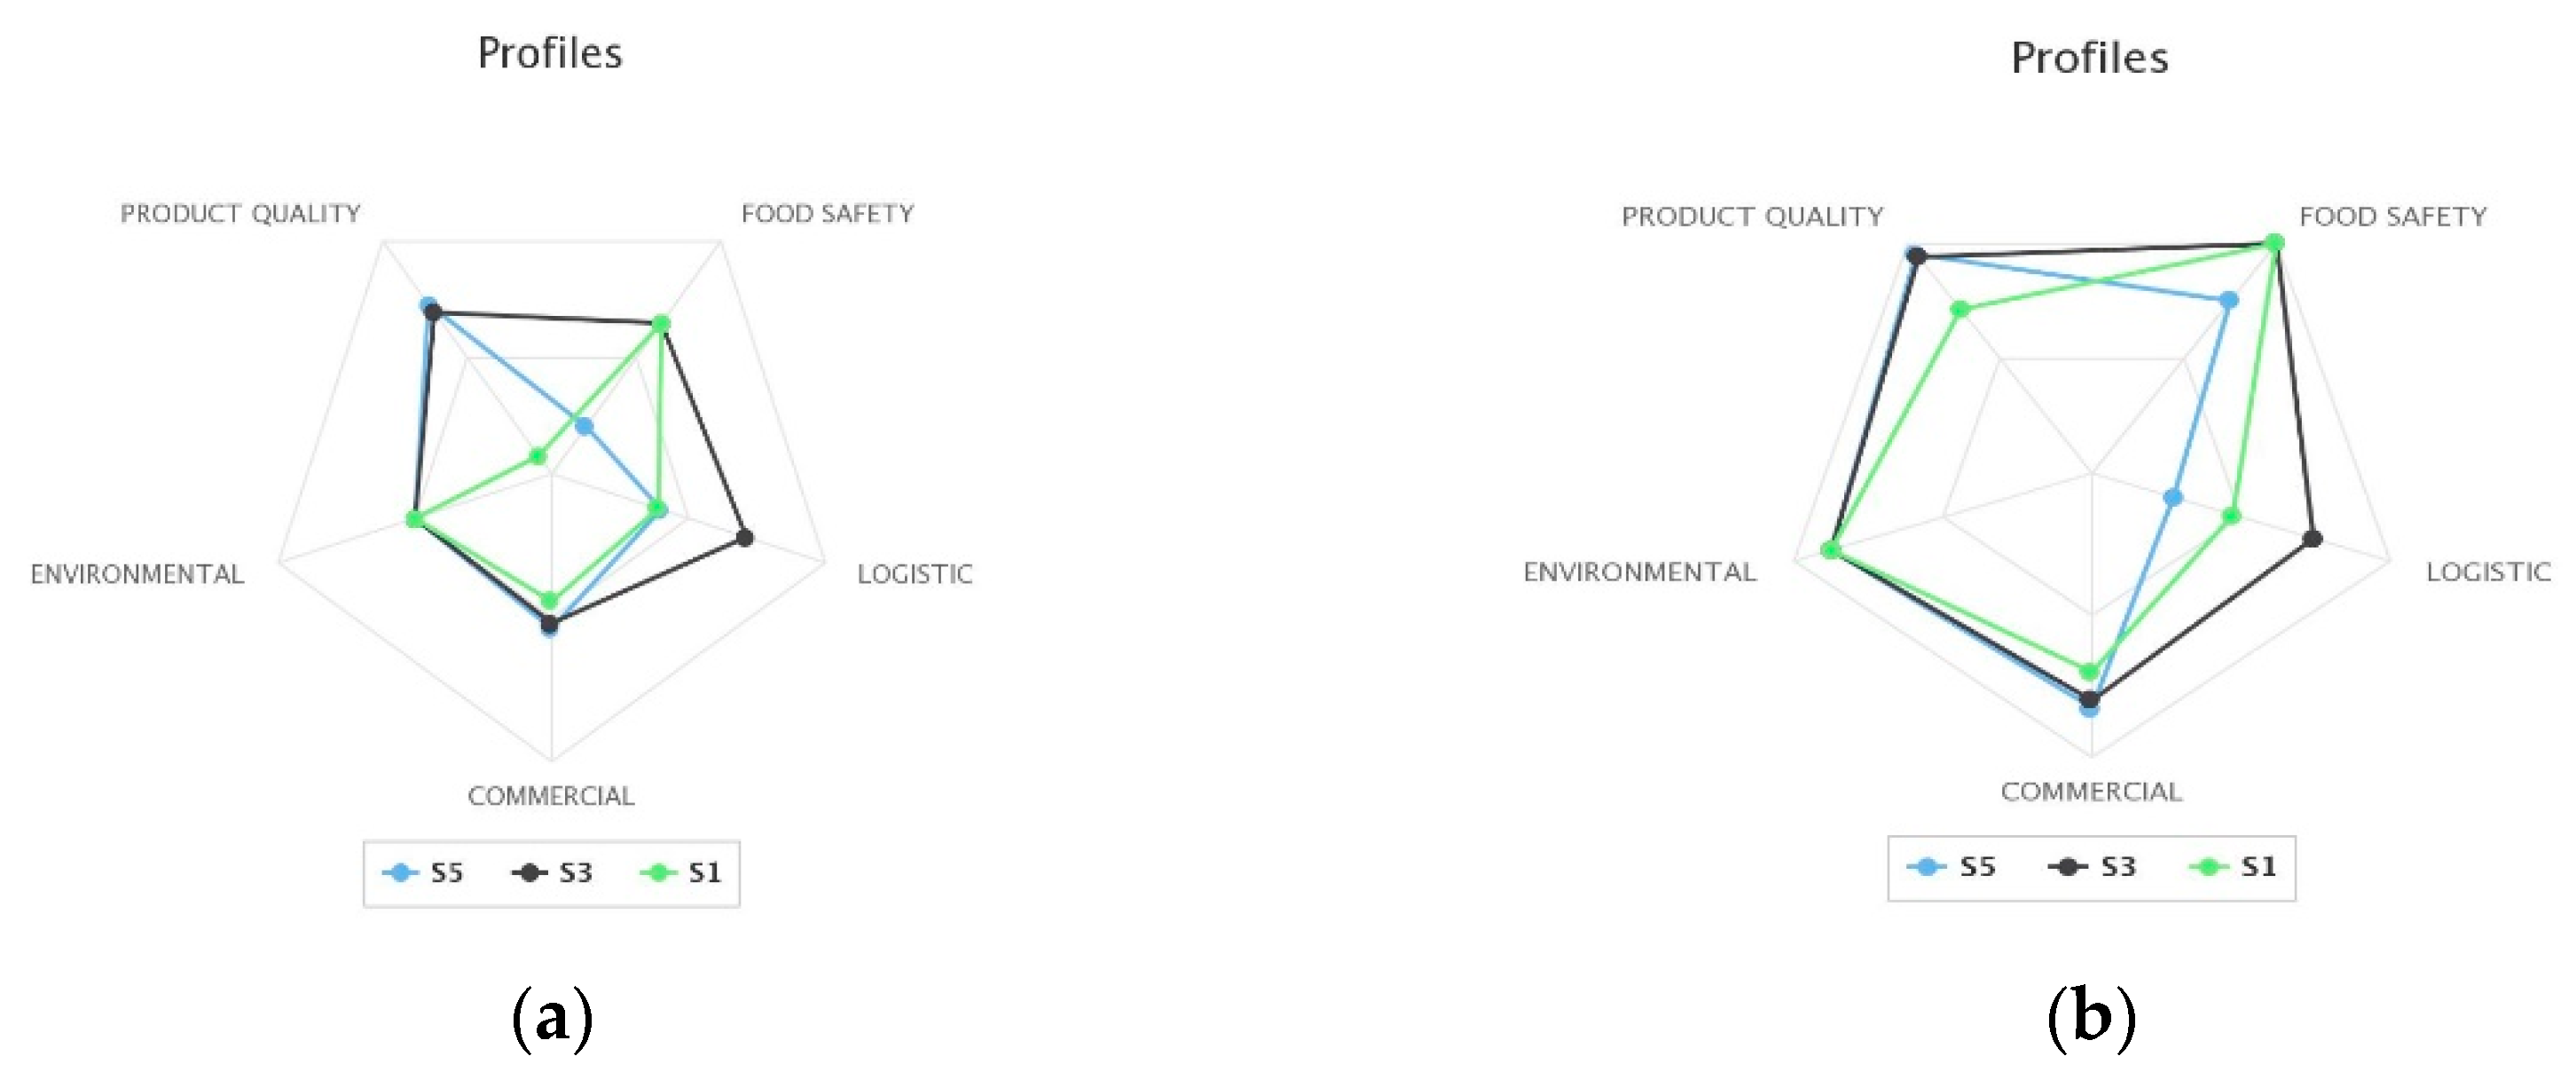
Figure 10 shows the profiles of suppliers using a different graph, which illustrate how S3 dominates other suppliers in almost all criteria.
Figure 9,
Figure 10 and
Figure 11 offer results from multicriteria analysis, which are easy to understand for managers and facilitate decision making.
4.3. Capabilities for Supplier Segmentation of MAUT and PROMETHEE
D-Sight software [
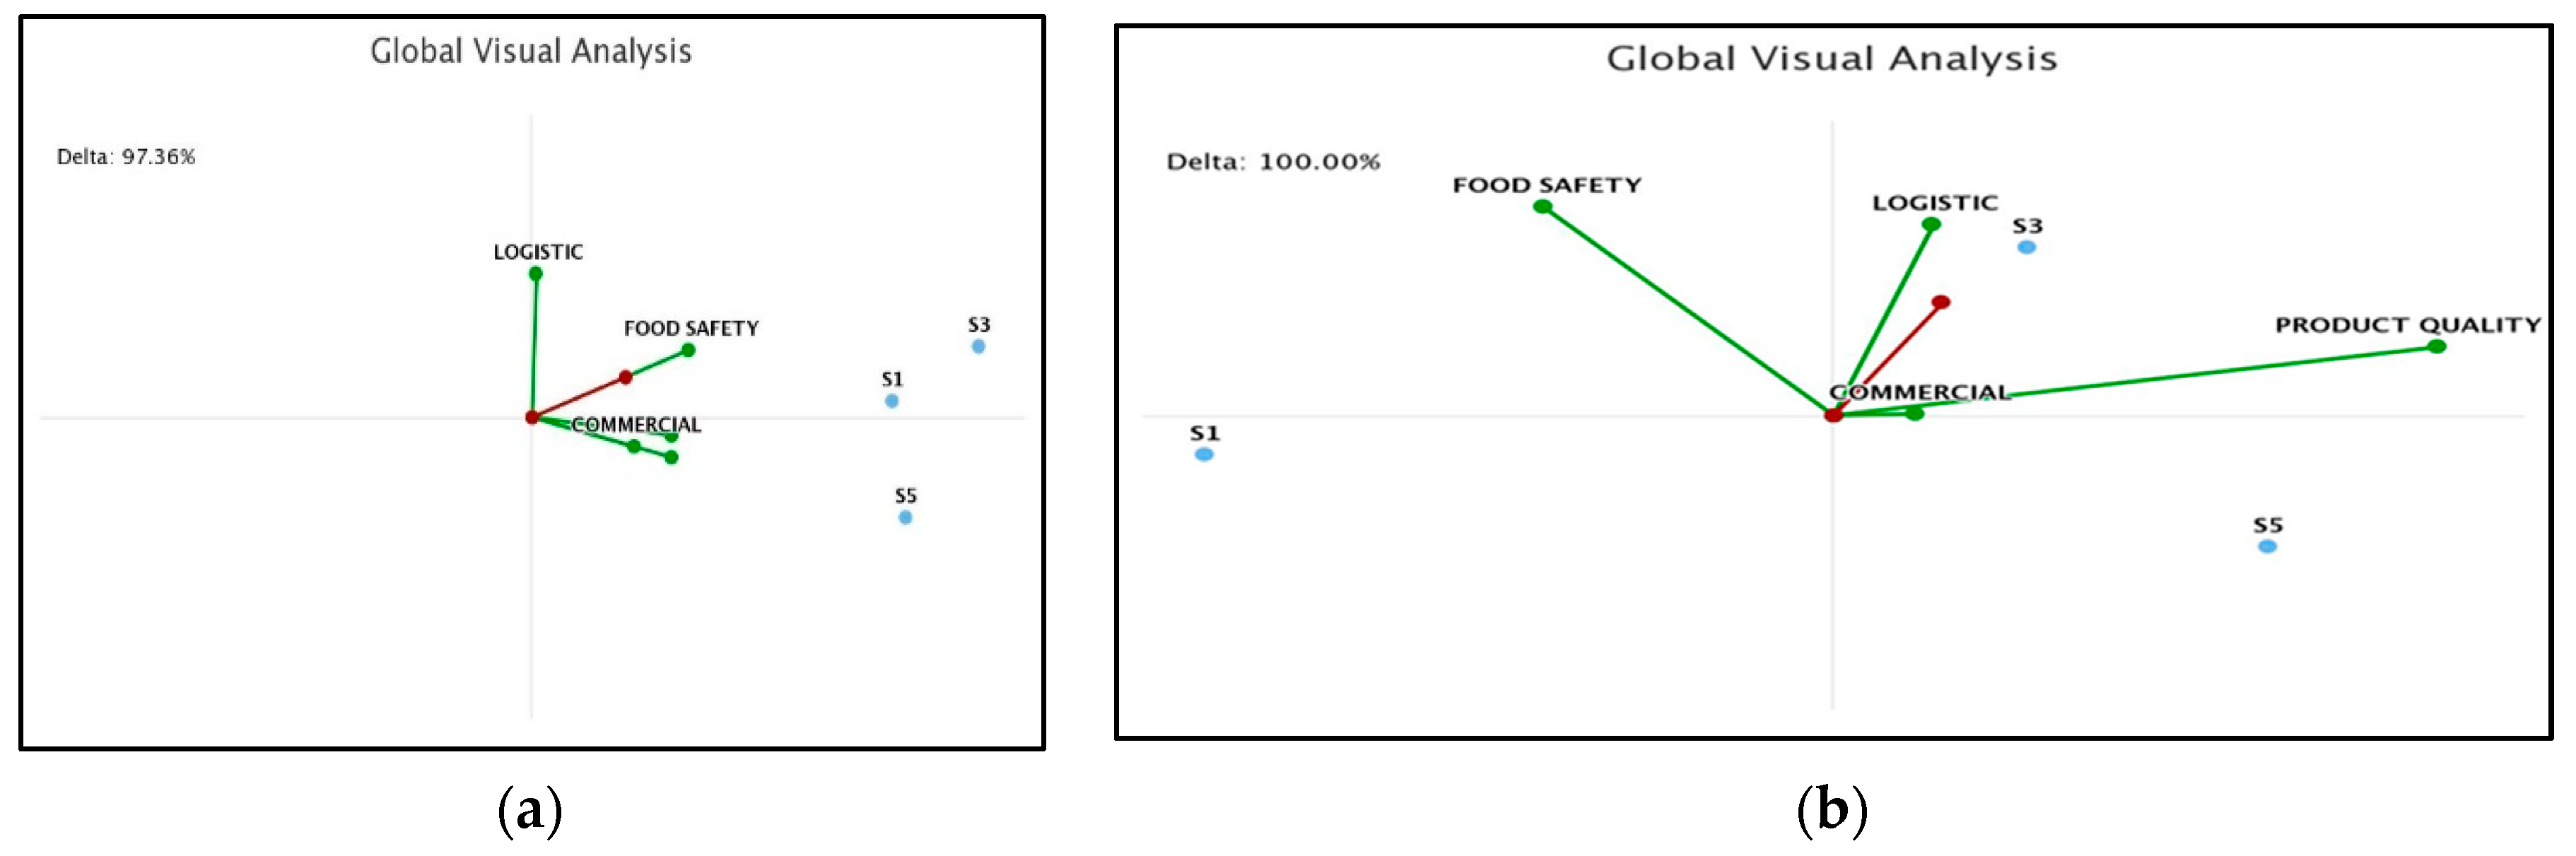
43], used to apply MAUT and PROMETHEE in this research, provides an interesting representation of results, named Global Visual Analysis, which corresponds to the GAIA plane developed for the PROMETHEE method by Brans and Mareschal [
31]. In
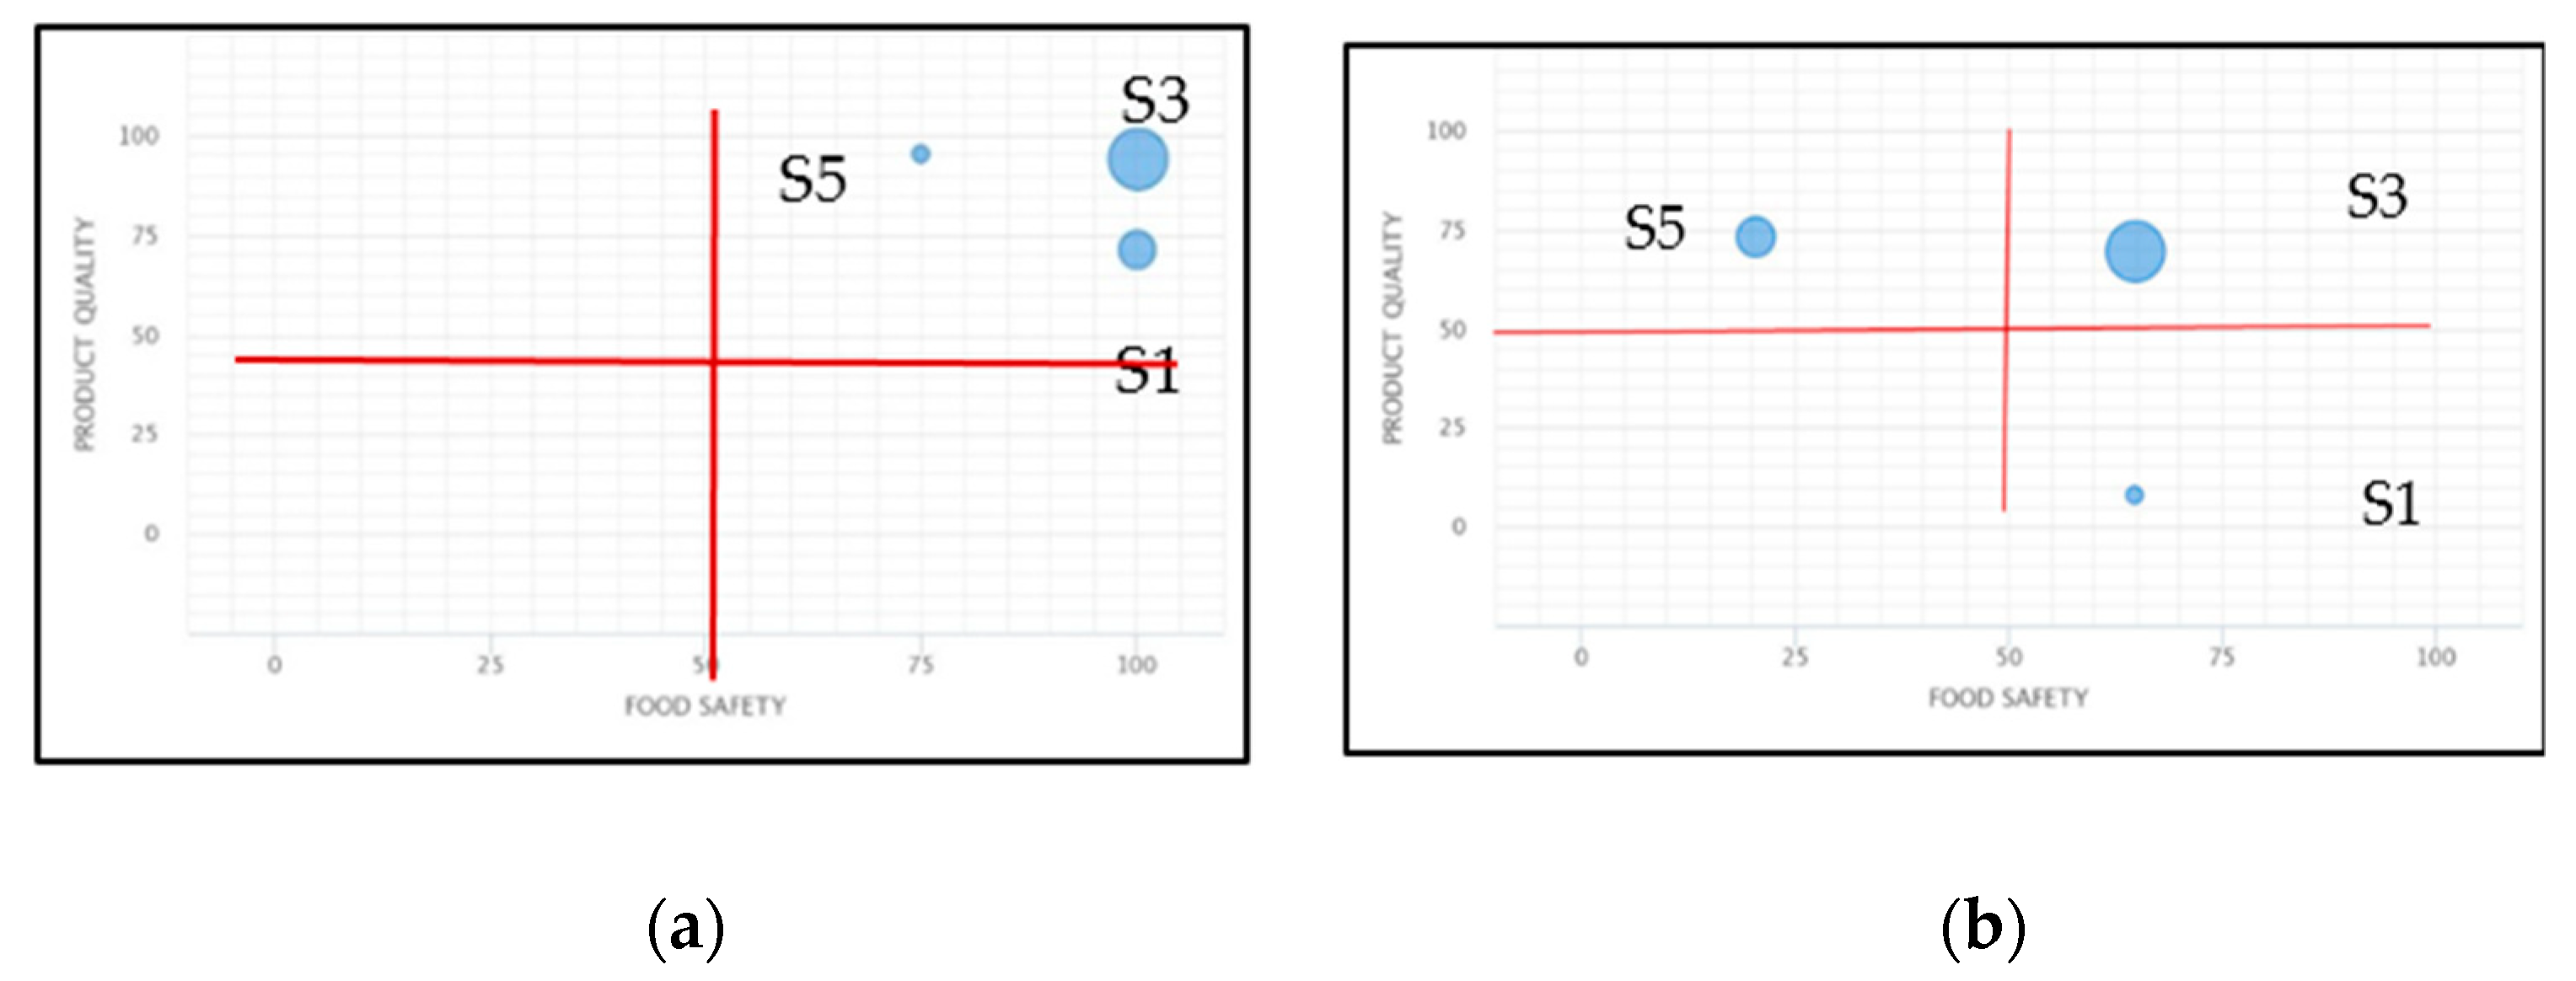
Figure 12b green axes represent the main groups of criteria and the red stick indicates the best alternative. The longer the axis, the more discriminant the criterion. S3 is the best supplier and it is especially good for logistics, as its point is located in the direction of the logistic axis. In addition, this representation highlights that S1 has a bad performance in product quality, as it appears in the opposite direction to the criterion axis. For the same reason, S5 shows weaknesses in food safety. This information is shown clearly in the graph from PROMETHEE results, but this is not clear in the graph from MAUT (
Figure 12a).
Global Visual Analysis of suppliers is very useful for analysts, but is more difficult to understand for managers. In practice, bubble graphs such as those in
Figure 13 are more useful for individual and collaborative decision making in companies interested in developing the best relationship with suppliers, as recommended by the latest trends in supply chain management.
Figure 13 represents the suppliers according to food safety and product quality scores. The global score of suppliers is taken into account in the size of the bubble. Comparing results from MAUT and PROMETHEE, the ranking is different, as explained in
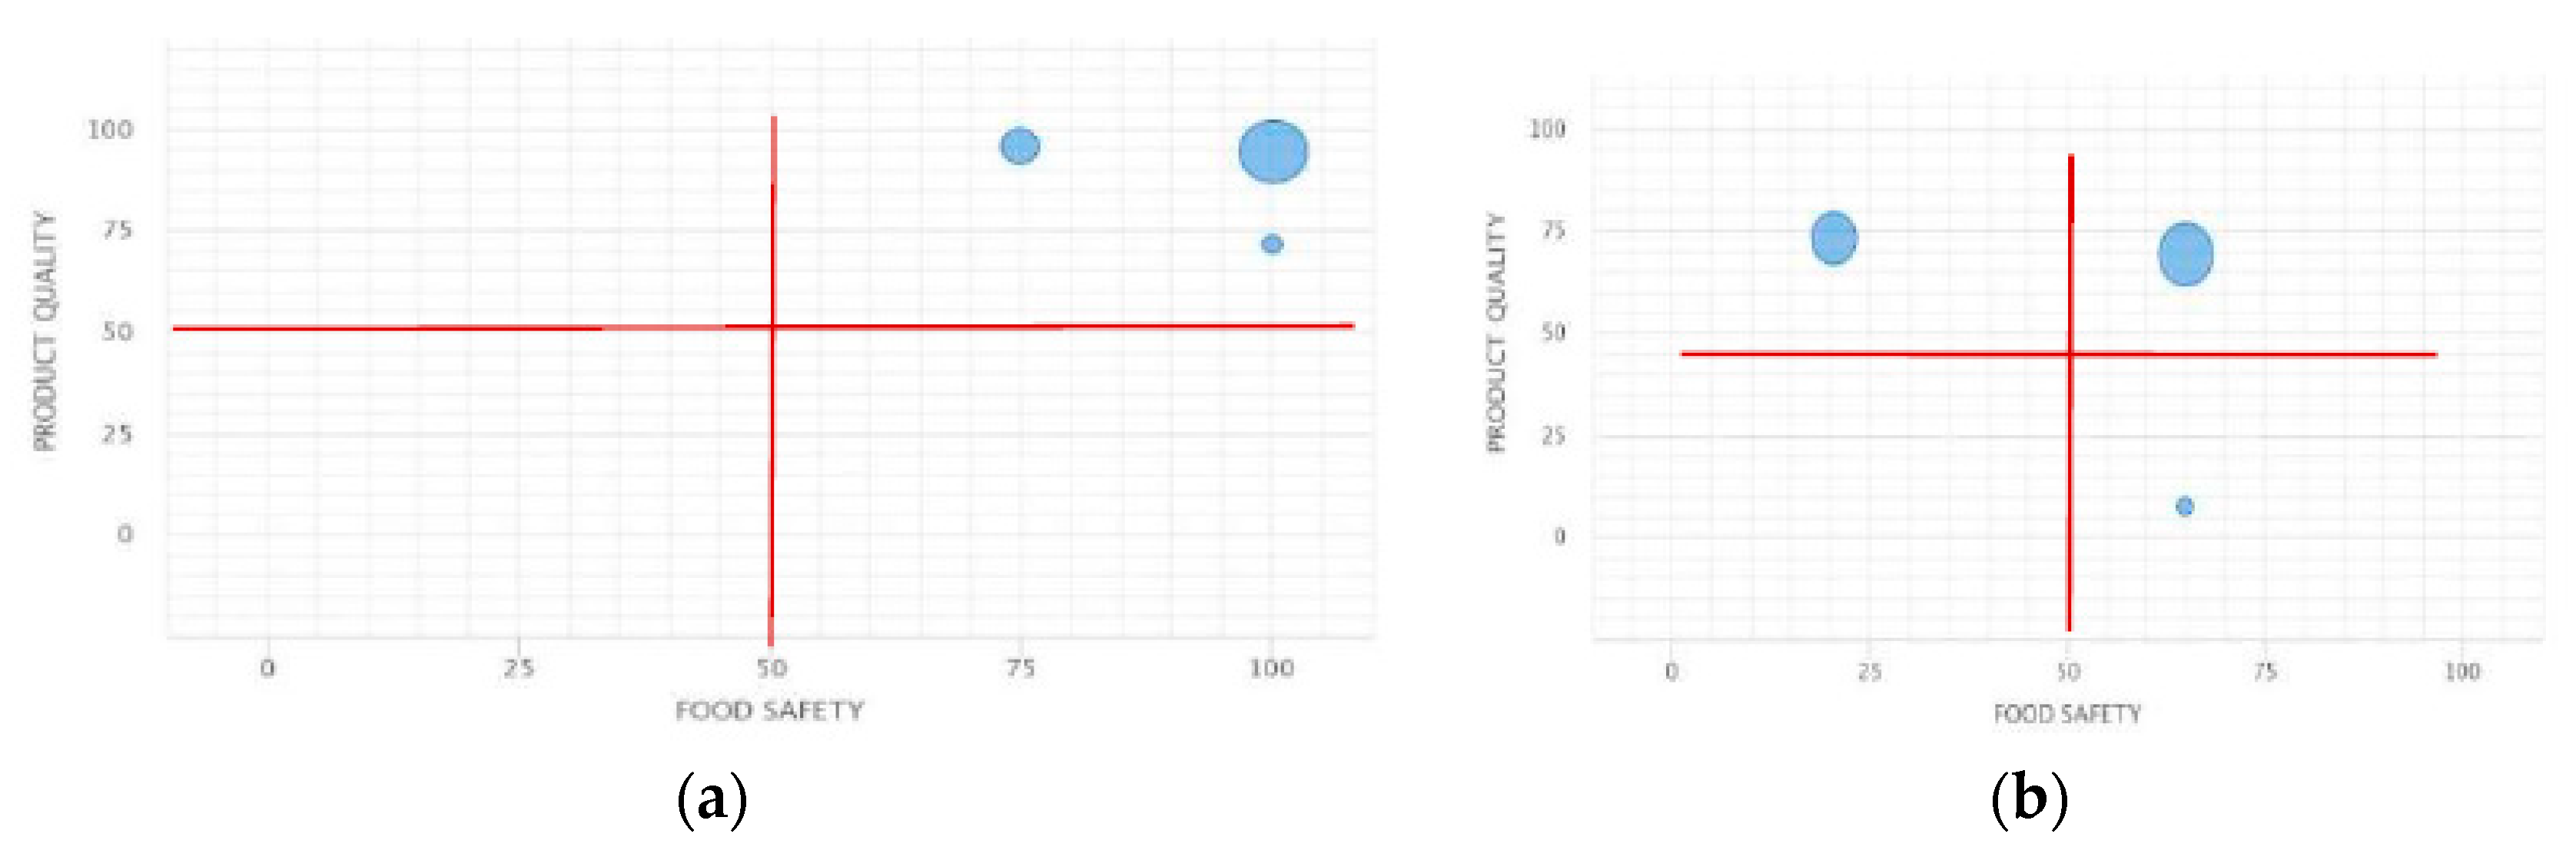
Section 4.2. This figure highlights the higher discriminant power of PROMETHEE, which allows for segmentation of suppliers based on groups of criteria and is becoming a very important practical tool for decision making in companies. To analyze the sensitivity of the scores to changes in criteria weights,
Figure 14 shows the results for another scenario, scenario 2, in which the weight of product quality has been increased to 40%, while the weights of logistics and commercial criteria are 20% and 10%, respectively. These changes do not modify the segmentation of suppliers.
5. Discussion
Product qualifying and supplier evaluation are critical supply chain management issues in food distribution companies, mainly due to food safety incidents that can cause negative effects on consumer health, sales, and brand image, among others. Environmental criteria are also increasingly important for consumers and economic criteria are relevant in order to provide profits for companies and affordable food to society. If a product is good enough for the consumer, this is related to its own performance on criteria selected to qualify the product. Thus, the MAUT method provides an appropriate approach to carry out food product evaluation. In addition, it is easy to use and apply at an operational level in companies, as shown in
Section 3.
Evaluating suppliers from a sustainable perspective can be done by both MAUT and PROMETHEE. The main advantages and drawbacks of these approaches derive from the compensatory nature of MAUT and the non-compensatory character of PROMETHEE, based on pairwise comparisons of the supplier performance with respect to all criteria.
Section 4 has shown the better suitability of the latter to identify strengths and weaknesses of each supplier. Similar results were obtained in the decision support system related to supplier segmentation validated in a manufacturing company, which makes intermediate products for other companies of food, pharmaceuticals, and chemicals sectors [
23]. In this case, the evaluation was focused on chemical and packaging goods, the products and supplier criteria were grouped into critical and strategic criteria, and sustainability was not the main issue studied. Therefore, the criteria considered were quite different to those proposed in this research for fresh fruits in supermarket chains.
The proposal by Lau et al. for fresh food included three multicriteria techniques [
26]. Fuzzy AHP to determine the weights of criteria, while we propose AHP or consensus among managers from all departments involved. These authors first applied the non-compensatory ELECTRE method to qualify suppliers from the food safety perspective, followed by TOPSIS to evaluate only the suppliers that verified safety specifications. TOPSIS is a classical multicriteria method with good theoretical properties that provides quantitative indicators based on the distance of the alternatives with respect to the ideal point. Nevertheless, the current trends in supply chain management encourage evaluating and monitoring suppliers systematically, ensuring that they satisfy legal regulations and technical specifications, in order to develop the most appropriate relations with suppliers according to company strategy and preferences [
3,
23,
31].
Regarding the specific measures to evaluate fresh food suppliers, Lau et al. included 10 main criteria: product, quality, food safety, price, delivery, serviceability, commercial position, supplier relationship, risk factor, and Corporate Social Responsibility (CSR). Each main criterion includes between five and nine sub criteria, with more than 60 in total. The qualitative or quantitative nature of many of them is unclear, as is whether the data are sourced from manager evaluations or from quantitative values of databases. The weights of the main criteria vary from 4% for CSR to 16.5% for quality and food safety, which includes certifications, audits, and traceability. Our proposal includes food safety certifications and HACCP qualifications, as well as three new criteria which are the withdrawal volume, number, and impact of withdrawals.
There are some remarkable differences between the approach of Lau et al. [
26] and the system proposed in this research. The perspective of our evaluation is global sustainability, while Lau et al. do not consider environmental criteria specifically. These authors only include eco-labeling as a sub criterion in the CSR criterion with very little weight. They also include supplier relationship as a main criterion, whereas this is something to be monitored and reported on from the results of supplier segmentation in our proposal. For example, the supplier is one with a long-term contract, it is advisable to maintain this relationship, or the company should set out new measures if poor performance is found in the period evaluated.
The selection and number of criteria, a clear definition and how to measure their performance, are key issues in the real implementation of a decision support system based on MCDM. In particular, the multicriteria model should be completed. This means that it includes all relevant criteria according to the company’s strategic objectives. At the same time, the selected criteria should have reliable and available data to measure their performance. Many of the case studies on supplier evaluation are mainly based on the manager’s assessment. Our proposal is to balance criteria number and model completeness together with data quality and availability. Sustainable supply chain trends in the food sector, such as traceability, facilitate the collection of data needed to implement decision support systems to evaluate and monitor products and suppliers.
The system proposed, based on both MAUT and PROMETHEE, is easy to understand and implement as the core of a decision support system useful for product and supplier assessment in food distribution companies. MAUT is appropriate to qualify fresh food, but has less power to rank and classify suppliers than PROMETHEE. The power of outranking methods, such as PROMETHEE and ELECTRE, comes from their focus on pairwise comparison of alternatives. Nevertheless, ELECTRE is more complex and difficult to understand and apply, as more inputs and parameters are required. On the one hand, MAUT does not have the same rank reversal problems as TOPSIS, which only needs the weights of criteria and is based on an easy algorithm, but it is not appropriate for sustainable supplier evaluation. On the other hand, PROMETHEE has demonstrated the power of graphical tools to carry out more in-depth studies with Global Visual Analysis (GAIA plane), as well as its graphical capabilities to detect strengths and weaknesses of the suppliers’ performance and design supplier segmentation to inform strategic decision making.
Finally, it is necessary to highlight that LCA is a common approach in the literature dealing with product sustainability. Nevertheless, LCA is not as appropriate a tool to qualify, evaluate, and monitor food products and their suppliers as the MCDM methods are, as MCDM methods facilitate decision making in companies at the operational, tactical, and strategic level [
1].
6. Conclusions
Qualifying and evaluating suppliers are two common and relevant supply chain management tasks in large companies. There is a huge number of articles on this topic, but they are focused on selecting providers for one product only in manufacturing industries. Nevertheless, companies work in more complex and changing contexts, where selecting a small number of suppliers per product is the trend in supply chain management. In addition, there is a lack of literature on supplier evaluation in food distribution companies, which have an increasing global impact from an economic, environmental, and social point of view.
This article proposes a system based on two multicriteria methods in order to first qualify food and then evaluate its quality, whose results are used in a second step, along with other criteria from providers, focused on sustainability evaluation of fresh food suppliers. The system combines a compensatory multicriteria technique, MAUT, which is easy to use and appropriate to qualify and obtain a quality indicator for products, with PROMETHEE, a non-compensatory method. The models proposed have been validated for fresh food in a supermarket chain, mainly using historical data on fruits rather than opinions, judgements and/or direct ratings from managers. This research represents the first time that both approaches, suitable for supplier evaluation, are applied to this purpose in distribution companies. The system includes economic, environmental, and social criteria to develop sustainability indicators for suppliers, which allow them to improve food safety, one of the most relevant social criteria.
Global and partial indicators from suppliers provide information on the most appropriate decisions and relations between distribution companies and their providers. An example of this is whether to accept or reject a fresh food batch when it is checked at the logistical platform, as well as evaluating the quality of fresh food. Poor performance in food safety can lead to some suppliers being disqualified. As MAUT is easy to apply and interpret, it can be used successfully in real implementations at an operational level in logistic platforms. MAUT is also easy to apply and is useful for monitoring global performance of suppliers in a season, which can be carried out by PROMETHEE. In addition, this latter method is more suitable for supplier segmentation and provides additional information to analyze their performance in depth, as it discriminates more among supplier strengths and weaknesses.
Finally, in future research it would be interesting to extend this proposal to a large number of fruits and vegetables, including organic products in the evaluation. Likewise, developing appropriate criteria and models to evaluate the food safety and sustainability of fresh meat and its suppliers could contribute significantly to improving not only food distribution supply chain management, but also providing benefits for companies and people. To achieve this end, multicriteria models must be based on transparent and objective data for clearly defined criteria.


