Development of a Composite Measure of Regional Sustainable Development in Indonesia


Abstract
:1. Introduction
2. Literature Review
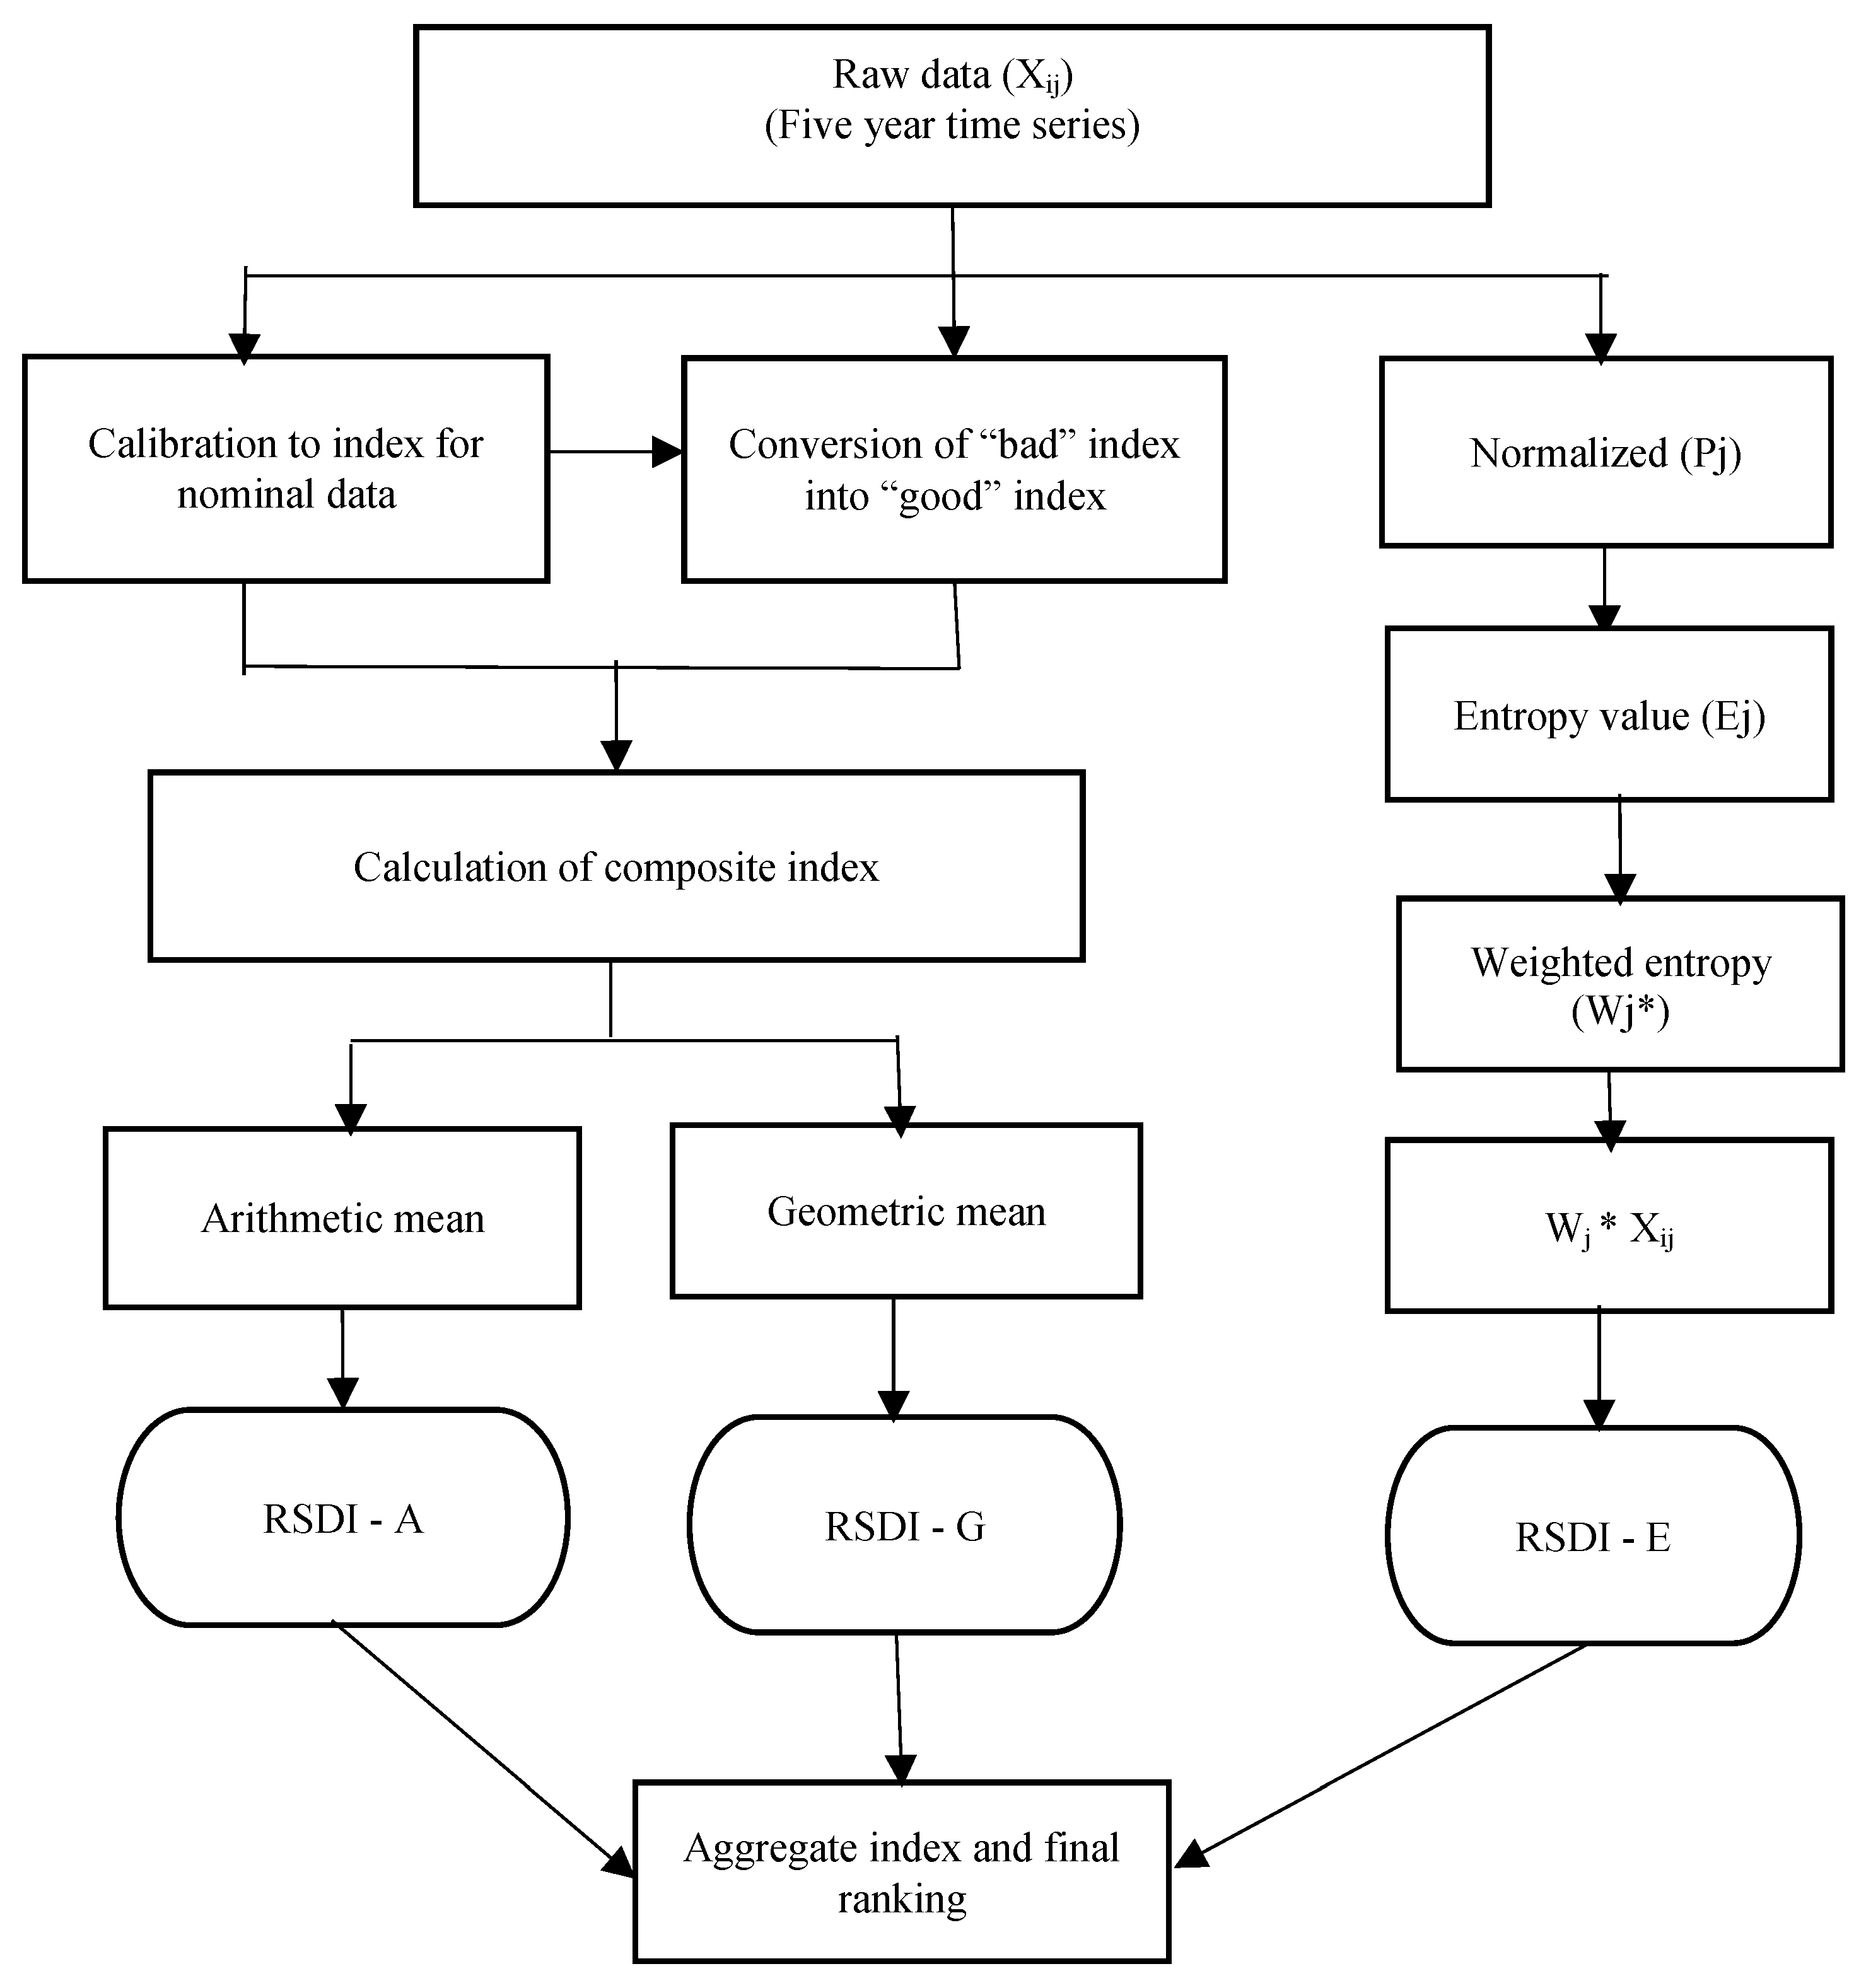
3. Methodology
4. Results and Discussion
4.1. Formation Indicators for the Regional Sustainable Development Index
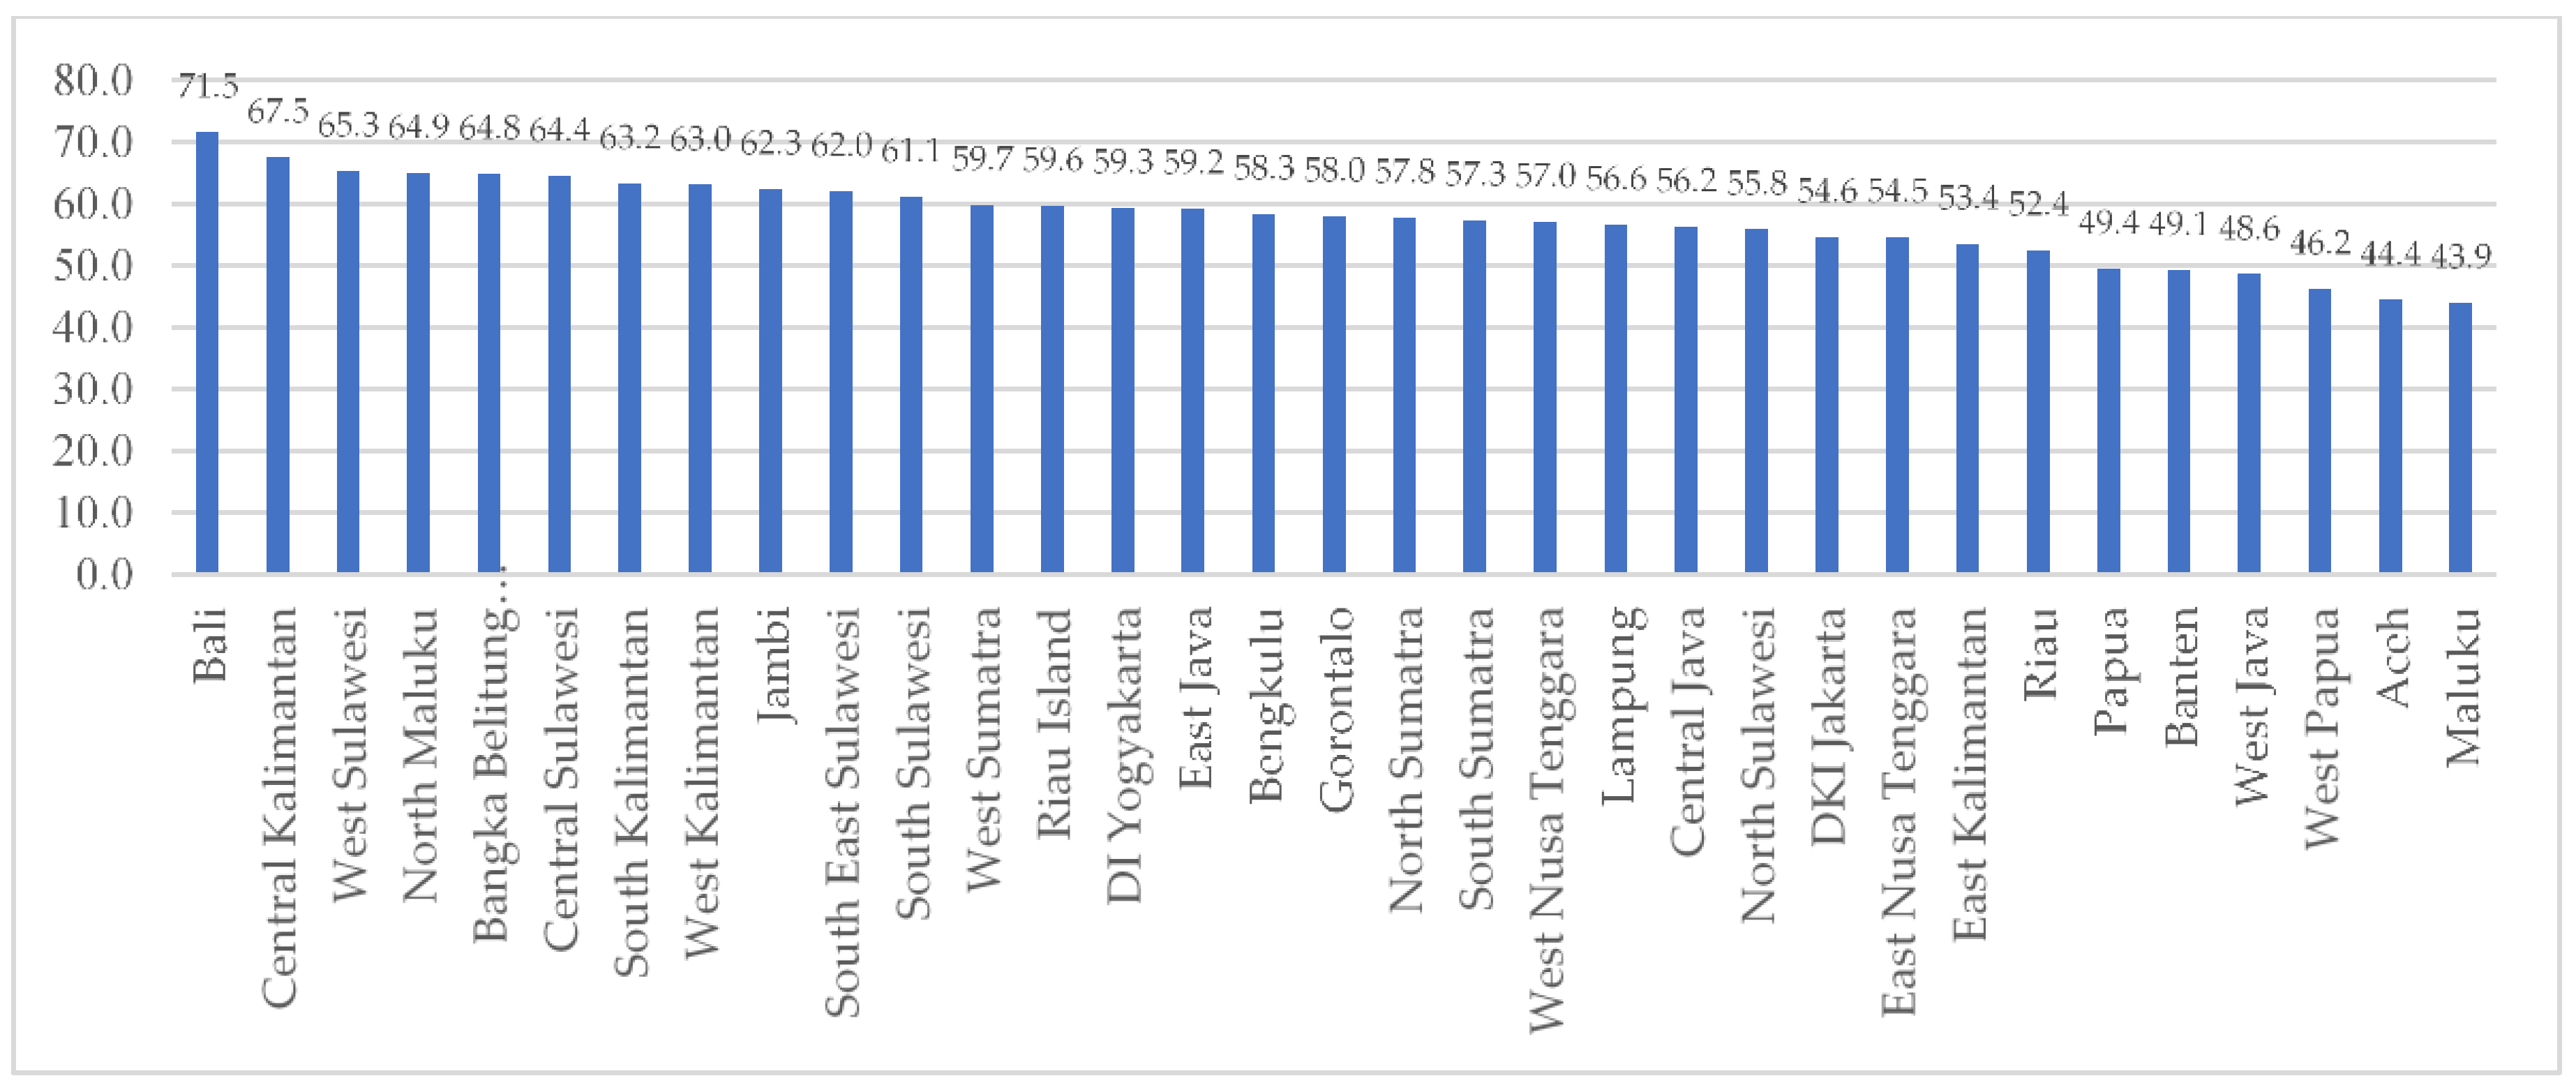
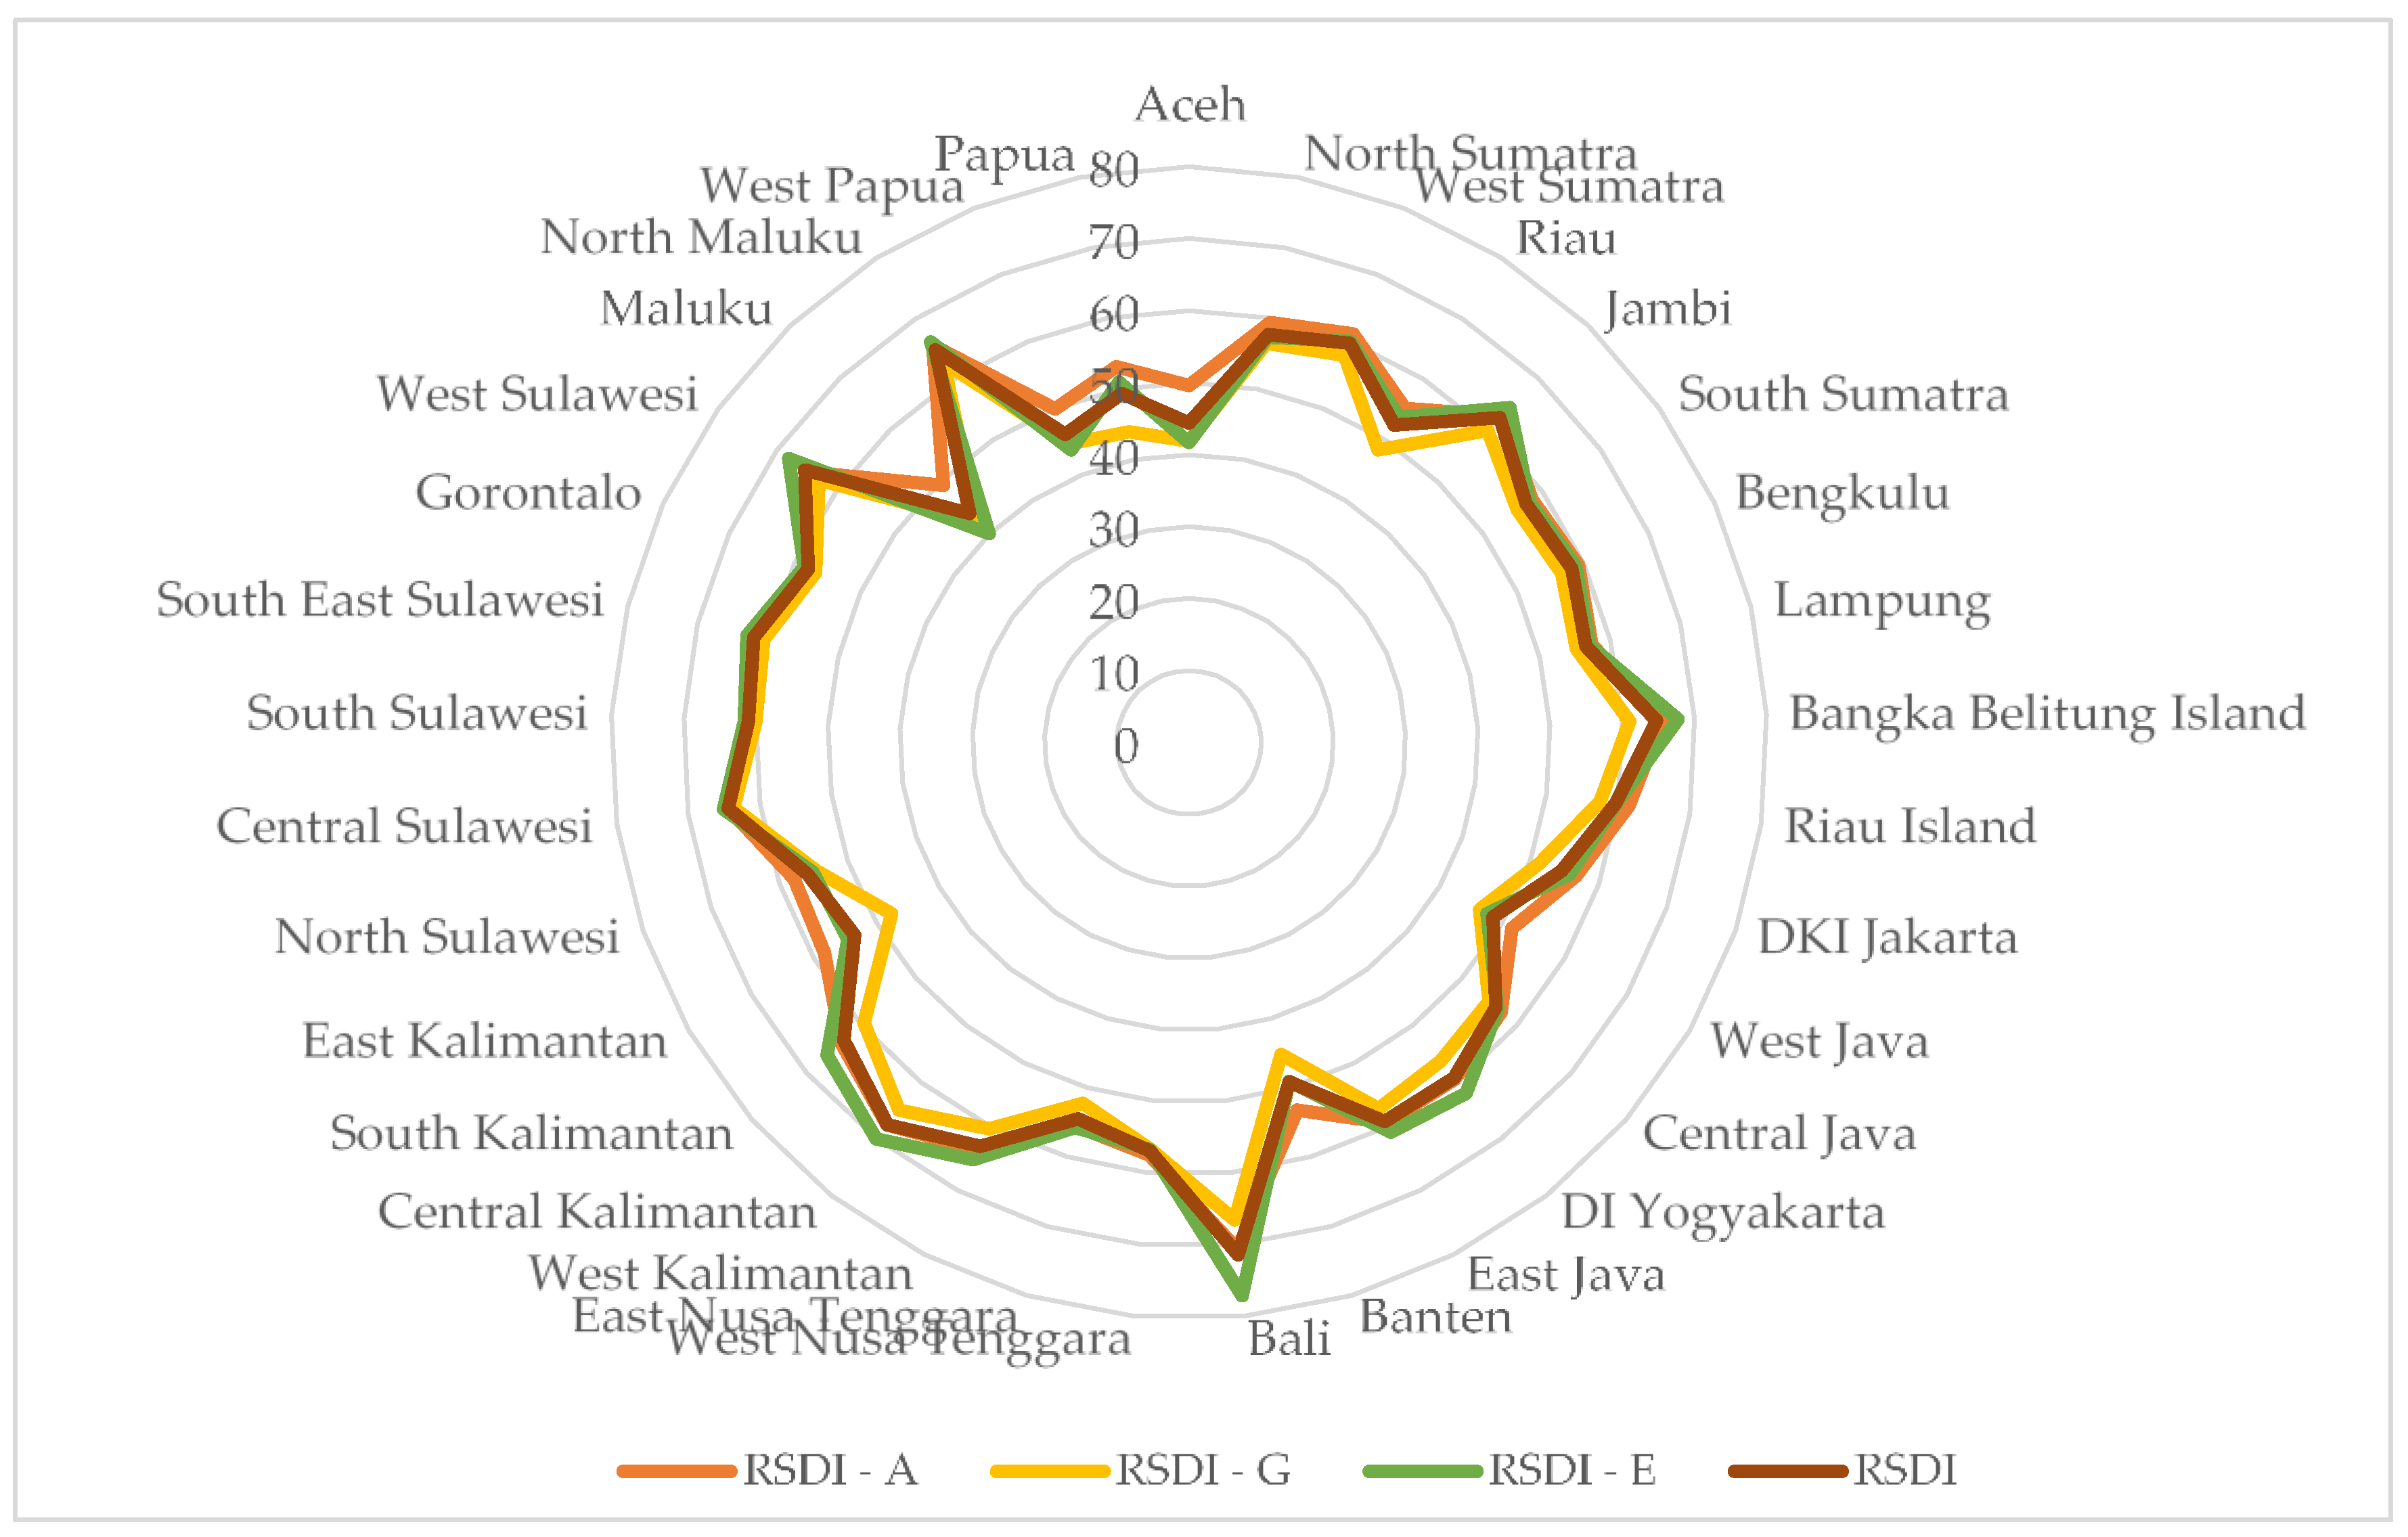
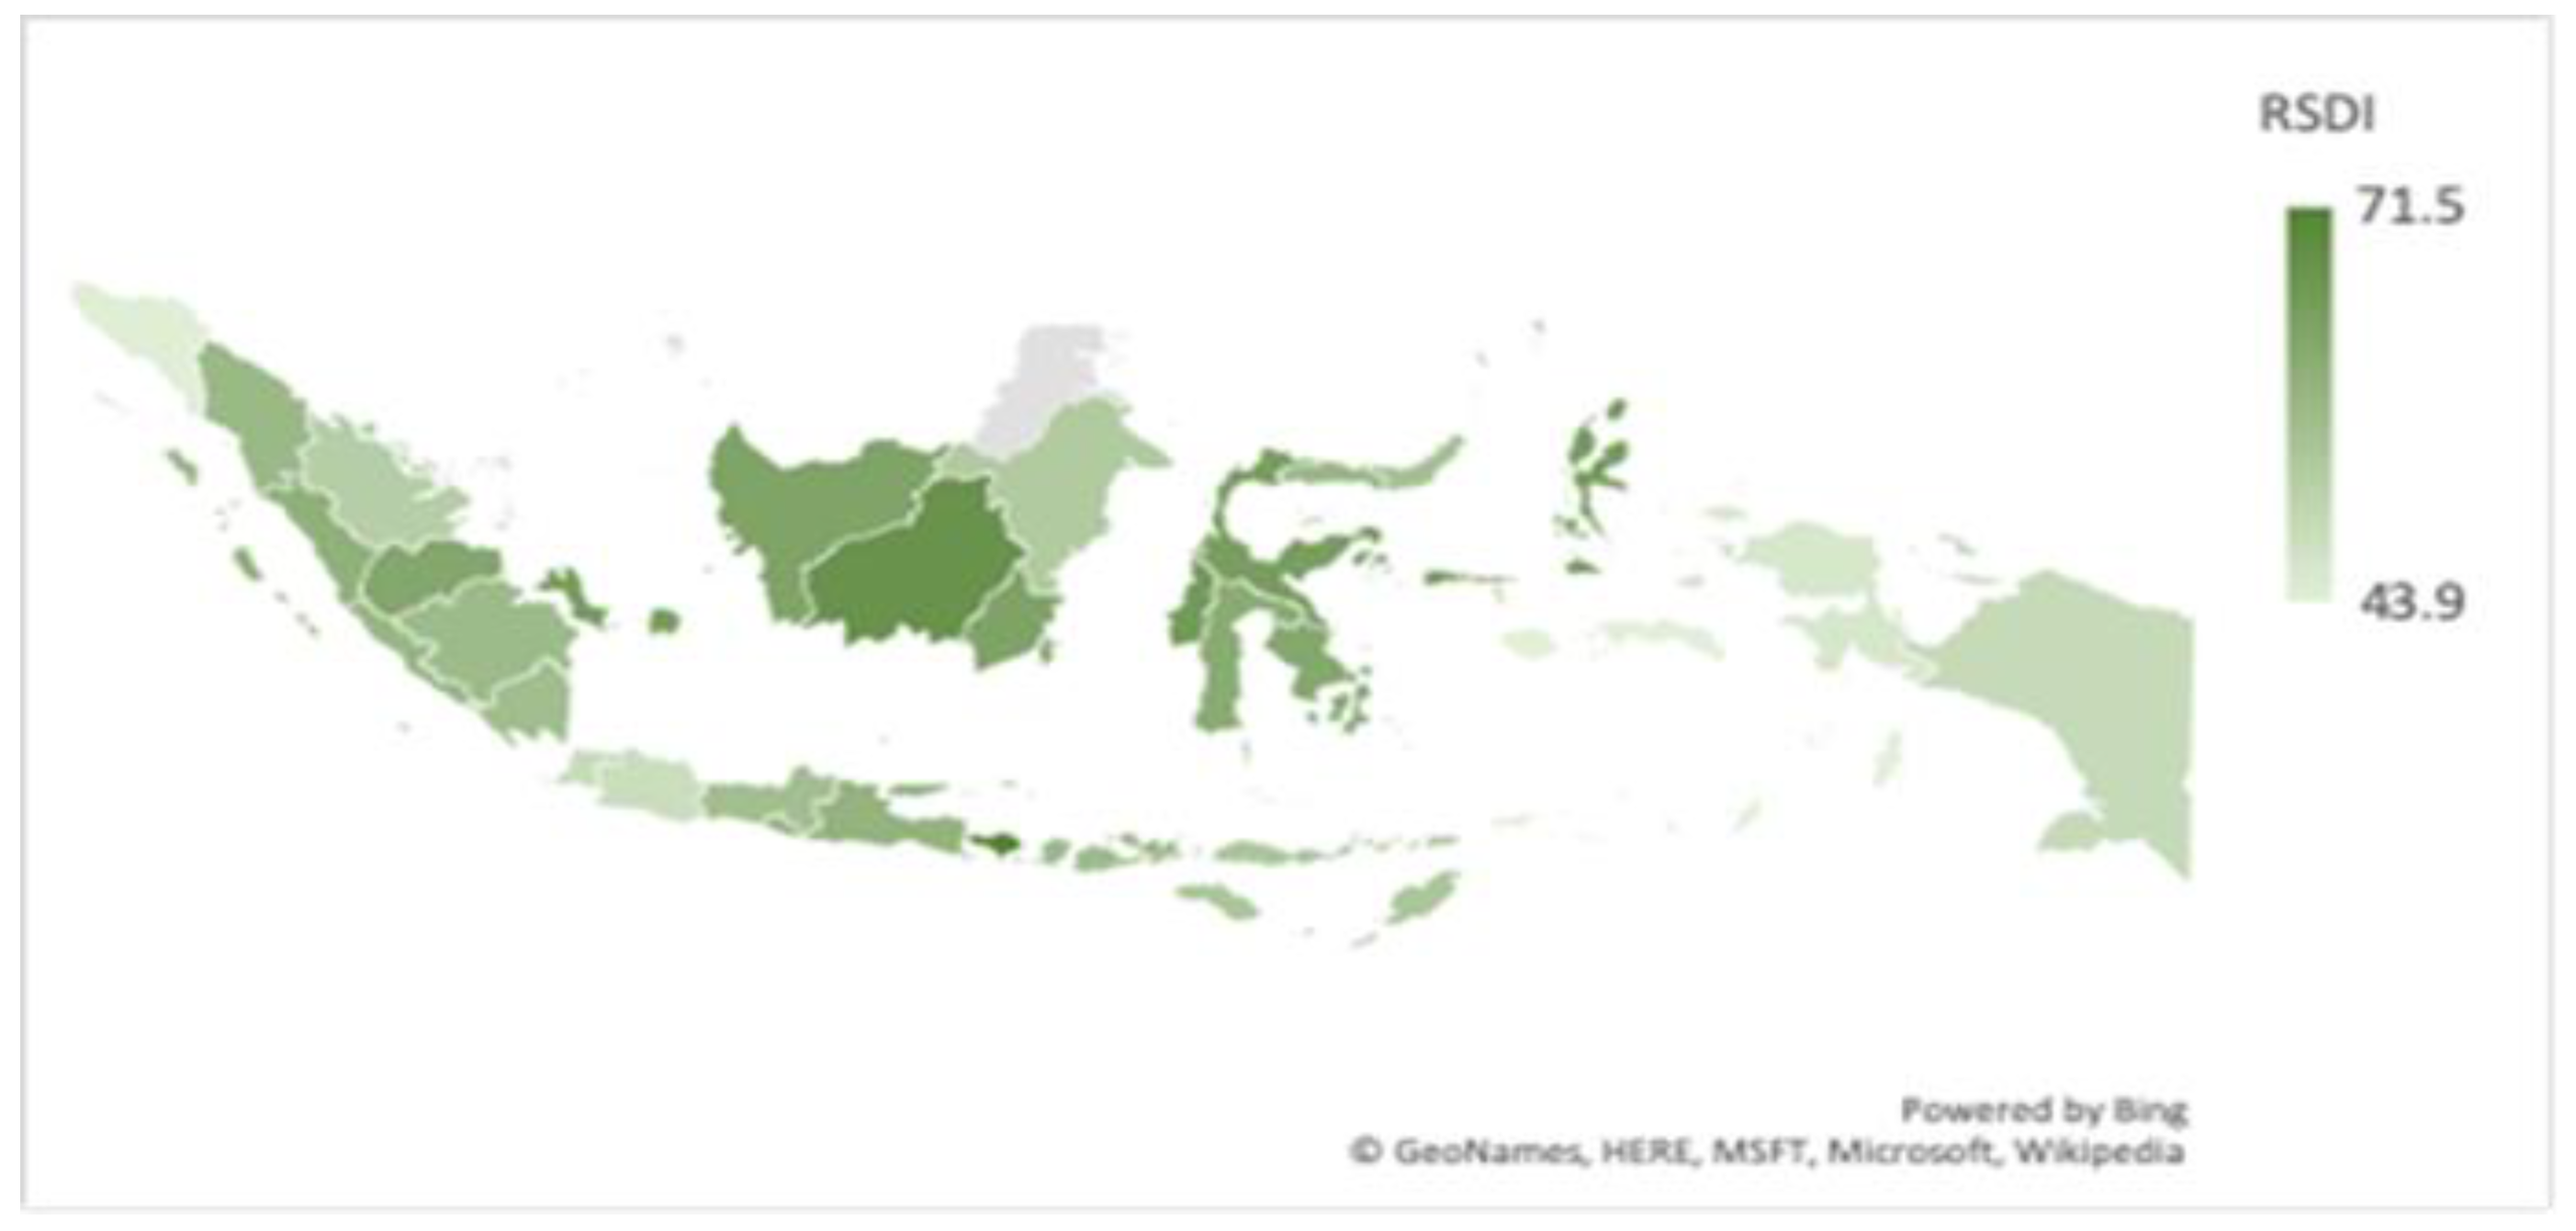
4.2. Scores and Rank of the Regional Sustainable Development Index
4.3. Sensitivity Analysis
5. Concluding Remarks
Author Contributions
Funding
Conflicts of Interest
References
- Nijkamp, P.; Van den Bergh, C.J.M.; Soeteman, F.J. Regional sustainable development and natural resource use. World Bank Econ. Rev. 1990, 4, 153–188. [Google Scholar] [CrossRef]
- Liang, X.; Si, D.; Zhang, X. Regional sustainable development analysis based on information entropy—Sichuan Province as an example. Int. J. Environ. Res. Public Health 2017, 14, 1219. [Google Scholar] [CrossRef] [PubMed]
- Nijkamp, P.; Ouwersloot, H. A Decision Support System for Regional Sustainable Development: The Flag Model. Tinbergen; Institute Discussion Paper; Vrije Universiteit: Amsterdam, The Netherlands, 1996. [Google Scholar]
- Graymor, M.L.M.; Sipe, N.G.; Rickson, R.E. Regional sustainability: How useful are current tools of sustainability assessment at the regional scale? Ecol. Econ. 2008, 67, 362–372. [Google Scholar] [CrossRef]
- Sirr, L.; Kelly, R.; Ratcliffe, J. Futures thinking to achieve sustainable development at local level in Ireland. Foresight 2004, 6, 80–90. [Google Scholar]
- Clement, K.; Hansen, M.; Bradley, K.B. Sustainable Regional Development: Learning from Nordic Experience; Nordregio: Stockholm, Sweden, 2003. [Google Scholar]
- Bakri, B.; Rustiadi, E.; Fauzi, A.; Adiwibowo, S. Regional sustainable development indicators for developing countries: Case studies of provinces in Indonesia. Int. J. Sustain. Dev. 2018, 21, 102–130. [Google Scholar]
- Herrera-Ulloa, A.F.; Charles, A.T.; Lluch-Cota, S.E.; Ramirez-Aguirre, H.; Hernández-Váquez, S.; Ortega-Rubio, A. A regional-scale sustainable development index: The case of Baja California sur Mexico. Int. J. Sustain. Dev. World Ecol. 2003, 10, 353–360. [Google Scholar] [CrossRef]
- Mishenin, Y.; Konlianska, I.; Medvid, V.; Maistrenko, Y. Sustainable regional development policy formation: Role of industrial ecology and logistics. Entrep. Sustain. Issues 2018, 6, 329–341. [Google Scholar] [CrossRef]
- Malik, K.; Ciesielka, M. Sustainability within the region: The role of institutional governance. Econ. Environ. Stud. 2011, 11, 167–187. [Google Scholar]
- Jovovic, R.; Draskovic, M.; Delibasic, M.; Jovovic, M. The concept of sustainable regional development—Institutional aspects, policies and prospects. J. Int. Stud. 2017, 10, 255–266. [Google Scholar] [CrossRef]
- Streimikiene, D. Comparative assessment of environmental indicators of quality of life in Romania and Lithuania. Econ. Sociol. 2014, 7, 11–21. [Google Scholar] [CrossRef]
- Roberts, P. Evaluating regional sustainable development: Approaches, methods, and politics of analysis. J. Environ. Plan. Manag. 2006, 49, 515–532. [Google Scholar] [CrossRef]
- Fauzi, A.; Oxtavianus, A.O. Pengukuran Pembangunan Berkelanjutan di Indonesia (Measurement of Sustainable Development in Indonesia). Mimb. J. Sos. Pembang. Indones. (Mimb. J. Indones. Soc. Dev.) 2014, 30, 68–83. [Google Scholar]
- Shi, Y.; Ge, X.; Yuan, X.; Wang, Q.; Kellett, J.; Li, F.; Ba, K. An integrated indicator system and evaluation model for regional sustainable development. Sustainability 2019, 11, 2183. [Google Scholar] [CrossRef]
- Sharpe, A. Literature Review of Frameworks for Macro-Indicators; No. 2004-03; Centre for the Study of Living Standards: Ottawa, ON, Canada, 2004. [Google Scholar]
- Nardo, M.; Saisana, M.; Saltelli, A.; Tarantola, S. Tools for Composite Indicators Building; European Commission, Institute for the Protection and Security of the Citizen, JRC: Ispra, Italy, 2005. [Google Scholar]
- Saisana, M.; Tarantola, S.; Schulze, N.; Cherchye, L.; Moesen, W.; Puyenbroeck, T.; Van Leuven, K.U. Workpackage 5. State-Of-The-Art Report on Composite Indicators for the Knowledge-Based Economy; University of Trier: Trier, Germany, 2005. [Google Scholar]
- Talukder, B.; Hipel, K.W.; van Loon, G. Developing composite indicators for agricultural sustainability assessment: Effect of normalization and aggregation techniques. Resources 2017, 6, 66. [Google Scholar] [CrossRef]
- Saltelli, A. Composite indicators between analysis and advocacy. Soc. Indic. Res. 2006, 81, 65–77. [Google Scholar] [CrossRef]
- Salvati, L.; Carlucci, M. A composite index of sustainable development at the local scale: Italy as a case study. Ecol. Indic. 2014, 43, 162–171. [Google Scholar] [CrossRef]
- Nagy, J.A.; Benedek, J.; Ivan, K. Measuring sustainable development goals at a local level: A case of a metropolitan area in Romania. Sustainability 2018, 10, 3962. [Google Scholar] [CrossRef]
- Li, Z.; Tang, D.; Han, M.; Bethel, J.B. Comprehensive evaluation of regional sustainable development based on data envelopment analysis. Sustainability 2018, 10, 3897. [Google Scholar] [CrossRef]
- Pravitasari, A.E.; Rustiadi, E.; Mulya, S.P.; Fuadina, L.N. Developing regional sustainability index as a new approach for evaluating sustainability performance in Indonesia. Environ. Ecol. Res. 2018, 6, 157–168. [Google Scholar] [CrossRef]
- Organisation for Economic Co-operation and Development. Handbook on Constructing Composite Indicators: Methodology and User Guide; OECD Publishing: Paris, France, 2008. [Google Scholar]
- Greco, S.; Ishizaka, A.; Tasiou, M.; Torrisi, G. On the methodological framework of composite indices: A review of the issues of weighting, aggregation, and robustness. Soc. Indic. Res. 2019, 141, 61–94. [Google Scholar] [CrossRef]
- Shannon, C.E. A mathematical theory of communication. Bell Syst. Tech. J. 1948, 27, 379–423. [Google Scholar] [CrossRef]
- Bai, L.; Wang, H.; Huang, N.; Du, Q.; Huang, Y. An environmental management maturity model of construction program using the AHP-entropy approach. Int. J. Environ. Res. Public Health 2018, 15, 1317. [Google Scholar] [CrossRef] [PubMed]
- Gan, X.; Fernandez, I.C.; Guo, J.; Wilson, M.; Zhao, Y.; Zhou, B.; Wu, J. When to use what: Methods for weighting and aggregating sustainability indicators. Ecol. Indic. 2017, 81, 491–502. [Google Scholar] [CrossRef]
- Singh, R.K.; Murty, H.R.; Gupta, S.K.; Dikshit, A.K. An overview of sustainability assessment methodologies. Ecol. Indic. 2009, 9, 189–212. [Google Scholar] [CrossRef]
- Munda, G.; Nardo, M. Constructing Consistent Composite Indicators: The Issue of Weights; EUR 21834 EN; European Commission: Brussels, Belgium, 2005. [Google Scholar]
- Rowley, H.V.; Peters, G.M.; Lundie, S.; Moore, S.J. Aggregating sustainability indicators: Beyond the weighted sum. J. Environ. Manag. 2012, 111, 24–33. [Google Scholar] [CrossRef]
- Saisana, M.; Tarantola, S. State-Of-The-Art Report on Current Methodologies and Practices for Composite Indicator Development; European Commission, Joint Research Centre, Institute for the Protection and the Security of the Citizen, Technological and Economic Risk Management Unit: Ispra, Italy, 2002. [Google Scholar]
- Freudenberg, M. Composite Indicators of Country Performance: A Critical Assessment; OECD Science, Technology and Industry Working Papers; OECD Publishing: Paris, France, 2003. [Google Scholar]


| Dimensions | Indicators | Label | Adjustment |
|---|---|---|---|
| Economics | Economic growth rate | IEG | No |
| Unemployment rate | IUNP | (100-IUNP) | |
| Social | Poverty | IPOV | (100-IPOV) |
| Gini index | GI | (100-GI) | |
| Human development index (HDI) | HDI | No | |
| Environment | Environment quality index (EQI) | EQI | No |
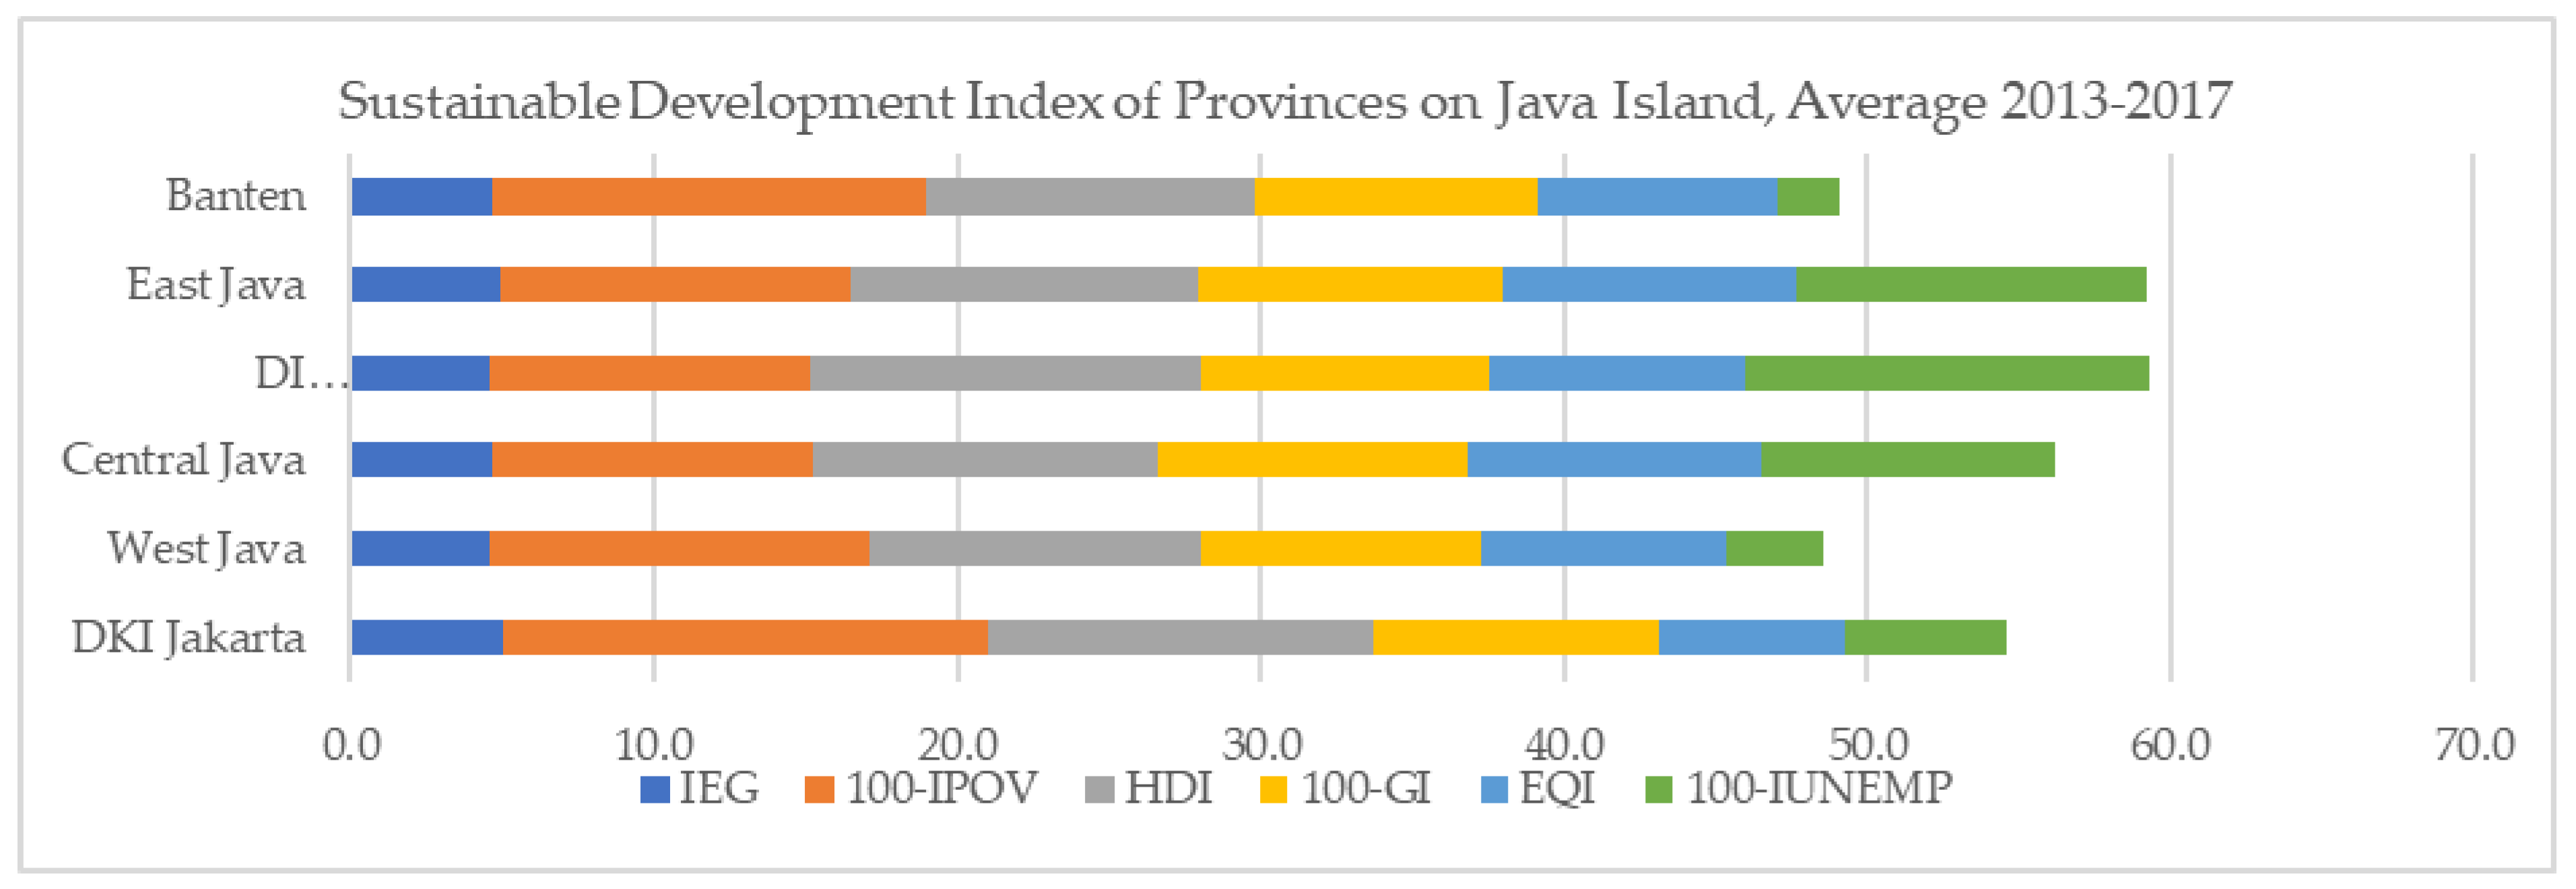
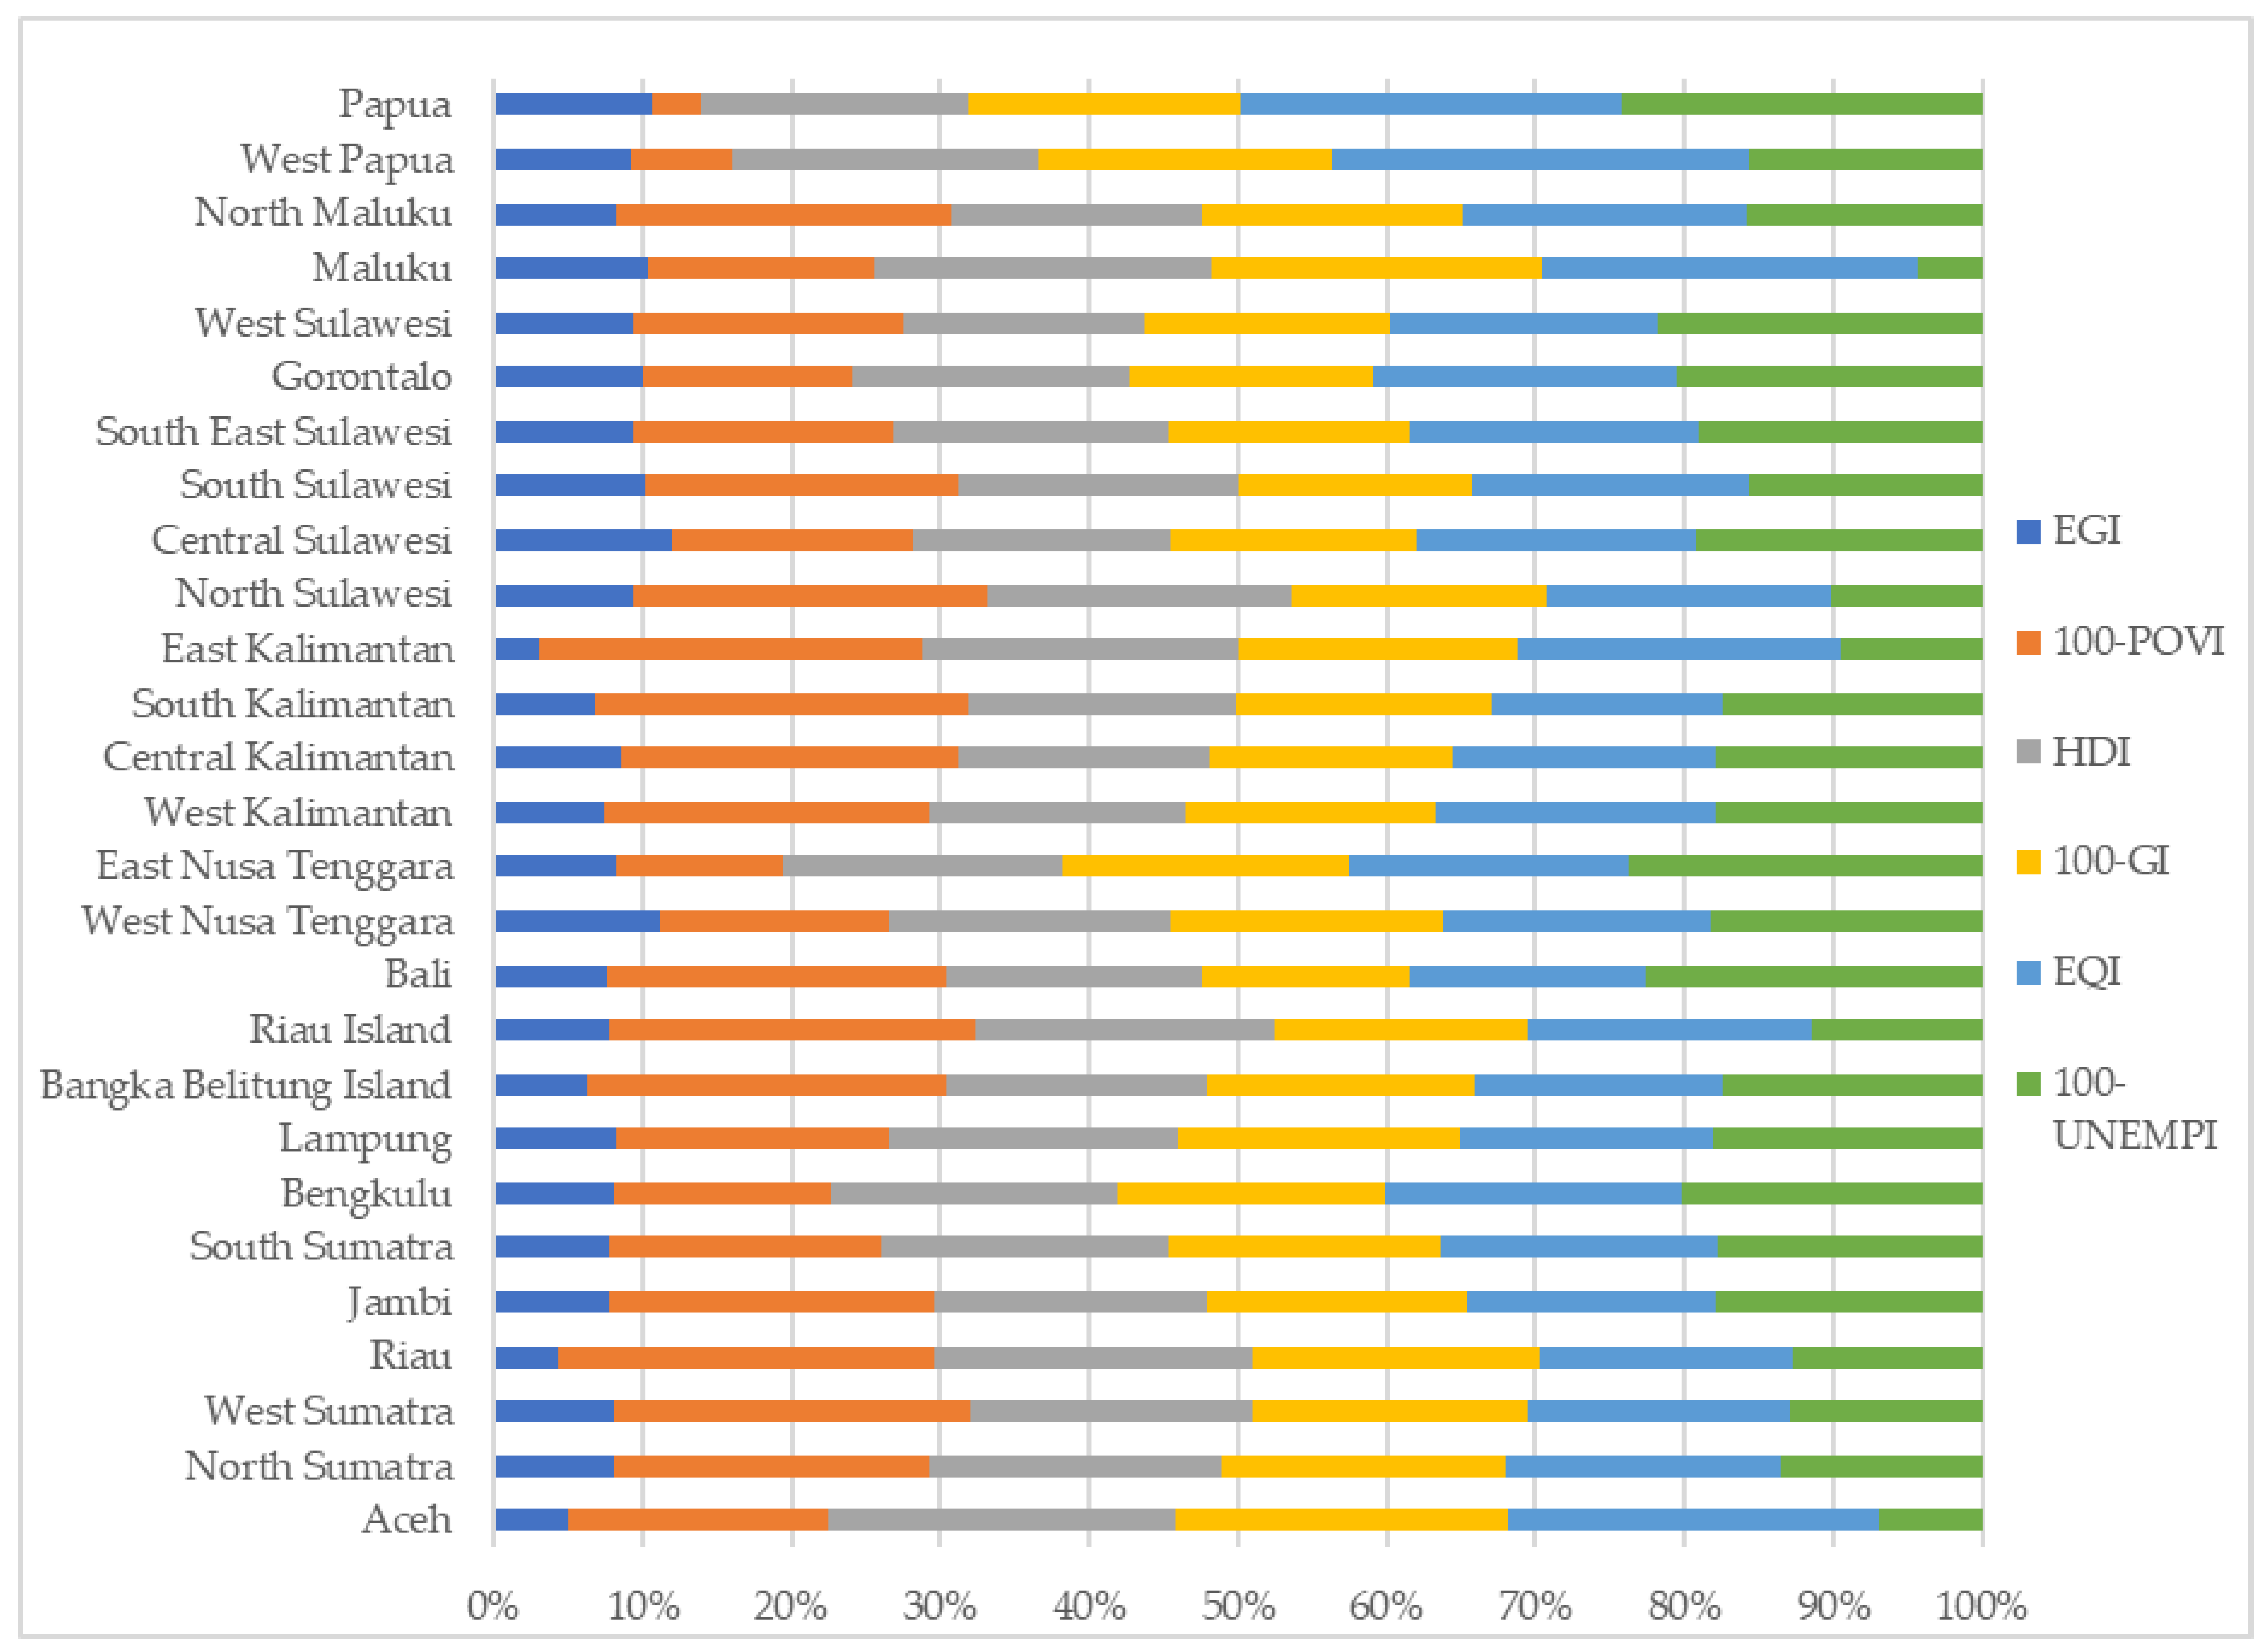
| Province | IEG | 100-IPOV | HDI | 100-GI | EQI | 100-IUNP |
|---|---|---|---|---|---|---|
| Aceh | 14.7 | 51.9 | 69.4 | 66.5 | 74.1 | 20.7 |
| North Sumatra | 28.5 | 76.0 | 69.5 | 68.2 | 66.0 | 48.1 |
| West Sumatra | 29.7 | 87.7 | 70.0 | 67.4 | 64.8 | 47.6 |
| Riau | 14.2 | 83.8 | 70.8 | 63.8 | 56.4 | 42.2 |
| Jambi | 29.1 | 82.5 | 68.9 | 66.1 | 62.5 | 67.6 |
| South Sumatra | 27.1 | 64.2 | 67.5 | 63.7 | 65.2 | 62.0 |
| Bengkulu | 28.7 | 51.7 | 68.7 | 63.9 | 70.8 | 72.1 |
| Lampung | 28.1 | 63.0 | 67.0 | 65.4 | 58.8 | 62.0 |
| Bangka Belitung | 24.9 | 94.8 | 69.0 | 71.1 | 65.1 | 68.9 |
| Riau Islands | 28.6 | 91.1 | 73.7 | 63.2 | 70.0 | 42.5 |
| Jakarta | 31.4 | 99.4 | 79.0 | 58.6 | 38.2 | 33.1 |
| West Java | 29.1 | 80.1 | 69.5 | 59.3 | 51.7 | 20.2 |
| Central Java | 28.2 | 64.5 | 69.4 | 62.4 | 59.3 | 59.1 |
| Yogyakarta | 27.8 | 63.6 | 77.6 | 57.4 | 50.7 | 80.1 |
| East Java | 30.0 | 69.3 | 68.9 | 60.6 | 58.4 | 69.5 |
| Banten | 30.2 | 92.9 | 70.4 | 60.7 | 51.4 | 13.7 |
| Bali | 32.5 | 96.5 | 73.2 | 59.2 | 66.7 | 96.3 |
| West Nusa Tenggara | 38.3 | 53.5 | 65.1 | 63.3 | 61.9 | 63.3 |
| East Nusa Tenggara | 27.6 | 36.8 | 62.7 | 64.6 | 62.4 | 79.1 |
| West Kalimantan | 28.2 | 83.5 | 65.4 | 64.5 | 71.7 | 68.2 |
| Central Kalimantan | 34.6 | 92.2 | 68.5 | 65.7 | 72.0 | 72.5 |
| South Kalimantan | 25.9 | 96.1 | 68.4 | 65.7 | 59.9 | 66.4 |
| East Kalimantan | 10.5 | 89.9 | 74.2 | 66.0 | 76.0 | 32.9 |
| North Sulawesi | 32.5 | 82.8 | 70.5 | 59.5 | 66.7 | 35.1 |
| Central Sulawesi | 46.4 | 62.6 | 66.9 | 63.7 | 72.8 | 74.2 |
| South Sulawesi | 37.5 | 78.1 | 69.1 | 58.2 | 68.8 | 57.6 |
| Southeast Sulawesi | 34.8 | 65.8 | 68.7 | 60.9 | 72.4 | 71.3 |
| Gorontalo | 35.2 | 49.3 | 65.8 | 57.2 | 71.5 | 72.1 |
| West Sulawesi | 36.4 | 70.9 | 62.9 | 64.2 | 70.0 | 84.7 |
| Maluku | 30.4 | 45.0 | 67.1 | 66.0 | 74.3 | 13.0 |
| North Maluku | 32.6 | 88.6 | 65.9 | 68.9 | 75.5 | 62.2 |
| West Papua | 27.4 | 20.4 | 61.8 | 59.2 | 83.8 | 46.8 |
| Papua | 34.3 | 10.0 | 57.5 | 58.2 | 81.5 | 77.5 |
| Provinces | Arithmetic Mean | Geometric Mean | Entropy | Aggregate | ||||
|---|---|---|---|---|---|---|---|---|
| RSDI-A | Rank | RSDI-G | Rank | RSDI-E | Rank | RSDI | Rank | |
| Bali | 70.75 | 1 | 66.62 | 1 | 77.22 | 1 | 71.5 | 1 |
| Central Kalimantan | 67.59 | 2 | 64.94 | 2 | 70.05 | 2 | 67.5 | 2 |
| West Sulawesi | 64.87 | 5 | 62.89 | 4 | 68.03 | 3 | 65.3 | 3 |
| North Maluku | 65.62 | 3 | 62.84 | 5 | 66.16 | 6 | 64.9 | 4 |
| Bangka Belitung Island | 65.62 | 4 | 61.07 | 6 | 67.73 | 4 | 64.8 | 5 |
| Central Sulawesi | 64.44 | 6 | 63.71 | 3 | 65.09 | 8 | 64.4 | 6 |
| South Kalimantan | 63.72 | 7 | 59.50 | 11 | 66.32 | 5 | 63.2 | 7 |
| West Kalimantan | 63.58 | 8 | 60.39 | 8 | 65.16 | 7 | 63.0 | 8 |
| Jambi | 62.79 | 9 | 59.91 | 10 | 64.31 | 9 | 62.3 | 9 |
| South East Sulawesi | 62.32 | 10 | 60.59 | 7 | 62.95 | 10 | 62.0 | 10 |
| South Sulawesi | 61.55 | 11 | 60.00 | 9 | 61.62 | 12 | 61.1 | 11 |
| West Sumatra | 61.19 | 13 | 57.94 | 12 | 60.07 | 14 | 59.7 | 12 |
| Riau Island | 61.53 | 12 | 57.50 | 13 | 59.73 | 15 | 59.6 | 13 |
| DI Yogyakarta | 59.55 | 14 | 56.35 | 19 | 61.98 | 11 | 59.3 | 14 |
| East Java | 59.44 | 15 | 57.24 | 14 | 60.87 | 13 | 59.2 | 15 |
| Bengkulu | 59.31 | 17 | 56.70 | 16 | 58.84 | 16 | 58.3 | 16 |
| Gorontalo | 58.51 | 18 | 56.82 | 15 | 58.56 | 17 | 58.0 | 17 |
| North Sumatra | 59.38 | 16 | 56.52 | 18 | 57.36 | 19 | 57.8 | 18 |
| South Sumatra | 58.29 | 19 | 55.81 | 20 | 57.80 | 18 | 57.3 | 19 |
| West Nusa Tenggara | 57.58 | 22 | 56.67 | 17 | 56.83 | 21 | 57.0 | 20 |
| Lampung | 57.40 | 23 | 55.22 | 21 | 57.08 | 20 | 56.6 | 21 |
| Central Java | 57.14 | 24 | 54.96 | 22 | 56.56 | 22 | 56.2 | 22 |
| North Sulawesi | 57.85 | 21 | 54.58 | 23 | 55.12 | 25 | 55.8 | 23 |
| DKI Jakarta | 56.60 | 25 | 51.30 | 25 | 55.79 | 23 | 54.6 | 24 |
| East Nusa Tenggara | 55.54 | 26 | 52.24 | 24 | 55.76 | 24 | 54.5 | 25 |
| East Kalimantan | 58.26 | 20 | 47.55 | 27 | 54.54 | 26 | 53.4 | 26 |
| Riau | 55.19 | 27 | 48.37 | 26 | 53.73 | 27 | 52.4 | 27 |
| Papua | 53.16 | 29 | 43.96 | 31 | 51.01 | 28 | 49.4 | 28 |
| Banten | 53.21 | 28 | 45.12 | 29 | 49.07 | 29 | 49.1 | 29 |
| West Java | 51.64 | 30 | 46.44 | 28 | 47.58 | 30 | 48.6 | 30 |
| West Papua | 49.89 | 31 | 44.74 | 30 | 43.82 | 31 | 46.2 | 31 |
| Aceh | 49.56 | 32 | 41.91 | 33 | 41.71 | 32 | 44.4 | 32 |
| Maluku | 49.31 | 33 | 42.45 | 32 | 40.05 | 33 | 43.9 | 33 |
© 2019 by the authors. Licensee MDPI, Basel, Switzerland. This article is an open access article distributed under the terms and conditions of the Creative Commons Attribution (CC BY) license (http://creativecommons.org/licenses/by/4.0/).
Share and Cite
Rahma, H.; Fauzi, A.; Juanda, B.; Widjojanto, B. Development of a Composite Measure of Regional Sustainable Development in Indonesia. Sustainability 2019, 11, 5861. https://doi.org/10.3390/su11205861
Rahma H, Fauzi A, Juanda B, Widjojanto B. Development of a Composite Measure of Regional Sustainable Development in Indonesia. Sustainability. 2019; 11(20):5861. https://doi.org/10.3390/su11205861
Chicago/Turabian StyleRahma, Hania, Akhmad Fauzi, Bambang Juanda, and Bambang Widjojanto. 2019. "Development of a Composite Measure of Regional Sustainable Development in Indonesia" Sustainability 11, no. 20: 5861. https://doi.org/10.3390/su11205861
APA StyleRahma, H., Fauzi, A., Juanda, B., & Widjojanto, B. (2019). Development of a Composite Measure of Regional Sustainable Development in Indonesia. Sustainability, 11(20), 5861. https://doi.org/10.3390/su11205861