Article

Farmers’ Satisfaction and its Influencing Factors in the Policy of Economic Compensation for Cultivated Land Protection: A Case Study in Chengdu, China

1
School of Surveying and Land Information Engineering, Henan Polytechnic University, Jiaozuo 454000, China
2
The Research Centre of Land Economy and Urban-rural Development, Henan Polytechnic University, Jiaozuo 454000, China
3
School of Mathematics and Statistics, The University of Sydney, Sydney 2006, Australia
*
Author to whom correspondence should be addressed.
Sustainability 2019, 11(20), 5787; https://doi.org/10.3390/su11205787
Submission received: 26 August 2019 / Revised: 27 September 2019 / Accepted: 15 October 2019 / Published: 18 October 2019
(This article belongs to the Special Issue Sustainable Natural Resource Management)

Abstract

:
With the rapid progress of urbanization, the loss of cultivated land has attracted great attention worldwide, and economic compensation is one of the incentives commonly used by the governments to enhance farmers’ enthusiasm in protecting cultivated land. In recent years, although various economic compensation modes have been implemented by the Chinese government, such modes are still experimental and exploratory. Thus, designing and implementing a national economic compensation mode is urgent to effectively protect the quantity and quality of cultivated land. This study focuses on the mode of cultivated land protection fund (CLPF) in Chengdu, which is the earliest mode of the implementation of economic compensation in China in 2008. First, we analyzed the farmers’ satisfaction with the CLPF through a face-to-face interview with 296 farmers in Chengdu. Then, we used the path analysis method to identify the influencing factors of farmers’ satisfaction from the characteristics of farmers and the policy. Results show that the CLPF was generally supported by farmers. Nevertheless, room for improvement still exists. Particularly, farmers’ satisfaction was low in the design of the government’s supervision management of the CLPF. Farmers’ satisfaction with compensation standard, funding use requirement, and the government’s supervision management were remarkably affected by factors, including farmers’ educational level, cultivated land area, total annual agricultural income, farmers’ knowledge of the CLPF, farmers’ recognition of the value of the CLPF, and farmers’ perception of the changes in household economics. Particularly, the direct influence of farmers’ perception of the changes in household economics was the most important. Finally, we proposed the recommendations for constructing a national economic compensation mode for cultivated land protection. Our results have certain guiding significance for promoting the sustainable development of cultivated land protection policies by means of economic incentives in China and other countries.

1. Introduction

The urbanization rate will reach 60% by 2030 and 67.2% by 2050 [1]. Rapid urbanization has led to a reduction in the area of cultivated land, and it will result in a 1.8–2.4% loss of farmland worldwide, and 80% of farmland losses will occur in developing countries in Asia and Africa by 2030 [2]. For example, in the rapid urbanization in South Korea from 1986 to 1996, the expansion of residential land caused a large amount of farmland loss [3]. In India, urbanization has rapidly transformed agricultural lands into non-agricultural ones [4]. Generally, the reduction of cultivated land caused by urbanization has two direct reasons. First, urban boundary expansion encroaches on the farmland around the city. Second, the transfer of rural labor to the city results in the abandonment of farmland.
This phenomenon has aroused people’s high attention to cultivated land protection. Governments or organizations in different countries are actively seeking effective ways to protect cultivated land areas from reduction. Economic compensation is an effective incentive that governments usually use to promote farmers’ cultivated land protection behavior. The Conservation Reserve Program in the United States and the Agri-environmental Schemes (AESs) in the European Union (EU) alleviate the rapid loss of cultivated land by transferring public assets to farmers for economic compensation [5,6,7]. In the 1980s, 20% of the total agricultural area was compensated by the AESs implemented in the EU [8]. The proportion of abandoned land to the total agricultural area was proven not to change after the implementation of AESs, although a significant improvement was observed in grassland management and fertilizer and pesticide use [8]. Moreover, AESs contributed to the promotion of crop diversity because it promoted crop rotation on a small scale [9]. Studying the influence of the implementation of AESs in southern France on the use of herbicides by grape growers indicated that the number of herbicides used by policy participants in 2011 was 38–53% lower than that used by grape growers who did not participate in the policy, and was between 42 and 50% in 2012 [10]. Therefore, the economic compensation of farmers in developed countries aims to protect farmland ecological environment and biodiversity and has achieved good results.
The protection of cultivated land in developing countries aims to maintain the quantity and quality of cultivated lands to meet the growing demand for food [1]. At present, although China only has 9% of the world’s cultivated land, it feeds approximately 20% of the world’s population [11]. Hence, the contradiction between population and cultivated land has always been one of the main problems that plague China’s sustainable development. Since 1978, China’s urbanization level has increased dramatically from 17.9% in 1978 to 56.1% in 2015 [1]. China’s urbanization level has been estimated to reach 60.34, 68.38, and 81.63% by 2020, 2030, and 2050, respectively [12]. During the period of 2001–2013, China’s rapid urbanization consumed about 33,080 km2 of farmland, which had already threatened the country’s food security [13]. Furthermore, with the transfer of rural labor to cities, nearly 85% of rural households in China have at least one family member working in the non-agricultural sector [14]. Between 1993 and 2015, approximately 5.62, 5.70, and 4.00% of the cultivated land was reported to be uncultivated in eastern, central, and western China, respectively [15]. The quantity and quality of cultivated land is closely related to food security; thus, the Chinese government is committed to maintaining these aspects free from loss. Since 2008, many local governments have begun to explore how they can motivate farmers to cultivate land through economic compensation. The cultivated land protection fund (CLPF), implemented in Chengdu in 2008, is the first economic compensation mode in China for the protection of cultivated land areas from decreasing. This mode requires farmers who are financially compensated to ensure that the cultivated lands cannot be abandoned or destroyed; otherwise, the subsidy will be stopped, and economic penalties will be implemented. In 2010, the government in Suzhou implemented economic compensation for farmers in rice-growing areas to encourage them to continue to grow rice. Since then, Guangdong, Zhejiang, and Fujian Provinces have made economic compensation for farmland farmers at the provincial level in 2012 and 2016. Particularly, the CLPF in Chengdu was first implemented in China, and its influence on farmers’ enthusiasm in protecting cultivated lands has been a concern. Some scholars believe that it was a failure for effectively increasing the enthusiasm of farmers to participate in farmland protection [16,17,18,19]. Therefore, although economic compensation for enhancing farmers’ enthusiasm for farming has been applied in many regions in China, the mode is usually experimental and exploratory, and its effect on cultivated land protection has yet to be fully verified.
In summary, the Chinese government must urgently design and apply a national economic compensation mode for farmers to protect the quantity and quality of cultivated lands effectively. Farmers are not only the recipients of economic compensation for cultivated land protection, but also the executors of cultivated land protection. Only when farmers are satisfied with the economic compensation policy for cultivated land protection are farmers willing to protect cultivated lands. Therefore, a scientific method that measures farmers’ satisfaction with the policy should be proposed after the implementation of economic compensation for cultivated land protection. In addition, factors that may affect farmers’ satisfaction must be studied, which will not only help promote the sustainable development of relevant policies, but also play an important role in promoting China’s national economic compensation for cultivated land protection. Meanwhile, it is conducive to provide reference for other countries or regions to effectively mobilize farmers’ enthusiasm for protecting cultivated land. By focusing on the aforementioned problems, the present work aims to: (1) Comprehensively analyze farmers’ satisfaction with the cultivated land protection fund (CLPF), taking Chengdu, China as an example; (2) identify the influencing factors of peasant households’ satisfaction with the CLPF based on the characteristics of farmers and the policy; and (3) promote some suggestions on the construction of the economic compensation mechanism for cultivated land protection.

2. Materials and Methods

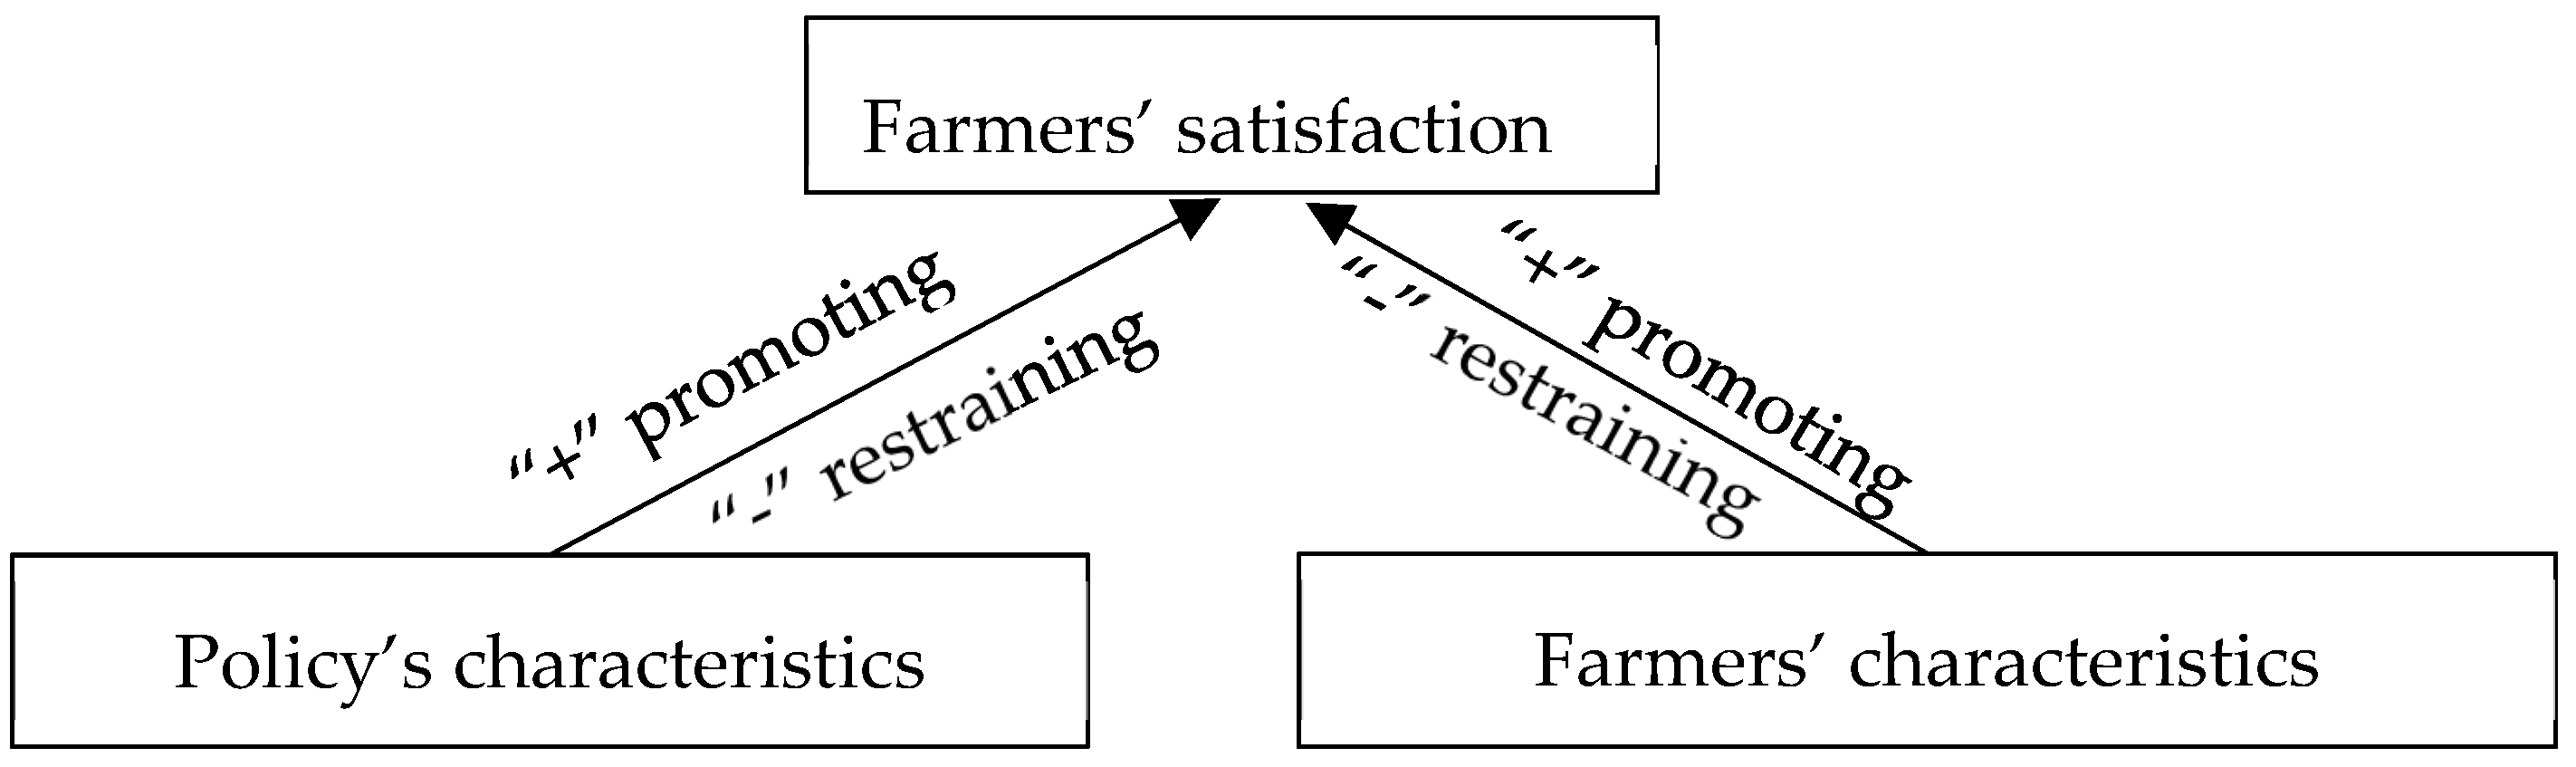
2.1. Theoretical Basis
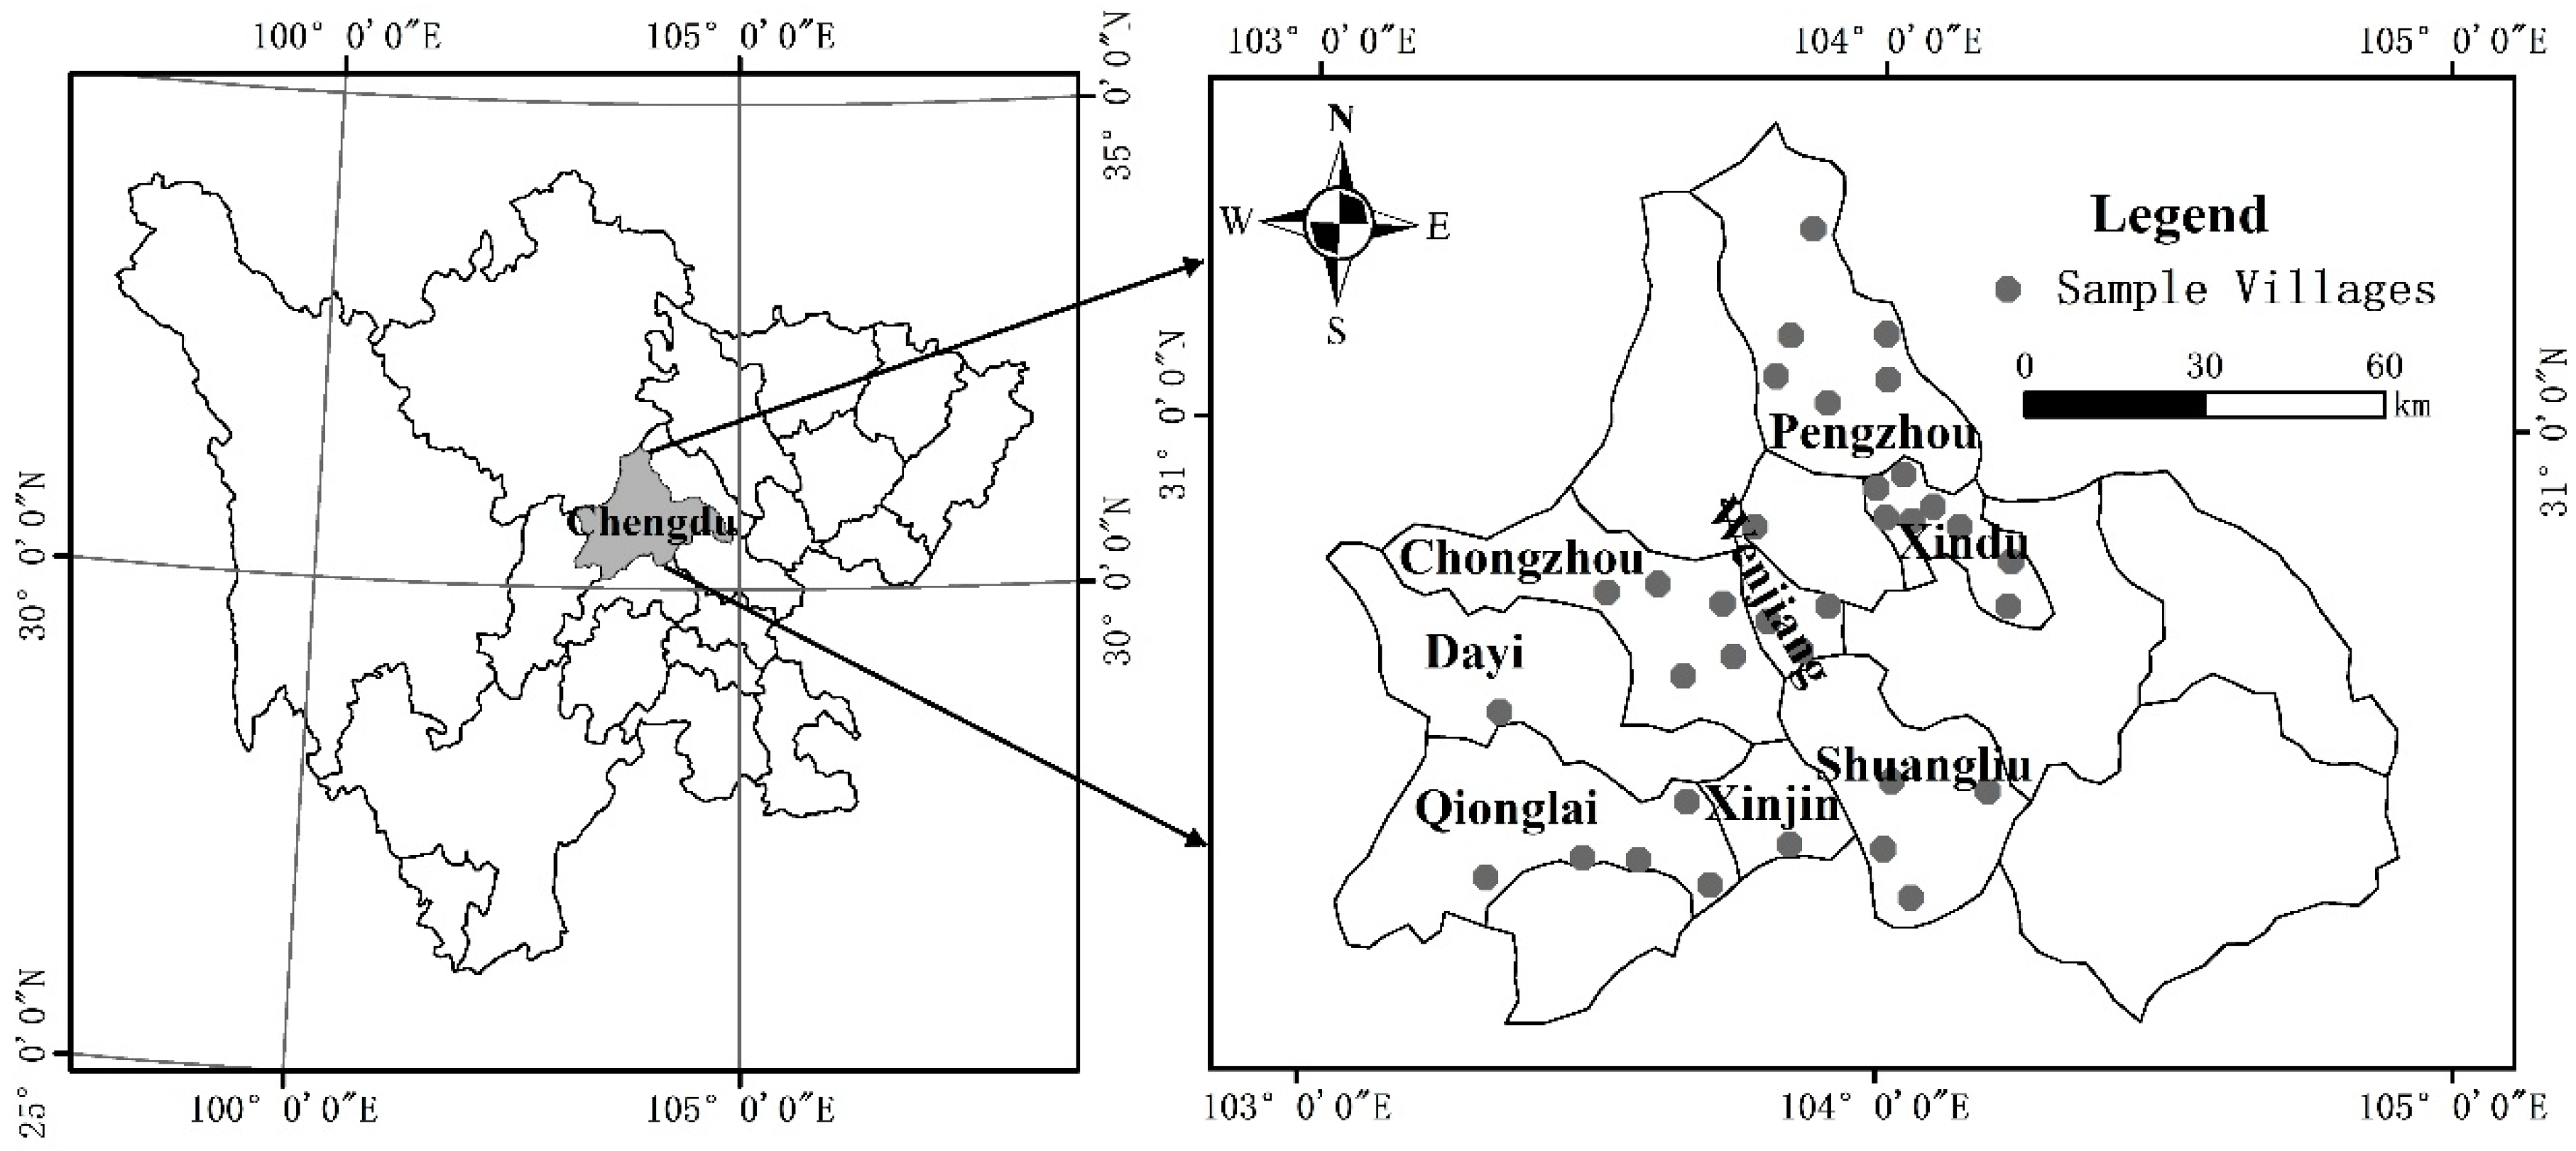
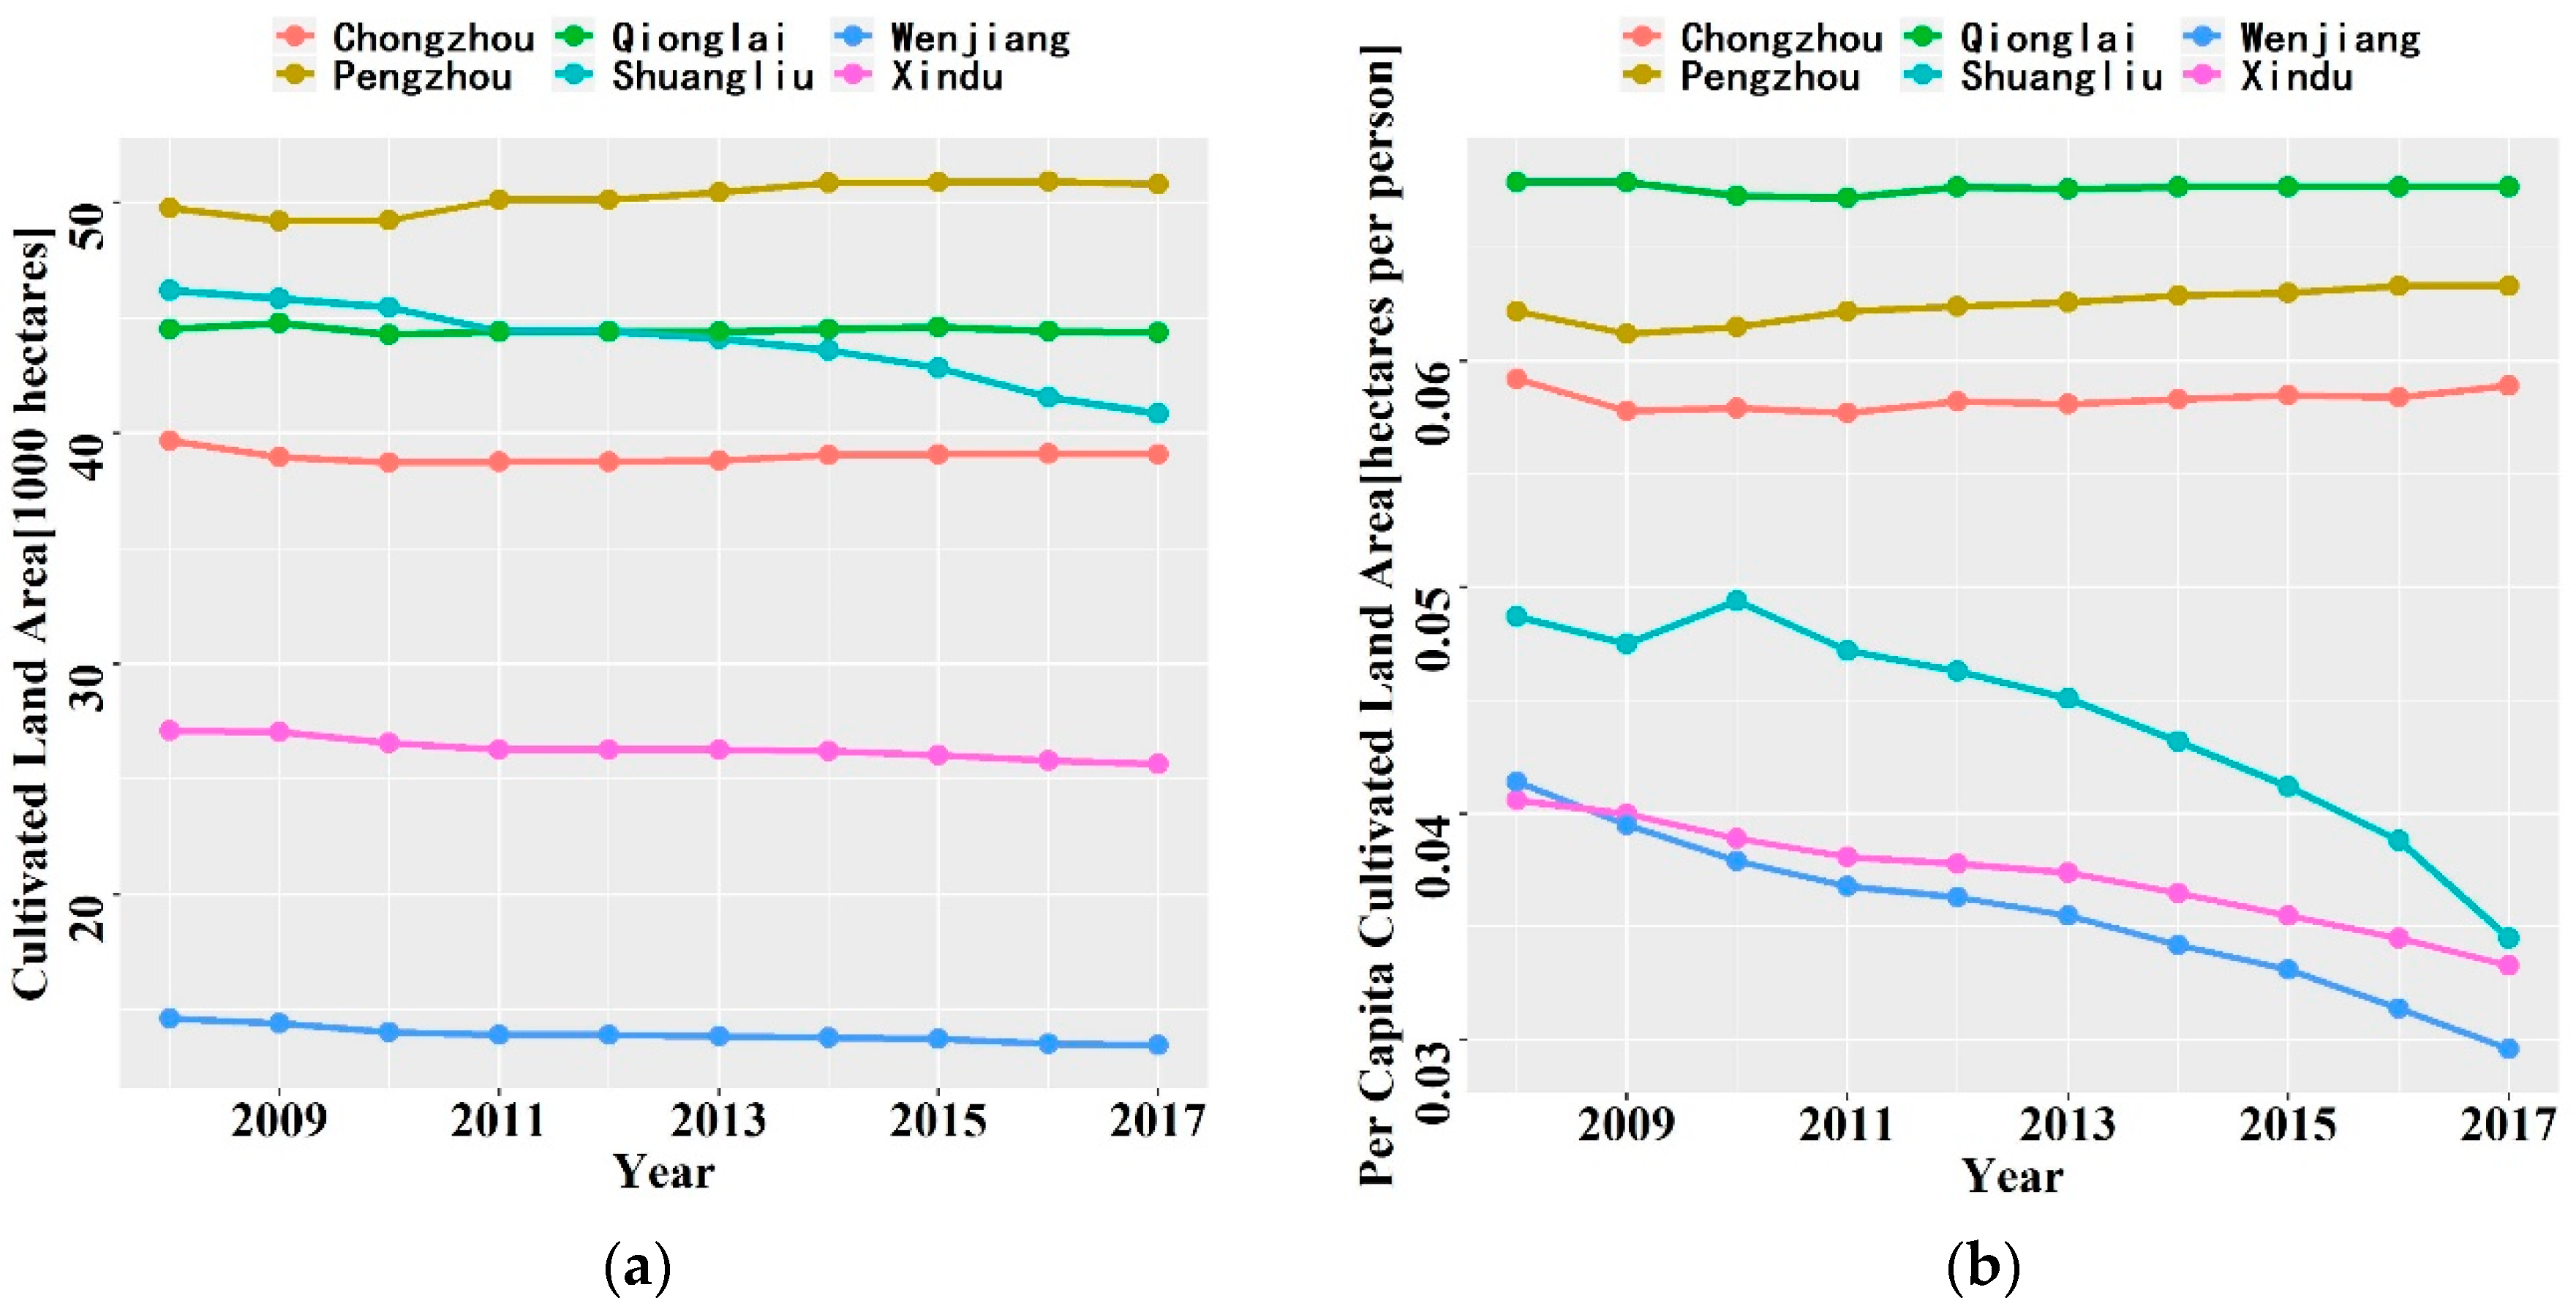
Farmers are the direct beneficiaries of compensation funds. The higher the farmers’ satisfaction with the CLPF, the more active the farmers’ cultivated land protection behavior will be. The elements that constitute the economic compensation mode of cultivated land protection are similar to the components of a machine, such that the defect of any component will affect the operation of the machine to varying degrees. That is, farmers may be dissatisfied with the entire compensation mode if they are not satisfied with one aspect of the mode. Finally, this will also affect farmers’ enthusiasm in protecting cultivated lands. A study found that farmers’ satisfaction with the accounting transparency, funding use requirement, and government’s supervision management transparency of the mode has been low since the implementation of the CLPF, which has led to farmers’ low satisfaction with the entire mode [18]. However, farmers’ satisfaction with the policy is not only affected by the characteristics of the policy, but also by the characteristics of the farmers and their families. For example, young and well-educated farmers can comply with the agreement and improve their cultivated land protection behavior after receiving economic compensation [19,20]. Farmers’ livelihood characteristics, such as farmland size and economic status, have considerable effects on farmers’ satisfaction [21]. As mentioned in Section 2.3, the factors affecting farmers’ satisfaction can be divided into farmers’ characteristics (e.g., gender, age, education level, family economic level, family size, and cultivated land area) and the policy’s characteristics (e.g., compensation objects, compensation standard, compensation methods, compensation basis, funding allocation ratio, funding use requirement, supervision management transparency, and accounting transparency). Figure 1 shows the theoretical framework of the impact mechanism of farmers’ satisfaction on the CLPF.

2.2. Study Areas

Chengdu is located in the central part of Sichuan Province (102°54′E–104°53′E, 30°05′N–31°26′N; Figure 2). It is an important commodity base in China for oil, vegetables, fruits, and Chinese herbal medicines. According to Sichuan Statistical Yearbook in 2018, the total land area of Chengdu is 1.4 × 10⁴ km2, and it has jurisdiction over 11 districts, 5 county-level cities, and 4 counties. At the end of 2017, the total population of household registration was 1.4 × 10⁷, and the rural population was 5.8 × 10⁶. In 2017, the cultivated land area was 5.3 × 10³ km2, and this area also showed a slightly decreasing trend in 2008–2015 (Figure 3). The main crops in Chengdu are rice, wheat, and corn. The sowing area of the annual crop was 7.3 × 10³ km2 and the total output value of the primary industry (i.e., agriculture, forestry, animal husbandry, and fishery) was 85.45 billion RMB in 2017. From 1978 to 2017, the proportion of employees in the primary industry in Chengdu declined from 63.4 to 15.6%.
The CLPF was implemented in Chengdu in 2008 to maintain the quantity and quality of cultivated lands. In this mode, the government must compensate farmers and the village collective who own the lands and bear the responsibility for cultivated land protection. Table 1 shows the basic characteristics of the CLPF. Particularly, the compensation funds comprise four sections as follows: (1) 5% of land-transferring fees of the local government; (2) total funds of the newly added paid land use fee for the construction land which is owned by the local government; (3) 50% of the cultivated land occupation taxes used for non-agricultural usage; and (4) 2% of the initial transfer turnover of the collective construction land use rights. The government subsidizes farmers according to the area of basic farmland (high-quality farmland) and general farmland. Accordingly, farmers with basic farmland can receive a subsidy of 6000 yuan/ha per year, whereas farmers with general cultivated land can receive a subsidy of 4500 yuan/ha per year. However, the CLPF stipulates that 10% of the total amount of compensation funds in the current year should be used for cultivated land transfer guarantee funds and agricultural insurance subsidy, and the remaining 90% should be used for pension insurance subsidy. The former is deducted uniformly by the government when granting subsidies, whereas the latter is issued to specific bank cards of farmers. Particularly, farmers can use the money stored on the specific bank card to purchase pension insurance; however, they do not have the right to withdraw cash unless they meet certain conditions. Farmers receiving compensation must sign a “cultivated land protection contract” with the government and fulfill the relevant provisions in the contract. For instance, after being compensated, farmers are not allowed to build houses, build graves, dig sand, quarry, mine, borrow soil, dig fish ponds, pile up waste, or idle arable lands. The government shall supervise and manage the effect of cultivated land protection through remote sensing monitoring or dynamic inspection. For farmers who violate the regulations of cultivated land protection, the government will take corresponding sanctions, such as deducting subsidized funds and ideological education. In addition, the management department shall uphold the principles of openness, fairness, and transparency and ensure that compensation funds are issued to farmers in full and on time.
In 2008, approximately 234,000 farmers in 11 counties in Chengdu signed the “cultivated land protection contract”, which involved 191.13 km2 of cultivated land. The total amount of compensation funds raised by the government reached 100 million yuan, of which 443,600 yuan was compensated to farmers. By the end of 2014, 12 billion yuan had been distributed to farmers [18]. According to statistics, 1.83 million farmers in 2661 villages in Chengdu benefited from the CLPF, involving approximately 5100 km2 of farmland [18,22].
Given the diversity of socioeconomic development levels and geographical environment, we selected six counties (or districts) to conduct a questionnaire survey on farmers (Figure 2 and Table 2). Amongst these counties, Pengzhou has the largest land area (1421 km2), whereas Wenjiang has the smallest (276 km2). Wenjiang, Xindu, and Shuangliu had higher per capita disposable income of rural residents (3847, 3467, and 3747 USD, respectively) than that of Qionglai, Chongzhou, and Pengzhou (2815, 2956, and 2957 USD, respectively) in 2017. In comparison with the Chengdu average (3070 USD), the rural per capita disposable income was higher in the former three regions and was lower in the latter three. Therefore, the sample regions were divided into two types to reflect the differences of economic development: One is the sample regions with higher economic level (i.e., located in Wenjiang, Xindu, and Shuangliu), and the other is the sample regions with lower economic level (i.e., located in Qionglai, Chongzhou, and Pengzhou). A particularly distinct difference is observed among the six counties in terms of topographic features.
Figure 4 shows the changes in the total area of cultivated land and per capita cultivated land in the six regions from 2008 to 2017. The total area of cultivated land (left of Figure 4) was evidently higher in Pengzhou than that in the other five areas, whereas it was far lower in Wenjiang than that in the other five areas. In 2008–2011, a slow decline in the area of cultivated land was evident in the six regions. However, after 2011, the change of cultivated land area increased in Pengzhou but decreased in Shuangliu (a total of a 53.46 km2 decrease in 2008–2017). In the other four regions, the change of cultivated land area had a relatively flat trend. The per capita cultivated land area (right of Figure 4) was significantly higher in Qionglai than the other five regions, whereas it was significantly lower in Wenjiang and Xindu than that in the other four areas. In 2008–2017, the per capita cultivated land area of Qionglai, Pengzhou, and Chongzhou was higher than that of Shuangliu, Xindu, and Wenjiang. This variable decreased in Pengzhou and Chongzhou before 2009 but increased after 2009. The per capita cultivated land area showed a significant decrease trend in 2008–2017 in Xindu and Wenjiang. Although it was significantly higher in Shuangliu in 2010, the overall reduction of the per capita cultivated land area in this district was the most severe in 2008–2017. Notably, the per capita cultivated land area was significantly lower in the six regions compared with the national average (0.097 ha in 2017).

2.3. Data Sources

The investigation was conducted on 17–22 May 2016. We adopted a random sampling method to determine the sample distribution of the survey. According to the Scheaffer sampling formula [23] (sampling error set to 0.06), the appropriate sample size for the survey area was approximately 278 (Table 3). We aimed for at least 10 farmers to be surveyed in each village; however, some villages in Chengdu are small and scattered and are thus not suitable for this study. Therefore, we selected the nearest village to supplement the sample size only when we interviewed fewer than 10 farmers. We selected Wenjiang, Shuangliu, Xindu, Qionglai, Chongzhou, and Pengzhou as the main study areas, and we investigated a total of 33 villages. According to the distance of the village distribution, the final sample villages also included Guanlin Village of Xinjin County and Tongxin Village of Dayi County. Each of our questionnaires was conducted for approximately 30 min in the form of face-to-face interviews. All respondents were willing to answer all our questions, and they were given gifts. Finally, we had a total of 135 samples with higher rural per capita disposable income (i.e., located in Wenjiang, Xindu, Shuangliu, and Xinjin) and 161 samples with lower rural per capita disposable income (i.e., located in Qionglai, Chongzhou, Pengzhou, and Dayi). The proportion of samples with higher per capita disposable income is 45.6%, which is slightly lower than that of lower per capita disposable income (54.4%). Therefore, the samples with different disposable income per capita are almost evenly distributed.
On the basis of the previous literature, the questionnaire contained three aspects of farmers’ satisfaction, awareness, and farmer characteristics (Table 4). In these aspects, individual and household characteristics (e.g., gender, age, education level, cultivated land area, family size, agricultural income level, and income source) were confirmed to have considerable influences on the subjective evaluation of farmers [17,24,25,26,27,28,29,30,31,32,33,34,35,36]. Farmers’ knowledge of the compensation policy reflected their subjective perception of the policy, as well as the perception of whether the policy was meaningful [16,28]. Furthermore, the previous literature was studied from the perspective of farmers’ satisfaction with the compensation standard, compensation method, compensation basis, funding allocation ratio, funding use requirement, supervision management transparency, and accounting transparency of the CLPF [29,30,37]. The main contents of the questionnaire are shown in Table 4.

2.4. Methods

This study calculated the standard deviation and percentage of the variables in SPSS 22 to compare the sample characteristics of the 296 questionnaires. Thereafter, Pearson correlation analysis was conducted to study the interrelationship between farmers’ satisfaction with the CLPF and farmers’ characteristics. Our aim was to study the significant impact of the related factors on farmers’ satisfaction and analyze whether a significant interdependence exists between the related factors. To further quantify the strength of the interaction between the variables, path analysis was set aside for measuring the direct and indirect effects [11,38,39] by using DPS 7.05 software. The preceding analysis, which had enabled us to understand the impact of the relevant factors on the CLPF, was conducive in laying the foundation for further policy recommendations.

3. Results

3.1. Descriptive Analysis of Farmers’ Characteristics

Table 5 shows that the samples of males and females in the surveyed households were relatively uniform (0.497 ± 0.501). The age structure of the participants was mainly middle-aged (45 to 60 years old) and old (over 60 years old) (3.061 ± 0.907). The average education level was 2.389 ± 0.816, which corresponded to primary school and below. The majority of the participants owned an average of 0.133 to 0.2 ha (3.145 ± 1.233) of the cultivated land areas. Moreover, the flowing out of cultivated land areas was 0.2 ha (1.861 ± 1.063). The average total annual agricultural income was 10,000 RMB (1.196 ± 0.398).

3.2. Descriptive Analysis of the Farmers’ Cognitive Characteristics of the CLPF

A total of 47% of farmers interviewed had limited knowledge of the CLPF, whereas 53% of them had substantial knowledge (left of Figure 5). Therefore, the propaganda of the CLPF should be strengthened in the future to enable more farmers to fully understand this policy. A total of 95.9% of the farmers interviewed believed that implementing the CLPF was meaningful, which was a policy that benefited the country and the people (left of Figure 5). Meanwhile, 76.7% of the farmers considered that their family economic level had increased after the implementation of the CLPF, but this change was relatively minimal.
Overall, nearly 80% of the farmers interviewed were satisfied with the CLPF (right of Figure 5). For the policy’s characteristics, the farmers had the highest satisfaction (the proportions of “very satisfied” and “satisfactory” were 13.9% and 61.8%, respectively) with the compensation standard of the CLPF (right of Figure 5). The sample distribution was similar to the satisfaction of farmers with the funding use requirement of the CLPF. The percentages of the respondents who were “very satisfied” and “satisfied” with government’s supervision management were 11.5% and 34.8%, respectively (right of Figure 5). Thus, the satisfaction of this indicator was the lowest compared with the satisfaction of other indicators. This result also implies that the government should further strengthen its work in supervision management.

3.3. Correlation Analysis
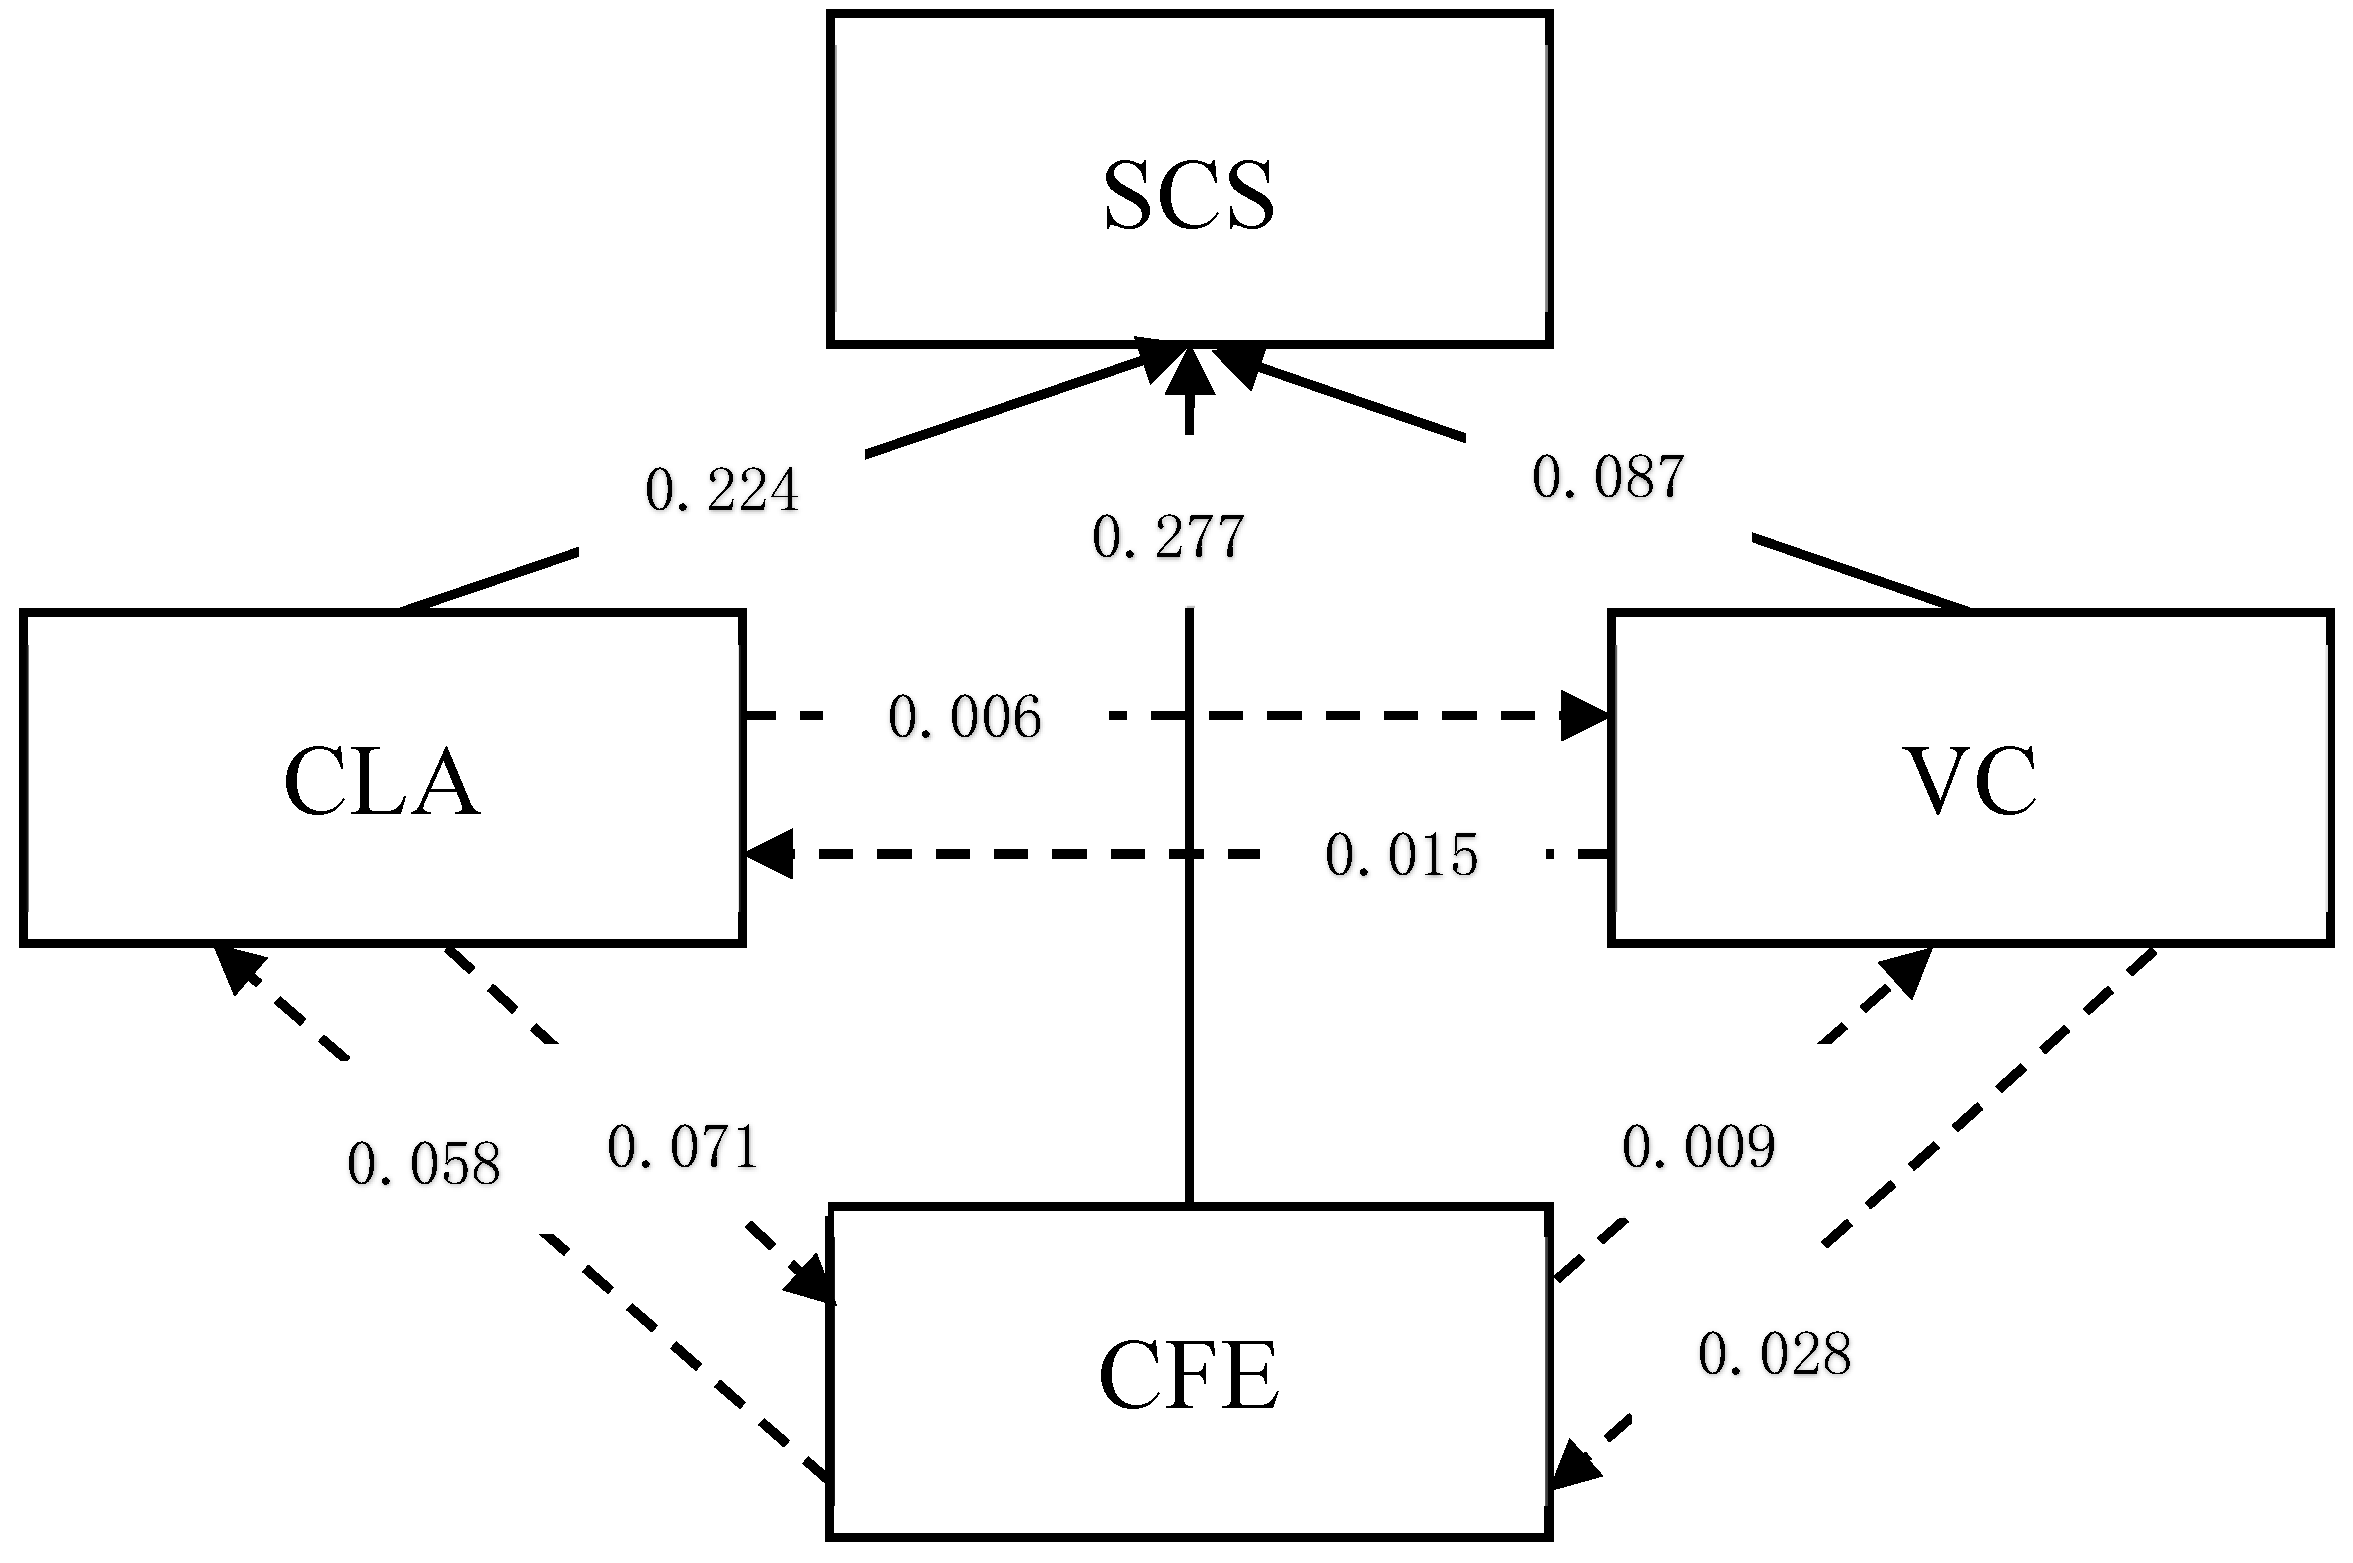
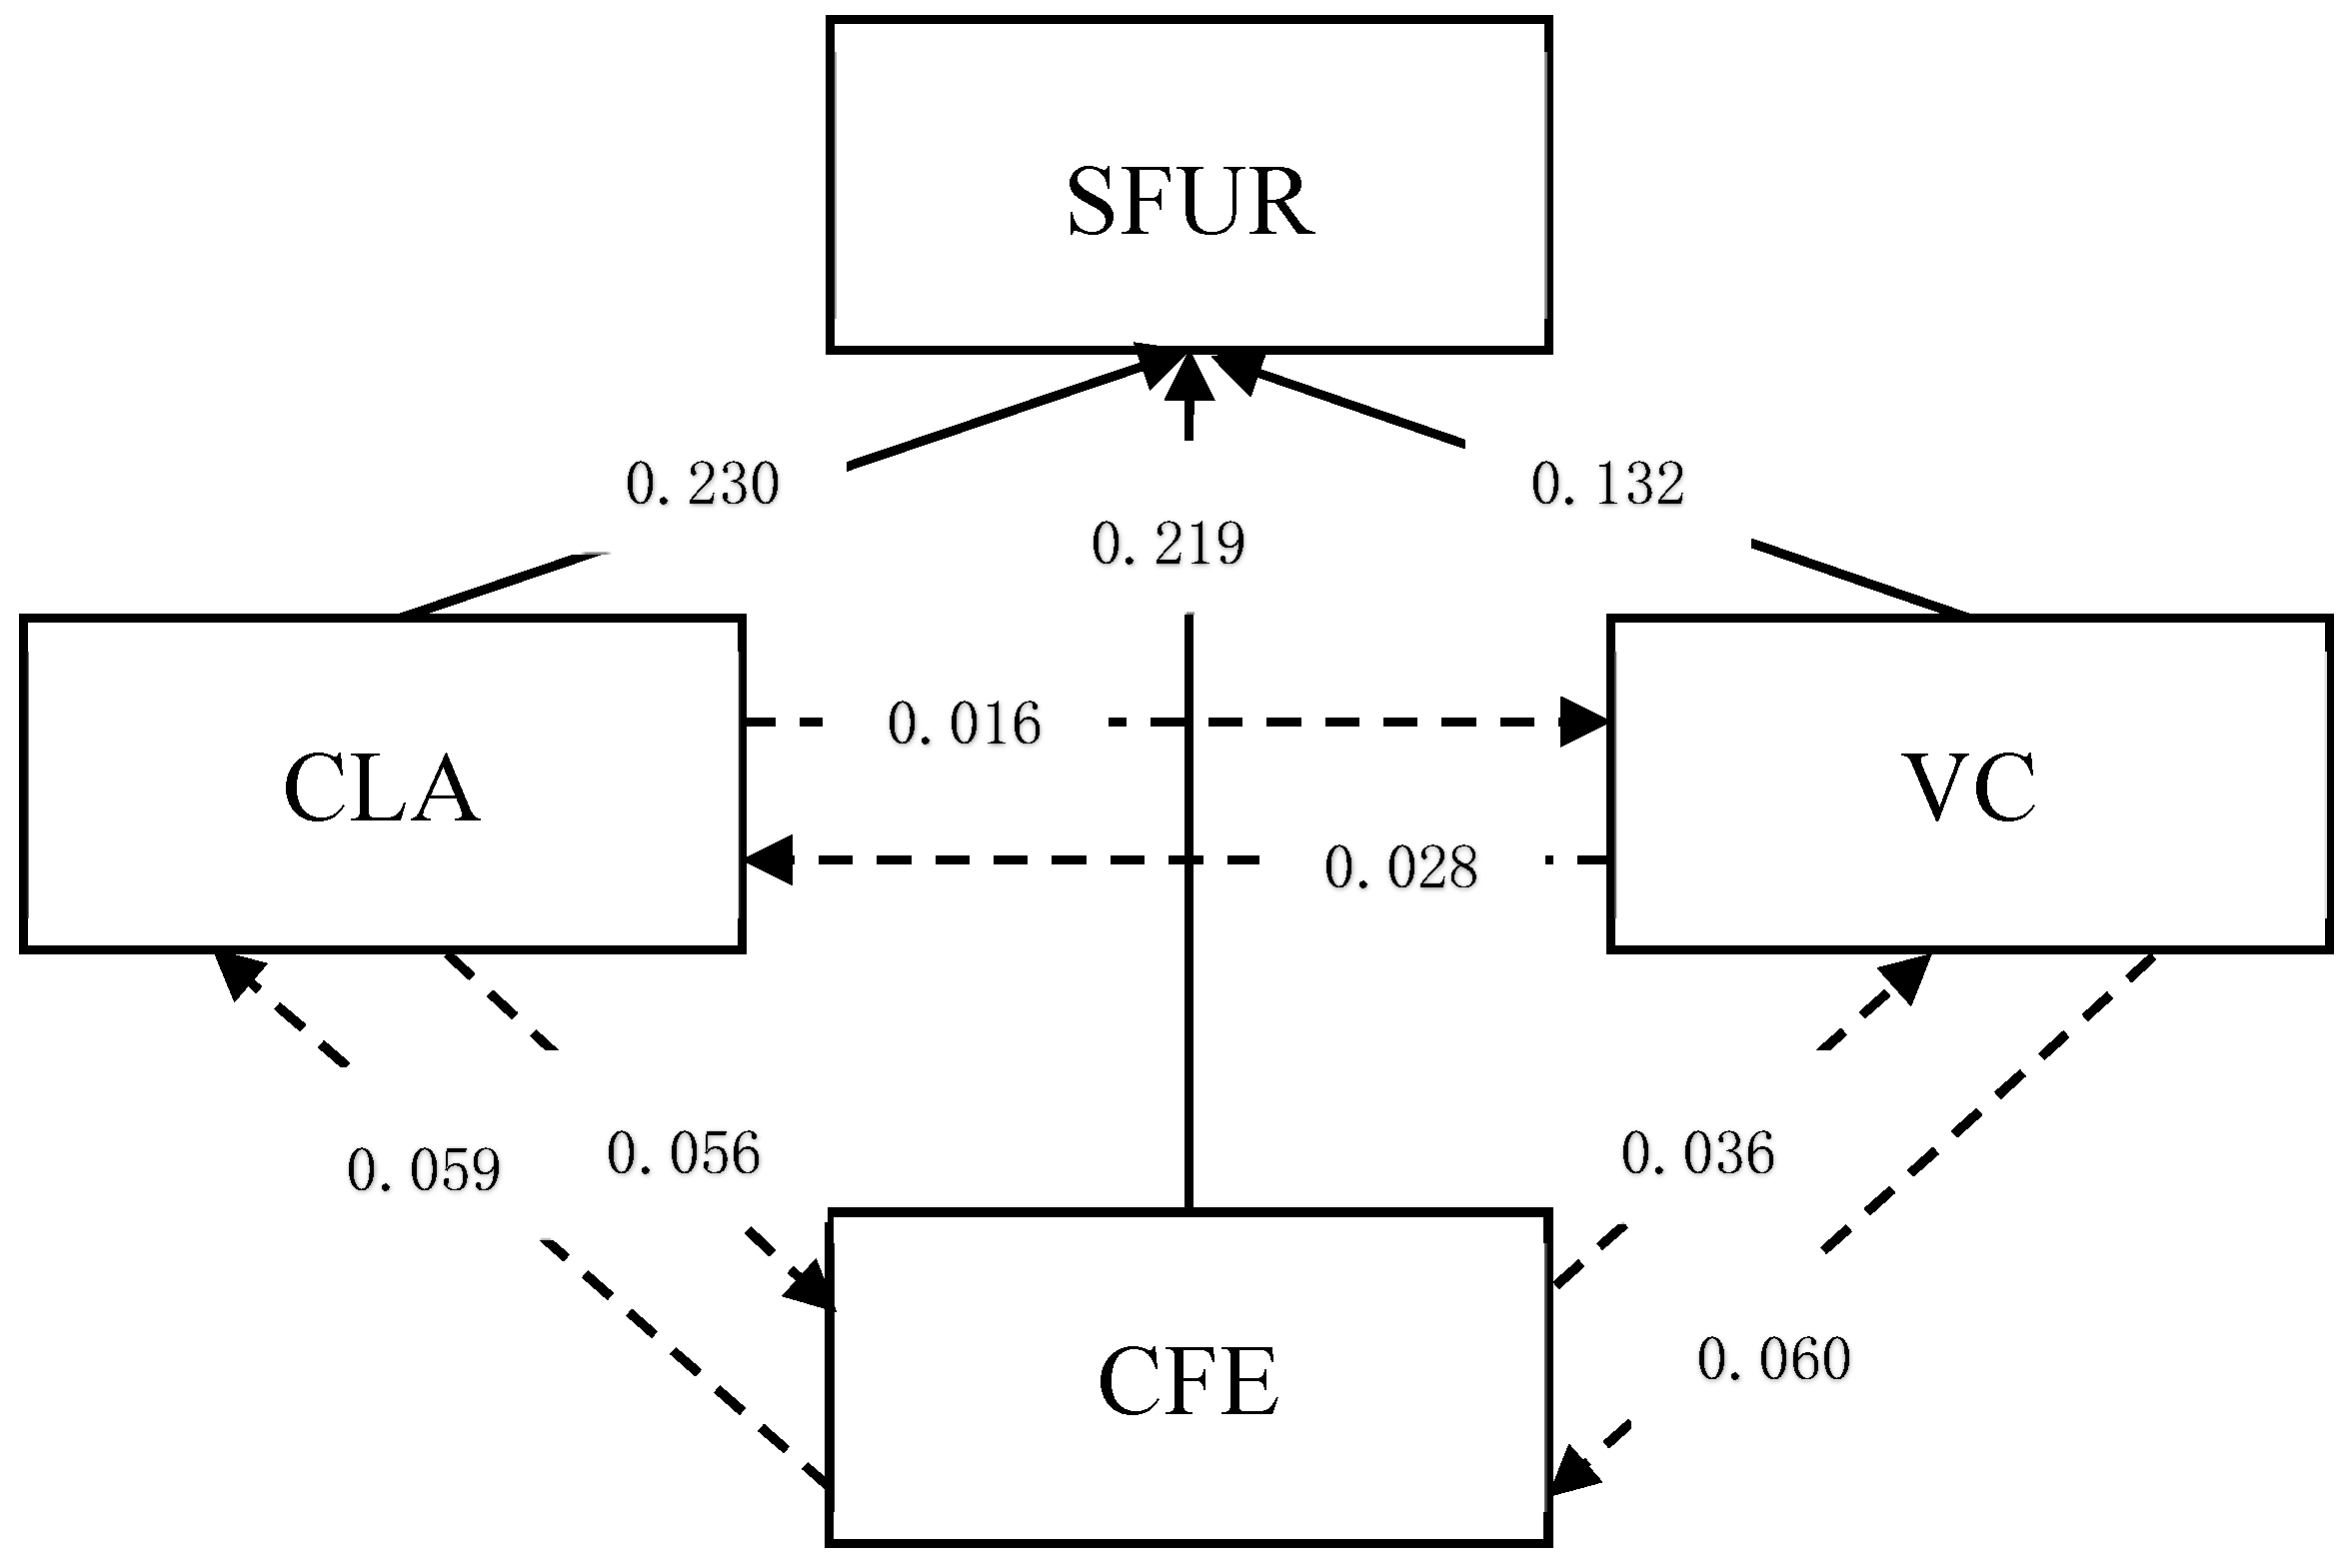
The correlation between the different factors to farmers’ satisfaction was studied using Pearson correlation analysis. The respondent and policy characteristics were included in these factors. On farmers’ satisfaction with the compensation standard of the CLPF (Table 6), education and total annual agriculture income had significant positive impact at the 0.05 level, and the cultivated land area had a significant positive impact at the 0.01 level. Farmers’ knowledge of the CLPF had a significant positive impact at the 0.01 level, and so was their perception of changes in the family economic level. Moreover, farmers’ cognition of the CLPF value had a significant positive impact at the 0.05 level.
On farmers’ satisfaction with the funding use requirement of the CLPF (Table 6), the factors of cultivated land area, farmers’ knowledge of the CLPF, and farmers’ perception of changes in the family economic level had significant positive effects at the 0.01 level. Other factors, such as the total annual agriculture income and farmers’ cognition of the CLPF value, had a significant positive impact at the 0.05 level.
On farmers’ satisfaction with the supervision and management transparency of the CLPF (Table 6), education, cultivated land area, farmers’ knowledge of the CLPF, and farmers’ perceptions of changes in the family economic level had significant positive effects at the 0.01 level. Lastly, the total annual agricultural income had a significant positive impact at the 0.05 level.

3.4. Path Analysis

Path analysis is useful for analyzing the key impact factors in multi-factor systems by directly comparing the direct effects of different factors on the target, which is further deepening of the correlation analysis. All factors should have significant correlation with the farmers’ satisfaction in the path analysis based on the previous relevant analysis. However, to improve the overall significance of the regression equation, the factors that entered the equation were the result selected by the default methods of the software system. That is, not all the significant variables obtained through correlation analysis may eventually enter the equation.
On farmers’ satisfaction with the compensation standard (SCS) of the CLPF (Figure 6), the direct effects of CFE and CLA on SCS were 0.277 and 0.224, respectively. These two values were higher than the direct path coefficient (DPC) of VC (DPC = 0.087). Conversely, the indirect effect between the factors was relatively weak through the indirect path coefficients. This result proved that farmers’ satisfaction with the compensation standard of the CLPF was directly affected by each factor.
On farmers’ satisfaction with the funding use requirement (SFUR) of the CLPF (Figure 7), the direct effect of CLA was the largest (DPC = 0.230), followed by the direct effect of CFE (DPC = 0.219), and the direct effect of VC was relatively small (DPC = 0.132).
On farmers’ satisfaction with the supervision and management transparency (SSMT) of the CLPF (Figure 8), the direct effect of CFE was the largest (DPC = 0.368) and the direct effects of TAAI and EL were relatively small (DPCs are 0.113 and 0.108, respectively).

4. Discussion

In terms of the overall satisfaction, nearly 80% of the surveyed households from 296 samples were satisfied (contains the two levels of “satisfied” and “strongly satisfied”) with the implementation of the CLPF. Among them, some farmers believed that farming was their job and they were willing to plant land, even if the country did not compensate them. Meanwhile, other farmers believed that the CLPF was considered “additional wealth”, which was a welfare subsidy of the government for farmers. Evidently, these two ideas were not the real reasons for the implementation of the CLPF, but they were still conducive in the increased enthusiasm of the farmers. However, only 18.2% of the farmers surveyed were generally “very satisfied” with the CLPF. This result indicates that the policy failed to fully meet the psychological needs of farmers and that optimization can still be pursued.
Farmers can obtain money free of charge but only if they ensure that the cultivated land is not abandoned or destroyed. Therefore, farmers were satisfied with the current compensation standards. Nevertheless, accompanied by the improvement of consumption level, the money had little effect on improving the economic level of farmer households with the current compensation standards. In particular, the economic incentive effect of the CLPF in underdeveloped areas was significantly lower than that in developed regions [16]. Therefore, we propose the following two suggestions to improve the CLPF: (1) We argue that the current compensation of the CLPF with reference to the basic farmland and general cultivated land is relatively simple. Thus, the compensation standard is unfair to farmers who have the same quality of cultivated land but are paid different compensation funds. We agree that the cultivated land would be classified into superior (1st to 4th), advanced (5th to 8th), medium (9th to12th), and low (13th to 15th) grades on the basis of the national standards for cultivated land quality (the quality of cultivated land in China is assessed as 15 grades, 1st grade cultivated land has the best quality and 15th grade is the worst). Thereafter, differentiated compensation would be implemented in accordance with the preceding criteria. (2) In combination with the level of regional economic development, compensated regions should be divided into high-, medium-, and low-developing areas to divide the high-, medium-, and low-compensation areas for cultivated land compensation.
Only a few farmers were strongly satisfied with the funding use requirement of the CLPF. The main reason was that the diversification of households’ livelihoods had led to differences in farmers’ demand, and not just for the pension insurance. We reiterate that the CLPF should take diversified measures to realize the diversification of capital use requirement to satisfy the differentiated demands of farmers. Examples of these measures are providing cash subsidy to impoverished households, implementing in-kind subsidies (e.g., crop seeds, pesticides, fertilizers) for farmers who depend on cultivated land for their livelihood, or offering technical subsidies (providing consultation and training on agricultural production, management, services, etc.) [27,40] for large-scale grain-production households or agricultural cooperatives. Moreover, a farmer’s evening school and other agricultural planting training organizations may also be established, in combination with local conditions, to provide specialized training for farmers to develop new peasants.
Farmers’ participation in the protection of cultivated land will only have a positive impact when they trust the government [41]. Such a trust can also effectively reduce the cost of the supervision management transparency of the government [42,43]. However, our research shows very low farmers’ satisfaction with the government’s supervision management. We found that some farmers received more compensation from the government even though they had poor quality cultivated land. Moreover, some village cadres were dishonest in counting farmers’ information on cultivated land, which had caused losses to the interests of farmers. Consequently, farmers had already lost trust in the government, which had affected their satisfaction with the government’ supervision management. Our results are consistent with that of Cai and Yu [18]. In our study, a five-tiered supervision system was proposed with “government supervision–village collective supervision–villager supervision–society supervision–technology supervision” (Figure 9). In this system, the government can encourage the responsible persons to fulfill their responsibility of effectively protecting cultivated land by establishing incentive and accountability mechanisms. Given that village cadres are the primary management and accepting subjects of the CLPF, they can effectively track the implementation of this program. Therefore, the village collective supervision system mainly relies on the village cadres to establish tracking and feedback mechanisms to relay the relevant issues to the higher government in time. Meanwhile, the peasant households are the main recipients of the CLPF and concrete implementers of cultivated land protection. Thus, the government can establish an effective reporting mechanism to facilitate peasant households to report and expose violations of relevant provisions of the CLPF in a timely manner. In addition, media and social organizations are the main body of social supervision system, which can ensure the sunshine operation of the CLPF through public opinion supervision. With the development of remote sensing and GIS technology, a “one map” management database of the CLPF should be established to unify the farmers’ household situation (e.g., population information, economic level, cultivated land management status, rights, and responsibilities) and the characteristics of the CLPF. Doing so will realize the dynamic inspection and information change of cultivated land protection.
A significant correlation exists between farmers’ satisfaction with compensation standard and farmers’ education level, as well as the satisfaction with the supervision management of the government. That is, the higher the education level of the farmers, the higher their satisfaction in these two aspects. We infer that the higher the level of education, the more profound the farmers’ perceptions of the policy. This result is also consistent with that of Zhu et al. [19]. However, it is generally low of the current education level of rural labor in China, with an average education period of approximately 8.37 years [44]. We assert the benefits of building a new generation of literate peasants in China to enable farmers to realize the importance of ideologically protecting cultivated land. The government could improve the peasants’ cultural level through farmers’ night schools and agricultural science and technology training, while fully promoting compulsory education.
Previous studies have confirmed that the more cultivated land farmers own, the higher their satisfaction with the CLPF. At present, the “three rights separation system”, which has been promoted in the rural areas of China, is a new land reform [45]. Under this system, farmers can transfer their cultivated land to others while they continue receiving compensation. Thus, the scale of the farmland operated by a peasant increases. Therefore, we recommend that China should implement differentiated compensation standards for different types of farmers to balance their interests. We conclude that all compensation funds should be owed to the peasants, only if they do not transfer their farmlands to others. If a farmer rents large cultivated land from other farmers, then the government should increase the funds for the farmer who is the actual user, without reducing the funds for farmers who originally owned the land. If the scale of the land transferred between the two farmers is small, then the ownership of the compensation funds should be negotiated by the two farmers.
Among the three aspects of policy characteristics studied in this research, farmers’ satisfaction with the government’s supervision management was most affected by the total annual agriculture income based on the path analysis. That is, the higher the total annual income of agriculture, the more satisfied farmers are with the government’s supervision management work. This result may be caused by the fact that the service system provided by the government satisfies the farmers’ demand for large-scale farmland management and is conducive to raising agricultural income. However, household income from agriculture is lower than that from other sources (i.e., working part-time and doing business) in rural China. Our results also indicate that 80.41% of the farmer households interviewed had a generally low total annual agricultural income, which was below 10,000 yuan. Therefore, we hold that raising agricultural income is conducive to raising farmers’ satisfaction with the three aspects of policy characteristics of the CLPF.
Farmers’ knowledge of the policy significantly affected their satisfaction with the CLPF. Hence, strengthening farmers’ knowledge of the CLPF is conducive to promoting their interpretation of the policy, which is instrumental in enhancing farmers’ enthusiasm for participating in farmland protection [29]. In this view, suggestions for strengthening farmers’ knowledge of the CLPF have been proposed in three aspects: (1) Focus part of the financial effort toward publicity courses of the CLPF to increase farmers’ comprehensive understanding of this policy [46]. This educational effort should aim to deepen farmers’ understanding of the purpose, meaning, and program of the CLPF, as well as their obligations and responsibilities. (2) Encourage farmers to participate in local planning and land management. Effective engagement between farmers and the government can facilitate the development of interest, responsibility, and a social norm, thereby enhancing their deep understanding of policies [46,47]. (3) Strengthen local tradition and culture aiming to make policies considerably acceptable to farmers [46]. The socio-cultural identity of farmers has an important influence on their values and policy awareness. Thus, the manager should exert immense effort to eliminate the potential long-standing antipathy existing among farmers toward the CLPF [48].
Although the majority of farmers no longer rely solely on agricultural income to maintain their lives, strengthening their awareness of the value of cultivated land conservation is conducive to their long-term consideration for the sustainable development of future generations [49]. Our research also confirms this point. That is, farmers’ awareness of the value of the CLPF significantly affected their satisfaction with the policy.
Compared with non-agricultural income, the economic benefits of farmland are relatively low, which has led low-income farmers to be unwilling to participate in farmland protection [50]. Among the influencing factors selected in this study, the farmers’ perception of changes in the family’s economy was the only factor that had a strong positive and direct impact on the satisfaction of farmers. Thus, the economic effect of the CLPF was the decisive factor in improving the farmers’ satisfaction.

5. Conclusions

A national economic compensation mechanism for cultivated land protection in China should be established by evaluating farmers’ satisfaction with the policies that have been implemented in pilot areas. Moreover, such a mechanism also has certain guiding significance for countries and regions that encourage farmers to protect cultivated land through economic compensation. This study presents a concise and systematic description of the CLPF, which is the earliest mode in China, and evaluates farmers’ satisfaction with this policy. Thereafter, we propose some suggestions to ensure the sustainability of the CLPF. The main conclusions and recommendations are as follows: (1) Farmers are generally satisfied with the CLPF, but this policy can still be optimized, particularly in the government’s supervision management; (2) among the significant factors of education level, cultivated land area, total annual agriculture income, farmers’ knowledge of the CLPF, farmers’ value cognition of the CLPF, and the changes in the family’s economy that significantly affect their satisfaction, the impact of the last factor is the most important; (3) compulsory education, peasant night school, and agricultural science and technology training should be strengthened to motivate the farmers to protect cultivated land from passive incentive to active, spontaneous behavior; (4) the diversity of livelihood should be considered to meet the differentiated needs of farmers when formulating the national economic compensation mechanism for cultivated land protection; and lastly (5) the five-tiered supervision system of “government supervision–village collective supervision–villager supervision–society supervision–technology supervision” should be established to enhance the trust between farmers and the government.

Author Contributions

D.X. designed the questionnaire, analyzed the data, and drafted the paper; H.N. provided the important suggestion for the methodology and drafted the paper; L.F. and S.Z. reviewed the literature of the subject; H.Y. contributed to the visualization.

Funding

This work was supported by the National Social Science Foundation of China (Grant No. 18BJY126).

Acknowledgments

The authors would like to thank the farmers for accepting our interviews and the authors of the references cited in this article.

Conflicts of Interest

The authors declare no conflicts of interest.

References

  1. Wu, Y.Z.; Shan, L.P.; Guo, Z.; Peng, Y. Cultivated land protection policies in China facing 2030: Dynamic balance system versus basic farmland zoning. Habitat Int. 2017, 69, 126–138. [Google Scholar] [CrossRef]
  2. D’Amour, C.B.; Reitsma, F.; Baiocchi, G.; Barthel, S.; Güneralp, B.; Erb, K.H.; Haberl, H.; Creutzig, F.; Seto, K.C. Future urban land expansion and implications for global croplands. Proc. Natl. Acad. Sci. USA 2017, 114, 8939–8944. [Google Scholar] [CrossRef] [PubMed]
  3. Kim, D.S.; Mizuno, K.; Kobayashi, S. Analysis of urbanization characteristics causing farmland loss in a rapid growth area using GIS and RS. Paddy Water Environ. 2003, 1, 189–199. [Google Scholar] [CrossRef]
  4. Fazal, S. Urban expansion and loss of agricultural land-a GIS based study of Saharanpur City, India. Environ. Urban. 2000, 12, 133–149. [Google Scholar] [CrossRef]
  5. Baylis, K.; Peplow, S.; Rausser, G.; Simon, L. Agri-environmental policies in the EU and United States: A comparison. Ecol. Econ. 2008, 65, 753–764. [Google Scholar] [CrossRef]
  6. Tanner, E.P.; Fuhlendorf, S.D. Impact of an agri-environmental scheme on landscape patterns. Ecol. Indic. 2018, 85, 956–965. [Google Scholar] [CrossRef]
  7. Burton, R.J.F.; Schwarz, G. Result-oriented agri-environmental schemes in Europe and their potential for promoting behavioural change. Land Use Policy 2013, 30, 628–641. [Google Scholar] [CrossRef]
  8. Primdahl, J.; Peco, B.; Schramek, J.; Andersen, E.; Onate, J.J. Environmental effects of agri-environmental schemes in Western Europe. J. Environ. Manag. 2003, 67, 129–138. [Google Scholar] [CrossRef]
  9. Ferret, S.C.; Subervie, J. How much green for the buck? Estimating additional and windfall effects of French agro-environmental schemes by DID-matching. J. Environ. Econ. Manag. 2013, 65, 12–27. [Google Scholar] [CrossRef] [Green Version]
  10. Kuhfuss, L.; Subervie, J. Do European agri-environment measures help reduce herbicide use? Evidence from viticulture in France. Ecol. Econ. 2018, 149, 202–211. [Google Scholar] [CrossRef]
  11. Tong, Y.; Niu, H.P.; Fan, L.X. Willingness of farmers to transform vacant rural residential land into cultivated land in a major grain-producing area of central China. Sustainability 2016, 8, 1192. [Google Scholar] [CrossRef]
  12. Gao, C.L.; Wei, H.K. Prediction study on the urbanization trends of China. Mod. Econ. Sci. 2013, 35, 85–90. (In Chinese) [Google Scholar]
  13. Shi, K.F.; Chen, Y.; Yu, B.L.; Xu, T.B.; Li, L.Y.; Huang, C.; Liu, R.; Chen, Z.Q.; Wu, J.P. Urban expansion and agricultural land loss in China: A multiscale perspective. Sustainability 2016, 8, 790. [Google Scholar] [CrossRef]
  14. Liu, G.S.; Wang, H.M.; Cheng, Y.X.; Zheng, B.; Lu, Z.L. The impact of rural out-migration on arable land use intensity: Evidence from mountain areas in Guangdong, China. Land Use Policy 2016, 59, 569–579. [Google Scholar] [CrossRef]
  15. Yan, J.Z.; Yang, Z.Y.; Li, Z.H.; Xin, L.J.; Sun, L.X. Drivers of cropland abandonment in mountainous areas: A household decision model on farming scale in Southwest China. Land Use Policy 2016, 57, 459–469. [Google Scholar] [CrossRef] [Green Version]
  16. Zhu, L.L.; Cai, Y.Y. Heterogeneous implementation effects of the economic compensation policy for farmland conservation: Based on difference-in-difference dynamic estimates. J. Nat. Resour. 2017, 32, 727–741. (In Chinese) [Google Scholar]
  17. Yu, L.L.; Cai, Y.Y. Assessing the effect of economic compensation for farmland protection policy: An empirical research and comparison of the eastern and western regions of China. China Land Sci. 2014, 28, 16–23. (In Chinese) [Google Scholar]
  18. Cai, Y.Y.; Yu, L.L. Rural household participation in and satisfaction with compensation programs targeting farmland preservation in China. J. Clean. Prod. 2018, 205, 1148–1161. [Google Scholar] [CrossRef]
  19. Zhu, L.L.; Zhang, C.M.; Cai, Y.Y. Varieties of agri-environmental schemes in China: A quantitative assessment. Land Use Policy 2018, 71, 505–517. [Google Scholar] [CrossRef]
  20. Vanslembrouck, I.; Huylenbroeck, G.V.; Verbeke, W. Determinants of the willingness of Belgian farmers to participate in agri-environmental measures. J. Agric. Econ. 2002, 53, 489–511. [Google Scholar] [CrossRef]
  21. Konyar, K.; Osborn, C.T. A national-level economic analysis of conservation reserve program participation: A discrete choice approach. J. Agric. Econ. Res. 1990, 42, 5–12. [Google Scholar]
  22. Chen, J.W.; Gao, W.; Dai, B. Discussion on the construction of economic compensation mechanism of cultivated land protection in Shanghai. Sci. Dev. 2017, 2, 44–49. (In Chinese) [Google Scholar]
  23. Scheaffer, R.L.; Mendenhall, W., III; Ott, R.L.; Gerow, K.G. Elementary Survey Sampling, 7th ed.; Cengage Learning: Stamford, CT, USA, 2011; pp. 37–60. [Google Scholar]
  24. Defrancesco, E.; Gatto, P.; Runge, F.; Trestini, S. Factors affecting farmers’ participation in agri-environmental measures: A Northern Italian perspective. J. Agric. Econ. 2008, 59, 114–131. [Google Scholar] [CrossRef]
  25. Burton, R.J.F. The influence of farmer demographic characteristics on environmental behaviour: A review. J. Environ. Manag. 2014, 135, 19–26. [Google Scholar] [CrossRef] [PubMed] [Green Version]
  26. Villanueva, A.J.; Gómez-Limón, J.A.; Arriaza, M.; Rodríguez-Entrena, M. The design of agri-environmental schemes: Farmers’ preferences in southern Spain. Land Use Policy 2015, 46, 142–154. [Google Scholar] [CrossRef]
  27. Lastra-Bravo, X.B.; Hubbard, C.; Garrod, G.; Tolón-Becerra, A. What drives farmers’ participation in EU agri-environmental schemes? Results from a qualitative meta-analysis. Environ. Sci. Policy 2015, 54, 1–9. [Google Scholar] [CrossRef]
  28. Van Dijk, W.F.A.; Lokhorst, A.M.; Berendse, F.; de Snoo, G.R. Collective agri-environment schemes: How can regional environmental cooperatives enhance farmers’ intentions for agri-environment schemes? Land Use Policy 2015, 42, 759–766. [Google Scholar] [CrossRef]
  29. Liu, X.Q.; Cai, Y.Y. Analysis of farmers’ satisfaction on the implementation of cultivated land protection fund and influencing factors: A case study of Yongan Town, Jinqiao Town and Jiangyuan Town in Chengdu City. J. China Agric. Univ. 2014, 19, 216–223. (In Chinese) [Google Scholar]
  30. Yu, L.L.; Cai, Y.Y. The effect of policy expectation for economic compensation for farmland protection policy based on farmers’ satisfaction: A case study of cultivated land protection fund in Chengdu. China Land Sci. 2015, 29, 33–40. (In Chinese) [Google Scholar]
  31. Yu, L.L.; Cai, Y.Y. Subsidy flow and economic compensation for farmland protection policy based on farmers’ satisfaction: A case study of cultivated land protection fund in Chengdu. Resour. Environ. Yangtze Basin 2016, 25, 106–112. (In Chinese) [Google Scholar]
  32. Sulemana, I.; James, H.S., Jr. Farmer identity, ethical attitudes and environmental practices. Ecol. Econ. 2014, 98, 49–61. [Google Scholar] [CrossRef]
  33. Pavlis, E.S.; Terkenli, T.S.; Kristensen, S.B.P.; Busck, A.G.; Cosor, G.L. Patterns of agri-environmental scheme participation in Europe: Indicative trends from selected case studies. Land Use Policy 2016, 57, 800–812. [Google Scholar] [CrossRef]
  34. Mutenje, M.J.; Ortmann, G.F.; Ferrer, S.R.D.; Darroch, M.A.G. Rural livelihood diversity to manage economic shocks: Evidence from south-east Zimbabwe. Agrekon 2010, 49, 338–357. [Google Scholar] [CrossRef]
  35. Li, G.D.; Qiu, D.C.; Wang, L.P.; Luo, D.Q. Impacts of difference among livelihood assets on the choice of economic compensation pattern for farmer households farmland protection in Chongqing City. Acta Geogr. Sin. 2012, 67, 504–515. (In Chinese) [Google Scholar]
  36. Zhu, L.L.; Cai, Y.Y. Influence of economic compensation on farmer’s perception in farmland conservation policy implementation—A case study in Sichuan, Hubei, Shanghai and Jiangsu. J. Huazhong Agric. Univ. Soc. Sci. Ed. 2016, 122, 96–103. (In Chinese) [Google Scholar]
  37. Yu, L.L.; Cai, Y.Y. Performance evaluation and obstacle indicator diagnoses of economic compensation for farmland protection policy based on farmers’ satisfaction. J. Nat. Resour. 2015, 30, 1092–1103. (In Chinese) [Google Scholar]
  38. Wardell, J.D.; Read, J.P.; Colder, C.R.; Merrill, J.E. Positive alcohol expectancies mediate the influence of the behavioral activation system on alcohol use: A prospective path analysis. Addict. Behav. 2012, 37, 435–443. [Google Scholar] [CrossRef] [Green Version]
  39. Fan, L.X.; Niu, H.P.; Yang, X.M.; Qin, W.; Bento, C.P.M.; Ritsema, C.J.; Geissen, V. Factors affecting farmers’ behaviour in pesticide use: Insights from a field study in northern China. Sci. Total Environ. 2015, 537, 360–368. [Google Scholar] [CrossRef]
  40. Van Herzele, A.; Gobin, A.; Van Gossum, P.; Acosta, L.; Waas, T.; Dendoncker, N.; de Frahan, B.H. Effort for money? Farmers’ rationale for participation in agri-environment measures with different implementation complexity. J. Environ. Manag. 2013, 131, 110–120. [Google Scholar] [CrossRef]
  41. Peerlings, J.; Polman, N. Farm choice between agri-environmental contracts in the European Union. J. Environ. Plan. Manag. 2009, 52, 593–612. [Google Scholar] [CrossRef]
  42. Sutherland, L.A.; Mills, J.; Ingram, J.; Burton, R.J.F.; Dwyer, J.; Blackstock, K. Considering the source: Commercialisation and trust in agri-environmental information and advisory services in England. J. Environ. Manag. 2013, 118, 96–105. [Google Scholar] [CrossRef] [PubMed]
  43. Mettepenningen, E.; Vandermeulen, V.; Delaet, K.; Huylenbroeck, G.V.; Wailes, E.J. Investigating the influence of the institutional organisation of agri-environmental schemes on scheme adoption. Land Use Policy 2013, 33, 20–30. [Google Scholar] [CrossRef]
  44. Cai, H. Labor employment. In Report on China Labor Force Dynamic Survey (2017); Social Sciences Academic Press (China): Beijing, China, 2017; pp. 66–98. (In Chinese) [Google Scholar]
  45. Wang, Q.; Zhang, X.L. Three rights separation: China’s proposed rural land rights reform and four types of local trials. Land Use Policy 2017, 63, 111–121. [Google Scholar] [CrossRef]
  46. Cortignani, R.; Gobattoni, F.; Pelorosso, R.; Ripa, M.N. Green Payment and Perceived Rural Landscape Quality: A Cost-Benefit Analysis in Central Italy. Sustainability 2018, 10, 2910. [Google Scholar] [CrossRef]
  47. Mills, J.; Gaskell, P.; Ingram, J.; Dwyer, J.; Reed, M.; Short, C. Engaging farmers in environmental management through a better understanding of behaviour. Agric. Human Values 2017, 34, 283–299. [Google Scholar] [CrossRef]
  48. Warren, C.R.; Burton, R.; Buchanan, O.; Birnie, R.V. Limited adoption of short rotation coppice: The role of farmers’ socio-cultural identity in influencing practice. J. Rural Stud. 2016, 45, 175–183. [Google Scholar] [CrossRef]
  49. Nong, Y.X. Study on the Protection will and Influence Factors of Farmers’ Cultivated Land in the Pearl River Delta Region. Master’s Thesis, South China University of Technology, Guangzhou, China, 2018. (In Chinese). [Google Scholar]
  50. Cai, Y.Y.; Zhu, L.L. Analysis on the implementation effects and influencing factors of farmland conservation compensation policy: Cases in Minhang district, Zhangjiagang and Chengdu city. J. Nat. Resour. 2014, 29, 1310–1322. (In Chinese) [Google Scholar]
Figure 1. Influence of the policy and farmers’ characteristics on farmers’ satisfaction with the cultivated land protection fund (CLPF).
Sustainability 11 05787 g001
Figure 2. Location of the study area and distribution of sample villages.
Sustainability 11 05787 g002
Figure 3. Cultivated area and fertilizer consumption in Chengdu in 2008–2017. Note: A peak of cultivated area was observed in 2016, because in this year, Jianyang was officially administrated by Chengdu. Therefore, the cultivated area of Jianyang is added into Chengdu.
Sustainability 11 05787 g003
Figure 4. Cultivated land area and per capita cultivated land area of the study areas from 2008 to 2017. Note: The solid points in sub-figure (a) denote the cultivated land area, and different colors denote different sample regions. The solid points in sub-figure (b) denote the per capita cultivated land area, and different colors denote different sample regions.
Sustainability 11 05787 g004
Figure 5. Distribution of farmers’ cognition (left) and satisfaction (right) of the CLPF. Note: The blue solid circle and numbers above denote the percentage of the indicator in the total sample size. KC: Knowledge of the CLPF; VC: Value cognition of the CLPF; CFE: Changes in family economic; OS: Overall satisfaction; SCS: Satisfaction with compensation standard; SFUR: Satisfaction with funding use requirement; SSMT: Satisfaction with supervision management transparency.
Sustainability 11 05787 g005
Figure 6. Path analysis of the factors affecting farmers’ satisfaction with the compensation standard of the CLPF. Note: The solid arrows and numbers above denote the direct effects and direct path coefficients. The dotted arrows and numbers above denote indirect effects and indirect path coefficients. SCS: Satisfaction with compensation standard; CLA: Cultivated land area; VC: Value cognition; CFE: Changes in family economic.
Sustainability 11 05787 g006
Figure 7. Path analysis of the factors affecting farmers’ satisfaction with the funding use requirement of the CLPF. Note: The solid arrows and numbers above denote the direct effects and direct path coefficients. The dotted arrows and numbers above denote the indirect effects and indirect path coefficients. SFUR: Satisfaction with funding use requirement; CLA: Cultivated land area; VC: Value cognition; CFE: Changes in family economic.
Sustainability 11 05787 g007
Figure 8. Path analysis of factors affecting farmers’ satisfaction with the supervision management transparency of the CLPF. Note: The solid arrows and numbers above denote the direct effects and direct path coefficients. The dotted arrows and numbers above denote the indirect effects and indirect path coefficients. SSMT: Satisfaction with supervision management transparency; EL: Education level; TAAI: Total annual agricultural income; CFE: Changes in family economic.
Sustainability 11 05787 g008
Figure 9. Five-tiered supervision system of the CLPF.
Sustainability 11 05787 g009
Table 1. Mode of the CLPF in Chengdu.
ItemContents
Implementation date2008
Who will payMunicipal and county governments
Who will acceptFarmers and village collective
Sources of funds(1) 5% of land-transferring fees of the local government; (2) total funds of the newly added paid land use fee for the land construction owned by the local government; (3) 50% of the cultivated land occupation taxes used for non-agricultural usage; and (4) 2% of the initial transfer turnover of the collective construction land use rights
Compensation standard6000 yuan/ha to the basic farmland per year; 4500 yuan/ha to the general cultivated land per year
Compensation methodCultivated land transfer guarantee funds, agricultural insurance subsidy, and pension insurance subsidy
Compensation basisQuality and quantity of cultivated land
Funding use requirement10% of the total amount of compensation funds should be used for cultivated land transfer guarantee funds and agricultural insurance subsidy, and the remaining 90% should be used for pension insurance subsidy
Supervision and managementCompensation funds and farmers’ farmland protection behaviors should be supervised and managed by the government
Accounting transparencyThe process of fund issuance shall be open to the public
Table 2. Characteristics of the study areas.
Sample RegionLocationTopographic FeaturesLand Area (km2)Per Capita Disposable Income of Rural Residents (USD)
Wenjiang103°41′E-103°55′E; 30°36′N-30°52′NPlain2763847
Xindu103°54′E-104°16′E; 30°36′N-30°52′NPlatform4963467
Shuangliu103°48′E-104°16′E; 30°14′N-30°37′NPlain, mountain, and hill10683747
Qionglai102°54′E-104°53′E; 30°05′N-31°26′NPlain, mountain, and hill13772815
Chongzhou103°07′E-103°49′E; 30°30′N-30°53′NPlain and mountain10892956
Pengzhou103°10′E-103°40′E; 30°54′N-31°26′NPlain, mountain, and hill14212957
Note: All statistical data are from 2018. The exchange rate of CNY/USD is calculated according to the average exchange rate in 2018 (i.e., 1 USD = 6.6118 CNY).
Table 3. Survey sites and sample size.
Regional ClassificationSurvey CountiesSurvey VillagesSample Size
Sample regions with higher economic levelWenjiangTuqiao, Gaoshan, and Hongjiang33
XinduJinniu, Guixi, Jiugong, Liangsheng, Shanshui, Yulong, Liyuan, and Tongmeng62
ShuangliuKunshan, Wayao, Baiguo, Shilu, and Wenwu31
XinjinGuanlin9
Sample regions with lower economic levelQionglaiYinghan, Heishi, Gaohe, Quanshui, and Shuangjiang46
DayiTongxin6
ChongzhouXintao, Chitang, Chongfu, Liba, Gaodun, and Baihe60
PengzhouNiuti, Huangzhu, Fengxia, Jingguo, Guangsheng, and Fengquan49
Total 296
Table 4. Description of the main contents of the questionnaire.
FactorsItemsDescription
Farmers’ characteristicsGenderMale = 1, female = 0
Age≤35 = 1, (35,45] = 2, (45,60] = 3, >60 = 4
Education level (EL)0 school years = 1, 1–6 school years = 2, 7–9 school years = 3, >9 school years = 4
Family size (FS)<3 persons = 1, 3 persons = 2, 4 persons = 3, 5 persons = 4, >5 persons = 5
Labor force size (LFS)<2 persons = 1, 2 persons = 2, 3 persons = 3, >3 persons = 4
Cultivated land area (CLA)≤0.067 ha = 1, (0.067,0.133] ha = 2, (0.133,0.2] ha = 3, (0.2,0.333] ha = 4, >0.333 ha = 5
Flowing out of cultivated land area (FOCLA)None = 1, (0,0.133] ha = 2, (0.133,0.267] ha = 3, others = 4
Total annual agricultural income (TAAI)RMB: ≤10,000 = 1, >10,000 = 2
Farmers’ cognitive characteristics of the policyKnowledge of the CLPF (KC)I know about the role of cultivated land protection fund: Know a little = 1, know it very well = 2
Value cognition of the CLPF (VC)I think it is meaningful to implement cultivated land protection fund: No = 1, yes = 2
Changes in family economic (CFE)I think there is a promotion in my family’s economic level: No = 1, a little = 2, much = 3
Overall satisfaction (OS)I am satisfied with the cultivated land protection fund in general: Dissatisfied = 1, undecided = 2, satisfied = 3, strongly satisfied = 4
Satisfaction with compensation standard (SCS)I am satisfied with the compensation standards: Dissatisfied = 1, undecided = 2, satisfied = 3, strongly satisfied = 4
Satisfaction with funding use requirement (SFUR)I am satisfied with the funding use requirements: Dissatisfied = 1, undecided = 2, satisfied = 3, strongly satisfied = 4
Satisfaction with supervision management transparency (SSMT)I am satisfied with the supervision management transparency: Dissatisfied = 1, undecided = 2, satisfied = 3, strongly satisfied = 4
Table 5. Mean, standard deviation, minimum, and maximum of the variables in the questionnaire.
VariableMeanStandard DeviationMinimumMaximum
Gender0.4970.50101
Age3.0610.90714
Education level (EL)2.3890.81614
Family size (FS)3.4361.18615
Labor force size (LFS)2.8380.96814
Cultivated land area (CLA)3.1451.23315
Flowing out of cultivated land area (FOCLA)1.8611.06314
Total annual agricultural income (TAAI)1.1960.39812
Table 6. Correlation between farmers’ satisfaction and the influencing factors.
Influencing FactorsSatisfaction with Compensation Standard (SCS)Satisfaction with Funding Use Requirement (SFUR)Satisfaction with Supervision Management Transparency (SSMT)
Gender0.0250.019−0.004
Age0.0550.034−0.029
Education level (EL)0.120 *0.1070.156 **
Family size (FS)−0.099−0.082−0.058
Labor force size (LFS)0.0100.0950.070
Cultivated land area (CLA)0.302 **0.302 **0.178 **
Flowing out of cultivated land area (FOCLA)0.0650.0670.033
Total annual agricultural income (TAAI)0.118 *0.128 *0.120 *
Knowledge of the CLPF (KC)0.165 **0.220 **0.204 **
Value cognition of the CLPF (VC)0.131 *0.117 *0.071
Changes in family economic (CFE)0.344 **0.314 **0.386 **
Notes: * Significant at p < 0.05, ** Significant at p < 0.01.

