Article

The Impact of Air Well Geometry in a Malaysian Single Storey Terraced House

1
Faculty of Built Environment and Surveying, Universiti Teknologi Malaysia, Johor 81300, Malaysia
2
Department of Architecture Engineering, Kingdom University, Riffa 40434, Bahrain
3
School of Civil Engineering, Faculty of Engineering, Universiti Teknologi Malaysia, Johor 81300, Malaysia
4
School of Professional and Continuing Education, Faculty of Engineering, Universiti Teknologi Malaysia, Johor 81300, Malaysia
5
School of Computing, Faculty of Engineering, Universiti Teknologi Malaysia, Johor 81300, Malaysia
*
Authors to whom correspondence should be addressed.
Sustainability 2019, 11(20), 5730; https://doi.org/10.3390/su11205730
Submission received: 3 September 2019 / Revised: 24 September 2019 / Accepted: 24 September 2019 / Published: 16 October 2019

Abstract

:
In Malaysia, terraced housing hardly provides thermal comfort to the occupants. More often than not, mechanical cooling, which is an energy consuming component, contributes to outdoor heat dissipation that leads to an urban heat island effect. Alternatively, encouraging natural ventilation can eliminate heat from the indoor environment. Unfortunately, with static outdoor air conditioning and lack of windows in terraced houses, the conventional ventilation technique does not work well, even for houses with an air well. Hence, this research investigated ways to maximize natural ventilation in terraced housing by exploring the air well configurations. By adopting an existing single storey terraced house with an air well, located in Kuching, Sarawak, the existing indoor environmental conditions and thermal performance were investigated and monitored using scientific equipment, namely HOBO U12 air temperature and air humidity, the HOBO U12 anemometer and the Delta Ohm HD32.3 Wet Bulb Globe Temperature meter. For this parametric study, the DesignBuilder software was utilized. The field study illustrated that there is a need to improve indoor thermal comfort. Thus, the study further proposes improvement strategies to the existing case study house. The proposition was to turn the existing air well into a solar chimney taking into account advantages of constant and available solar radiation for stack ventilation. The results suggest that the enhanced air well was able to improve the indoor room air velocity and reduce air temperature. The enhanced air well with 3.5 m height, 1.0 m air gap width, 2.0 m length was able to induce higher air velocity. During the highest air temperature hour, the indoor air velocity in existing test room increased from 0.02 m/s in the existing condition to 0.29 m/s in the hottest day with 2.06 °C air temperature reduction. The findings revealed that the proposed air well could enhance the thermal and ventilation performance under the Malaysia tropical climate.

1. Introduction

Energy consumption has been a critical and sensitive global issue for a few decades now. The building industry has been considered to be a high energy consumption industry where a huge amount of fuel and energy is consumed throughout the building life span. In order to reduce the energy consumption along the building operational period especially for the tropic countries, passive cooling design plays an important role. Most buildings are designed with an air-conditioning system in mind, thus the passive cooling design solution has been eliminated preventing cold air leakage which would then lead to high costs of energy consumption. However, most users and occupants do not realize that thermal comfort generated by an effective passive cooling system is closely related to the energy consumption cost. With an effective passive cooling system, the monthly electricity bill can be cut down.
Climatic thermal comfort can be achieved via an effective ventilation system in order to achieve biological comfort of occupants. There are two types of ventilation system; natural ventilation systems and mechanical ventilation systems. The cooling effect generated by the natural ventilation system can be achieved via the pre-construction design for the building by using the advantages of the wind forces or the air pressure difference, as well as the temperature difference between indoor and outdoor of the building. The main aim to achieve good ventilation for the indoor environment is to provide fresh air in order to prevent carbon dioxide (CO2) from exceeding the unacceptable level for an occupant [1].
As promoted by the 2030 Agenda for the Sustainable Development Goals (SDG) which are adopted by all United Nations Member States since 2015, sustainable development for a better living environment in response to the climate change issues urgently needs prompt actions. Sustainable housing with less energy consumption and environmental friendliness as one of the solutions stated in SDG provides access to healthy, decent, affordable habitats which are economically, socially and environmentally sustainable for the mankind [2]. In order to achieve the sustainable goal, research and innovation for affordable housing with a passive cooling design plays a significant role in the sustainable development agenda. Thermal performance of housing which directly affects energy consumption becomes a main concern of the sustainable living and development criteria.
The hot and humid conditions in Malaysia is the main dilemma and issue for the occupants. This situation is about thermal comfort. In addition, the configuration of the terraced house, which is the most common residential type occupied by citizens does not consider the problem of single sided ventilation. Single sided ventilation cannot provide effective ventilation for the Malaysia tropical climate indoor environment [3]. Under the circumstances of the limited layout design, the alternative of passive cooling via a ventilation shaft and louvre window would be a way to increase the ventilation rate and air velocity in the room in order to achieve an energy saving purpose. Thus, proposing a passive cooling system, which could complement the single opening of the terraced house in order to create cross-ventilation, is important. It is possible to achieve the thermal comfort via low indoor air temperature and high air velocity.
The main objective of the paper was to study natural ventilation by evaluating and investigating the effectiveness of an enhanced air well that acts as a solar chimney to improve the natural ventilation in a Malaysian single storey terraced house. The term solar chimney is applied to indicate the enhanced air well in this study. An air well is clearly stated, in the Uniform Building By Law (UBBL) 1984, as a basic ventilation requirement for utility, mechanical room and washroom with stated sizes and dimensions. Designers tend to fulfil requirements by providing the minimum dimension, which does not necessarily achieve the effectiveness and function of an air well. Thus, the configuration of the provided air well does not take into consideration of the effectiveness measure. Developers and designers may tend to ignore the potential of the air well because enclosed spaces have taken into consideration of usable net floor areas. As a result, the measures of natural daylighting and natural ventilation of modern terraced housing are not addressed properly, consequently leading to the needs of a mechanical ventilation system. This has thus increased energy consumption. The application of an air well is not widely promoted since the wide exposed opening invites security issues. In the end, occupants tend to seal it up to avoid problems.
Since the wind velocity of outdoor and indoor environments is not significant in the Malaysia tropical context compared to temperate countries, stack ventilation might be a better alternative. A solar chimney and a louvre window geometry could improve the stack ventilation for the low-air movement of a residential building, which in turn, provides a better thermal comfort for occupants.

2. Ventilation Shaft as Passive Cooling Strategy

Passive ventilation systems are widely studied as an alternative solution to mechanical ventilation systems due to their advantages in the aspect of operational cost, energy requirement and carbon dioxide emission [4]. Ventilation shafts are hypothesized to be able to generate higher indoor air speed and increase the thermal comfort time in a single-sided residential room [5]. Various studies have proven effectiveness of buoyancy air movement to eliminate high air temperatures inclusive of research carried out in Singapore, Malaysia and Thailand [5,6,7,8,9]. The thermal and ventilation performance of an air shaft is important in order to ensure the thermal comfort of occupants. Out of various numbers of passive ventilation systems, the solar chimney is one of the efficient passive solar systems which utilizes the natural driving force from solar energy.

3. Solar Chimney as Alternative Passive Cooling Strategy in Tropical Climate Housing

In Malaysia, the hot and humid tropical climate may cause indoor thermal discomfort to the occupants. Local wisdom in architecture has been widely studied in order to enhance the thermal performance of the buildings. Since Malaysia is gifted with an abundance of solar radiation and hot temperature, the application of passive solar stack ventilation strategies is suitable for residential buildings.
Stack ventilation is defined as the vertical pressure differences of air driven via the building developed by the thermal buoyancy effect. The warm air in the internal building is less dense compared to the cooler air at the external environment. Therefore, the pressure difference will release warm air through the opening at the top part of the building envelope; while the cooler and denser air will enter via the opening at the lower part of the building envelope. The process will keep repeating if solar heat gains enter the indoor building again and again. Stack effects generated from solar heat gain could improve the natural ventilation in air shafts such as air wells, atria, solar chimneys and so forth [10].
The effectiveness of the stack ventilation depends on the height of the stack, the gradient temperature of the stack as well as the effective area of the openings. The rate of the airflow via stack ventilation is mainly affected by the pressure gradient between interior and exterior environments caused by the thermal differences and wind force. Thermal differences are also called naturally driven convection while wind force ventilation is also known as force convection [10]. Stack ventilation happens naturally and the mechanism has benefitted human beings for centuries, from the vernacular buildings to modern buildings. The area of application has been widening up to the larger building with more exacting demand [11].

3.1. Brief History of Solar Chimney

The use of solar chimney as a ventilation tool can be seen in some historical and vernacular buildings. According to Cristofalo et al. the solar chimney so-called “Scirocco rooms” in Italy during the 16th century, were utilized with underground tunnel and water features to supply ventilation and cooling effects [12]. However, due to the development and growth of technology—electric power in the early 20th century—the use of natural ventilation devices were replaced with air conditioning system in the 1930s [13].
The development of the research on solar chimneys was relatively toned down from the 1980s onwards due to the advance growths in mechanical ventilation systems. However, for the past three decades, the awareness of sustainable living and green building has been raised. The trend for sustainable design in architecture in order to create an efficient, effective and ecologically sound building with passive strategies have retrieved the interest of researchers in solar chimneys. However, the research methods have been varied and becoming advanced with the growth of information technology. Numerous research tools such as measuring equipment, numerical and theoretical investigation tools have contributed to the solar chimney experiment [14].

3.2. Solar Chimney Application

There are many researchers that have carried out empirical studies on the enhancement of functionality of solar chimneys to improve the thermal performance of the building. Khanal and Lei reviewed the studies on solar chimney application since the 1990s which focuses on the effects of solar chimney geometry and configurations as well as inclination angle of the solar chimney [11].
Jianliu and Weihua studied the performance of solar chimney on single storey building [15]. The natural ventilation rate was taken into consideration in order to promote good thermal environment for occupants. Since thermal comfort in natural ventilated building is highly dependent on the overall outdoor climate, it can be eased with high and significant air movement in the indoor environment. Higher airflow rate can enhance the convection and evaporation heat dissipation from the human skin [16].
Leng et al. carried out an investigation of solar chimney cross section performance in the computational fluid dynamic (CFD) model. The results show that under highest air temperatures of 35 °C the indoor thermal performance with modified air well could enhance the indoor temperature for 4 °C compared to the existing condition [17].
Imran et al. predicted the thermal performance of solar chimney based on the inclination of geometrical features [18]. The chimney installed was 2 m long, 2 m wide and experimented with three different gap thickness namely 50 mm, 100 mm and 150 mm while the inclination angles set from 15° to 60°. The findings show that the highest air flow rate was found to be 30 ACH (Air Change Rate) in a room of 12 m3 at a solar radiation of 750 W/m2 while the maximum air flow was 0.8 m/s in an air gap of 50 mm thickness.
Asadi et al. studied the ventilation rate of buildings at Isfahan due to the effect of solar chimney layout with EnergyPlus simulation software [19]. Seven various models were applied with the solar chimney. One of the walls of solar chimney is connected to the internal space while the other three walls are exposed to the exterior. The findings show that the east–southern orientation gives the maximum ventilation rate due to maximum solar radiation with both sides of absorbing wall which increase the exposed heat gain surfaces.
Zha et al. explored solar chimney studies for ventilation in low energy buildings with experimental and numerical methods [20]. The findings show that solar chimneys with 6.2 m length, 2.8 m width and 0.35 m air gap the range of air flow rate could achieve 70.6 m3/h to 1887.6 m3/h in the daytime. By comparing the analytical model and theoretical model, the recommended discharge coefficient (Cd) of solar energy in the project is 0.51 while the energy saving rate is around 14.5% by using the solar chimney in Shanghai, China.
Thantong et al. investigated the thermal performance of solar chimneys by applying phase change material (PCM) for the housing model in Thailand [21]. The solar chimney integrated phase change material consists of a double wall with 0.05 m air gap in between while the exposed outer wall is triple-layered wall with a 0.01 m thick black painted cement board panel, paraffin layer and zinc sheet 0.005 m thickness. The inner wall is a lightweight concrete with 0.07 m thickness. Thermal performance of the solar chimney integrated PCM room was investigated and compared with a simple concrete wall room. The findings show that the heat gain from the south wall reduced considerably by 57.2% and it can save cooling load and energy of the building.
Mehran Rabani studied the performance of passive cooling of solar chimneys with a water spraying system in an underground channel with CFD, the passive cooling system formed by four tilted absorbers as well as a wet underground channel. The cooling effect of the wet underground channel was emulated with the water spraying system model. The results show that the application of a spraying water system can reduce the mean indoor air temperature by 7 to 13 °C.
There are many studies of solar chimney that have been performed utilizing the CFD system in both residential and industrial applications. CFD gives sufficient capacity to investigate the complex flow structure as well as giving definite results at exact points of the tested building [22]. With the advantages of CFD, Khosravi [23], de la Torre and Yousif [24], Nugroho and Ahmad [3] and Leng et al. [17] utilized the platform for air flow investigation in solar chimney studies.
Also, many researchers used coupling approaches for the studies’ optimization in the techniques and analysis process of solar chimney research. Effectiveness of the approaches are amongst the advantages being promoted [25,26]. There are various software that allows coupling approaches to be carried out, for instance: Leng et al. [17] has combined simulation generated by EnergyPlus and CFD simulation in DesignBuilder for terraced house solar chimney studies. The coupled approaches have been used to find out the test room and solar chimney thermal performance and CFD simulation to further investigate the airflow pattern of the test room and solar chimney. Additionally, DesignBuilder includes the built-in coupling approach by utilizing the output from EnergyPlus as an input data for CFD calculations where the output can be optimized by optimization under one platform [22].
Based on the presented work, this article executed simulation and CFD method in the process of investigation of air flow and air temperature by amending the parameters and factors that affect the thermal and ventilation performance of the solar chimney in a case study house. The present paper validated and verified the software with field measurement results by comparing the percentage of deviation. Simulation was carried out using the CFD module of DesignBuilder software. The tested parameters of study were air velocity and air temperature while the dependent variables were solar chimney configurations (height, length and width of solar chimney) and louvres window (inlet).

4. Study Area Description

This field study was conducted in one of the single storey terraced houses in Kuching, Sarawak Malaysia. The terraced housing area is located at Matang, North Kuching, Sarawak, the largest state in Malaysia at latitude 1.572095 and longitude 110.295752. It is situated 9.5 km North West of downtown Kuching, Sarawak. The limits of the Kuching city cover approximately 431.01 square kilometers from Mount Lasak to Santubong district. As the capital city of Sarawak State, the city is regarded as the administrative district which is served with a full range of utilities and services. Figure 1 shows the location of Matang, Kuching, Sarawak.

Terraced Houses in Malaysia

According to Valuation and Property Services Department (JPPH) Malaysia, the most transacted property types in major cities such as Klang Valley was dominant with a recorded 31.6% in 2018 [27]. The Malaysia property market report stated that terraced houses comprise 57% of the total Malaysian housing stock since independence [28]. The majority of terraced houses in Sarawak are populated in Kuching, the Capital city of Sarawak due to the urbanization progression in the city. In order to access the thermal environment and performance of the terraced house, the investigation of thermal performance of a single storey terraced house was carried out at one of the case study terraced houses in Kuching. The case study house layout was parallel to the main road that faced the other row of terraced houses. The typical size of the lot was about 20 m in depth and 6 m in width.
The atmosphere in the site area was a tropical rainforest climate with moderately hot but high humidity and received remarkable rainfall throughout the year [29]. The monthly mean values of air temperature are shown in Table 1 [30]. The air temperature value ranged from 22.9 °C in January to 32.7 °C in May and June throughout 1971 to 2000. The mean relative humidity typically ranged from 83% to 89% over the course of the year which was considered as high humidity. The mean monthly sunshine hours ranged from 109.5 in January and 192.9 in July while the average rainfall ranged from 185.6 mm in July and 684.1 mm in January.
The typical wind speeds varied from 0 m/s to 5.2 m/s. The highest average wind speed was recorded as 11.4 m/s in August at which time the mean daily maximum wind velocity was 5.5 m/s (moderate breeze). The prevailing wind direction was strongly affected by the north-west direction. The mean air speed of Northeast Monsoon season was relatively higher compared to the Southwest Monsoon period.
The high temperature and humid weather throughout the year in Kuching has increased the tendency of building occupants to opt for air conditioning systems especially in residential buildings in order to attain thermally comfortable conditions. Low wind velocity and high humidity are the main factors leading to thermal discomfort which leads to the installation of an air conditioning system [22]. However, the mechanical ventilation system is highly energy consuming. By increasing the air flow in the indoor environment, the cooling effect could be achieved and reduce the usage of air conditioning system. Natural ventilation is a more efficient alternative for ventilation and thermal comfort strategies that has been widely studied and suggested as the best passive cooling technique for a hot humid climate [31].

5. Methodology

This study introduced an experiment investigation of a case study house for the thermal performance through field measurements. At the same time a theoretical investigation was carried out by using DesignBuilder. The validation of the software was examined by comparing the field measurement data with the simulation data generated by DesignBuilder. After the validation process, the parameters of solar chimney and the effects on natural ventilation was conducted with the validated software.

5.1. Field Study

The field measurements were performed for investigation purpose to determine the environmental parameters of a case study house environment. The case study house was a single storey terraced house located at Matang Yen Yen Park, North Kuching, Sarawak. The field measurement intended to validate and verify the DesignBuilder software other than investigating the current thermal performance of the case study house. The measurements were conducted from 0800 h to 1900 h on 21st December 2013. The measurements were carried out in a closed doors case. Figure 2 shows the case study building (single storey terraced house) and the location of the case study house while Figure 3 shows the location of the case study room and position of the field measurement instruments. HOBO U30 Weather Data consisting of air temperature and relative humidity probes, wind velocity and directions as well as solar radiation sensors were placed 2 m above ground level of the case study house compound while the HOBO U12 air velocity, air temperature and humidity sensors were placed at the center of bedroom two. The interval time for the recording of the field measurement results was 15 min apart for 24 h. The measurement instruments and recording intervals are summarized in Table 2.
The case study house comprised three bedrooms and one living cum dining space. The windows of the master bedroom and living space were facing north while the windows of bedroom two and dining area were facing south. Except for the living cum dining space, all the rooms received ventilation with single sided openings. Bedroom two and the master bedroom comprised of external windows at eye level while bedroom one and the bathrooms received top hung ventilation from the atrium. Bedroom two was attached to the air well in between bedroom one and bedroom two. The windows were triple-paned sliding windows with 900 mm sill heights, 1.5 m height and 1.5 m width. In a typical Malaysian terraced house, the windows are kept open in the day times and closed at nighttime due to security matters. During the measurement day, all the doors were closed and windows remained open. The measurement results of the field measurements are summarized in Table 3. The roof and walls were not insulated as according to common practices. The house structure consisted of 20 mm thick cement plaster with 100 mm thick clay brick and 20 mm thick cement plaster on both sides of the wall. Thermal conductivity of the plastered walls was about 0.7 W/m-k and U-values was about 2.75 W/m2K. All the window glass was 6 mm clear glass single pane without insulations, as shown in Table 4.

Experimental Measurements Results and Validation of CFD Simulation Software

In the field measurement, the outdoor air temperature, relative humidity, wind velocity and solar radiation for 21 December 2013 were plotted as shown in Figure 4, Figure 5 and Figure 6. According to Figure 4, the outdoor air temperature was recorded as 30 °C between 1500 h and 1600 h and during this period of time, the diurnal relative humidity ranged between 74% and 89%. The highest value of relative humidity was recorded at 0900 h to 1000 h and the lowest value was recorded at 1600 h, which was the hottest hour of the day. The solar radiation intensity of the day ranged from 6 Wh/m2 at 1900 h to 812 Wh/m2 at 1300 h. The solar radiation and air temperature in Figure 5 were considered as critical parameters for the study since they determined the effectiveness and efficiency of the solar chimney configurations and the louvre opening.
The daily patterns of diurnal wind velocity were between 0 m/s to 0.3 m/s, however it was still comparatively better than the low wind velocity ranged between 0 m/s to 0.05 m/s [32]. The facts revealed that the application of wind driven natural ventilation via cross ventilation was not functioning, since the outdoor wind velocity was low in Malaysia. With the high solar intensity and long hour of sunshine period, the core idea in applying the temperature differences to induce the natural ventilation for a specific indoor environment was ideal and applicable.
In Figure 7, the result shows that the air velocity obtained from the field measurement and the simulation generated result were in close agreement with each other. The overall deviation of the simulation was within the range of 15% of the measured air velocity. During 1100 h, 1500 h and 1700 h, the simulated and measured results did not fully agree with each other since the three values marked the dynamic condition of the air movement. However, the graph variations of both measured and simulated air velocity was within the similar trend line and this showed that DesignBuilder software was reliable and valid for ventilation and thermal studies.
In Figure 8, in general the variation pattern of the air temperature for both simulated and measured data was similar except for 0800 h, 1400 h, 1500 h and 1900 h. The overall deviation of air temperature was marked as 15%, which was still within the acceptable range, which was 20% of the measured data unit. According to Nugroho et al. although there is slight deviation between the measured and CFD generated results, it can be inferred that the CFD modelling is suitable to reproduce the phenomenon that happened in the measuring condition [32]. It could be stated that the use of CFD model to investigate the performance of the stack ventilation was thus validated. DesignBuilder was validated by Mohammad Baharvand et al. in terms of natural cross-ventilation [33]. The author concluded that DesignBuilder is a suitable CFD and simulation software to predict the natural cross ventilation. Other than that, the validation of DesignBuilder via comparing the measured data and simulation data has been proven and published [17]. Designbuilder is a reliable software widely used by researchers and designer in building industry.
Table 5 has summarized the highest and lowest monthly average air temperature and air speed throughout 2003 to 2013, as well as individual years 2012 and 2013. The highest monthly average air temperature for the three selected periods (2003–2013, year 2012 and year 2013) was 28.88 °C while the lowest monthly average air temperature was 26.34 °C. The monthly mean air velocity fluctuated between 1.50 m/s to 1.97 m/s. The variation patterns of the air temperature and air velocity speed were relatively consistent. This was comparable to the current weather data in Kuching as stated by Malaysia Meteorological Department (2018), the average air temperature ranges from 25.5 °C to 29 °C while the annual average air velocity ranged from 1.12 m/s to 2.15 m/s. The average relative humidity was stated as 84%. In general, the range of the mean air temperature and air velocity of Kuching for past 10 years fluctuated within the similar range and hence it verified the validity of the study which happened in year 2013.

5.2. CFD Simulations

In this paper, numerical simulation for the outdoor wind environment (coordinate of monitoring point as stated in Table 6 and boundary condition as stated in Table 7) were used in order to simulate the CFD model based on the finite-volume discretization method. The standard k-ε model was selected to be utilized simulating the turbulence effect while the steady-state condition for stable wind flow field was estimated. There are various CFD simulation software available on the market. In this study, DesignBuilder was selected since it utilized EnergyPlus for the simulation and it used standard k-ε turbulence model for CFD calculations. As one of the valid simulation engines recognized by United States Department of Energy, the EnergyPlus is used for energy reenactment, building energy simulation, heat gain and cooling load as well as mass parity [34]. This study used DesignBuilder v.4.2 with integrated EnergyPlus v.8.1 for CFD simulation.

CFD Simulation Parameters

For CFD simulations, the size of the existing air well and bedroom two were modelled in DesignBuilder. A layer of adiabatic layers was attached at the outer surface of the bedroom internal walls except the surface exposed to the external environment. Figure 8 indicates the simulation model with the coordination points: Point A, B and C located in the test room (bedroom two) while point D, E and F located vertically in the air well of the case study house.
The boundary condition for the optimization test for solar chimney parameters in this study was chosen based on the mean maximum air temperature throughout Kuching’s meteorological data in year 2013. The monthly mean max air temperature and solar radiation were selected from the year 2013 meteorological data. The mean max air temperature (34 °C) and solar radiation (988 W/m2) both were values that appear most frequently in September compared to other months. Therefore, both were chosen as the boundary condition for the optimization test. Furthermore, both mean max air temperature and solar radiation happened in the month with the most frequent mean wind speed of 1.2 m/s measured at 12.2 m high and 84.8% of the highest average diurnal relative humidity in September 2013. Table 7 indicates the boundary condition for simulation. Other than air temperature, solar radiation, wind speed and relative humidity, the cloud cover and air pressure for the year 2013 were also taken from the Kuching meteorological as simulation boundary conditions.
When a CFD project is created, the grid system is automatically generated for the required model domain. The grid system identifies the model object vertices and assigns the key coordinates from the denoted vertical and horizontal grid axes. In this study, the CFD simulation applied the Cartesian type-grid system. The total number of cells produced for the internal CFD boundary was 74 numbers (x-direction) × 51 numbers (y-direction) × 53 numbers (z-direction). Results from each coordinate from CFD simulation model were recorded (as shown in Table 6) The maximum aspect ratio was four. The setting out of the steps above prepared the parametric study of the solar chimney which is discussed in next section.

5.3. Development of Solar Chimney and Window Louvres Model—Simulations and Parameters Optimization

The studied simulations were categorized into three sections, namely: Window geometry, solar chimney geometry, and integration configuration of window louvres cum solar chimney geometry. Simulations were run in the test room model attached with air well. The first step of the simulation involved only a typical window in the test room with a single sided opening (A). The study was followed by modification of the existing air well to solar chimney configuration in major aspects (C), such as height, cross section of solar chimney (width and depth), extruded wall material as well as solar chimney roof form. Optimization of the solar chimney cum window louvres (D) was tested with parameters like best orientation and no wind condition. Figure 9 indicates the framework for optimization studies. The results from simulation and CFD slices with defined monitoring point value were exported to Microsoft Excel for data analysis and graph illustration.

5.3.1. Modification of Air Well Model in Selected Climatic Condition

This section discusses the modification of the existing air well in order to improve its function on stack ventilation. Figure 10 indicates the configuration of the air well in an existing terraced house while Figure 4 shows the monitoring point for air flow and temperature which was applied in the discussion and analysis below. Points A, B and C were located in the test room in horizontal sequences from external window to internal window, while points D, E and F were located in the air well according to vertical sequences from bottom to top. The modification of the existing air well included the extended air well height, air well gap and air well length. The simulation was further conducted for optimized integrated louvres and air well in comparison with a clear opening on four design days (21 March, 21 June, 21 September and 21 December).

5.3.2. Extended Air Well Height

The existing air well was designed to fulfil the Building By Law 1984 in order to provide daylighting and natural ventilation for the intermediate rooms. Thus, the air well ended at roof profile as shown in Figure 10. The air well was extruded over the roof profile level via CFD modelling in order to investigate the ventilation and thermal performance of the test room.
This section examines the five types of extruded solar chimney height, which were; the existing height (no extruded shaft), 1.6 m, 3.5 m, 6.0 m and 9.0 m. The extruded dimension was suggested by Gan, Hirunlabh et al. and Nugroho [32,35,36]. The recommended heights were according to the roof height and house height design by Hirunlabh and Nugroho [32,36]. The constant was set as a 2 m-length and 1 m-width gap.
Figure 11 indicates the air temperature and air velocity results at monitoring points A to F (as shown in Figure 10) generated by an extended air well while Figure 12 indicates the CFD slices (air flow pattern) in order to observe the ventilation performance of examined parameters. The cross-section dimension for the existing air well was 2 m2 (2 m × 1 m) with 2550 mm overhead of the test room ceiling height. The outlet of air well ended at the roof level. The stated characteristics above were applied to the existing case study house configuration in Figure 8 or “nil(ori)” category in Figure 12.
It was found that the mean air temperature increased along point A to point E since solar radiation penetrated through the air well from the outlet. Other than that, average air velocity increased as the air well height increased. The highest mean air speed of 0.39 m/s happened with the highest air well height of 9 m. The height of the air well would have effect on the amount of solar radiation absorbed in order to provide temperature differences between the test room and the air well thermal environment. Hence, the air velocity increased according to the height.
As stated in Figure 12, the air velocity contour enhanced accordingly to the height of the air well. This meant that the higher the extruded air well the higher the air velocity would be induced from the inlet. However, there are limitations on the acceptable height in consideration of external factors, such as regulations, costing, practicality and other issues. Nugroho and Gan suggested that the optimum height for a solar chimney is to be kept above 2 m [32,35]. As shown in Figure 11, the mean air velocity for the existing height and 1.6 m were the lowest, which ranged between 0 m/s to 0.2 m/s while the mean air temperature for the existing height was the highest, with 32.22 °C followed by 1.6 m height with approximately 31 °C. On the other hand, the practicality to opt for the appropriate air well height was important even though the induced air velocity was high. The high air well would be a more appropriate design for a wind catcher which utilizes wind forces for passive cooling strategy.
As suggested by Alfonso the recommended height for optimum air velocity ranged from 0.5 m to 3 m [37]. Furthermore, Tan and Wong recommended that the optimum solar chimney stack height should be the height of the building. After referring to CFD results and previous researchers’ findings, the optimum solar chimney height was between 1 m to 4 m among the five different heights [7,35,37].
According to Figure 11, the average test room air velocity was 0.01 m/s, 0.33 m/s, 0.34 m/s, 0.35 m/s and 0.41 m/s while the mean ambient temperature ranged from 30.76 °C to 33 °C. In addition, the existing air well configuration and the 1.6 m height air well configuration were recorded as nearly static average air velocity, which were 0.01 m/s and 0.03 m/s respectively. For the 6.0 m and 9.0 m configuration, the average air velocities slightly increased from 0.35 m/s to 0.41 m/s while the average air temperature was approximately 30 °C. According to the monitoring points results, point A of 3.5 m height configuration possessed air velocity of 0.36 m/s and 0.44 m/s higher than the existing one and 1.6 m height configuration while B possessed 5% higher air velocity than B of 6.0 m height configuration. For points C, D, E and F of 3.5 m height configuration, the air velocity was 0.17, 0.24, 0.3 and 0.42 m/s respectively. The mean air velocity increased in line with the vertical height. The air temperature of the test room with 3.5 m height configuration was recorded as 31.4, 30.9 and 29.9 for points A, B and C, which were 0.3–4.7% and 0.6–3.5% lower than the configuration of the 6.0 m and 9.0 m height respectively. In considering the factor of limitation and previous studies, configuration of 3.5 m height delivered reasonable mean indoor air velocity of 0.34 m/s with mean air temperature of 30.7 °C.

5.3.3. Air Well Width Gap

Figure 13 indicates the air velocity and air temperature for the CFD results generated with five types of air well/solar chimney width gap, which were 0.3 m, 0.6 m, 1.0 m (existing), 1.2 m and 1.5 m. The listed width gap was tested with constant chimney height of 3.5 m and length of 2.0 m.
It was found that the average air well air temperature decreased when the width gap increased. The findings showed that the average overall air velocity increased from 0.3 m width gap configuration up to 3.5 m width gap configuration. Other than that, the air temperature differences increased when the width gap increased. However, the air velocity would increase according to the increase of width gap until 1.2 m. The overall air velocity decreased to 41.4% when the width gap changed from 1.2 m to 1.5 m.
In previous studies, researchers concluded that air velocity was generally reduced when the width gap of solar chimney increased. The air well temperature and air velocity decreased when the air gap increased since the induced air cooled the cavity of the air well and thus reduced the air temperature difference of the indoor room and the air well. The “Venturi” effect of smaller gap air well was able to increase the air velocity up to 1.0 m gap and decrease after 1.0 m dimension. The air velocity decreased when the width gap increased.
According to Hirunlabh et al. a smaller width gap tends to heat up the volume of air in the solar chimney faster [36]. In this case, the 0.3 m and the 0.6 m gap possessed higher air well shaft temperature, which were 36.27 °C and 36.07 °C respectively while the 1.0 m, 1.2 m and 1.5 m registered 35.6 °C, 33.73 °C and 32.4 °C. The larger the width gap the lower the air temperature because updrafted air dissipating heat was trapped in the shaft of the air well. The air velocity increased according to the width gap size and decreased when the air gap was 1.5 m. The average air velocity for 0.3 m air gap was 0.33 m/s and 0.34 m/s for 0.6 m air gap width. It increased by 26% when the width gap increased to 1.0 m. The highest mean air velocity among the sizes was registered as 0.55 m/s, which was the1.2 m width gap.
Although the 1.2m width gap induced higher air velocity compared to 1.0 m width gap in overall average, which were 0.47 m/s and 0.45 m/s respectively, the performance of the ventilation at the test room was given priority since the impact of air flow in habitable area was more critical compared to the air well shaft zone. The mean air velocity for the test room between 1.0 m and 1.2 m gap were 0.44 m/s and 0.35 m/s respectively while the air temperature, which was 31–32 °C was similar. The air temperature difference for the air well shaft and the test room for width gap 1.0 m and 1.2 m were deviated by 3.6 °C and 2.5 °C respectively. This means that the width gap of 1.0 m could induce higher air speed to test room and higher air temperature difference between the air well shaft and test room. Hence, 1.0 m width gap was recommended for 3.5 m extended air well height. The present result agrees with previous studies [32]. Effective air well width gap to induce adequate air flow in the indoor room was strongly affected by the solar chimney’s width. The effective solar chimney width gap contributed to the effective air flow rate and air velocity without chaotic turbulent flow.
According to Figure 14, the air flow pattern for 0.3 m and 0.6 m width gap did not contribute significant air flow to the test room compared to the air well shaft. Although the air well shaft’s air velocity was higher than the test room, the stack effect was not significant enough to withdraw the air out from air well. The air temperature differences for both configurations were low compared to the 1.0 m and 1.2 m but higher than the 1.5 m, which were 2.8 °C for 0.3 m, 2.4 °C for 0.6 m, 3.6 °C for 1.0 m, 2.53 °C for 1.2 m and 1.9 °C for 1.5 m. Turbulent and swirling air was observed from the test room of 0.3 m and 0.6 m width gap. The induced air from external opening mixed the static air with lower pressure and stacked via internal opening. However, significant air movement was only observed at 2.0 m from ground level to ceiling level, which was not contributing to the thermal comfort at human level.
Furthermore, configuration 1.0 m, 1.2 m and 1.5 m air flow pattern profiles showed that air was distributed around the rooms especially to the middle part of the room. The jet flow for 1.0 m and 1.5 m were much higher compared to 1.2 m configuration. In addition, turbulence happened in the test room for 1.2 m configuration in accordance to air flow pattern profile. This might be due to the higher air temperature gradient between the shaft and the test room compared to the 1.5 m configuration, which caused the induced wind to be distributed over the upper part of the room. Compared to the 1.5 m, the 1.0 m configuration possessed the highest air temperature difference between the shaft and the test room, which was 3.6 °C. The air speed difference between the shaft and the test room for 1.0 m configuration was minimum compared to other configurations, which was 0.02 m/s. This meant that updraft effect of air well was mainly caused by temperature gradient, which would later influence the air flow for the overall system. A literature review stated that a width gap of 1.0 m could induce a maximum airflow rate with an optimum solar chimney gap to height ratio of 0.5 [38]. The next section discusses about the length for air well with air well height of 3.5 m and width gap of 1.0 m.

5.3.4. Air Well Length

This section discusses the comparison results of air well length. The combination of air well length size of 0.5 m, 1.0 m, 1.5 m, 2.0 m, and 3.0 m were tested. According to Nugroho, the length of solar chimney used as ventilation controller, can determine the air flow speed and air flow rate and give impact to the performance of solar chimney [32]. Figure 15 shows the air temperature and air velocity variation of air well length configuration for each of the monitoring points. According to the figure stated, increasing the length of the solar chimney/air well would reduce the air temperature which directly influenced the temperature gradient between the air well shaft and the test room. In order to optimize the air velocity in the air well stack ventilation system, the length of air well/solar chimney shaft should be shorter.
In general, the air velocity decreased gradually from point A to point C. Due to the changes of the air well and test room pressures between point C and point D, the air speed increased. However, the air speed would either decrease or increase relatively higher depending on the pressure differences affected by length. For the lengths of 0.5 m, 1.0 m and 1.5 m, the air velocity ranged from 0.08 m/s to 0.31 m/s.
The average air velocity in the test room for these lengths was 0.18 m/s, 0.17 m/s and 0.15 m/s respectively while for the air well shaft, it was 0.28 m/s, 0.16 m/s and 0.21 m/s. The overall air speed decreased when the length of air well shaft increased.
When it comes to 2.0 m and 3.0 m length, the average air speed in the test room was 0.45 m/s and 0.76 m/s respectively. The mean air velocity in the air well shaft for 2.0 m was 0.53 m/s and for 3.0 m it was 0.64 m/s. The air speed gradient between the test room and the air well for 0.5 m, 1.0 m, 1.5 m, 2.0 m and 3.0 m were 0.09 m/s, −0.03 m/s, 0.06 m/s, 0.08 m/s and −0.12 m/s. The overall air speed deviation increased when the length of the air well increased. For cases of 1.0 m and 3.0 m, the value showed negative since the test room air speed was higher than the air shaft. This could be due to the inverse flow that happened. However, the air temperature gradient decreased when the length of air well increased. It can be inferred that a larger length was preferred but only up to 2.0 m. Inverse flow happened at 3.0 m length.
In terms of temperature differences between shaft and room amongst the selected length configuration, the larger the air well length the lower the air temperature gradient would be. The air temperature differences for 0.5 m, 1.0 m, 1.5 m, 2.0 m and 3.0 m were registered as 3.23 °C, 2.63 °C, 2.37 °C, 2.23 °C, and 1.43 °C. Similar to the width gap configuration, the air flow induced to the shaft decreased the air temperature and thus the temperature gradient between shaft and room decreased.
According to Figure 16, the air flow pattern for the 0.5 m, 1.0 m and 1.5 m were considered as ineffective. Turbulence happened in the test room due to the higher temperature differences between shaft and room. This led to the suction effect of air flow towards the upper room and escape of air via the internal opening. Since human activity level was below 2.0 m, the stated condition above was not efficient for thermal comfort. In the other case, the 2.0 m and 3.0 m length could induce higher air speed with lower temperature gradient. However, the solar chimney system utilized the theory of temperature gradient to function efficiently. This means that inverse flow that happened in the 3.0 m was not accepted although the air flow speed was higher compared to 2.0 m.
The literature review supports the fact that longer length of air well was preferable compared to shorter and narrower length. However, appropriateness of the air well size was important since the right pressure and temperature gradient would induce reasonable air velocity inside the solar chimney/air well [32,37]. Hence, effective length of 2.0 m is recommended for 3.5 m chimney height with 1.0 m width gap. In addition, the current result agrees with the literature review. Thus, it is important to consider optimal width gap, stack height and length to increase air flow speed and temperature differences without turbulent flow when designing solar chimney for single storey terraced houses in Malaysia.

6. Results for Optimized Integrated Louvres and Air Well in Design Days (21 March, 21 June, 21 September and 21 December)

The impact of effective solar chimney/air well as well as louvres is important to this study. After defining the effective louvres configuration and air well, it is important to observe the ventilation and thermal performance for both configurations in the design days (21 March, 21 June, 21 September and 21 December).

6.1. Optimized Air Well with Clear Opening

Figure 17 indicates the CFD simulation results for optimized air well with clear opening (100% opened). The study was intended to examine the thermal and ventilation performance for optimized air well throughout the year via selected design days.
On 21 March (As shown in Figure 18), the sun was positioned directly above the equator. The spring equinox occurred when the sun left the southern hemisphere and crossed the equator zone. On this day, the maximum and minimum values of outdoor air temperature were indicated as 32.8 °C at 1500 h and 24 °C at 2400 h. However, the indoor air temperature was high at 31.45 °C at 1800 h and low at 24.56 °C at 0400 h. When the outdoor air temperature was the highest, the indoor air temperature was indicated as 29.12 °C and it was indicated as 25.6 °C when the outdoor air temperature was the coldest. The deviations of 11.2% and 4.23% were recorded for hottest and coldest external air temperature and test room air temperature respectively. When the external air velocity was the highest, which was 6 m/s at 0400 h, the test room only received 0.08 m/s of air movement. During the hottest hour, the outdoor wind velocity was shown as 4 m/s and the test room received 0.237 m/s. This indicates that the air well had significant function in daytime compared to nighttime.
Furthermore, on 21 June (As shown in Figure 19), which was the summer solstice, the Earth’s tilt towards the sun was at its maximum. Hence, the sun rose to the highest elevation during noon time. On this day, the mean outdoor air temperature was showed as 28.25 °C while the mean air velocity was 2.83 m/s. The highest air temperature happened at 1300 h with an air temperature of 34 °C and lowest at 0600 h with an air temperature of 23 °C. The indoor air temperature for the hottest hour appeared to be 26.33 °C with air velocity of 0.33 m/s, which was 22.56% lower than outdoor air temperature. Other than that, during the lowest external air temperature hour, the test room air temperature was marked as 28.45 °C with 0.2 m/s internal air velocity. The differences of 16.3% higher indoor air temperature than outdoor with a decrease of 90% between outdoor and indoor air speed during the cold hour showed that ventilation could not effectively happen on a cold day even though the air well was utilized. Similar conditions happened at 0200 h. When the outdoor air temperature was 25.3 °C, the indoor air temperature was 31.42 °C, which was the highest among others while the lowest indoor air temperature of 25.98 °C with air velocity of 0.3 m/s happened at 1100 h with outdoor air temperature of 32.1 °C. The facts showed that the air well got rid of trapped heat in the test room when the external air temperature was high.
During the summer solstice, which was on 21 September (As shown in Figure 20), the sun crossed the Earth’s equator zone. This means that the daytime duration was similar to the nighttime duration. The total average air temperature for 21 September was 28.51 °C with 3.58 m/s of outdoor air speed. The hottest outdoor air temperature happened at 1500 h with 34.5 °C and coldest at 0500 h with 24 °C. At the same time, the test room air temperature appeared to be 29.73 °C with air velocity of 0.23 m/s at the hottest hour while the coldest hour recoded 26.12 °C with indoor air speed of 0.16 m/s. The enhancement of 12.7 °C between indoor and outdoor air temperature with 0.23 m/s air speed during hottest hour signifies the performance of the air well on a hot day.
On 21 December (As shown in Figure 21), the site experienced the Northeast Monsoon which brought heavy rain. This meant that the mean temperature tended to be lower compared to other days. The average outdoor air temperature was 26.57 °C and mean air velocity was 5.57 m/s. The value was 1.17 °C, 1.68 °C and 1.93 °C lower than during the March equinox, June solstice, and September equinox. For this day, 1200 h was marked as being the hottest air temperature hour with an air speed of 9 m/s while at the same time, the test room air temperature and air speed recorded 27.44 °C and 0.16 m/s. Furthermore, 2400 h was marked as the coldest hour with external air temperature of 23.9 °C and 0.5 m/s outdoor air speed. However, the indoor air temperature was 24.35 °C, which was 0.45 °C higher than outdoor air temperature.
In general, the study deduced that the air well brought significant thermal and ventilation performance for the test room in the daytime compared to nighttime. The air well or solar chimney applied a temperature gradient to function. Hence, when outdoor air temperature was higher and the indoor environment was cooler, the solar chimney could induce higher air speed into the room and release hot air via the outlet. The performance of combination of air well and louvres are described in the next section.

6.2. Optimized Air Well with Louvered Opening

After reviewing the performance of the solar chimney, this section discusses the thermal and ventilation performance for the test room aided with louvres and solar chimney. Table 8 shows Internal air temperature and air velocity at the test room with enhanced solar chimney compared to the existing terraced house with air well. The results significantly convince the test room with enhance solar chimney is effectively reduce the air temperature especially during the hot day. Thus, in this section, optimized air well could be further enhanced its stack ventilation performance by integrating the louvered opening.
The weather data for the selected design days—which were 21 March, 21 June, 21 September and 21 December—was applied in the CFD in order to simulate the real-life condition of the test room aided with the mentioned passive cooling tools. Figure 22 shows the overall variation for both air temperature and air velocity for the test room with louvres and solar chimney.
On 21 March, the highest outdoor air temperature was marked as 32.8 °C with 4 m/s air speed while the indoor air temperature was marked as 27.89 °C with air speed of 0.15 m/s as shown in Figure 23. The average external air temperature and mean air velocity was marked as 27.74 °C and 2.38 m/s respectively. In the coldest hour, the external air temperature was marked as 24 °C with 4 m/s air velocity while the indoor was marked as 28.9 °C and 0.24 m/s respectively. Installation of louvres in the test room with solar chimney increased the percentage average air velocity of 16.5% and reduced percentage average air temperature to 1.1% compared to the test room with solar chimney only. Other than that, improvement of 6.4% from the outdoor air temperature and 0.53 m/s of indoor air velocity during the hottest hour indicated that combination for both passive cooling devices were able to enhance the thermal and ventilation performance of the test room. In the coldest hour with external air temperature of 24 °C, the indoor air temperature managed to be regulated to within tropical comfort range with a value of 28.9 °C for temperature and 0.24 m/s for air velocity.
For 21 June, the mean test room air temperature managed to be regulated to 30.23 °C with mean air velocity of 0.31 m/s according to Figure 24. In the hottest hour, the test room air temperature managed to stay at 30.96 °C with 0.32 m/s indoor air velocity even though the outdoor air temperature was marked as 34 °C. On the contrary, the coldest hour with external air temperature of 23 °C managed to give air velocity of 0.22 m/s even though the internal air temperature was 29.57 °C. The high indoor air temperature was due to the dissipation of heat from concrete at nighttime.
According to Figure 25, during the September equinox, the average external air temperature was the highest among other days since the sun was in a position nearest to the globe. The average external air temperature and air speed were marked at 28.5 °C and 3.58 m/s respectively while for the indoor they were marked at 27.76 °C and 0.25 m/s accordingly. The reduction of 2.6 °C of air temperature and induction of average air speed of 0.25 m/s compared to outdoor condition could be obtained from this study. In the hottest hour, the indoor air speed was recorded as 0.6 m/s with air temperature of 30.2 °C, a reduction of 4.3 °C whilst on the coldest day the indoor air speed was recorded as 0.05 m/s with an air temperature of 25.78 °C. Comparing both models, during the hottest hour of September equinox, the louvres cum solar chimney room was able to induce 28% of air velocity in the test room and 57% at the coldest hour. The indoor air temperature appeared to be similar with deviation of 0.22 °C in the hottest hour and 2 °C in the coldest hour.
Figure 26 indicates the solar chimney cum louvres test room model air temperature and air velocity variation on 21 December. In the hottest hour, the test room air temperature was recorded as 25.48 °C and 0.25 m/s while in the coldest hour the indoor condition was recorded as 23.55 °C and 0.23 m/s. Reduction of 13.6% of air temperature could be obtained during the hottest hour. Compared to the previous model which only possessed a solar chimney, the current model provided better thermal performance with a value of 1.52 °C lower than the previous model at the hottest hour and 0.15 °C lower in the coldest hour. However, the maximum air velocity obtained for both models was similar, with the current model having 2.86% deviation compared to the previous model. This could be due to the impact of overall outdoor weather condition caused by the Monsoon wind and rainy seasons which directly influenced the performance of air well and louvres.

7. Conclusions

This paper was concerned with the thermal performance of the habitable indoor environment through the exploration of the potential of an existing air well in a single storey terraced house in Malaysia to be converted into a solar chimney. The selected case study house was located in Kuching, Sarawak which is a tropical hot humid climate region. The typical single storey house in Malaysia usually uses the air well for intermediate and internal rooms ventilation shaft as mentioned in the requirement of the Uniform Building By Law (UBBL) 1984. However, in order to fulfil the minimum requirement of submission for approval, developers and designers tend to ignore the practicality of the air well in ventilation aspect. In this parametric study, the existing air well configurations have been focused based on its height, length and air gap width. The study parameters are air temperature and the air velocity of the indoor environment. The measured values confirmed that the indoor thermal performance was attributed to the poor air circulation, due to the single-sided ventilation approach.
The study was divided into two stages: Field measurement for software validation and investigation of the existing test room thermal performance as well as a parametric study which was validated with software—DesignBuilder. The DesignBuilder software was applied to simulate the flow field and calculate the thermal and ventilation performance of the test room and the modified air well/solar chimney. The standard k-ε turbulence model was used to simulate the turbulence effects that could regulate the airflow pattern and temperature distribution in this study. The validation and verification process of the software was done using two parameters: Wind velocity and air temperature. The calculated results were in good agreement with the measured data. Both the experimental and simulation investigations were carried out to enhance the configurations of the air well in the terraced house parameters on natural ventilation. The results indicated that the enhanced air well configurations could have decreased indoor air temperature by 6.15% on the high outdoor air temperature of 34 °C. The effective extended air well length of 2.0 m was recommended for 3.5 m chimney height with 1.0 m width gap.
However, even though this paper investigated thermal performance of the indoor environment of a single storey terraced house with an air well, there were limitations that could be further experimented in this paper with regulated parameters; for instance: The air change rate of air flow, the air well materials, various terraced housing floor plan, occupants’ activities, the sizes of inlet and outlet of extended air well/solar chimney. Furthermore, the future research of how the extended air well/solar chimney may associate with various room geometry, the orientations of the solar chimney, the geometry and design of the solar chimney and others which potentially increase the thermal performance of the attached indoor space.
The results presented in this paper showed the potential of an existing terraced housing air well to be converted and renovated into a solar chimney which could enhance the indoor thermal performance. The output of the research could be a reference resource for designers and developers in terraced house design. Furthermore, this research could contribute to the guidelines and reference for Government bodies, local authorities, Malaysia Building By-Law practitioners and policy makers. The research could be modified and integrated into existing manuals such as Guidelines of Residential Planning (Garis Panduan Perancangan Perumahan) by KPKT (Ministry of Housing & Local Government Malaysia) and Strategy Guidelines for Affordable Housing by Economy Planning Unit under the Prime Minister Department Malaysia. The scientific research acts as a reference for policy makers to improve the current thermal issues in residential and integrate into the guidelines and policy.

Author Contributions

All authors contributed to the manuscript. Conceptualization, M.H.A., D.R.O. and G.H.T.L.; S.A., E.A., W.L.L. and W.H.C. collected and evaluated, in a coordinated way, all the publications mentioned in the paper. With this material, P.C.L. wrote a preliminary version of the article that was further enriched with suggestions and contributions by the rest of the authors.

Funding

This research publication was funded by UTM Transdisciplinary Research Grant, grant number Q.J130000.3552.07G55.

Acknowledgments

The authors wish to deliver the appreciation to Building Science Laboratory, Faculty of Built Environment and Surveying, Universiti Teknologi Malaysia for the field measurement instruments as well as the owner of case study house—Leng Wee Woon & Liew Thai Jin for the permission to set up field measurement for the study.

Conflicts of Interest

The authors declare no conflict of interest. The funders had no role in the design of the study; in the collection, analyses, or interpretation of data; in the writing of the manuscript, or in the decision to publish the results.

References

  1. Awbi, H.B. Energy efficient room air distribution. Renew. Energy 1998, 15, 293–299. Available online: https://www.sciencedirect.com/science/article/pii/S0960148198001761 (accessed on 8 July 2019). [CrossRef]
  2. United Nations Department of Public Information. Sustainable Development Goals: Sustainable Development Knowledge Platform. U. N. Dep. Public Inf. 2015. Available online: https://sustainabledevelopment.un.org/?menu=1300 (accessed on 8 July 2019).
  3. Nugroho, A.M.; Ahmad, M.H. Passive Cooling Performance of a Solar Chimney and Vertical Landscape Applications in Indonesian Terraced House. J. Teknologi 2014. Available online: https://jurnalteknologi.utm.my/index.php/jurnalteknologi/article/view/3585 (accessed on 8 July 2019).
  4. Bansal, N.K.; Mathur, J.; Mathur, S.; Jain, M. Modeling of window-sized solar chimneys for ventilation. Build. Environ. 2005, 40, 1302–1308. [Google Scholar] [CrossRef]
  5. Prajongsan, P.; Sharples, S. Enhancing natural ventilation, thermal comfort and energy savings in high-rise residential buildings in Bangkok through the use of ventilation shafts. Build. Environ. 2012, 50, 104–113. [Google Scholar] [CrossRef]
  6. Mallick, F.H. Thermal comfort and building design in the tropical climates. Energy Build. 1996, 23, 161–167. Available online: https://www.sciencedirect.com/science/article/pii/037877889500940X (accessed on 11 July 2019). [CrossRef]
  7. Tan, A.Y.K.; Wong, N.H. Influences of ambient air speed and internal heat load on the performance of solar chimney in the tropics. Solar Energy 2014, 102, 116–125. Available online: https://www.sciencedirect.com/science/article/pii/S0038092X14000413 (accessed on 14 June 2019). [CrossRef]
  8. Wong, N.; Feriadi, H.; Lim, P.; Tham, K.; Sekhar, C.; Cheong, K. Thermal comfort evaluation of naturally ventilated public housing in Singapore. Build. Environ. 2002, 37, 1267–1277. Available online: https://www.sciencedirect.com/science/article/pii/S0360132301001032 (accessed on 11 July 2019). [CrossRef]
  9. Feriadi, H.; Wong, N.H. Thermal comfort for naturally ventilated houses in Indonesia. Energy Build. 2004, 36, 614–626. Available online: https://www.sciencedirect.com/science/article/pii/S0378778804000143 (accessed on 11 July 2019). [CrossRef]
  10. Moosavi, L.; Mahyuddin, N.; Ab Ghafar, N.; Azzam Ismail, M. Thermal performance of atria: An overview of natural ventilation effective designs. Renew. Sustain. Energy Rev. 2014, 34, 654–670. Available online: https://www.sciencedirect.com/science/article/pii/S1364032114001567 (accessed on 8 July 2019). [CrossRef] [Green Version]
  11. Khanal, R.; Lei, C. Solar chimney—A passive strategy for natural ventilation. Energy Build. 2011, 43, 1811–1819. Available online: https://www.sciencedirect.com/science/article/pii/S0378778811001447 (accessed on 14 June 2019). [CrossRef]
  12. Di Cristofalo, S.; Orioli, S.; Silvestrini, G.; Alessandro, S. Thermal behavior of “Scirocco rooms” in ancient Sicilian villas. Tunn. Undergr. Space Technol. 1989, 4, 471–473. [Google Scholar]
  13. Janssen, J.E. The history of ventilation and temperature control. ASHRAE J. 1999, 41, 48–70. Available online: https://pdfs.semanticscholar.org/8635/e63c5d152314675bc076de0a19a2965ea1d4.pdf (accessed on 11 July 2019).
  14. Mathur, J.; Bansal, N.K.; Mathur, S.; Jain, M. Experimental investigations on solar chimney for room ventilation. Solar Energy 2006, 80, 927–935. Available online: https://linkinghub.elsevier.com/retrieve/pii/S0038092X05003014 (accessed on 27 August 2019). [CrossRef]
  15. Jianliu, X.; Weihua, L. Study on solar chimney used for room natural ventilation in Nanjing. Energy Build. 2013, 66, 467–469. [Google Scholar] [CrossRef]
  16. Nitatwichit, C.; Khunatorn, Y.; Tantakitti, C.; Tippayawong, N. Simulation of flow and thermal comfort zones in a Thai state school. J. Chin. Inst. Eng. 2012, 35, 115–128. [Google Scholar] [CrossRef]
  17. Chung, L.P.; Ahmad, M.H.; Ossen, D.R.; Hamid, M. Effective Solar Chimney Cross Section Ventilation Performance in Malaysia Terraced House. Procedia Soc. Behav. Sci. 2015, 179, 276–289. Available online: https://www.sciencedirect.com/science/article/pii/S1877042815017851 (accessed on 14 June 2019). [CrossRef] [Green Version]
  18. Imran, A.A.; Jalil, J.M.; Ahmed, S.T. Induced flow for ventilation and cooling by a solar chimney. Renew. Energy 2015, 78, 236–244. Available online: https://www.sciencedirect.com/science/article/pii/S0960148115000269 (accessed on 27 August 2019). [CrossRef]
  19. Asadi, S.; Fakhari, M.; Fayaz, R.; Mahdaviparsa, A. The effect of solar chimney layout on ventilation rate in buildings. Energy Build. 2016, 123, 71–78. Available online: https://www.sciencedirect.com/science/article/pii/S0378778816303036 (accessed on 27 August 2019). [CrossRef]
  20. Zha, X.; Zhang, J.; Qin, M. Experimental and Numerical Studies of Solar Chimney for Ventilation in Low Energy Buildings. Procedia Eng. 2017, 205, 1612–1619. Available online: https://www.sciencedirect.com/science/article/pii/S1877705817349597 (accessed on 27 August 2019). [CrossRef] [Green Version]
  21. Thantong, P.; Khedari, J.; Chantawong, P. Investigation of thermal performance by applying a solar chimney with PCM towards the natural ventilation of model house under Climate of Thailand. Mater. Today Proc. 2018, 5, 14862–14867. Available online: https://www.sciencedirect.com/science/article/pii/S2214785318306989 (accessed on 27 August 2019). [CrossRef]
  22. Elshafei, G.; Negm, A.; Bady, M.; Suzuki, M.; Ibrahim, M.G. Numerical and experimental investigations of the impacts of window parameters on indoor natural ventilation in a residential building. Energy Build. 2017, 141, 321–332. Available online: https://www.sciencedirect.com/science/article/pii/S0378778817306503 (accessed on 27 August 2019). [CrossRef]
  23. Khosravi, M.; Fazelpour, F.; Rosen, M.A. Improved application of a solar chimney concept in a two-story building: An enhanced geometry through a numerical approach. Renew. Energy 2019, 143, 569–585. Available online: https://www.sciencedirect.com/science/article/pii/S0960148119307025 (accessed on 30 July 2019). [CrossRef]
  24. de la Torre, S.; Yousif, C. Evaluation of chimney stack effect in a new brewery using DesignBuilder-EnergyPlus software. In Proceedings of the 6th International Conference on Sustainability in Energy and Buildings, Cardiff, UK, 25–27 June 2014; Howlett, R.J., Ed.; Elsevier Science BV: Amsterdam, The Netherlands, 2014; pp. 230–235. [Google Scholar]
  25. Zhang, G.; Fu, Z.; Yang, M.; Liu, X.; Dong, Y.; Li, X. Nonlinear simulation for coupling modeling of air humidity and vent opening in Chinese solar greenhouse based on CFD. Comput. Electron. Agric. 2019, 162, 337–347. Available online: http://www.sciencedirect.com/science/article/pii/S0168169918301121 (accessed on 1 September 2019). [CrossRef]
  26. Liu, S.; Pan, W.; Cao, Q.; Long, Z.; Jiang, Y.; Chen, Q. CFD simulations of natural cross ventilation through an apartment with modified hourly wind information from a meteorological station. Energy Build. 2019, 195, 16–25. [Google Scholar] [CrossRef]
  27. Valuation and Property Services Department (JPPH). The Residential Property Market in Perspective—Demand in Urban Centres in The Peninsular—Iproperty.com.My. Iproperty. 2018. Available online: https://www.iproperty.com.my/guides/the-residential-property-market-in-perspective-demand-in-urban-centres-in-the-peninsular/ (accessed on 1 September 2019).
  28. Kubota, T.; Ahmad, S. Wind Environment Evaluation of Neighborhood Areas in Major Towns of Malaysia. J. Asian Archit. Build. Eng. 2006, 5, 199–206. [Google Scholar] [CrossRef] [Green Version]
  29. Thomas Cook. Venture Into Borneo. 2012. Available online: http://1063457201.n137365.test.prositehosting.co.uk/wp-content/uploads/2012/03/Venture-into-Borneo.pdf (accessed on 27 August 2019).
  30. WMO. World Weather Information Service—Kuching. 2014. Available online: http://worldweather.wmo.int/en/home.html (accessed on 27 August 2019).
  31. Papakonstantinou, K.A.; Kiranoudis, C.T.; Markatos, N.C. Numerical simulation of air flow field in single-sided ventilated buildings. Energy Build. 2000, 33, 41–48. Available online: https://www.sciencedirect.com/science/article/pii/S0378778800000633 (accessed on 27 August 2019). [CrossRef]
  32. Nugroho, A.M.; Ahmad, M.H.; Ossen, D.R. A Preliminary Study of Thermal Comfort in Malaysia’s Single Storey Terraced Houses. J. Asian Archit. Build. Eng. 2007, 6, 175–182. Available online: https://www.tandfonline.com/doi/pdf/10.3130/jaabe.6.175?needAccess=true (accessed on 1 September 2019). [CrossRef]
  33. Baharvand, M. Natural Ventilation Performance of Double Skin Facade and Solar Chimney in Hot and Humid Climate. Ph.D. Thesis, Universiti Teknologi Malaysia, Skudai, Malaysia, 2014. [Google Scholar]
  34. Fumo, N.; Mago, P.; Luck, R. Methodology to estimate building energy consumption using EnergyPlus Benchmark Models. Energy Build. 2010, 42, 2331–2337. Available online: https://www.sciencedirect.com/science/article/pii/S0378778810002574 (accessed on 1 September 2019). [CrossRef]
  35. Gan, G.H. A parametric study of Trombe walls for passive cooling of buildings. Energy Build. 1998, 27, 37–43. [Google Scholar] [CrossRef]
  36. Hirunlabh, J.; Wachirapuwadon, S.; Pratinthong, N.; Khedari, J. New configurations of a roof solar collector maximizing natural ventilation. Build. Environ. 2001, 36, 383–391. Available online: https://www.sciencedirect.com/science/article/abs/pii/S0360132300000160 (accessed on 1 September 2019). [CrossRef]
  37. Afonso, C.; Oliveira, A. Solar chimneys: Simulation and experiment. Energy Build. 2000, 32, 71–79. Available online: https://www.sciencedirect.com/science/article/pii/S0378778899000389 (accessed on 1 September 2019). [CrossRef]
  38. Jing, H.; Chen, Z.; Li, A. Experimental study of the prediction of the ventilation flow rate through solar chimney with large gap-to-height ratios. Build. Environ. 2015, 89, 150–159. Available online: https://www.sciencedirect.com/science/article/abs/pii/S036013231500075X (accessed on 1 September 2019). [CrossRef]
Figure 1. Location of the single storey case study terraced house in Matang, Kuching, Sarawak.
Sustainability 11 05730 g001
Figure 2. Case study building (left) and location of the case study house (right).
Sustainability 11 05730 g002
Figure 3. The positions of HOBO U30 outdoor weather data logger (o) as well as HOBO U12 data logger (X) and test room position (hatched area).
Sustainability 11 05730 g003
Figure 4. Measured outdoor relative humidity and air temperature.
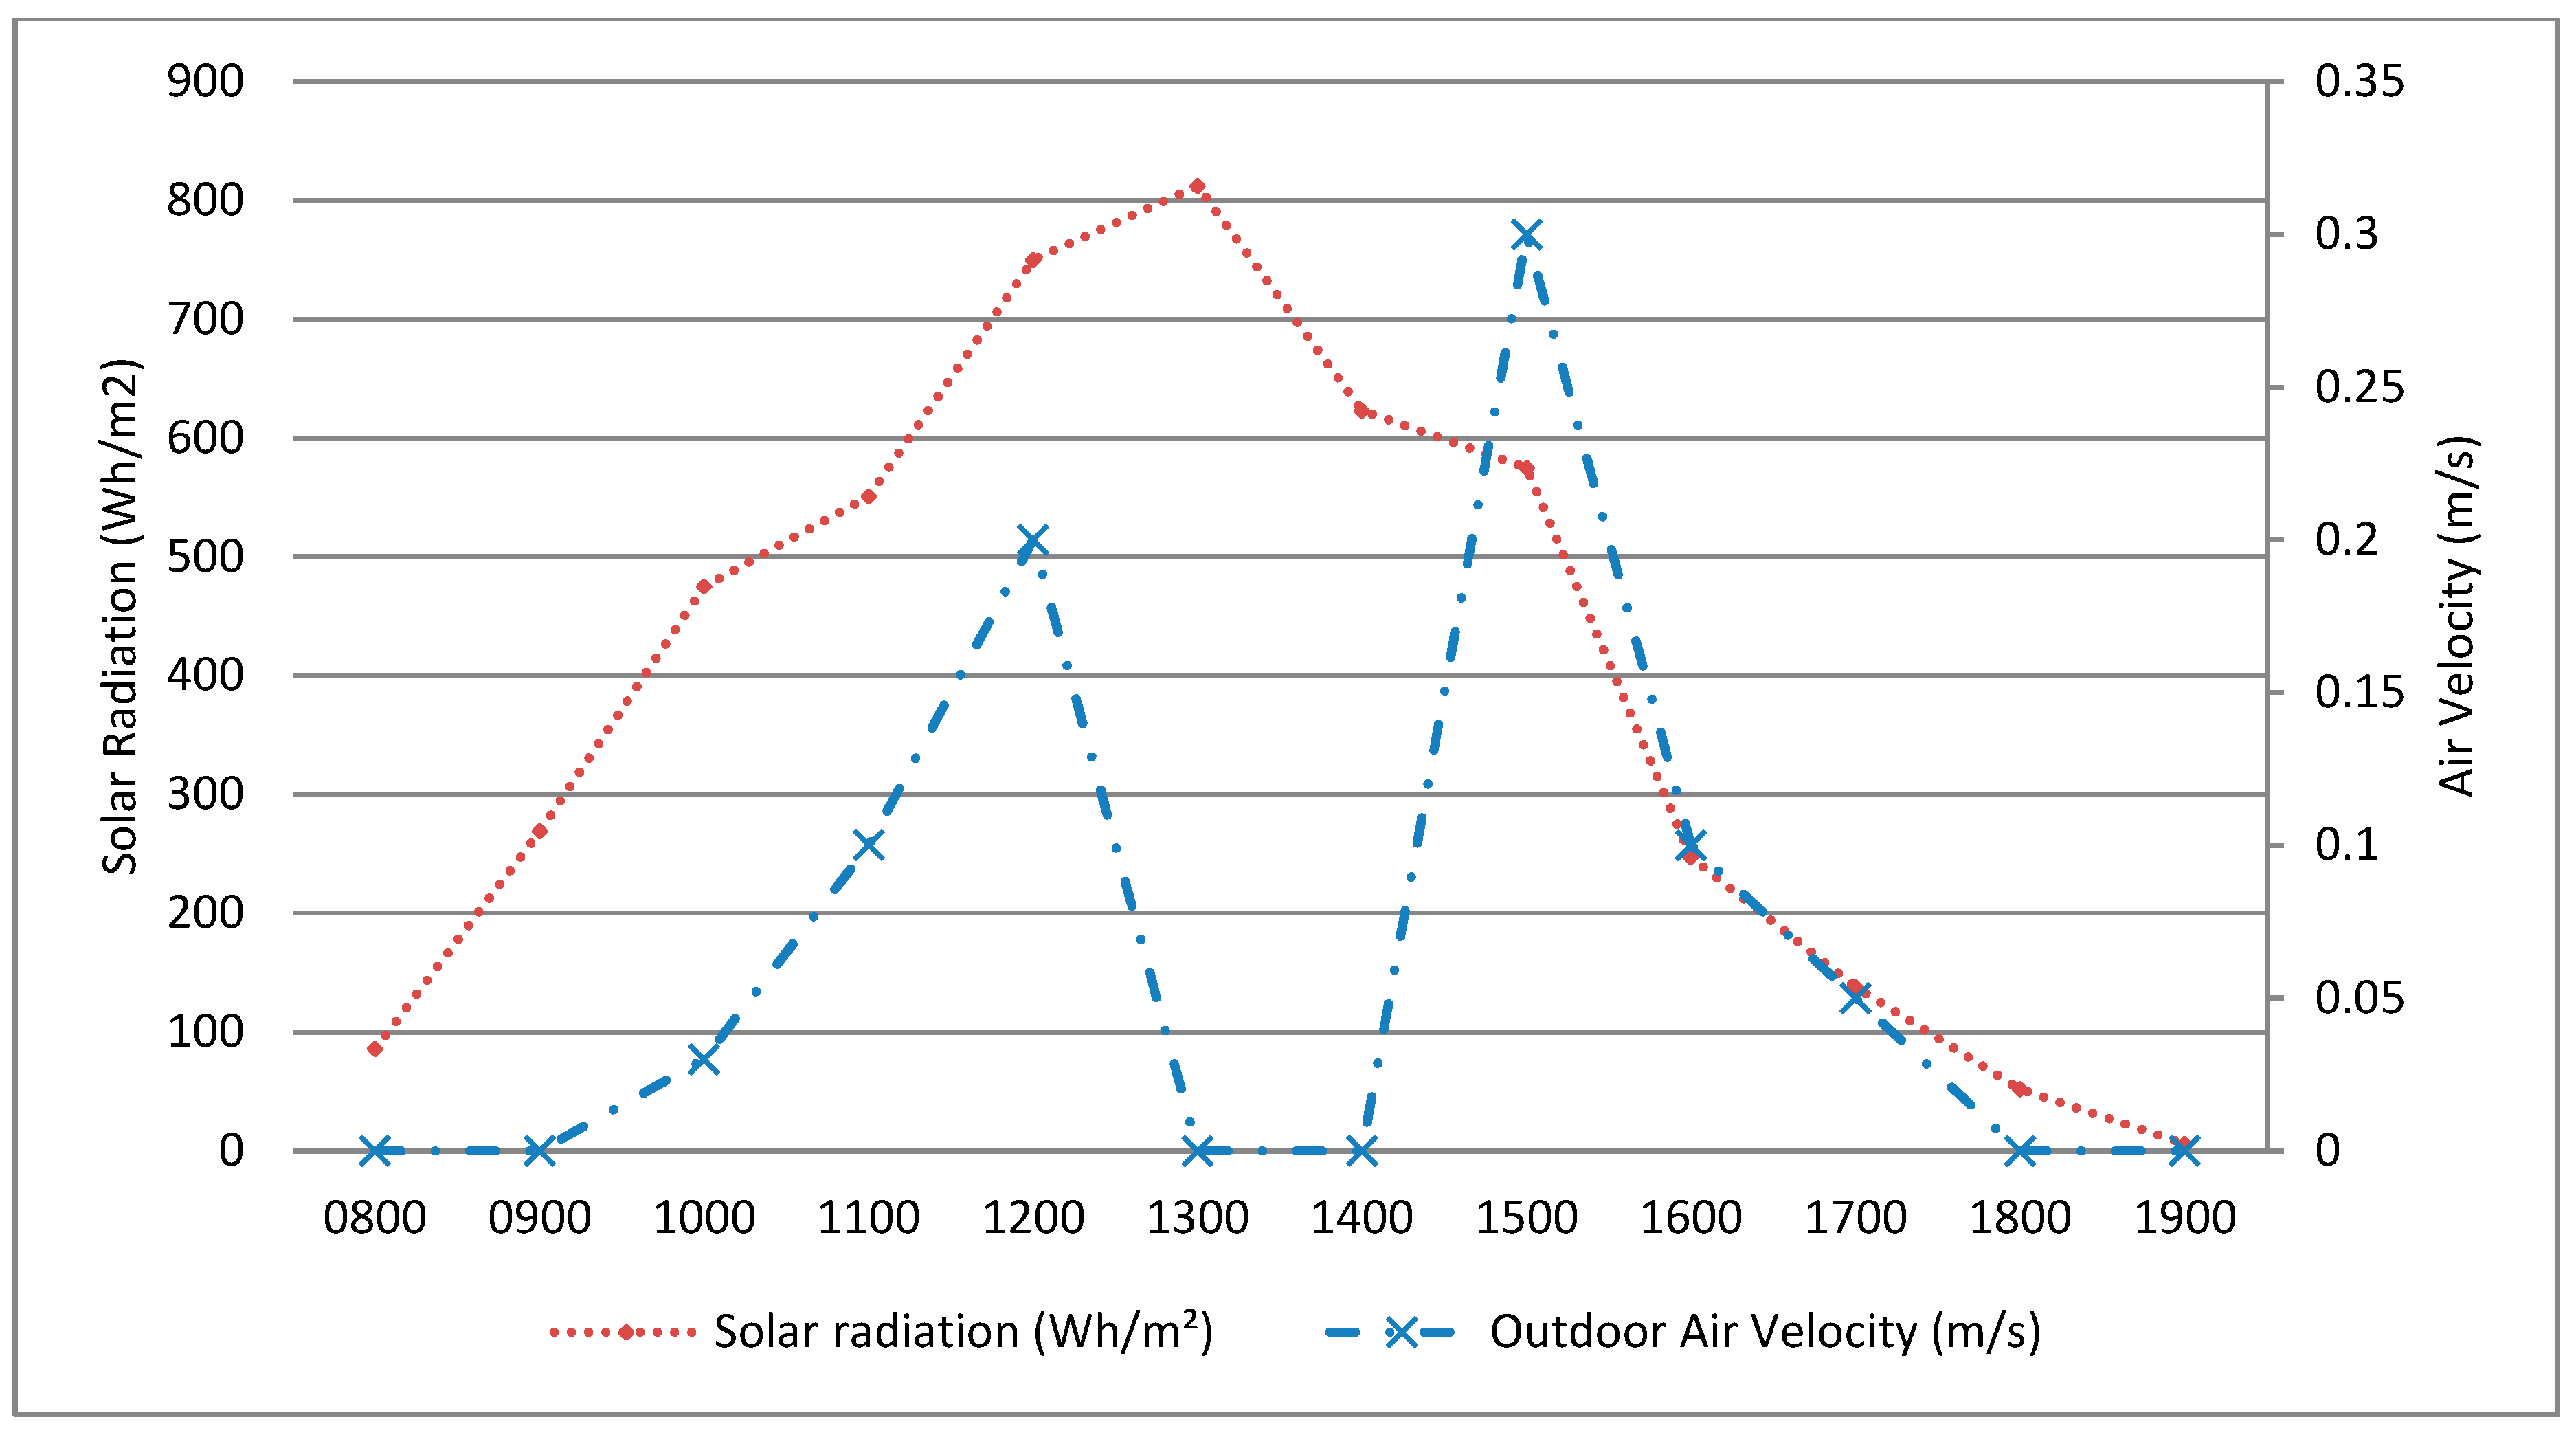
Sustainability 11 05730 g004
Figure 5. Measured outdoor air velocity and solar radiation was reliable and valid for ventilation and thermal studies.
Sustainability 11 05730 g005
Figure 6. Measured outdoor air velocity, measured test room air velocity and simulated test room air velocity.
Sustainability 11 05730 g006
Figure 7. Measured outdoor air temperature, measured test room air temperature and simulated test room air temperature.
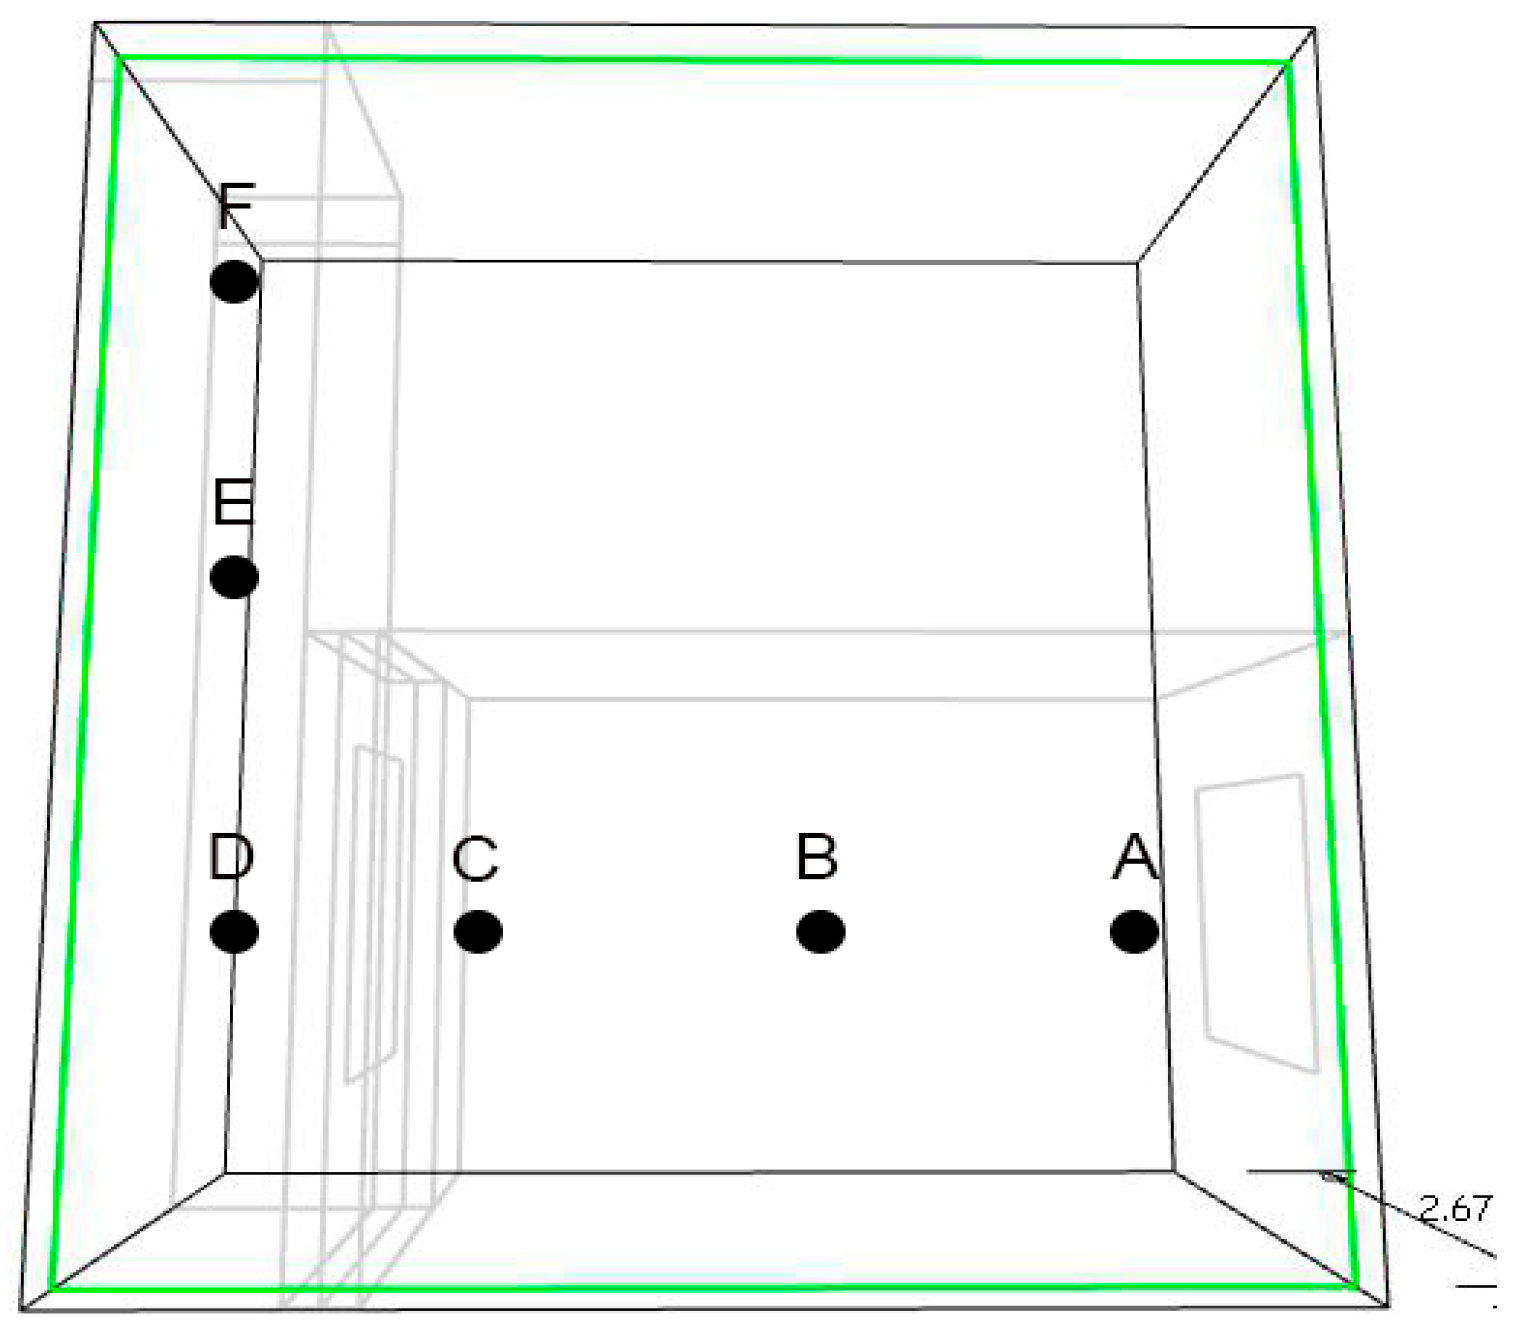
Sustainability 11 05730 g007
Figure 8. Monitoring points of test room and solar chimney in the CFD model (6.23).
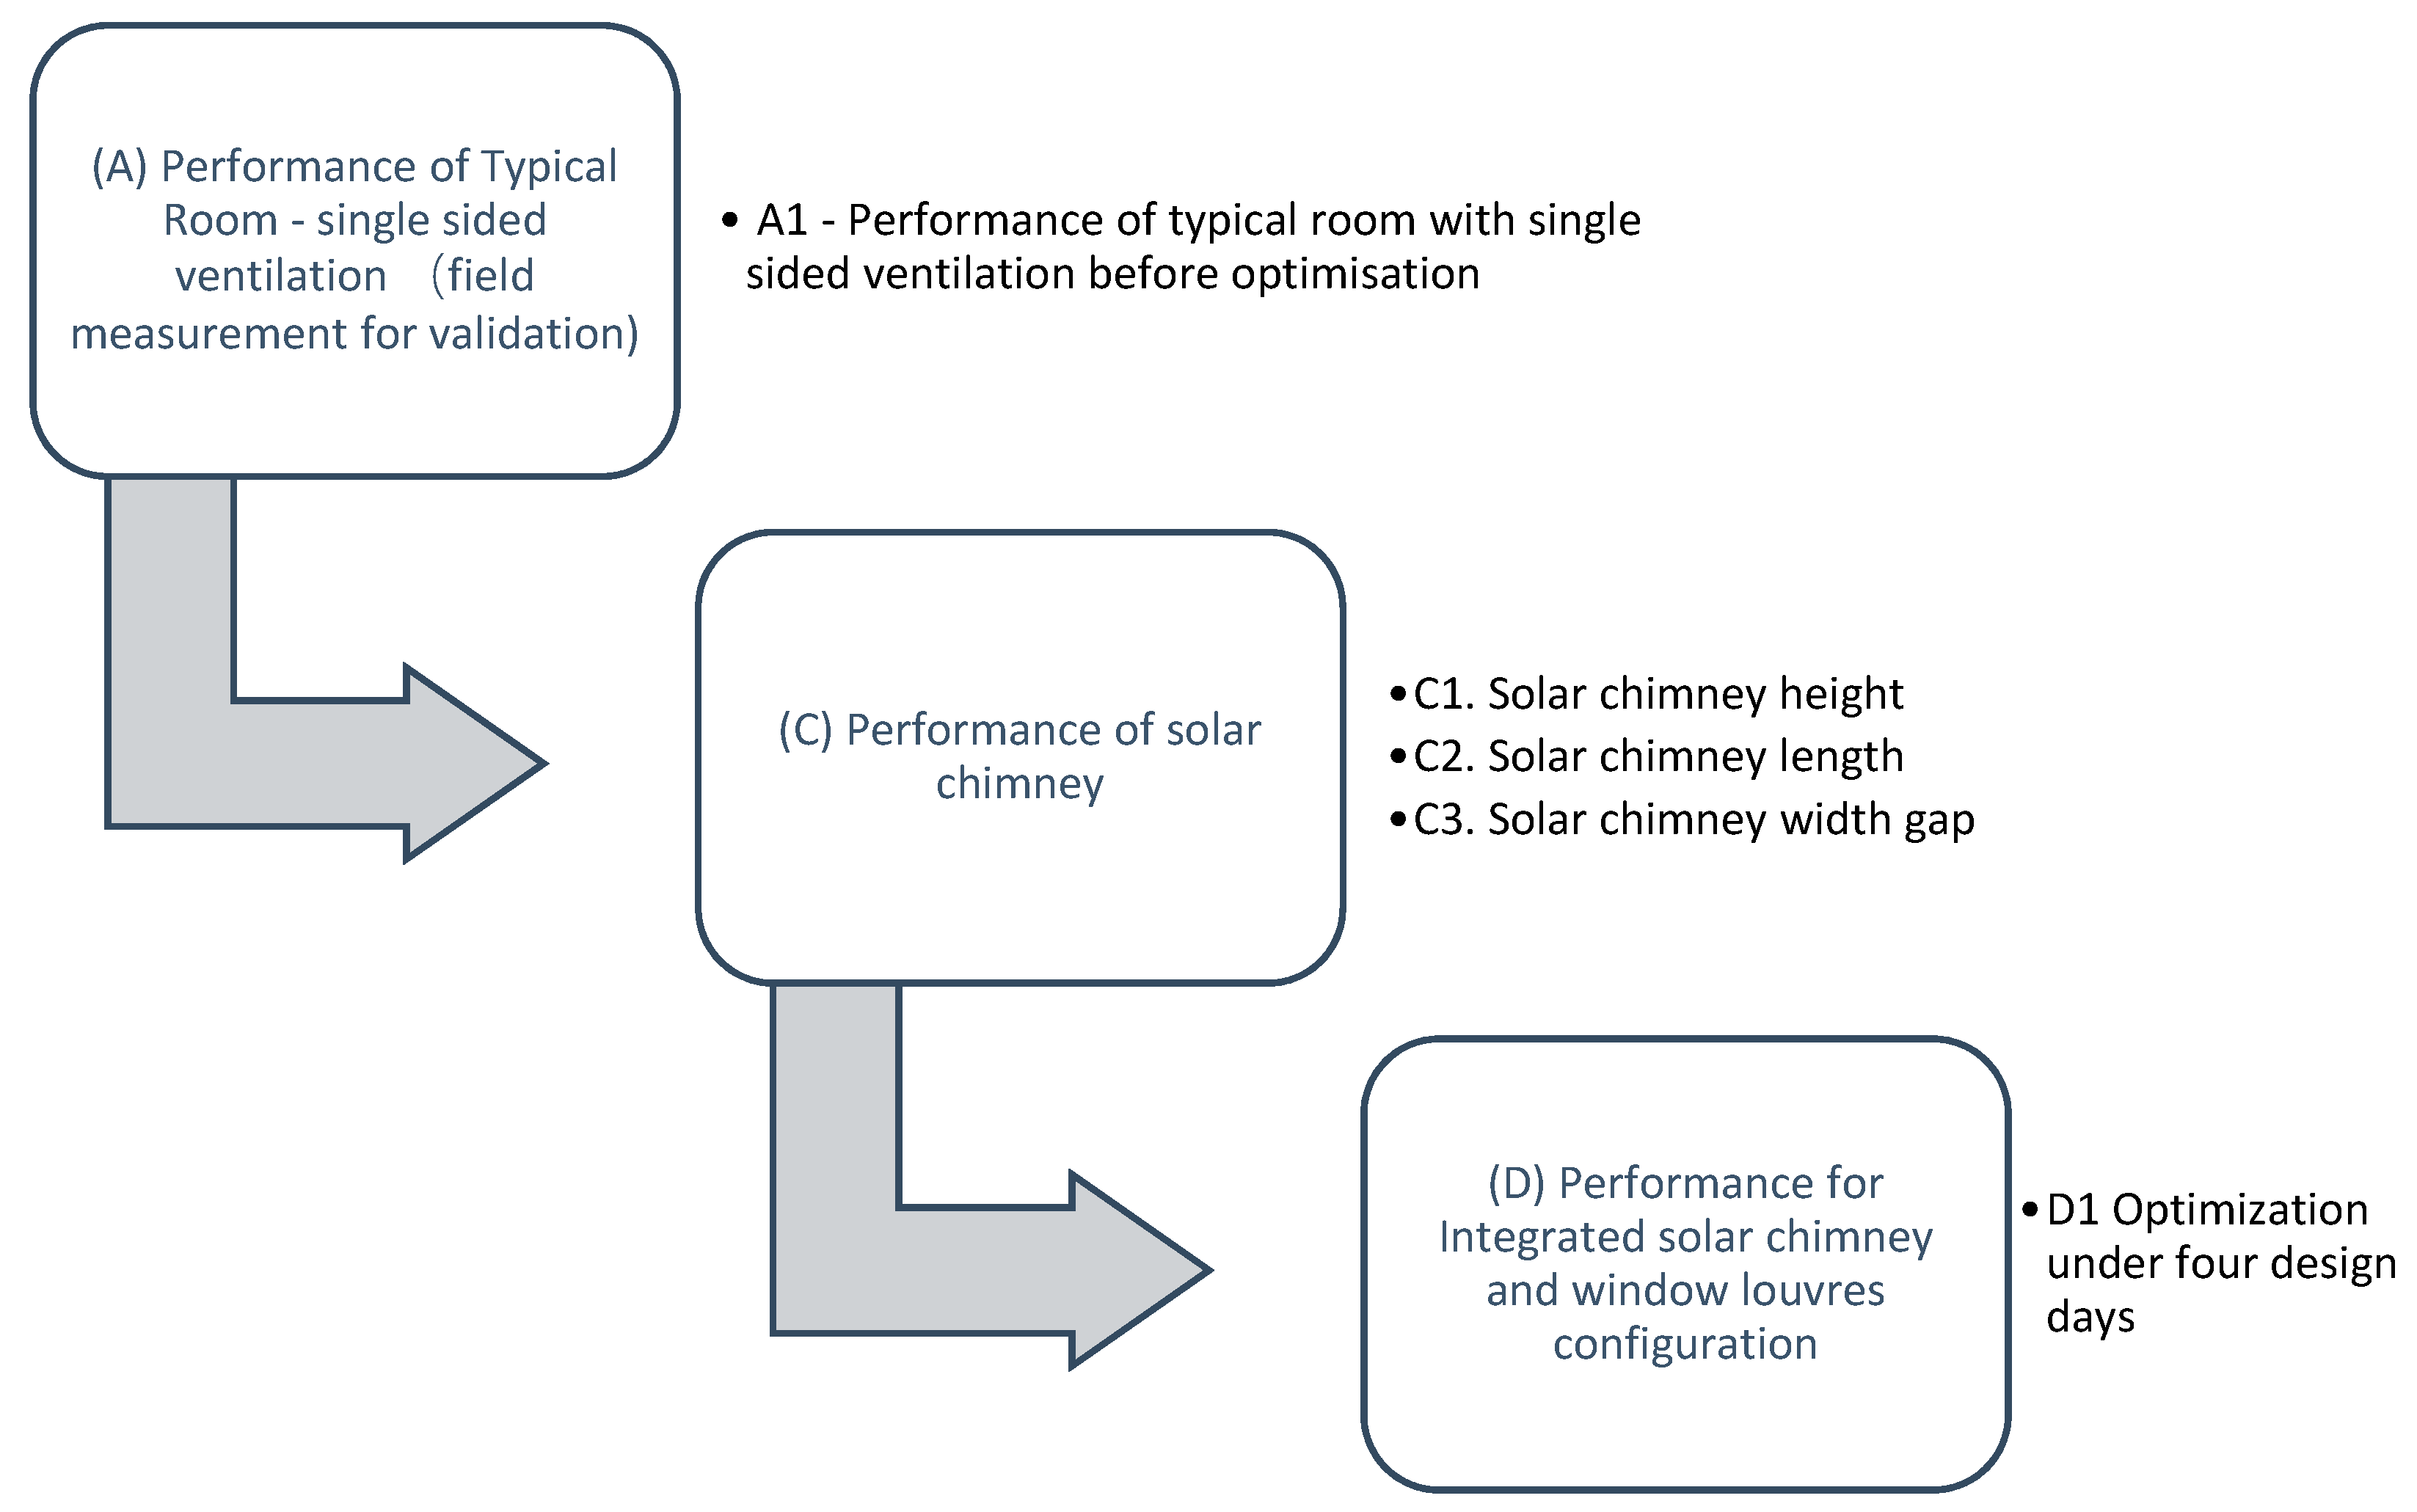
Sustainability 11 05730 g008
Figure 9. Modelling and optimization sequences with tested parameters in this study.
Sustainability 11 05730 g009
Figure 10. Monitoring point for air well/solar chimney model in selected climatic condition: (a) plan view & (b) section view show the position of air well/solar chimney while (c) plan view & (d) section view show the monitoring points for the test room and air well/solar chimney.
Sustainability 11 05730 g010
Figure 11. Optimization of solar chimney in relation to air velocity and air temperature (6.25).
Sustainability 11 05730 g011
Figure 12. Comparison of air flow pattern between different solar chimney height in sectional and plan perspective view.
Sustainability 11 05730 g012
Figure 13. Optimization of solar chimney width gap in relation to air velocity and air temperature (6.27).
Sustainability 11 05730 g013
Figure 14. Comparison of air flow pattern between different solar chimney width gap in sectional and plan perspective view (6.28).
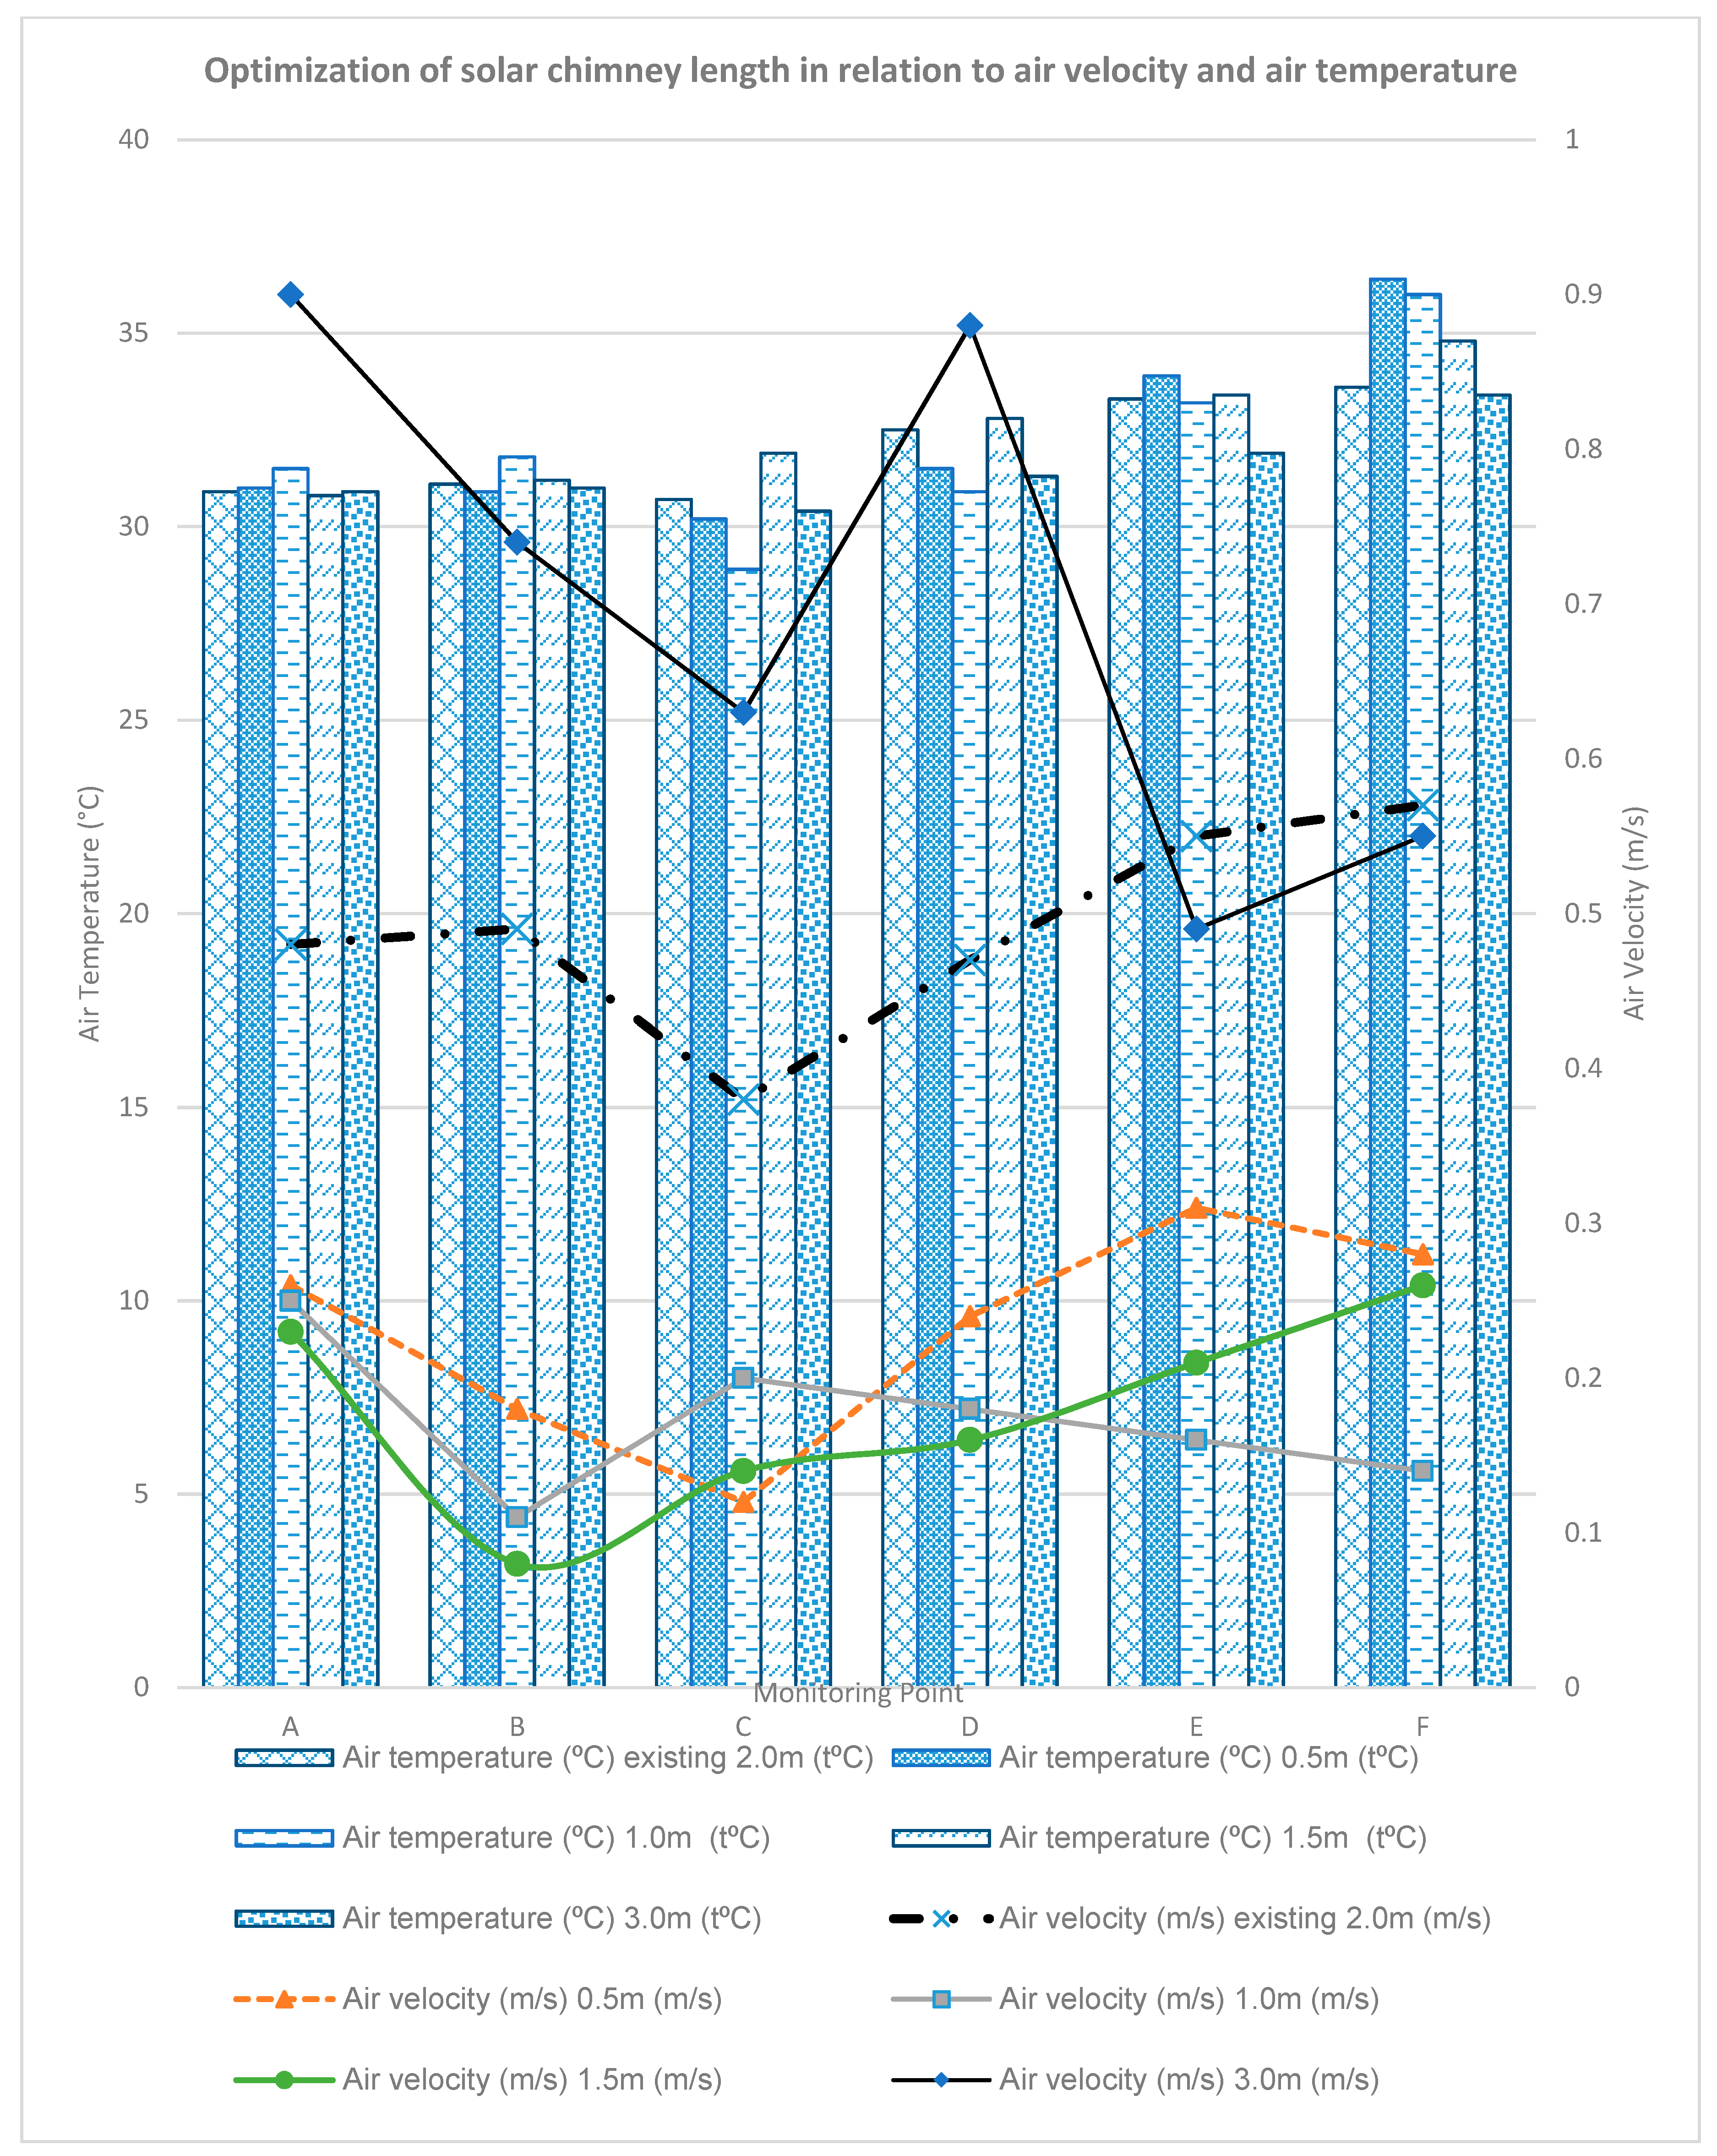
Sustainability 11 05730 g014
Figure 15. Optimization of solar chimney length in relation to air velocity and air temperature (6.29).
Sustainability 11 05730 g015
Figure 16. Comparison of air flow pattern between different solar chimney length in sectional and plan perspective view.
Sustainability 11 05730 g016
Figure 17. Air temperature and air velocity results of optimized air well with a clear opening.
Sustainability 11 05730 g017
Figure 18. Air temperature and air velocity for optimized air well/solar chimney with a clear opening (21 March) (6.32).
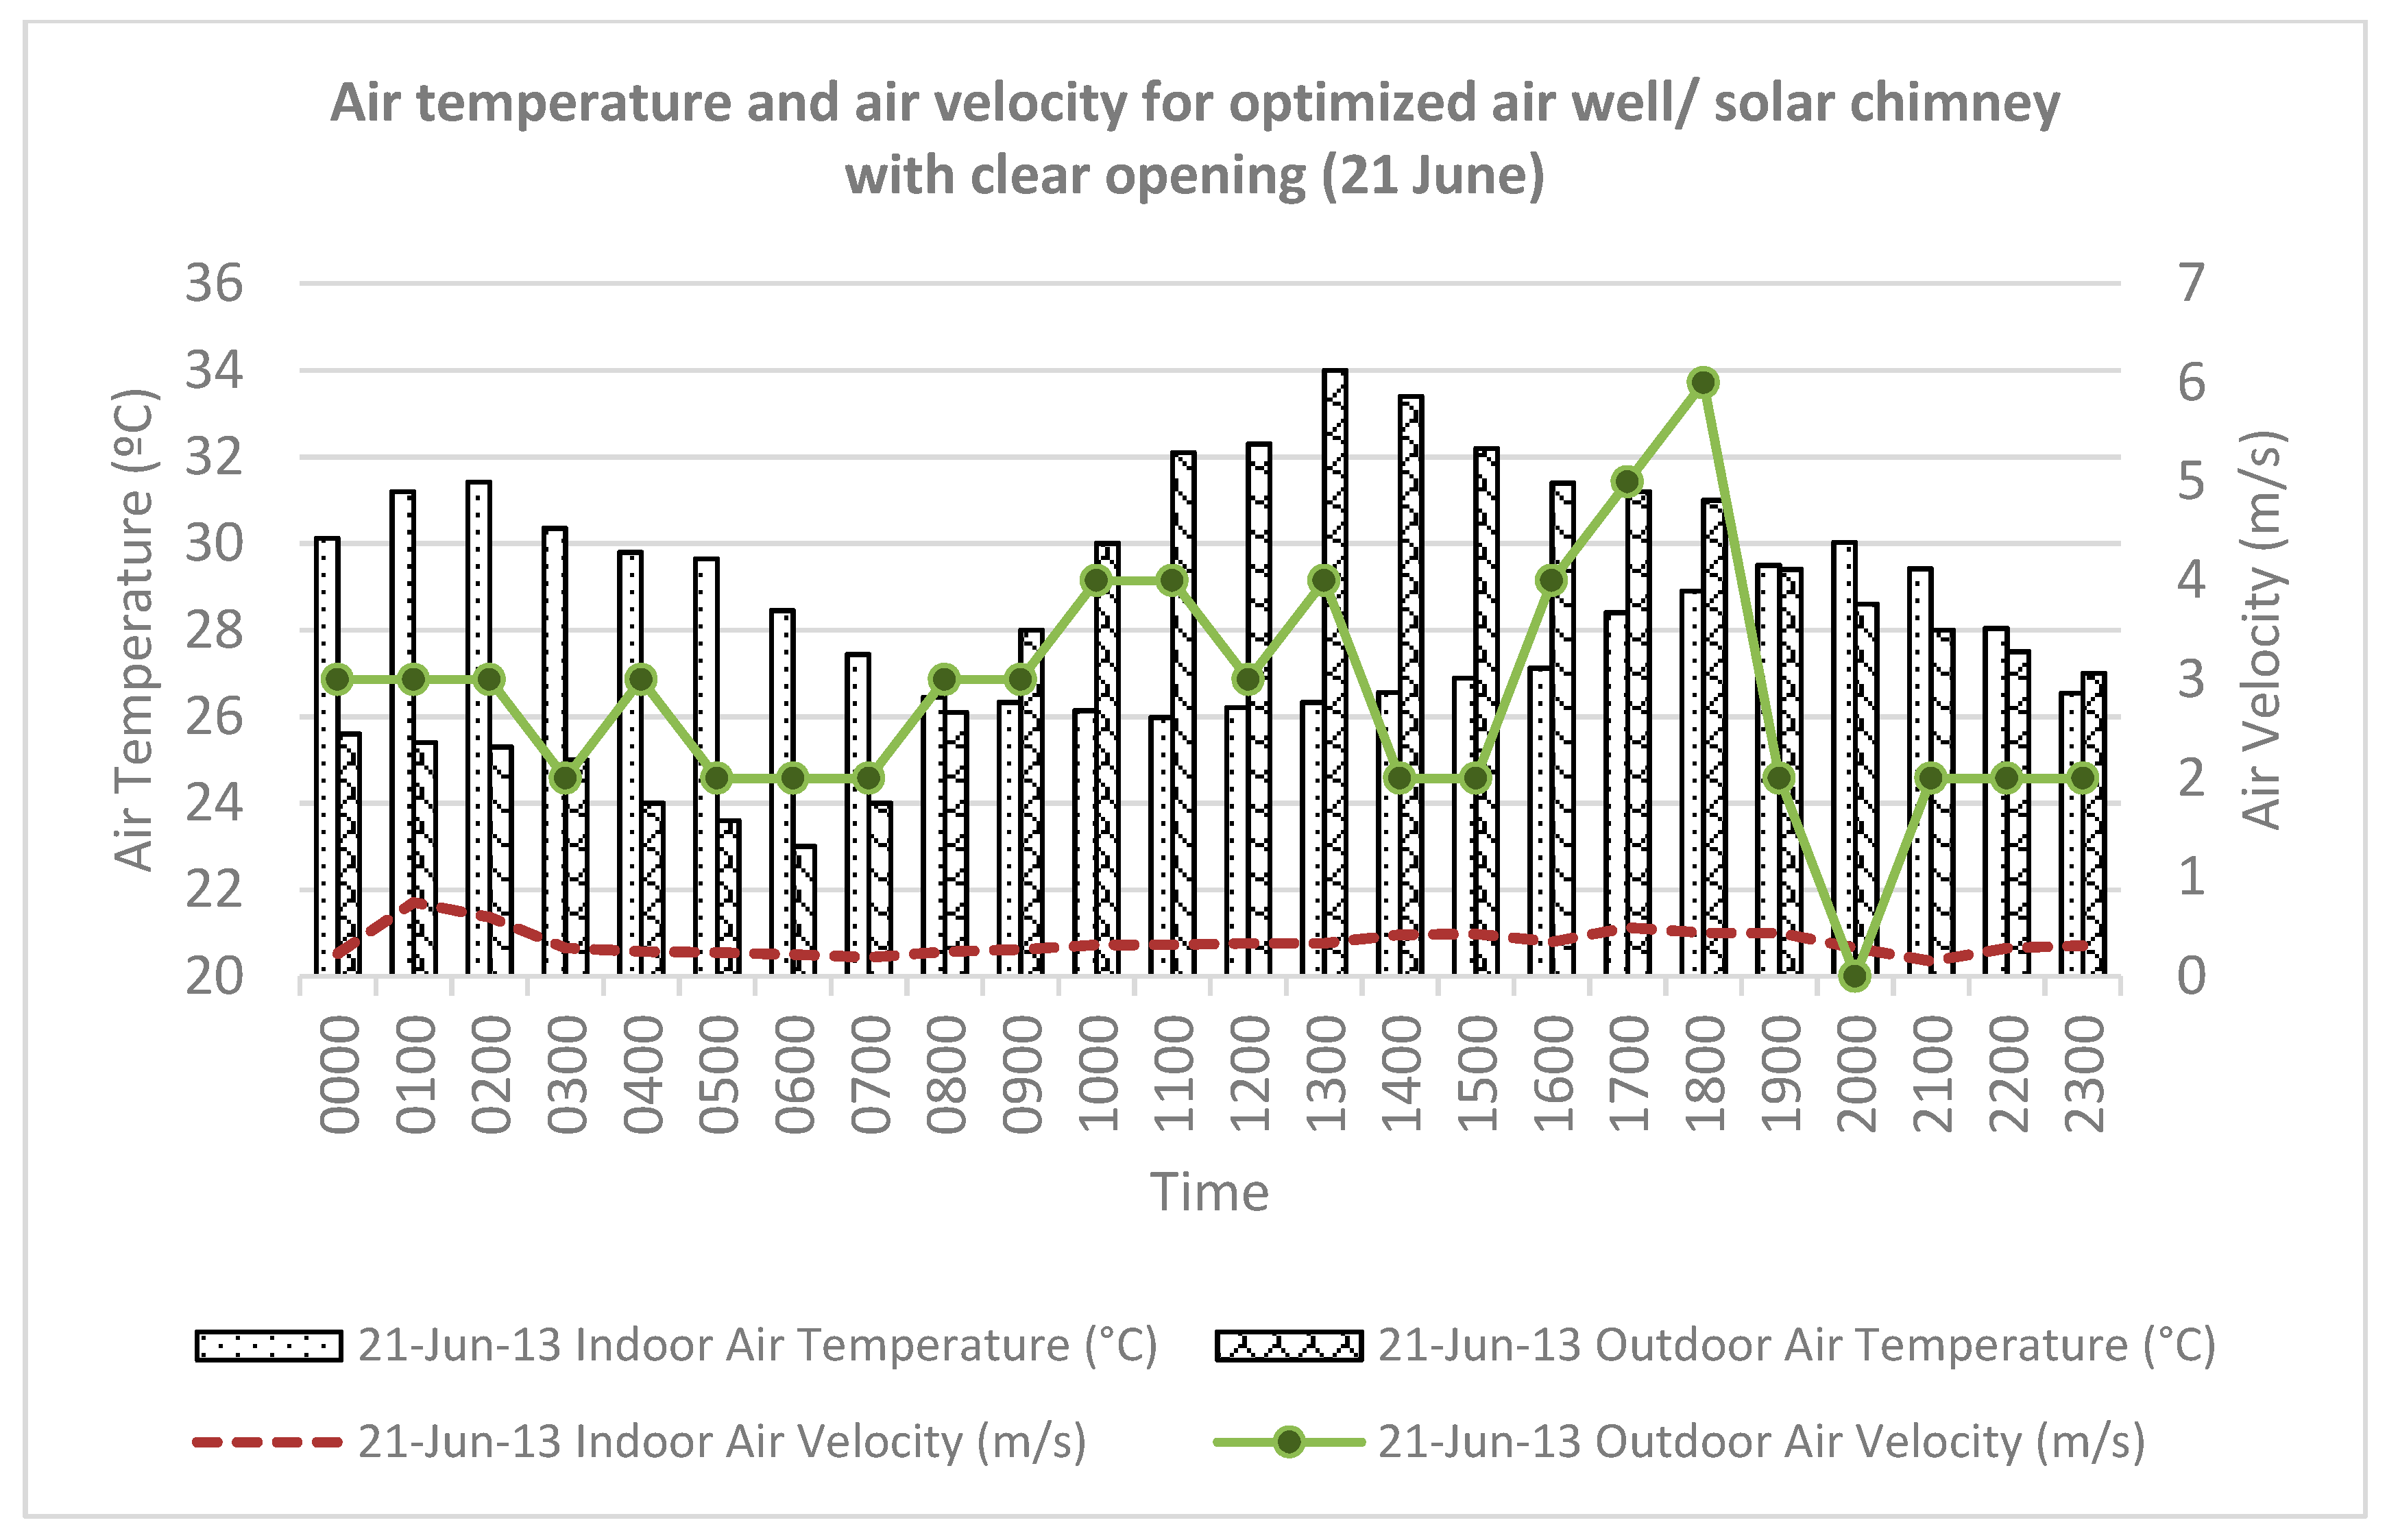
Sustainability 11 05730 g018
Figure 19. Air temperature and air velocity for optimized air well/solar chimney with clear opening (21 June) (6.33).
Sustainability 11 05730 g019
Figure 20. Air temperature and air velocity for optimized air well/solar chimney with clear opening (21 Sept) (6.34).
Sustainability 11 05730 g020
Figure 21. Air temperature and air velocity for optimized air well/solar chimney with clear opening (21 Dec) (6.35).
Sustainability 11 05730 g021
Figure 22. Air temperature and air velocity of optimized air well with optimized louvered opening.
Sustainability 11 05730 g022
Figure 23. Air temperature and air velocity for optimized air well/solar chimney with optimized louvres ‘opening (21 March) (6.37).
Sustainability 11 05730 g023
Figure 24. Air temperature and air velocity for optimized air well/solar chimney with optimized louvres ‘opening (21 June) (6.38).
Sustainability 11 05730 g024
Figure 25. Air temperature and air velocity for optimized air well/solar chimney with optimized louvres ‘opening (21 Sept) (6.39).
Sustainability 11 05730 g025
Figure 26. Air temperature and air velocity for optimized air well/solar chimney with optimized louvres‘ opening (21 Dec).
Sustainability 11 05730 g026
Table 1. Mean monthly air temperature (1971–2000) at Kuching, Sarawak, Malaysia [30].
MonthMean High Temperature (°C)Mean Low Temperature (°C)MonthMean High Temperature (°C)Mean Low Temperature (°C)
January29.822.9July32.423
February30.223August32.423
March31.323.2September3222.9
April32.323.4October31.922.9
May32.723.6November31.622.9
June32.723.3December30.623.1
Table 2. The measurement instruments, parameters and time intervals for validation and verification.
RoomData TypeEquipmentInterval
Testroom (bedroom two) Air temperature (±0.63 °F from 32 to 122 °F). Relative humidity (±2.5% from 10% to 90% RH). Air velocity 0.15 to 1.0 m/s (30 to 200 fpm): ± (1% of reading + 0.05 m/s (10 fpm)). HOBO U12 data logger 15 min
Outdoor Air temperature (±0.63 °F from 32 to 122 °F). Solar radiation typically within ±10 W/m2 or ±5%, whichever is greater in sunlight, wind velocity (± 1.1 m/s (2.4 mph) or ± 4% of reading whichever is greater).
Relative humidity (±2.5% from 10% to 90% RH).
HOBO U30 weather station 15 min
Table 3. Field measurement input data for computational fluid dynamic (CFD) simulation.
TimeAir Temperature (°C)Relative Humidity (%)Wind Velocity (m/s)
080025840
090026890
100026890.03
110028790.1
120028790.2
130028.8740
140027840
150027.9800.3
160030740.1
170028.3860.05
180028790
190027840
Table 4. Construction materials, reference U-values and thermal conductivity of the base model.
Building ComponentConstruction LayersReference U-Value (W/m2K)Thermal Conductivity (W/m-k)Solar Heat Gain Coefficient Visible Light Transmission
External and internal walls20 mm thick cement plaster + 100 mm thick clay brick + 20 mm thick cement plaster2.750.7NilNil
External glazing of solar chimney/air well6 mm thick single layer clear glass5.70.960.565
Room’s external window and internal window6 mm thick single layer clear glass5.70.960.565
Floor slab8 mm thick ceramic tile + 22 mm thick cement screed + 100 mm thick concrete slab3.750.6NilNil
Table 5. Summary of highest and lowest monthly mean air temperature and its monthly mean air speed for ten years’ data (2003–2013), year 2012 and year 2013.
TimeHighest Monthly Mean Air Temperature (°C)MonthMonthly Mean Air Velocity (m/s)
2003–2013 (10 years)27.23May1.75
201229.73June1.69
201329.68June1.57
TimeLowest Monthly Mean Air Temperature (°C)MonthMonthly Mean Air Velocity (m/s)
2003–2013 (10 years)26.95January1.97
201226.02February1.50
201326.07December1.56
Table 6. Coordinate of monitoring points as shown in Figure 8.
ABCDE
X = −1.20; Y=−1.5; Z=1.5X = 0.95; Y = −1.55; Z = 1.5X = 2.00; Y = −1.55; Z = 1.5X = 3.0; Y = −1.55; Z = 1.5X = 5.05; Y = −1.55; Z = 1.5
Table 7. Boundary condition for simulation.
Boundary Condition for Simulation
Outdoor Air Temperature34 °C (monthly mean max of year 2013)
Solar Radiation988 W/m2 (monthly mean max of year 2013)
Outdoor Wind Speed1.16 m/s at 10 m height
Relative Humidity84.4%
Cloud Cover7.0 Oktas
Air Pressure1009.7 hPa
Wind Direction180°
Table 8. Internal air temperature and air velocity at the test room with enhanced solar chimney (6.3).
Thermal ConditionInternal Air Temperature (°C) and Air Velocity (m/s) in the Test Room
Existing Test RoomTest Room with Enhanced Solar Chimney
Air Temperature (°C)Air Velocity (m/s)Air Temperature (°C)Air Velocity (m/s)
Hot Day (19 June 2014, 1700 h)33.480.0231.420.29
Cold Day (24 Jan 2014, 0600 h)23.550.0024.150.12
Normal Day (2 Feb 2014, 1800 h)26.230.0127.850.18

