Article

Development of a Data-Driven Predictive Model of Clothing Thermal Insulation Estimation by Using Advanced Computational Approaches

1
Building Energy Center, Energy Division, KCL (Korea Conformity Laboratories), Seoul 27872, Korea
2
Department of Architecture & Architectural Engineering, Yonsei University, Seoul 03722, Korea
3
School of Architecture, University of Southern California, Los Angeles, CA 90089, USA
*
Author to whom correspondence should be addressed.
Sustainability 2019, 11(20), 5702; https://doi.org/10.3390/su11205702
Submission received: 19 September 2019 / Revised: 13 October 2019 / Accepted: 14 October 2019 / Published: 15 October 2019
(This article belongs to the Section Energy Sustainability)

Abstract

:
Clothing condition was selected as a key human-subject-relevant parameter which is dynamically changed depending on the user’s preferences and also on climate conditions. While the environmental components are relatively easier to measure using sensor devices, clothing value (clo) is almost impossible to visually estimate because it varies across building occupants even though they share constant thermal conditions in the same room. Therefore, in this study we developed a data-driven model to estimate the clothing insulation value as a function of skin and clothing surface temperatures. We adopted a series of environmental chamber tests with 20 participants. A portion of the collected data was used as a training dataset to establish a data-driven model based on the use of advanced computational algorithms. To consider a practical application, in this study we minimized the number of sensing points for data collection while adopting a wearable device for the user’s convenience. The study results revealed that the developed predictive model generated an accuracy of 88.04%, and the accuracy became higher in the prediction of a high clo value than in that of a low value. In addition, the accuracy was affected by the user’s body mass index. Therefore, this research confirms that it is possible to develop a data-driven predictive model of a user’s clo value based on the use of his/her physiological and ambient environmental information, and an additional study with a larger dataset via using chamber experiments with additional test participants is required for better performance in terms of prediction accuracy.

1. Introduction

Maintaining a comfortable thermal environment for occupants in an indoor space is the most important goal of an heating, ventilation, and air conditioning (HVAC) system [1]. In order to evaluate thermal comfort, many indices have been presented, including effective temperature (ET), operative temperature (OT), standard effective temperature (SET), and even a thermoregulation model [2,3]. In particular, the predicted mean vote (PMV) model proposed by Fanger [4], applied to ASHRAE Standard 55 [5], is the most widely used for evaluating thermal comfort. The PMV model is based on a mathematical equation and is limited in that it does not reflect the physiological characteristics of each occupant [6]. Nonetheless, the PMV model is still the most-used model for thermal comfort evaluation and HVAC system control.
The PMV model evaluates thermal comfort by using six factors: air temperature, mean radiant temperature, relative humidity, air velocity, clothing thermal insulation, and metabolic rate. Among those six factors, the human factors, clothing thermal insulation and metabolic rate, are known to be difficult to measure. Accurate clothing thermal insulation can only be determined through precise measurements in the laboratory [7]. However, since this process is laborious, major international standards provide a table established by measuring the thermal insulation of several clothing items in advance [5,8], which has been significantly adopted by industry and academia. In practice, one [9,10], two [11,12,13,14,15], or three [16] clothing ensembles have been assumed and the total clothing thermal insulation calculated by referring to the tables to evaluate thermal comfort or control an HVAC system based on the PMV model.
However, in reality, clothing ensembles vary individually and seasonally [17,18]. In addition, a clothing ensemble could be changed within a short period of time with an option of putting clothes on or taking them off. Accordingly, the conventional method that adopts a fixed representational clothing (clo) value—without consideration of a clothing ensemble value, dynamically changing over time—may contribute to causing errors in thermal comfort prediction [19].
Evaluating the clo value dynamically is also important for energy savings. Newsham [20] reported that increasing clothing flexibility could affect energy consumption. Lee and Schiavon [21] showed that the energy analysis results for PMV model control could be incorrect when using a conventional method for applying 0.5 clo and 1.0 clo for the cooling and heating seasons, respectively.
Several recent studies have been conducted to predict clo values dynamically. De Carli et al. [22] and Schiavon et al. [11] constructed a model that predicts clo values based on the outdoor temperature at 6 a.m., because people mainly decide on their clothing ensemble according to the weather in the morning. However, these predictive models do not reflect the fact that occupants can change their clothing ensemble depending on the situation.
Some researchers used a heat balance model, rather than the outdoor temperature, to predict clo values in real time. M. Konarska et al. [23] measured the skin temperature of each part of the human body and applied these temperatures to the heat balance model to calculate the clo value. Lee et al. [24] and Miura et al. [25] suggested a predictive model for evaluating the clo value by measuring several local skin temperatures and clothing surface temperatures using an infrared camera and calculating the heat balance equation. These studies showed the possibility of using a predictive model to estimate clo values in real time. However, since the heat balance model adopted in the predictive models discussed above depends on predefined computational formulas, they have a significant limitation in that they do not consider individual physiological characteristics, such as body mass index (BMI) [26]. Previous studies have reported that the clothing thermal insulation predicted by the heat balance model was significantly different from the actual one [27,28,29]. In addition, many studies of thermal comfort [6,30,31,32,33] have proposed a more accurate model that predicts thermal comfort by using physiological factors.
In recent years, a data-driven approach has been actively used to evaluate personal thermal comfort by considering physiological factors [34]. Jiang and Yao [35] modeled the individual’s thermal sensation using the C-support vector classification algorithm, which is a type of data-driven method. They showed that the accuracy of the predictive model was above 89% against the measured data. Ghahramani et al. [36] predicted the individual’s thermal comfort using infrared thermography of the human face and collected thermal comfort votes. Through statistical analysis, this study revealed that four points of the human face—front face, cheekbone, nose, and ear—played an important role in predicting personal thermal comfort. Recently, Choi and Yeom [6] developed a data-driven thermal sensation prediction model as a function of local body skin temperatures. They showed that a combination of the waist, arm, and wrist (front), as well as BMI and gender, could be used to estimate overall thermal sensation with 95.87% accuracy. However, to the authors’ knowledge, there has not yet been an attempt to estimate clothing insulation using data-driven methods, not thermal comfort.
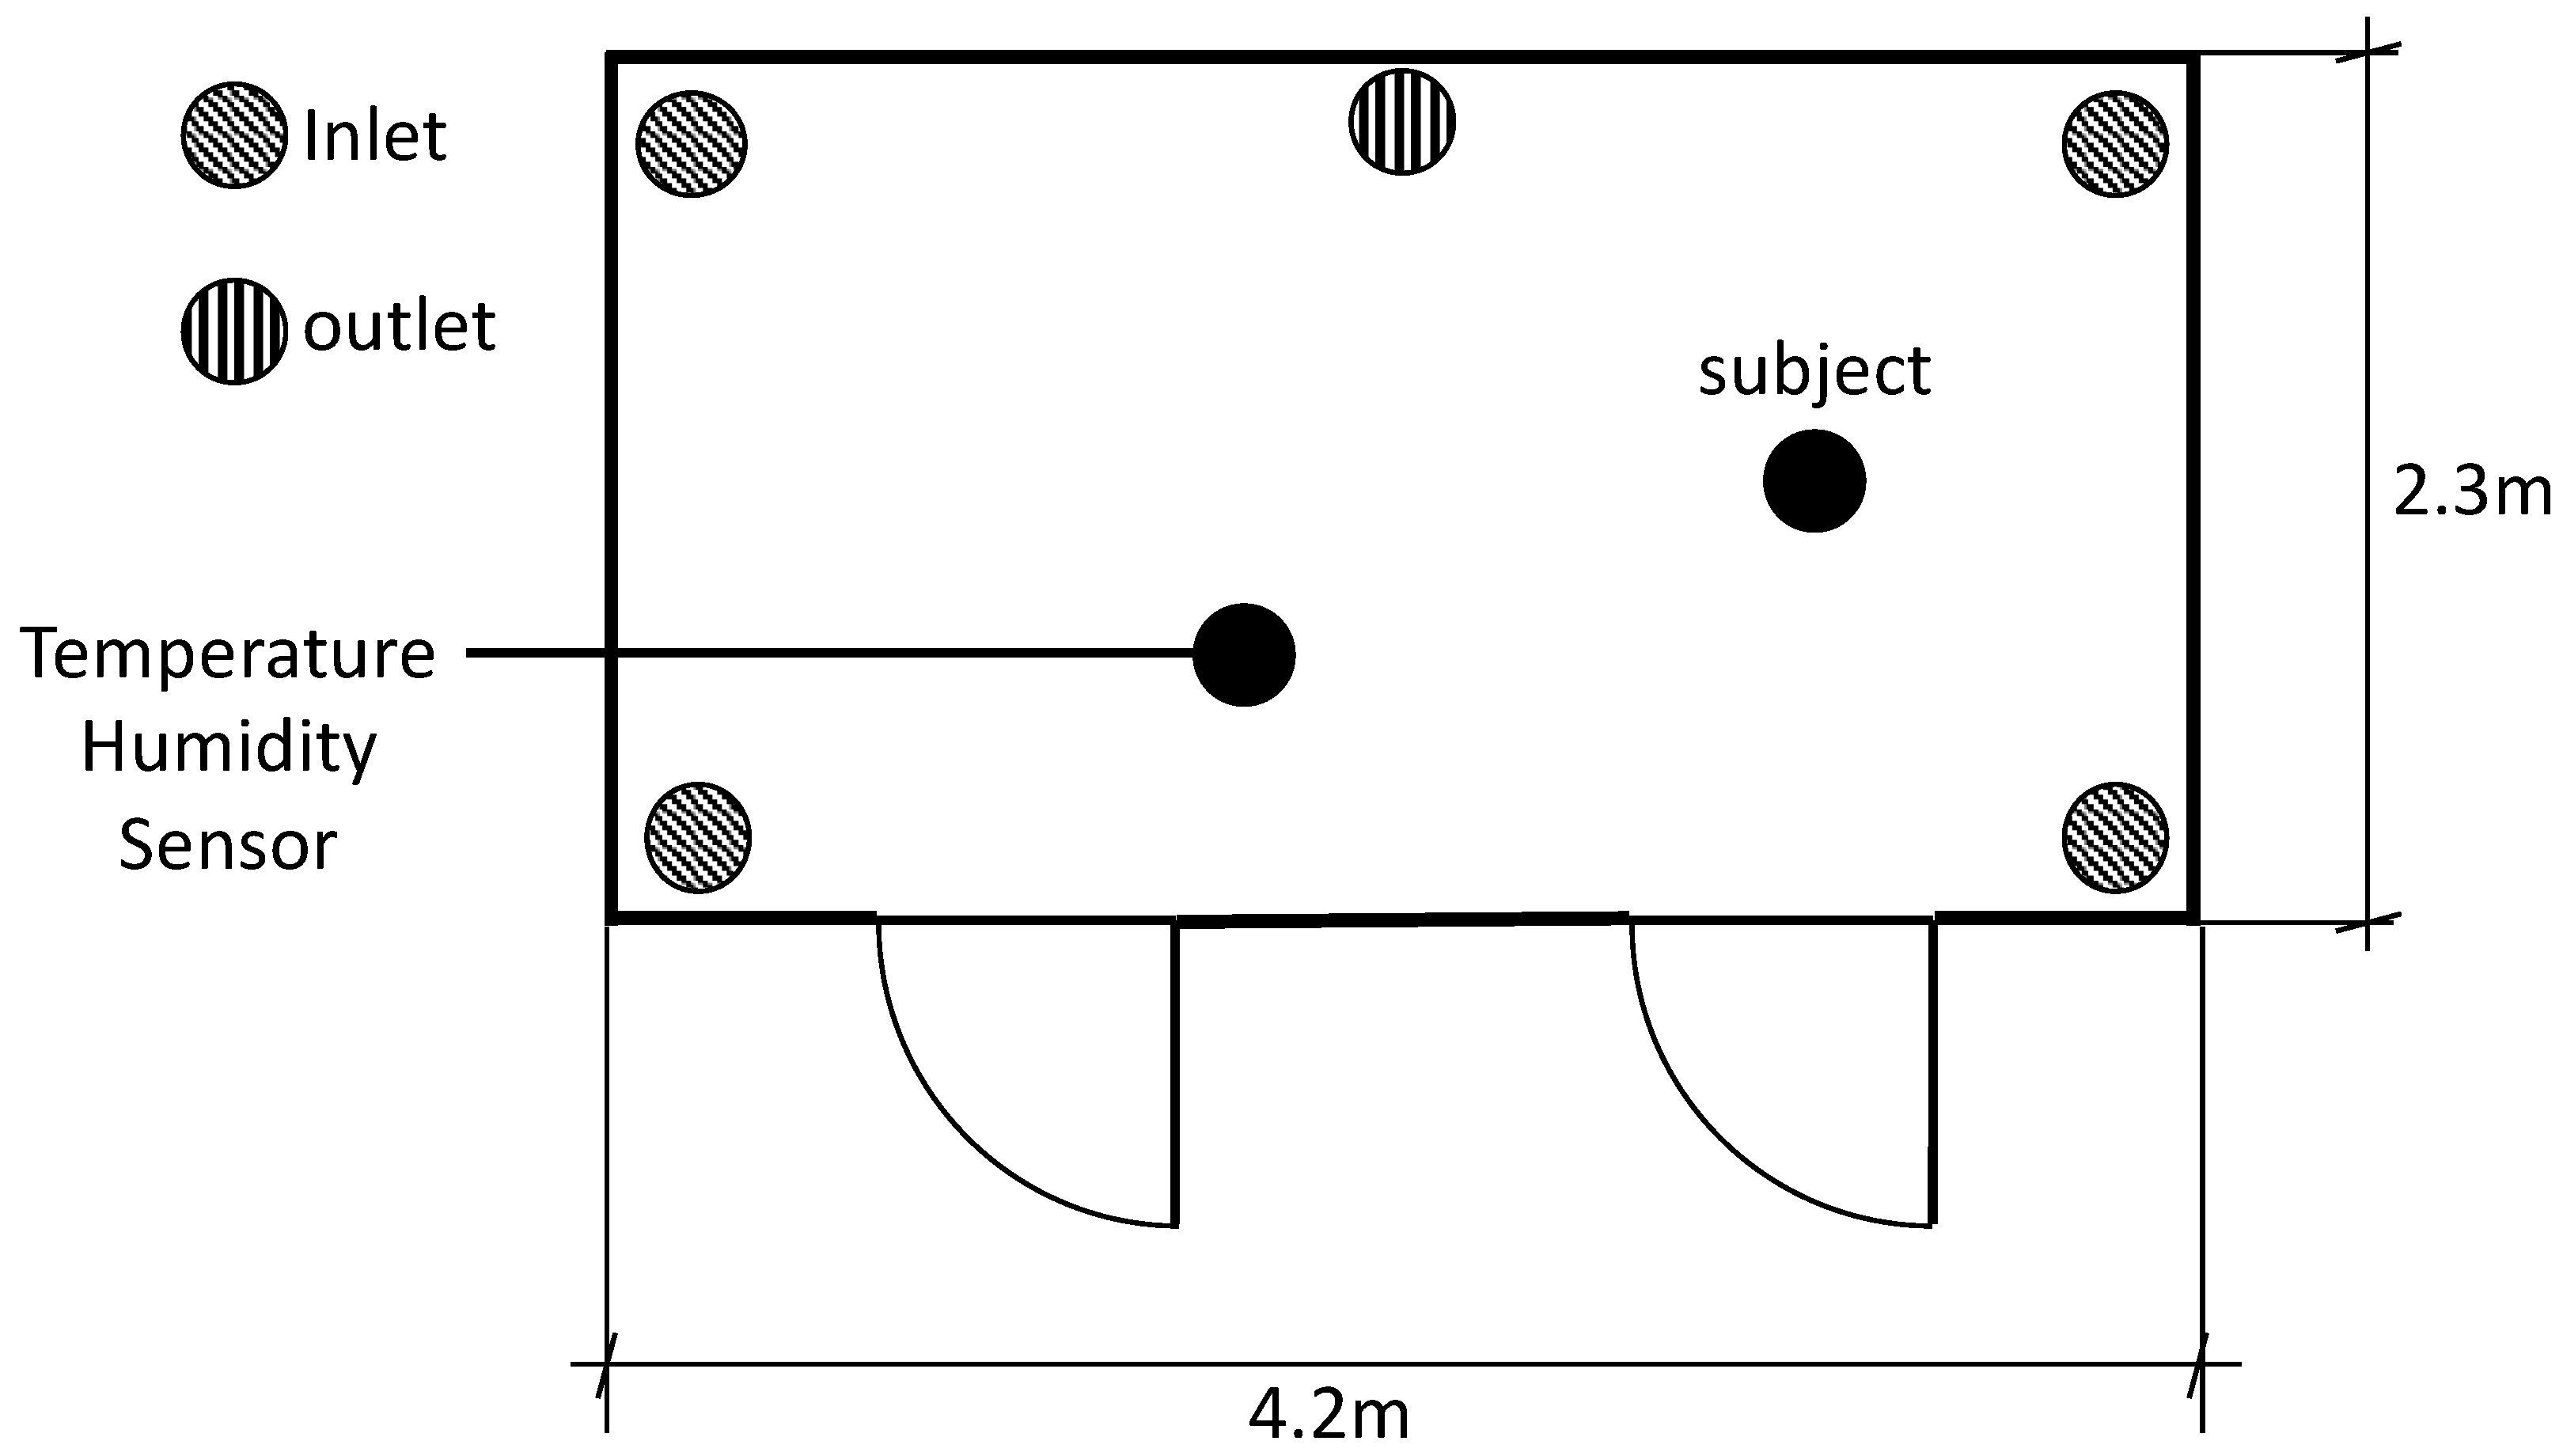
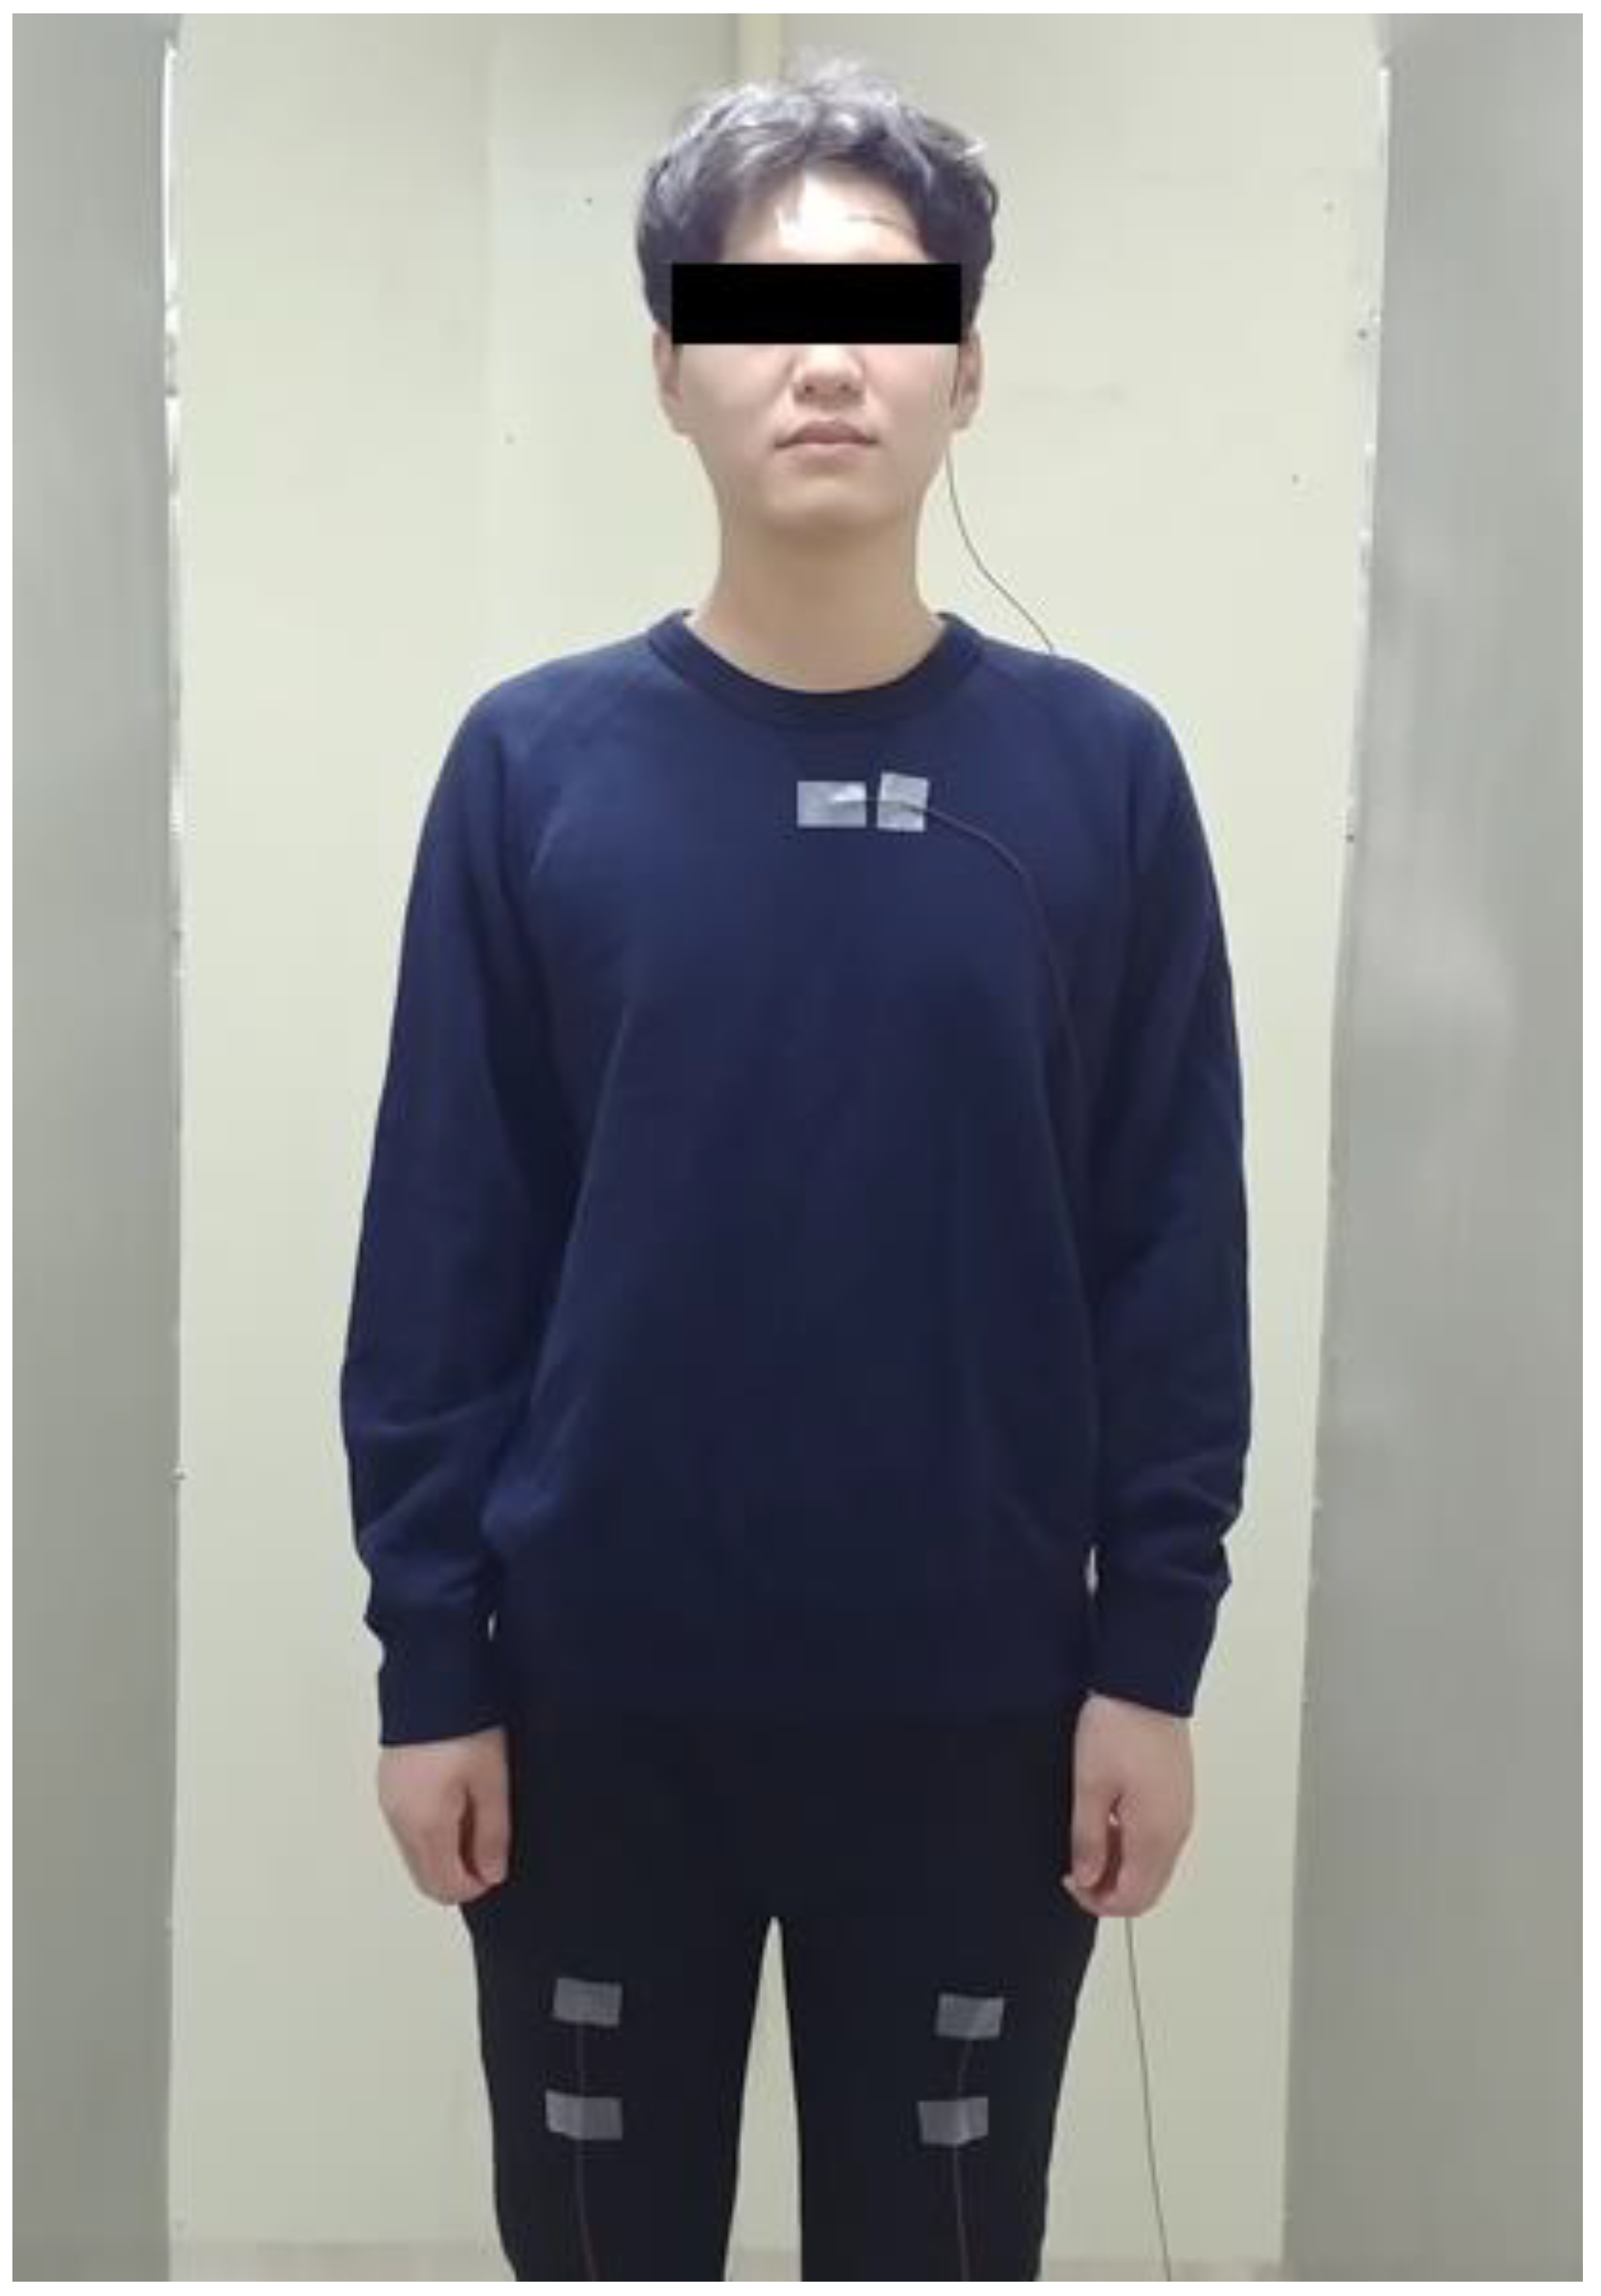
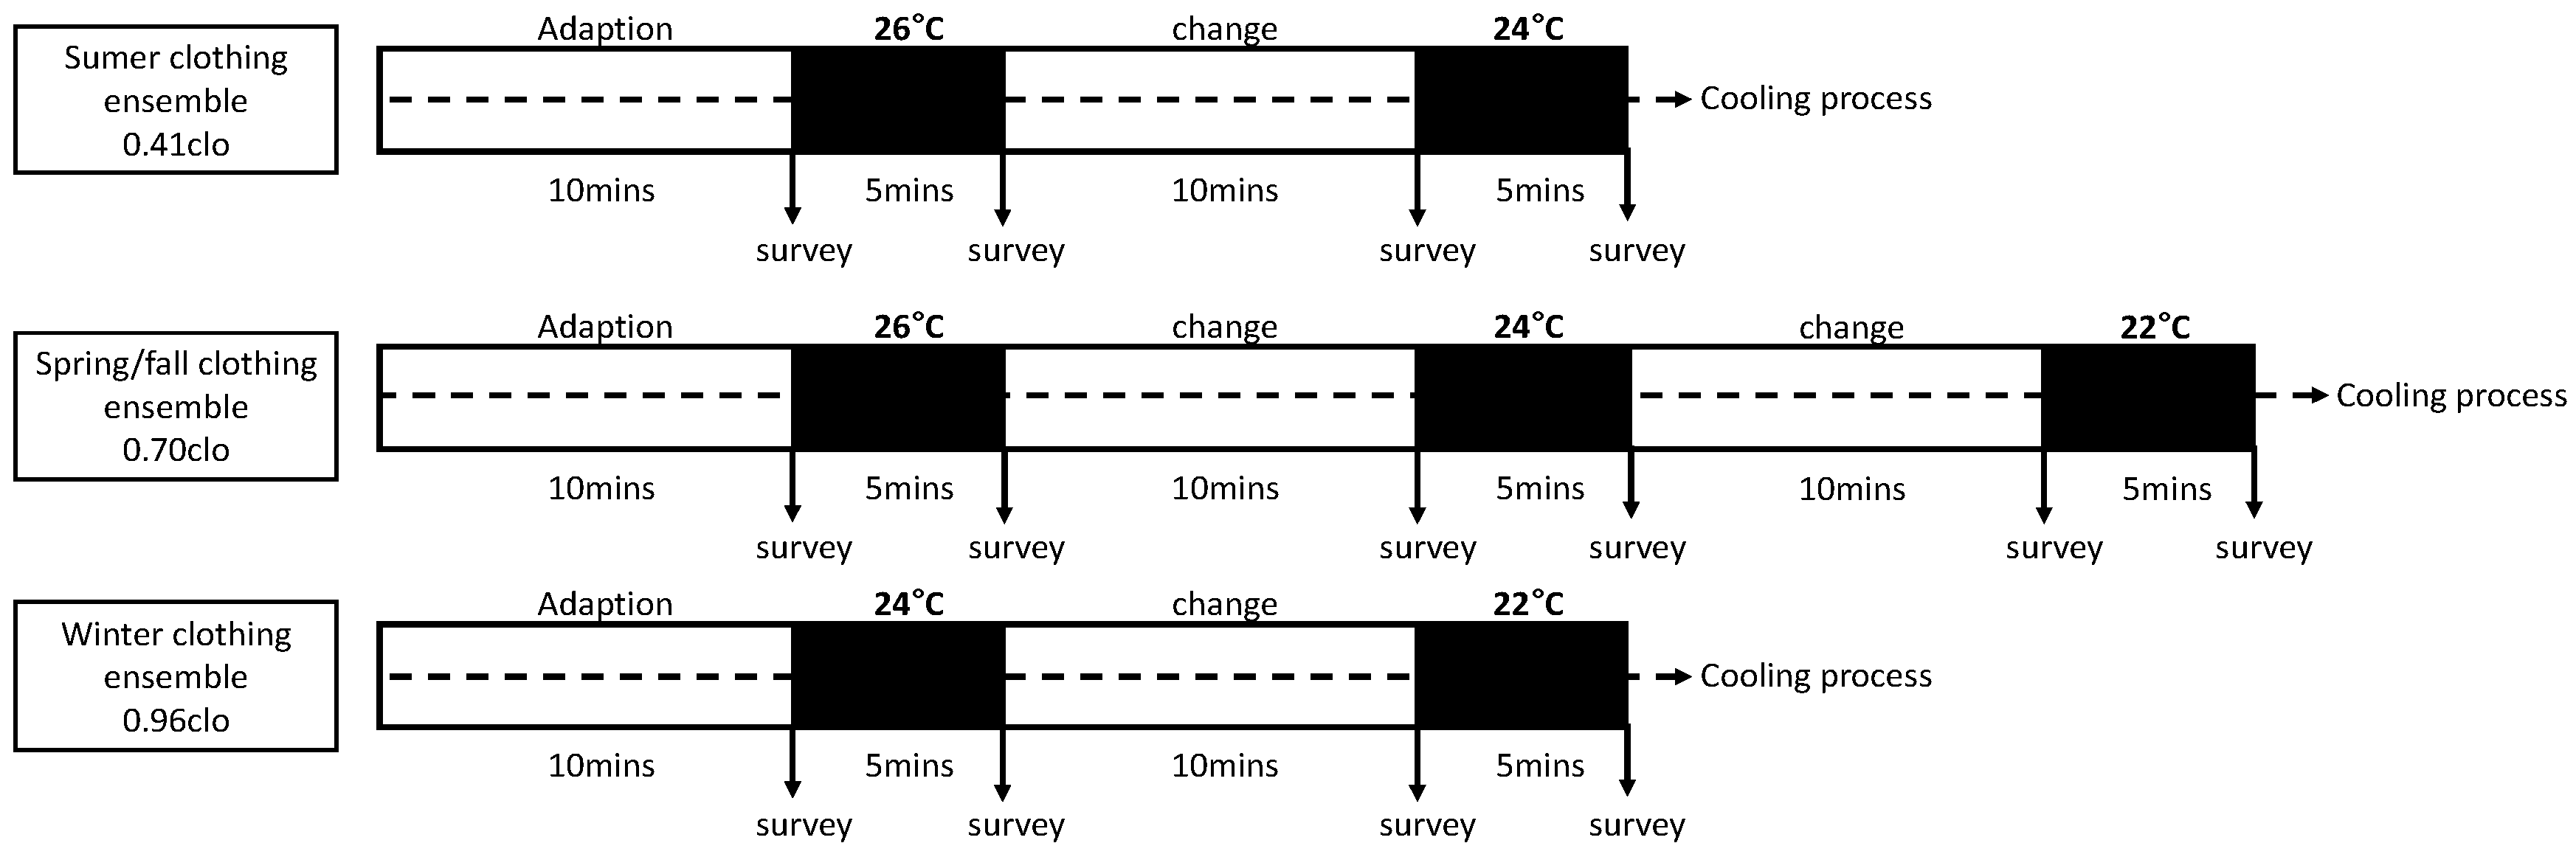
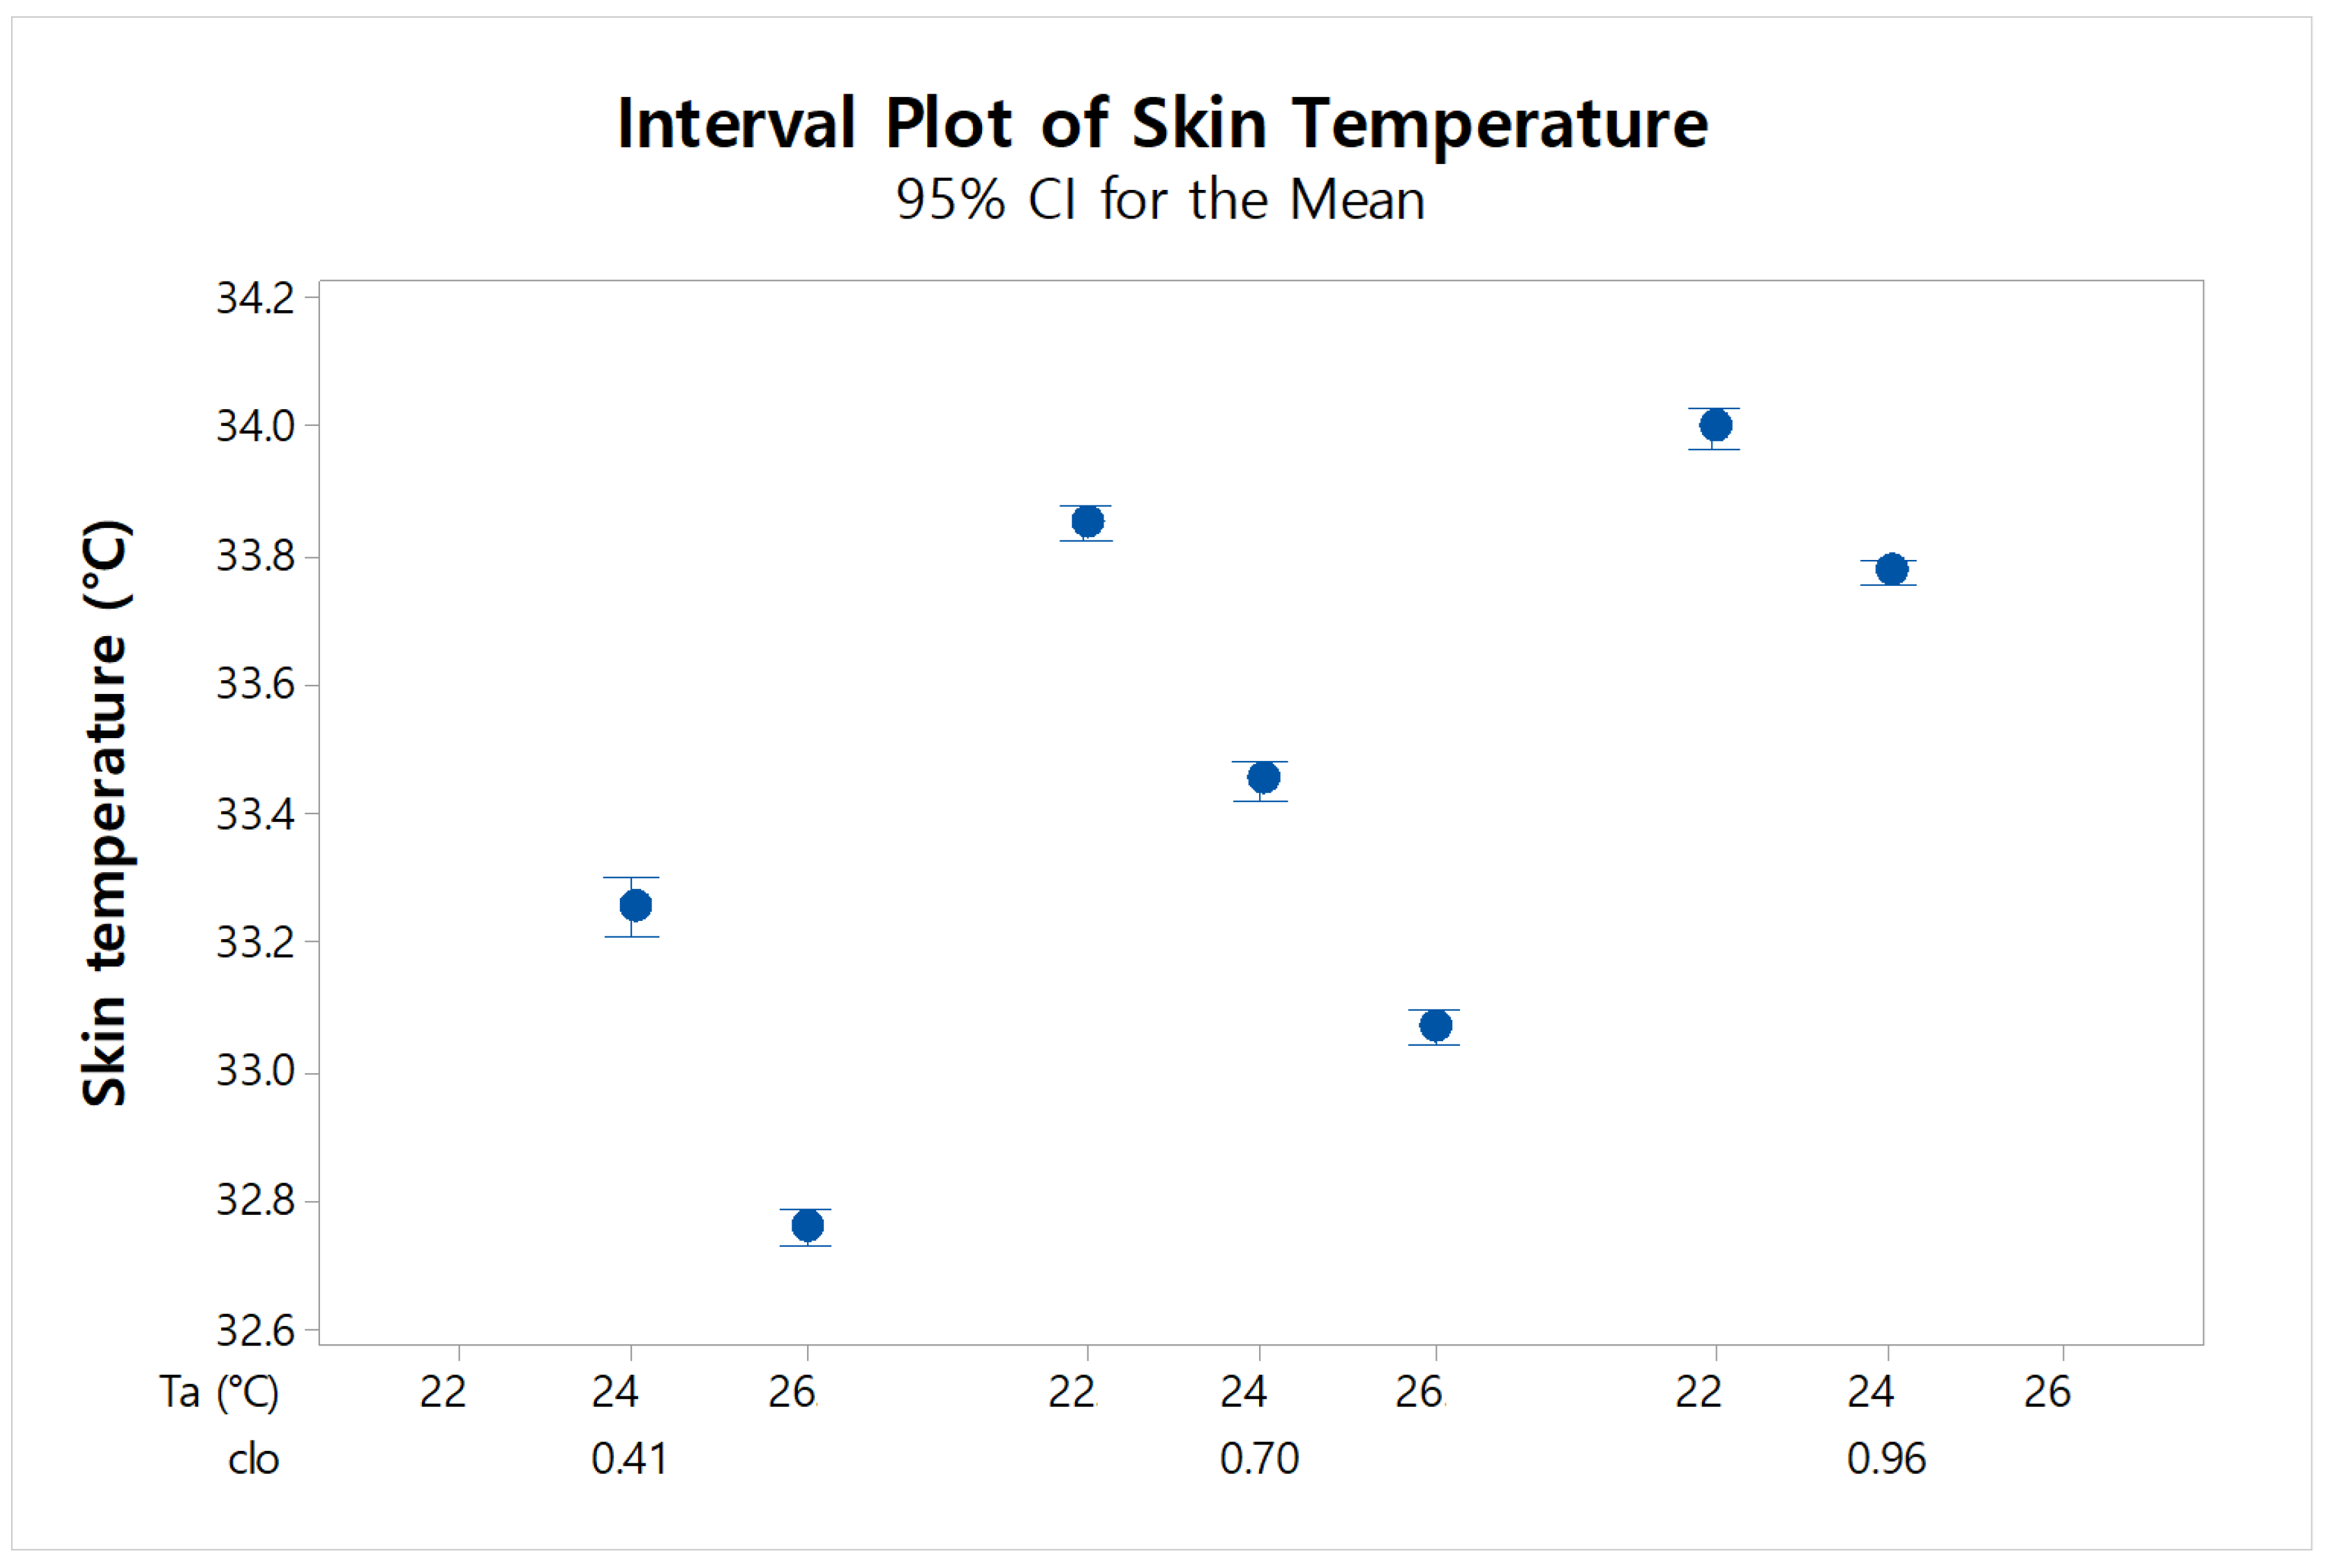
Thus, the purpose of this study was to establish a data-driven model that predicts the clo value with the consideration of individual physiological factors in real time. A series of experiments in an environmental chamber with multiple test participants were carried out to measure the skin and clothing surface temperatures of each subject. The environmental conditions and individual physiological data of the subjects were applied by data-driven methods.

2. Methods

2.1. Experimental Chamber

In this study, human experiments were performed to measure each subject’s local skin (forehead) and clothing surface (chest and thighs) temperatures. The forehead was selected as a representative body spot which shows the most significant relationship with whole-body thermal sensation, according to a recent study [6]. The experiments were conducted in a climate chamber located at Yonsei University, Seoul. The climate chamber measured 4.2 m × 2.3 m, and all walls were filled with insulation. The climate chamber (top view shown in Figure 1) can be controlled with a range of temperatures (0 °C to 60 °C, ±1 °C) and relative humidity (1% to 99%, ±10%) through an HVAC system.
Environmental factors were measured every 5 s at heights of 0.1 m, 1.1 m, and 1.7 m. During the experiment, based on ASHRAE Standard 55, the temperature difference between the head (1.7 m) and the foot (0.1 m) was kept below 3 °C. The concentration of CO2 was also kept below 1000 ppm, so that the subjects were not affected.

2.2. Experimental Instruments

Various sensors were used to measure the skin and clothing surface temperatures of each subject and the environmental variables. Skin and clothing surface temperatures were measured using a thermocouple, and a data acquisition board was used to provide the data for NI 9213 and NI-cDAQ 9178 instruments. The skin and clothing surface temperature measurements are shown in Figure 2. Environmental factors were measured using a Testo 480 from TESTO, lnc. The specifications of the measuring equipment are shown in Table 1.

2.3. Experimental Procedures

The 20 subjects, who voluntarily participated in the experiment, were all healthy college students in their 20s. Information about the participants is shown in Table 2. They were asked to not eat or use caffeinated beverages for 1 h before the experiment, which was approved, in advance, by the Yonsei Institutional Review Board.
For this study, a clothing ensemble for each season (winter, spring/fall, and summer) was selected, as shown in Table 3. A suitable clothing ensemble was selected for the indoor space, and a relatively light clothing ensemble of 1.0 clo, or less, was used. The clo value was calculated using Equation (1), as presented in ISO 9920 [7].
I c l = 0.161 + 0.835 I c l u
The result of Equation (1) is expressed in clo, and Iclu is the effective thermal insulation of the individual garments making up the ensemble in terms of clo.
During the experiment, the subjects maintained a relaxed standing posture. The thermal insulation value of clothing can differ because of the amount of air between clothing layers [24,37,38,39] or properties of the clothing [40]. In a sitting position, some may be wrinkled or others may be folded, so the1re could be a different clo value. Therefore, the standing posture was maintained so that the clothing would not wrinkle and there would not be an unintentional air layer between clothing layers. A flowchart of the experiment is shown in Figure 3.
The experiment then proceeded to the cooling process of each clothing ensemble. This procedure was as follows.
  • Subject wears the summer clothing ensemble in the climate chamber and adjusts to the set conditions (26 °C, 50% rh) for 10 min.
  • After adaption to the set conditions, each subject retains the standing posture for 5 min, and the skin and clothing surface temperatures are measured.
  • The subject sits and rests during a temperature change interval to match new set conditions (24 °C, 50% rh).
  • Steps 1–3 are repeated for each clothing ensemble in different conditions (For spring/fall clothing ensembles, a total of three experiments was conducted).

2.4. Data Analysis

The measured data and the physiological data of all subjects were statistically analyzed. All statistical analyses were performed at a 95% significance level. In this study, stepwise regression and a J48 decision tree were used to investigate the effects of variables on clothing thermal insulation. Data analyses were conducted using Minitab [41,42] and WEKA software.

2.4.1. Stepwise Regression Algorithm

Stepwise regression is based on a regression algorithm and is an automated technique that selects important predictive variables in order to construct a regression model [43]. In stepwise regression, forward selection to keep important variables and backward elimination to remove less important variables are used [44]. In this way, predictive variables that describe the dependent variables can be identified in order.

2.4.2. J48 Decision Tree Algorithm

The decision tree is a significant data-mining method [45]. The distribution of a data set can be classified, and even a bulk data set can be easily understood by means of a decision tree. The J48 decision tree is based on WEKA. Developed at the University of Waikato, New Zealand, WEKA is open-source data-mining software under the GNU General Public License. The algorithm of a J48 decision tree can be easily split into a data set to find significant information [46].

3. Results and Discussion

3.1. Results of Human Subject Experiments

The skin and clothing surface temperatures of the subjects were measured in the human experiment. Physiological data, such as BMI, as well as skin and clothing surface temperatures, were collected in predicting clothing thermal insulation. BMI data are physical characteristics that differ from person to person. Therefore, many studies on thermal comfort [30,31,47] have proposed a more accurate thermal comfort prediction model using BMI. This study also tried to improve the accuracy of clothing thermal insulation prediction by considering the different physical characteristics of each subject.

3.2. Skin And Clothing Temperatures

Skin and clothing surface temperatures were classified according to the clo value and air temperature, as shown in Figure 4, Figure 5 and Figure 6. The measurements showed that skin temperature increased as the clothing thermal insulation increased given the same air temperature. Also, the higher the air temperature, the lower the skin temperature. Therefore, it was found that the skin temperature showed a positive correlation with the clothing thermal insulation and a negative correlation with the air temperature. These results are due to the physiological phenomena of the human body, which exchanges heat with the surrounding environment [1]. The human body adopts thermoregulatory mechanisms to maintain its core temperature while varying the skin temperatures over the body [2]. When the temperature around the human body is lowered, the human body minimizes the sensible heat loss to the surrounding environment through various activities, such as shivering and vasoconstriction [5]. In addition, when the air temperature rises, perspiration and vasodilation prevent the core temperature from rising.
It was found that the top clothing surface temperature decreased with increasing clo value, even at the same air temperature. The ratio of top clothing surface temperature decrease to the increase in clothing thermal insulation became lower when the air temperature got higher. However, there was no correlation with air temperature under the same clothing conditions.
The bottom clothing surface temperature also increased as the clo value increased at the same air temperature and, likewise, was not correlated with the air temperature. The rate of increase in bottom clothing surface temperature to the increase in clothing thermal insulation proportionally increased when the air temperature increased. Each top and bottom item of clothing chosen has different materials and properties that depend on the season. As a result, the top and bottom clothing surface temperatures show different correlations that depend on the clo value.

3.3. Predictive Model of Clothing Thermal Insulation

3.3.1. Predictive Model Using the Stepwise Regression Algorithm

In this study, the training dataset comprised 70% of the experimental results of the 20 subjects; the remaining 30% were used for the test dataset. Thus, a stepwise regression model was constructed using the training data. Skin and clothing surface temperatures, BMI, and experimental conditions such as Ta (air temperature), MRT (mean radiant temperature), rh (relative humidity), and V (air velocity) were used. The stepwise regression results are shown in Table 4. The stepwise regression showed that Ta was the most significant variable, with R2 of 34.59%. The R2 values of the bottom and top clothing surface temperatures were 14.97%, and 14.89%, respectively. BMI showed the fourth highest R2 of 7.19%. As a result, 73.83% of the distribution of the data can be explained by air temperature, skin and clothing surface temperatures, and BMI.
Equation (2) is the result of the stepwise regression algorithm. The test dataset was used for the regression equation to validate the predictive model of clo values. Figure 7 is an interval plot of the predicted results of six validation datasets using the stepwise regression algorithm. Figure 8 shows the results of the predicted clo values of the six individuals classified by the test dataset.
As a result, a winter clothing ensemble (0.96 clo) was predicted to be 0.94 clo. Also, spring/fall (0.70 clo) and summer (0.41 clo) clothing ensembles were predicted to be 0.76 clo and 0.52 clo, respectively. The performance of the predictive model was improved as the clo value increased. In particular, for the winter clothing ensemble, the predicted value was almost the same as the actual clo value.
clo   =   1.280 0.016339 BMI 0.08356   T a + 0.03339   Tr 0.001840   rh   + 0.0493 T s k 0.14107 T c l ( t o p ) + 0.12714 T c l ( b o t t o m )

3.3.2. Predictive Model Using the J48 Decision Tree Algorithm

In this study, clo value was predicted using a decision tree algorithm in addition to the stepwise regression algorithm. The data from the experiments were also divided into 14 training datasets and 6 test datasets as in the predictive model using the stepwise regression algorithm. The predictive model was constructed with the training dataset and validated with the test dataset. In order to facilitate classification using the decision tree algorithm, each numerical clo value was converted to nominal data (0.41 clo for Low; 0.70 clo for Mid; 0.96 clo for High).
The significant attributes were combined to predict the clo value according to the stepwise regression analysis. The combined attributes were applied to the J48 decision tree to predict the clo value. Table 5 and Figure 9 show the accuracy of the combinations. The accuracy was 69.46% when the clo value was predicted from the air temperature, which was identified as the most important variable in the stepwise regression analysis. Air temperature was an important variable in predicting the clo value in the J48 decision tree analysis, as well as in the stepwise regression analysis. Like when Schiavon and Lee predicted clo values in outdoor temperatures and operative temperatures, this study also showed that air temperature is an important variable in predicting clo values.
According to the results of the stepwise regression analysis, the accuracy was improved when each attribute was added to the air temperature. The combination of air temperature, bottom clothing surface temperature, top clothing surface temperature, and BMI showed the highest accuracy (88.04%). The accuracy was lowered as other attributes were added to this combination. The decision tree using this combination is shown in Figure A1. The accuracy of the combination of air temperature with the top and bottom clothing surface temperatures was 80.44%, but it was increased by 7.60% when BMI was added. Therefore, BMI plays an important role in predicting the clo value. On the other hand, when the skin surface temperature was added, the accuracy was decreased. Skin surface temperature has been used as a predictor of thermal comfort in many studies, as has the forehead temperature used in this study. Nonetheless, we found that skin surface temperature does not play an important role in predicting clo values, presumably because the activity of the subject was controlled in this study. MRT, rh, and V also did not play an important role in predicting clo values.
Table 6 shows the accuracy of the decision tree for the combination of air temperature, top and bottom clothing surface temperatures, and BMI, which was the most accurate. As a result of the J48 decision tree, the precision of Low (0.41 clo) was evaluated as 0.8679, that of Mid (0.70 clo) was 0.8941, and that of High (0.96 clo) was 0.8733. The overall accuracy of the predictive model using the J48 decision tree was 88.04%. Therefore, clo values can be predicted by using the model proposed in this study.

3.4. Prediction Accuracy By BMI

In stepwise regression and the J48 decision tree analysis, BMI showed a significant role in predicting clo values. BMI is classified into four groups by the WHO (World Health Organization). Table 7 shows the results of the classification of subjects participating in the experiment according to WHO. In this study, the two high/low groups were classified based on a BMI of 22. Therefore, the predicted results according to BMI were compared, and the importance of BMI in predicting the clo value was identified.
Figure 10 is an interval plot of skin surface temperature according to the clo value, air temperature, and BMI. Figure 11 and Figure 12 show the interval plot of the clothing surface temperature according to clo value, air temperature, and BMI. As shown in Figure 11, skin temperature was higher in groups with lower BMI in all cases, irrespective of clo value and air temperature. The difference in skin surface temperature between the two BMI groups did not change significantly with clo value and air temperature. For the low clo value (0.41 clo), the top clothing surface temperature of the group with a high BMI was low, but this was reversed for the high clo value (0.96 clo). As a result, the top clothing surface temperature showed no correlation with BMI. In contrast, the bottom clothing surface temperature was higher in all cases with higher BMI. Therefore, the bottom clothing surface temperature and BMI were positively correlated.
Figure 13 shows predicted clo values by BMI according to the stepwise regression. Table 8 compares the accuracy of the predicted clo values for each BMI group. The error for the group with high BMI was higher than that for the group with low BMI at all clo value conditions. The error between the two groups was less than 3.13% for the high clo value (0.96 clo). In this study, the BMI values of the subjects were not significantly different. Therefore, the difference in accuracy in these groups is low.

4. Conclusions

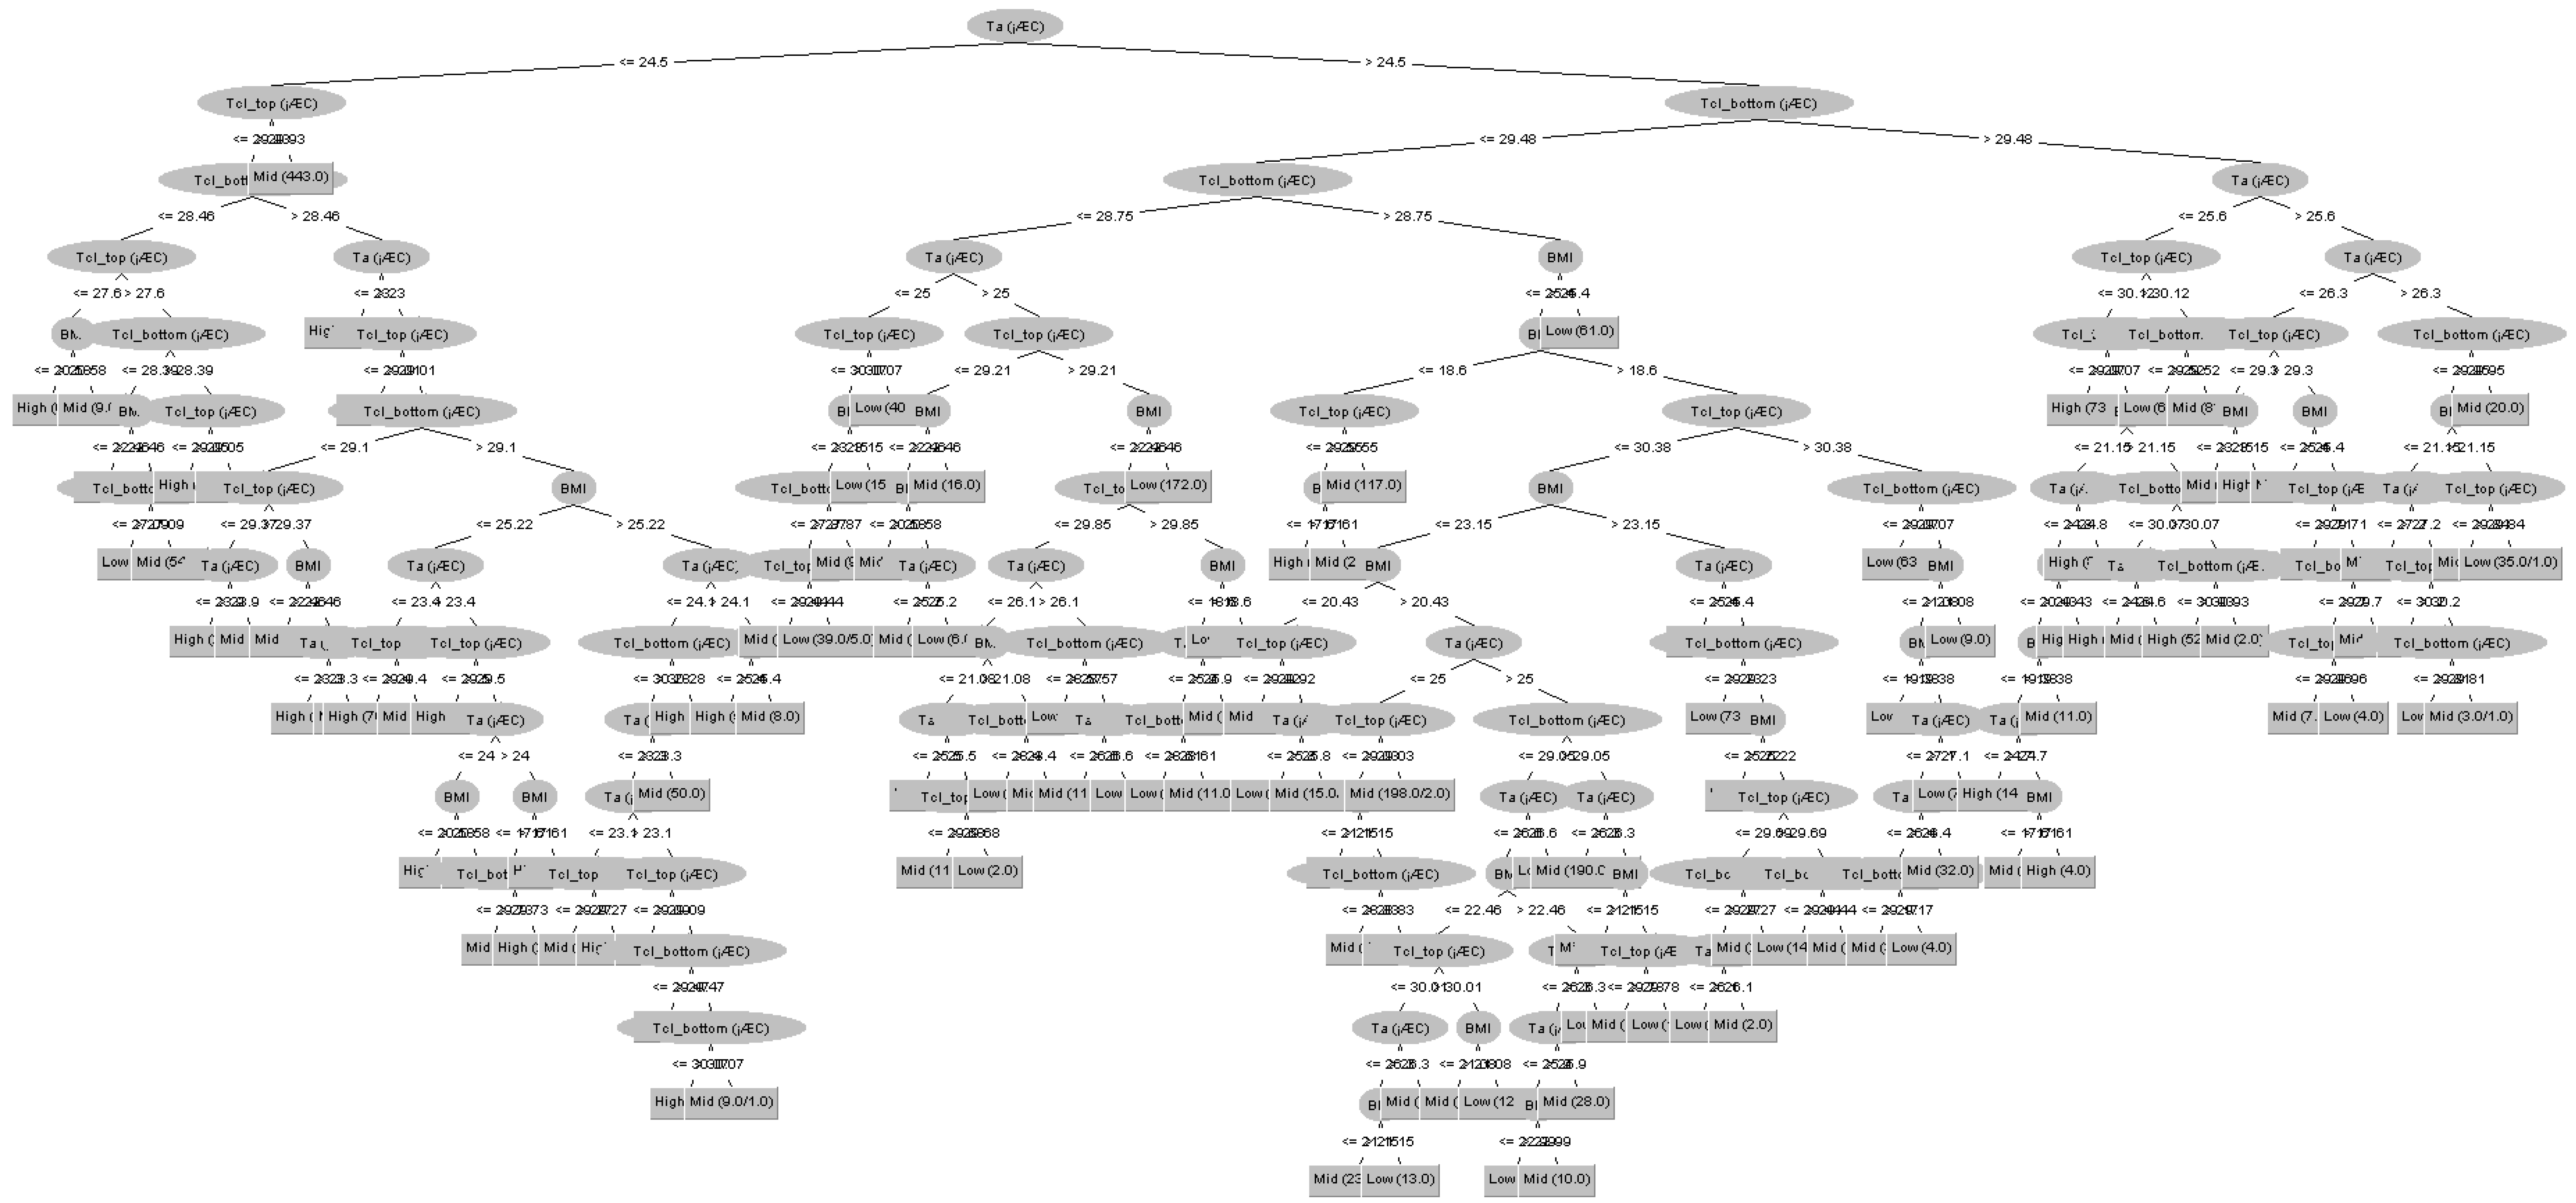
The clo value plays an important role not only in thermal comfort but also in energy saving. In this study, a predictive model that can predict the clo value in real time was developed. To this end, the environmental factors and individual factors of subjects were measured in various clothing conditions through the human experiment. The data obtained from the experiment were applied to the stepwise regression and decision tree algorithms. The results of this study are as follows.
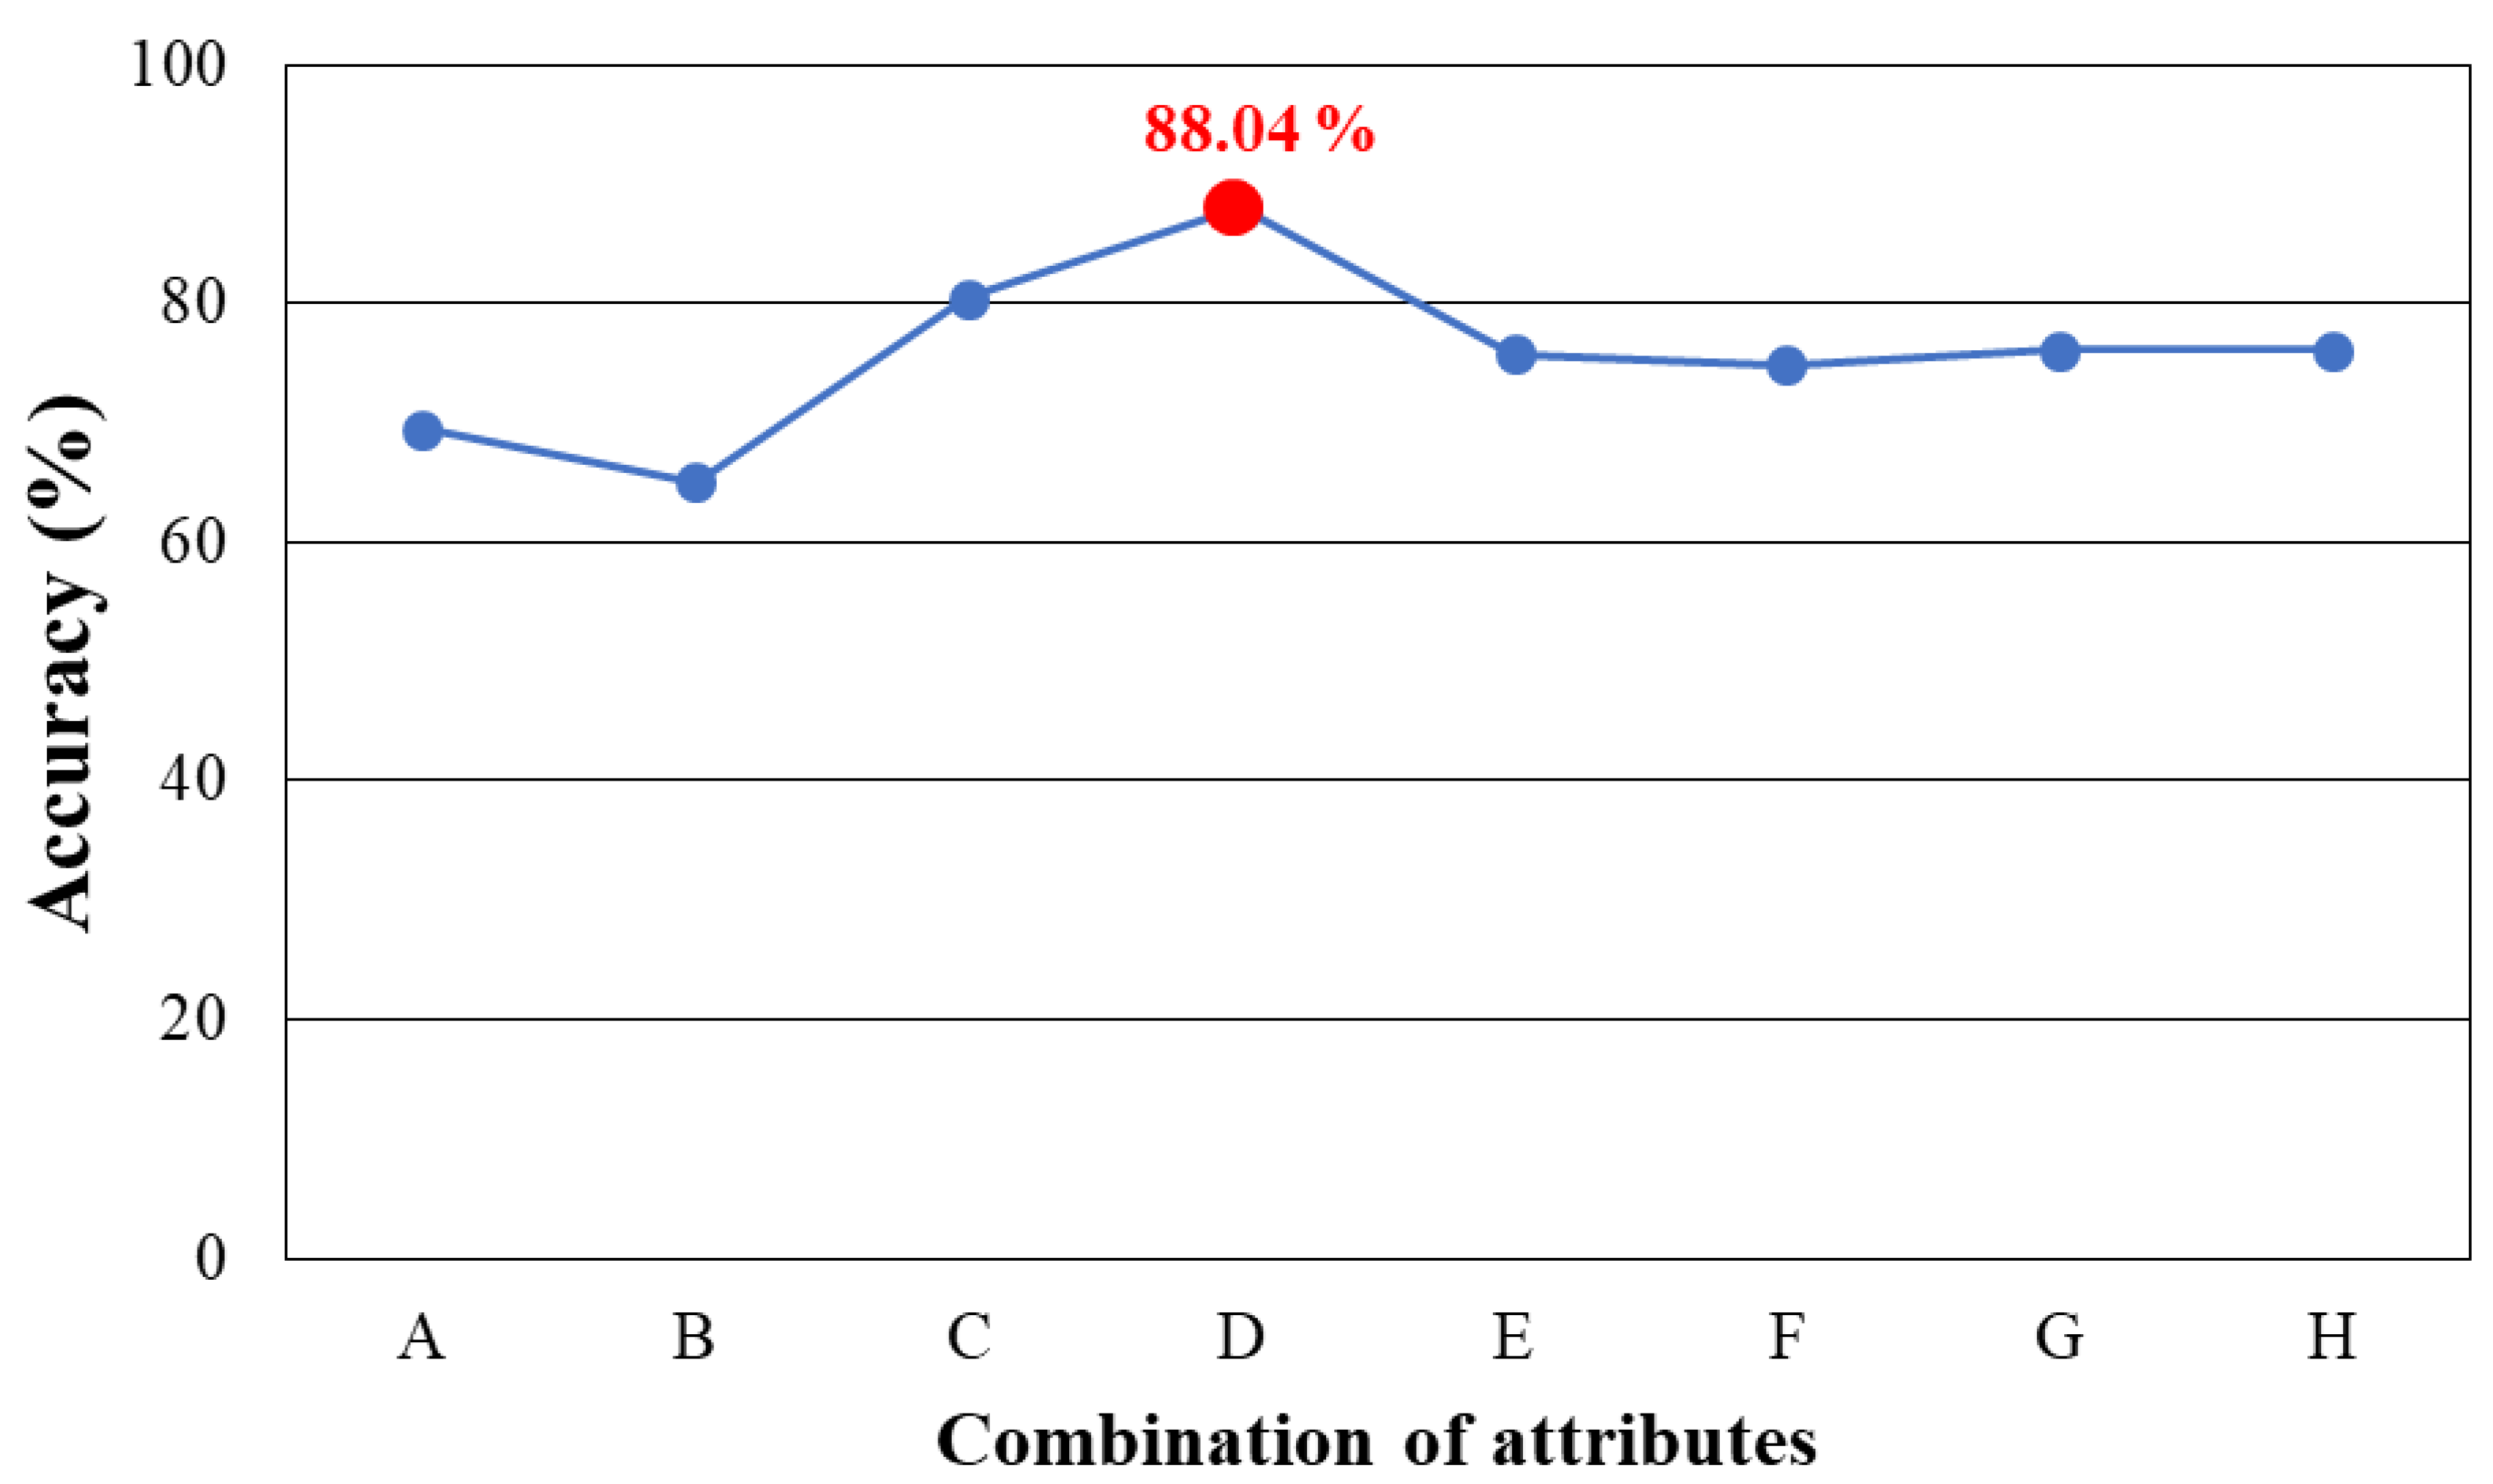
  • The predictive model using the decision tree algorithm showed an accuracy of 88.04% when using air temperature, top and bottom clothing surface temperatures, and BMI.
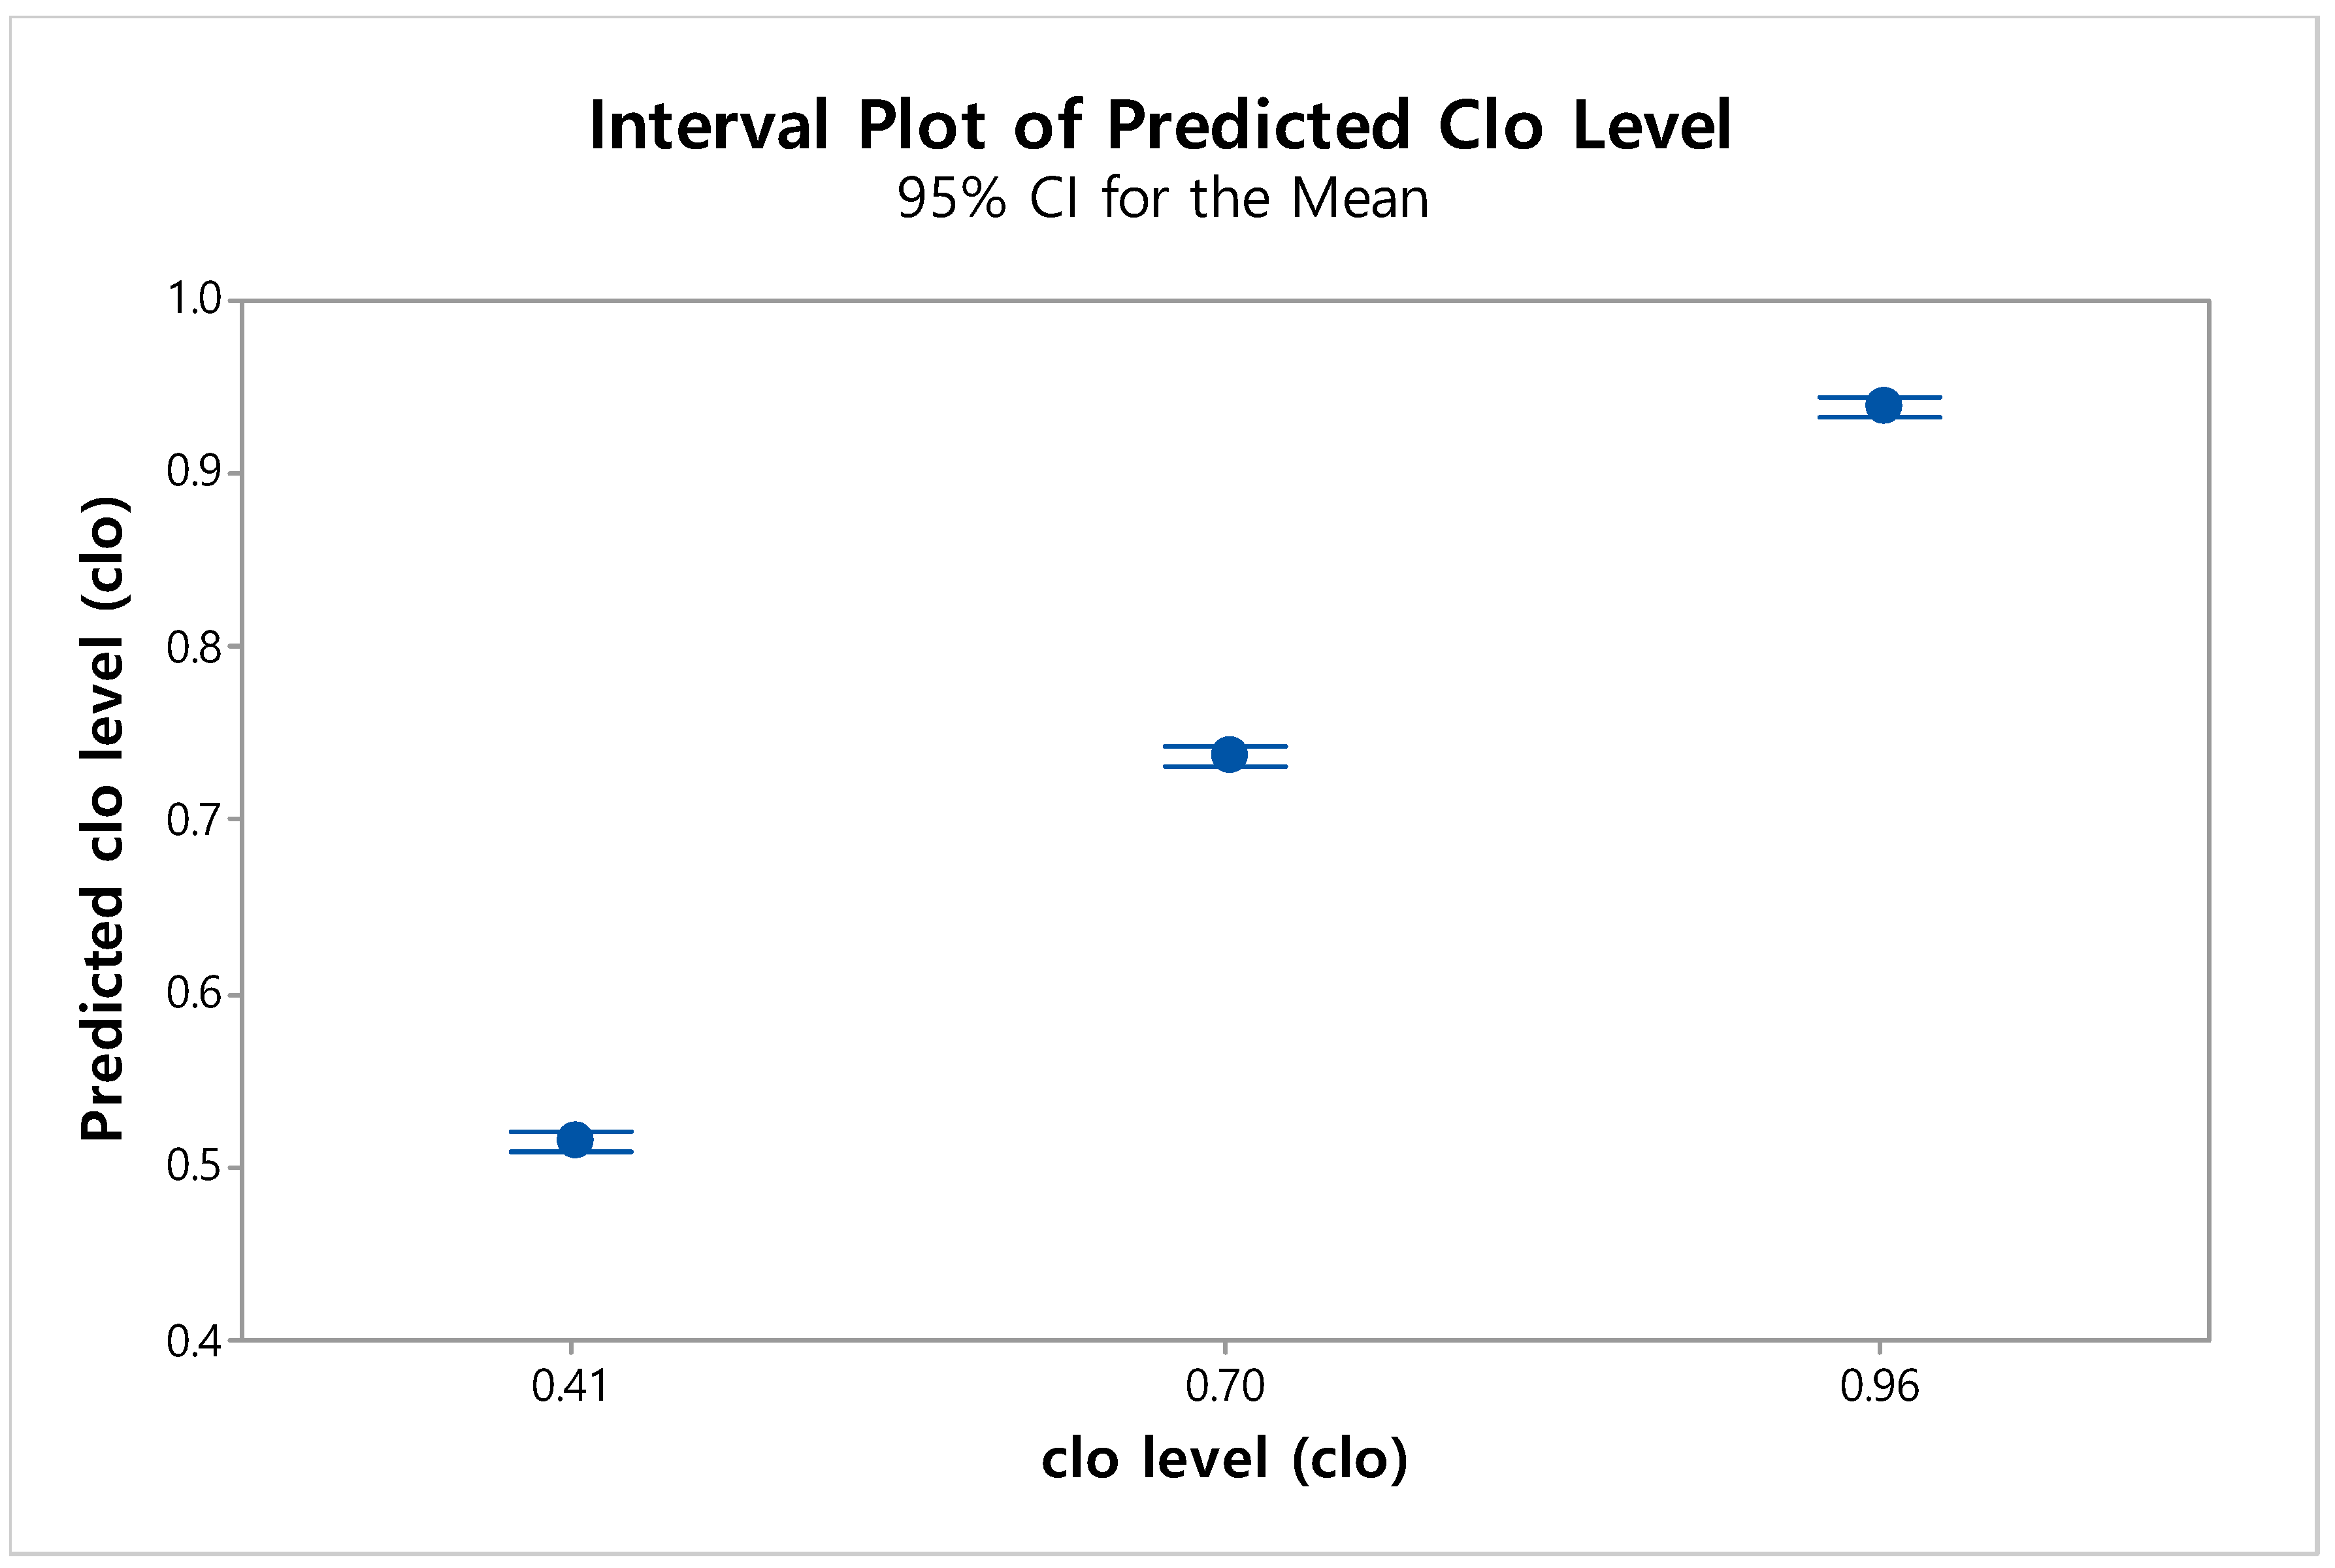
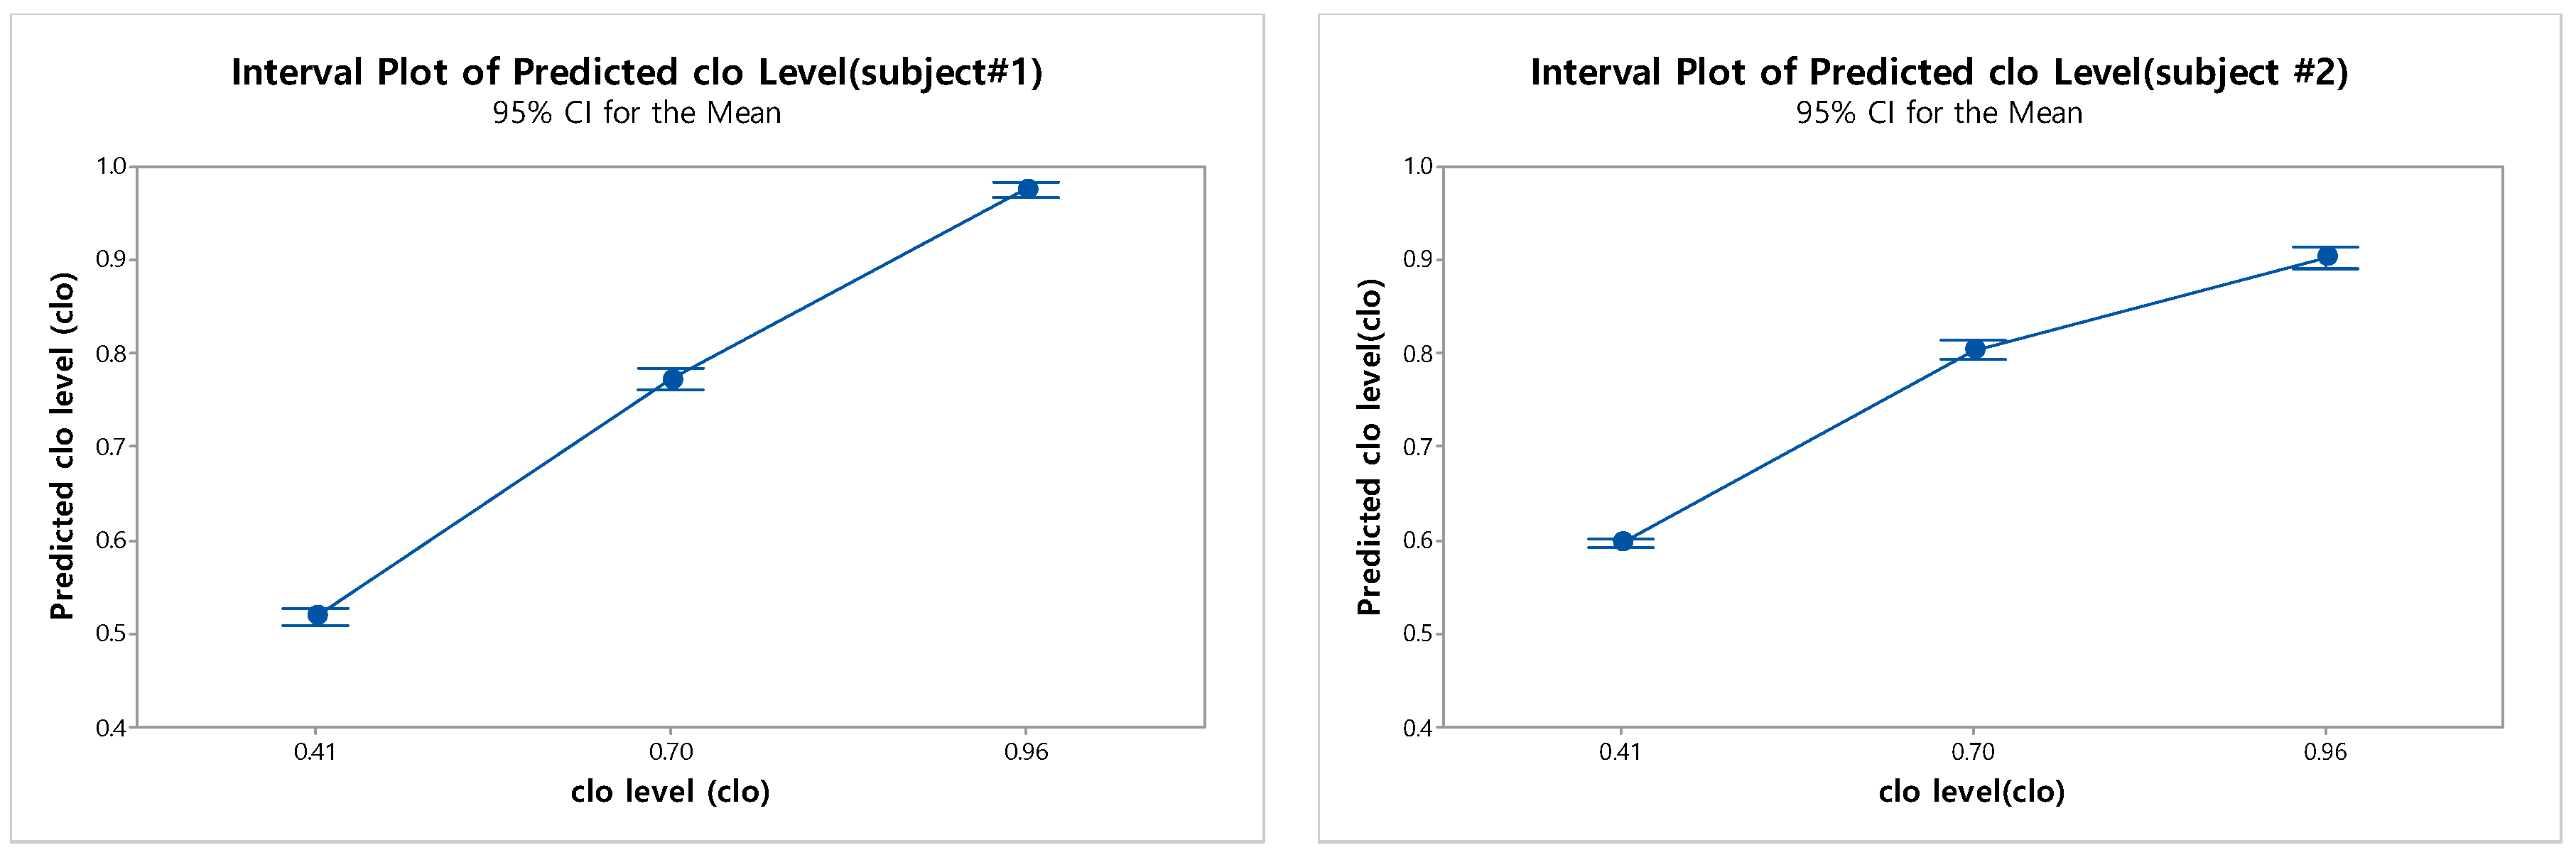
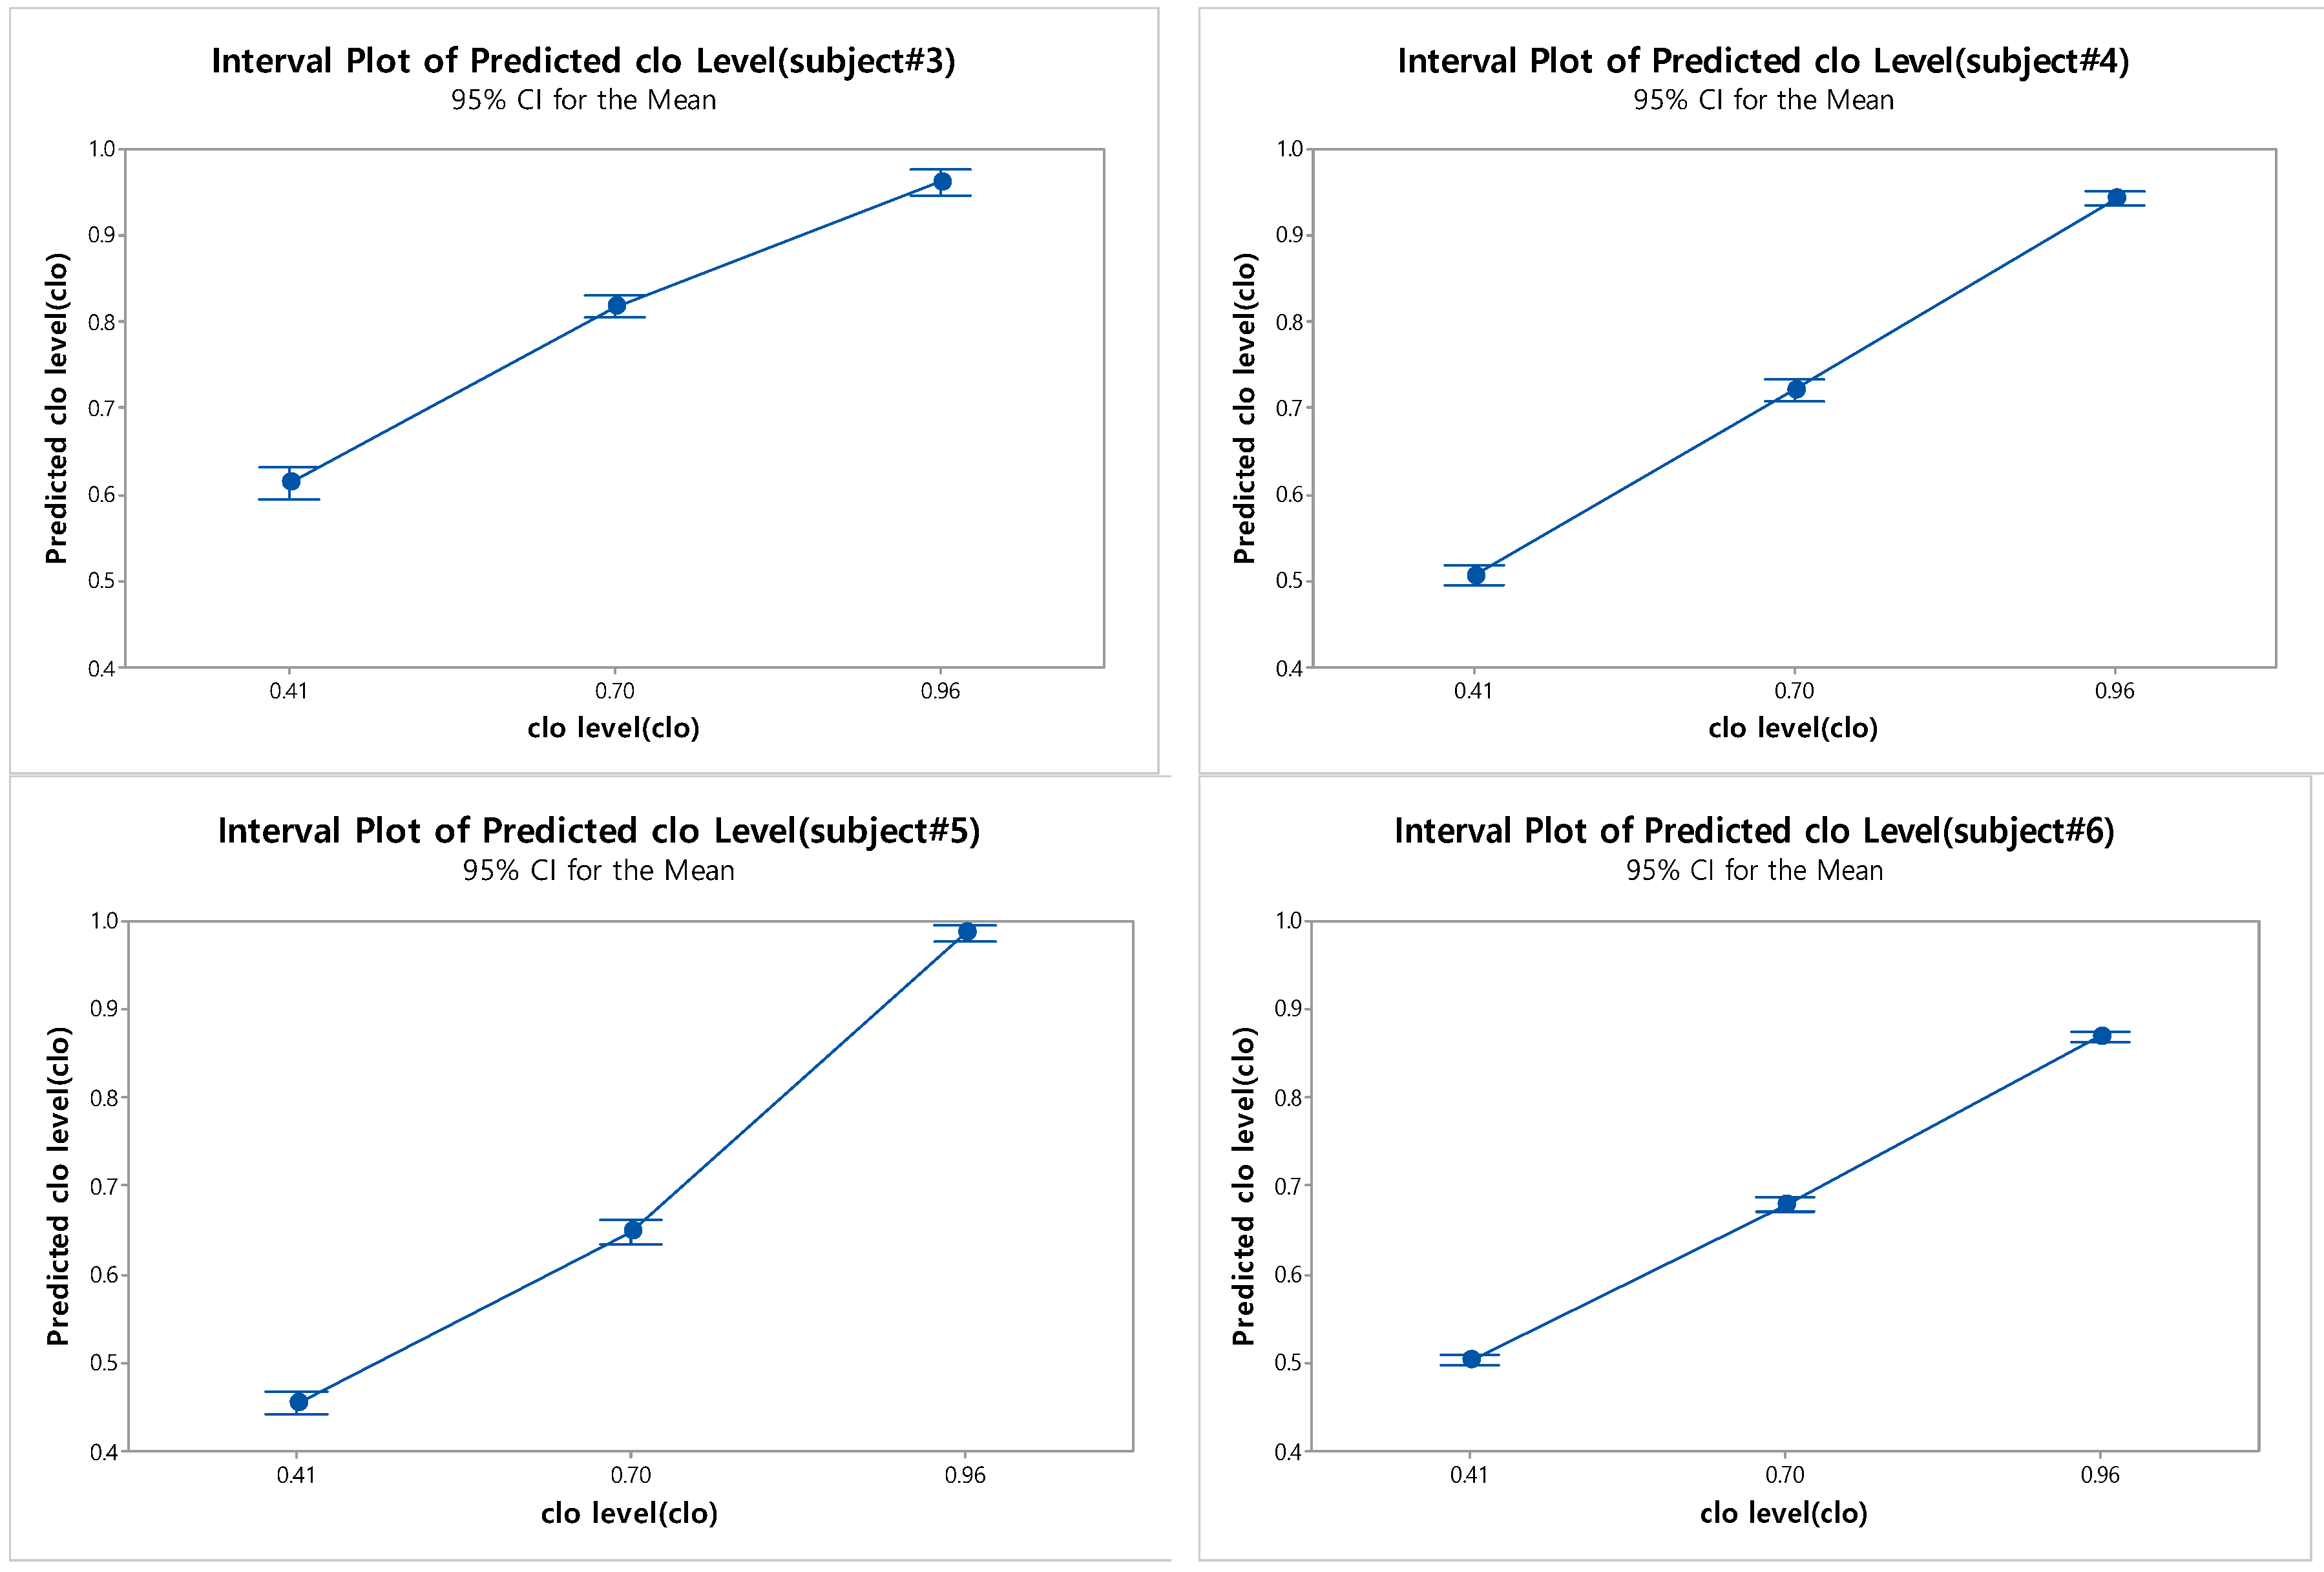
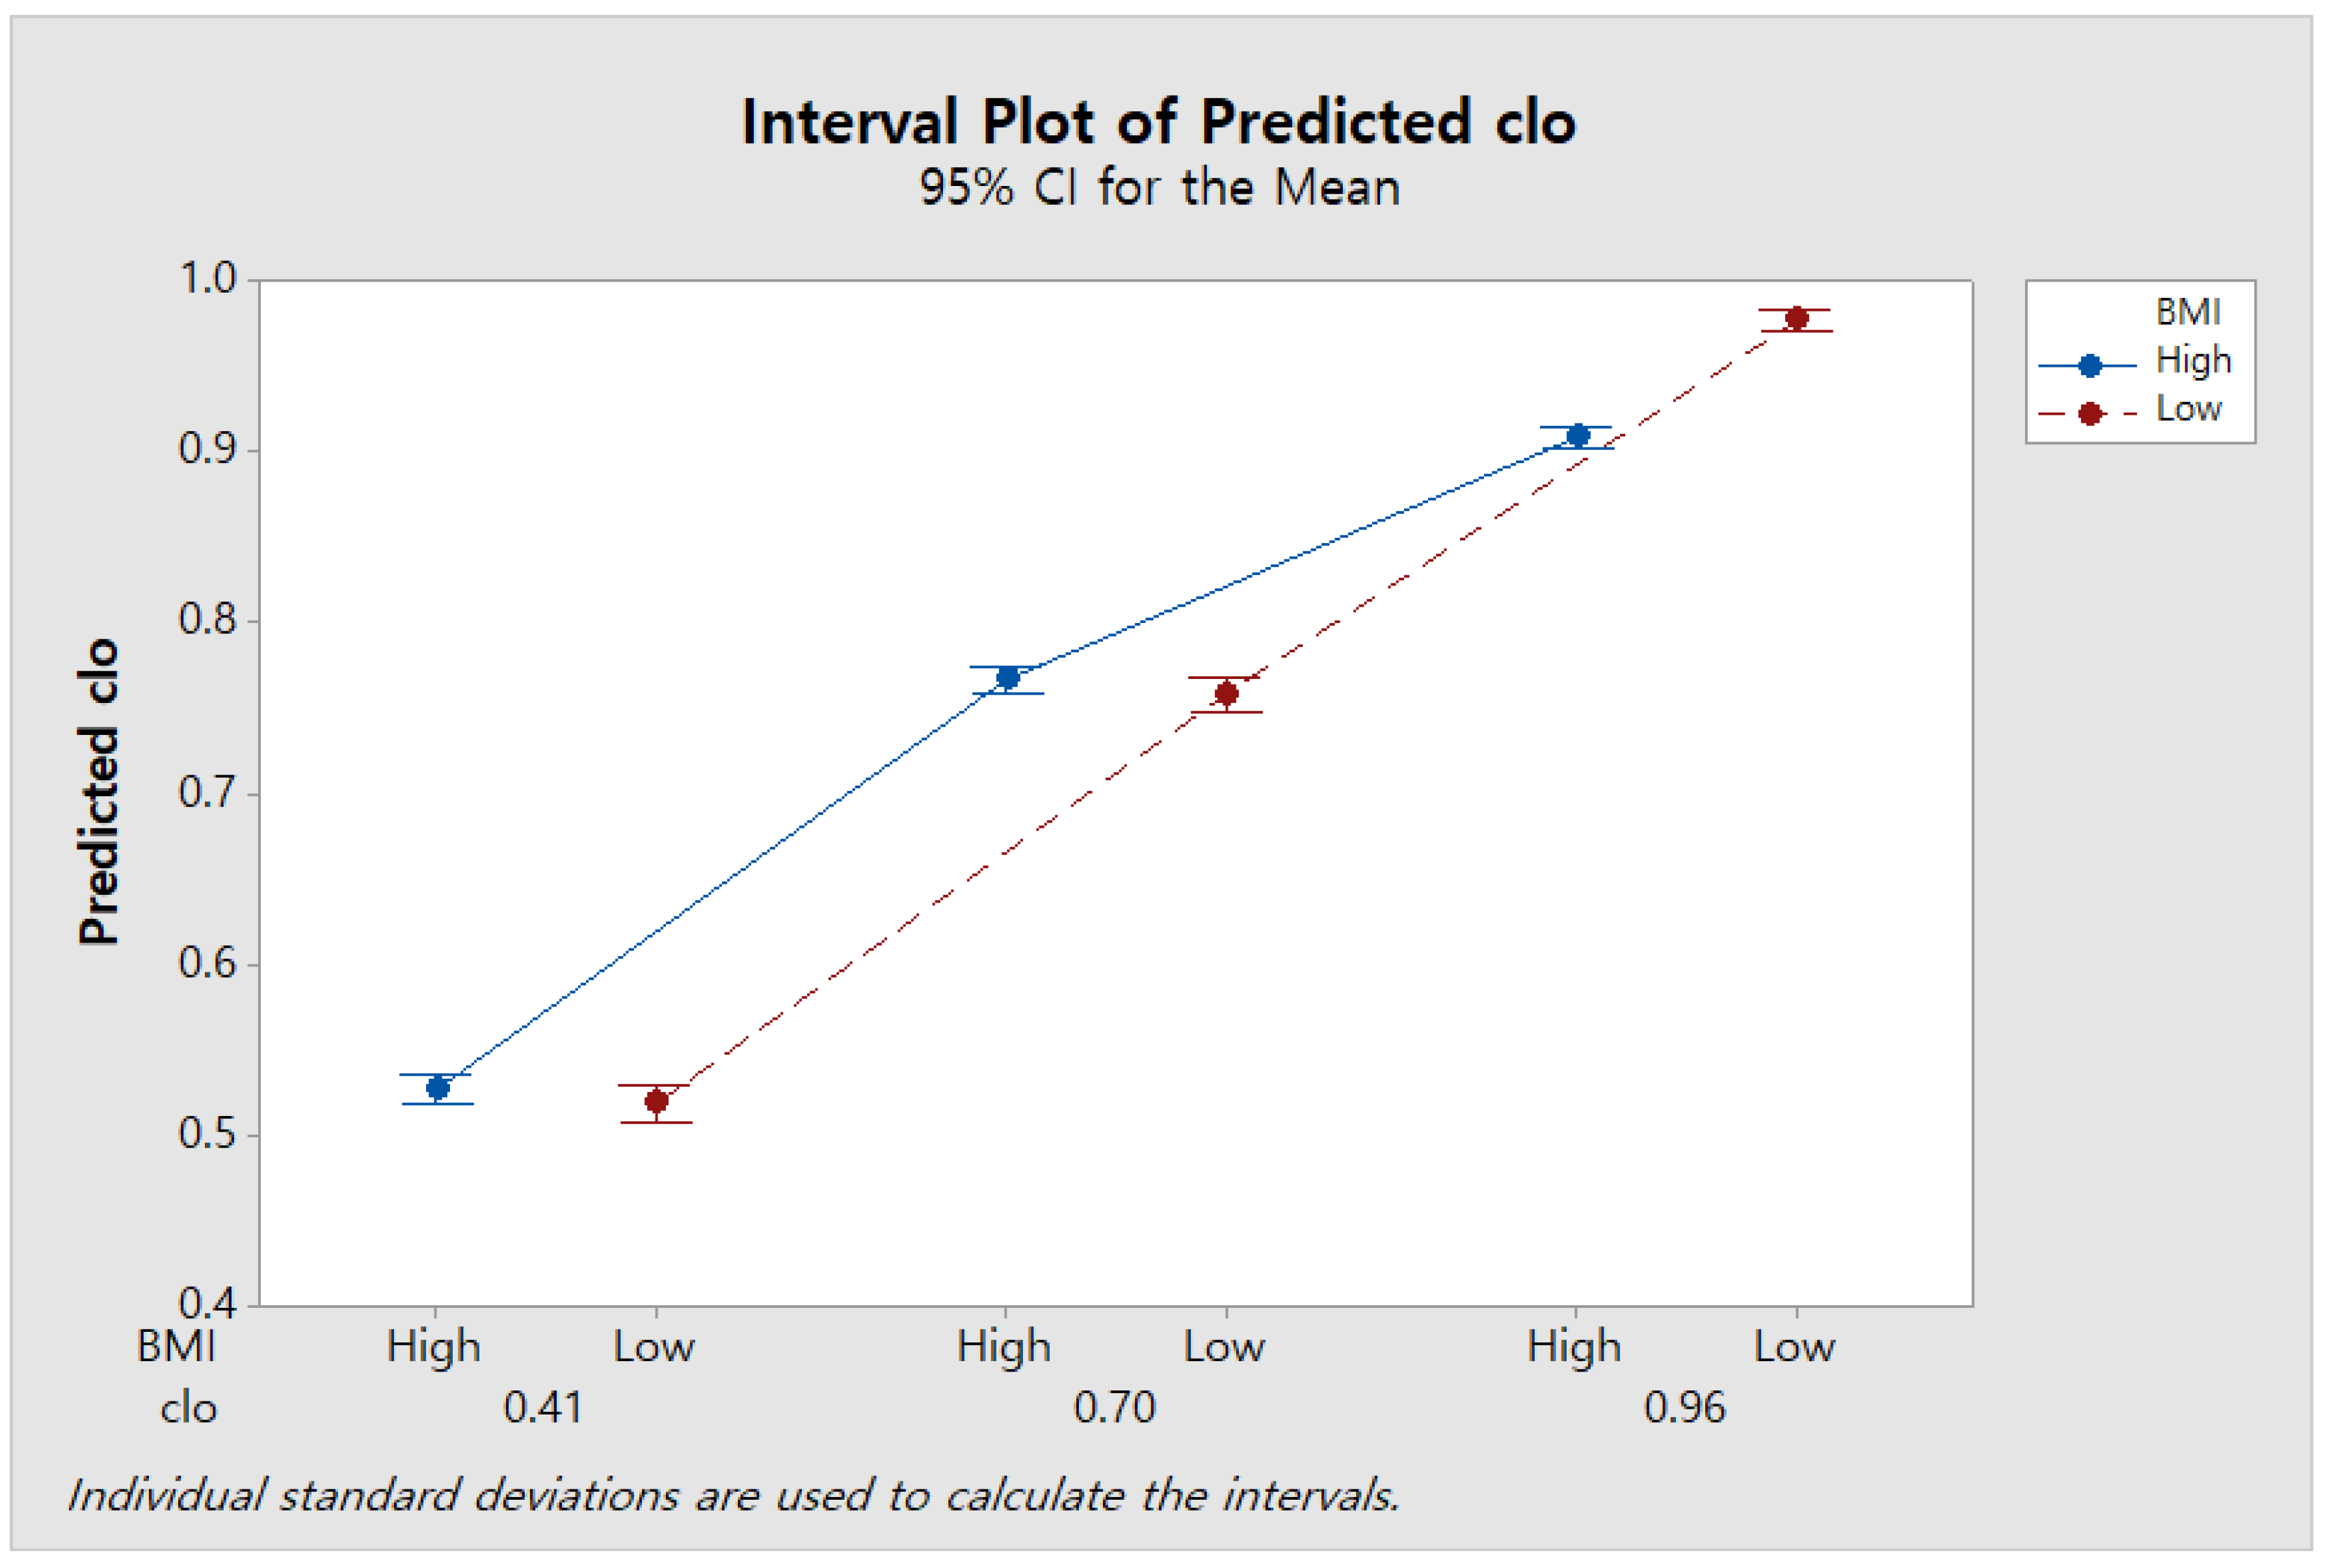
  • For both predictive models, the higher the clo value, the higher the precision of the clo value prediction.
  • According to BMI group, there was a difference in the accuracy of the clo value prediction model, especially for the highest clo value (0.96 clo).
For practical application of the predictive model established in this paper, it is necessary to obtain various data, such as skin temperatures and clothing temperatures, in real time. Such a practical application can be technically implemented by the use of sensory devices, such as infrared cameras and PMV meters, which have been frequently adopted in existing studies [23,24,25]. In recent years, sensor technology has been developed, and inexpensive sensors with good performance have been introduced. Therefore, considering that these sensors will be actively used in the future, the results of this research have high potential to be adopted for evaluating individual clothing insulation and, furthermore, thermal comfort in real time. Also, it is necessary to reduce the number of sensing points and simplify the computational algorithm to achieve a cost-effective approach.
In this study, the predictive models were constructed through a data-driven method, but there were limitations. Twenty human subjects were used as a sample, and a statistically meaningful deduction resulted. However, a larger sample size would have increased the accuracy and validity of the results, especially considering the differences in BMI. The experiment was carried out only for cooling. Therefore, it is necessary to carry out the experiment using heating in the future. In addition, only three clothing ensembles were selected for each season. In the future, it will be necessary to construct more sophisticated prediction models by using more clothing ensembles with a larger dataset for better performance.

Author Contributions

K.L. developed this submitted research and conducted a series of human subject experiments; H.C. supported experiments and helped construct the technical report; J.-H.C. provided valuable opinions and technical contributions to this research; T.K. helped to develop the main idea of this study and review the whole process of this project. All the authors equally participated and contributed to the development of this submitted journal manuscript.

Funding

This research was supported by Basic Science Research Program through a National Research Foundation of Korea (NRF) grant funded by the Ministry of Science and ICT (NRF-2017R1A2B3012914).

Conflicts of Interest

The authors declare no conflict of interest.

Appendix A

Figure A1. Decision tree with air temperature, top and bottom clothing surface temperatures, and BMI (graphic-based classification model).
Sustainability 11 05702 g0a1

References

  1. ASHRAE, Inc. 2009 ASHRAE Handbook: Fundamentals; American Society of Heating, Refrigerating and Air-Conditioning Engineers Inc.: Atlanta, GA, USA, 2009. [Google Scholar]
  2. Tanabe, S.-I.; Kobayashi, K.; Nakano, J.; Ozeki, Y.; Konishi, M. Evaluation of thermal comfort using combined multi-node thermoregulation (65MN) and radiation models and computational fluid dynamics (CFD). Energy Build. 2002, 34, 637–646. [Google Scholar] [CrossRef] [Green Version]
  3. Stolwijk, J.A. A Mathematical Model of Physiological Temperature Regulation in Man; NASA: Washington, DC, USA, 1971.
  4. Fanger, P. Calculation of thermal comfort, Introduction of a basic comfort equation. ASHRAE Trans. 1967, 73, III. 4.1–III. 4.20. [Google Scholar]
  5. Standard, A. Thermal Environmental Conditions for Human Occupancy; ASHRAE Standard 55-2013; ASHRAE: Atlanta, GA, USA, 2013. [Google Scholar]
  6. Choi, J.-H.; Yeom, D. Study of data-driven thermal sensation prediction model as a function of local body skin temperatures in a built environment. Build. Environ. 2017, 121, 130–147. [Google Scholar] [CrossRef]
  7. ISO. Ergonomics of the Thermal Environment–Estimation of Thermal Insulation and Water Vapour Resistance of a Clothing Ensemble; International Organization for Standardization: Geneva, Switzerland, 2007. [Google Scholar]
  8. ISO, E. Ergonomics of the Thermal Environment-Analytical Determination and Interpretation of Thermal Comfort Using Calculation of the PMV and PPD Indices and Local Thermal Comfort Criteria; 7730; ASHRA: Atlanta, GA, USA, 2005. [Google Scholar]
  9. Farzaneh, Y.; Tootoonchi, A.A. Controlling automobile thermal comfort using optimized fuzzy controller. Appl. Therm. Eng. 2008, 28, 1906–1917. [Google Scholar] [CrossRef]
  10. Kang, D.H.; Mo, P.H.; Choi, D.H.; Song, S.Y.; Yeo, M.S.; Kim, K.W. Effect of MRT variation on the energy consumption in a PMV-controlled office. Build. Environ. 2010, 45, 1914–1922. [Google Scholar] [CrossRef]
  11. Schiavon, S.; Lee, K.H. Dynamic predictive clothing insulation models based on outdoor air and indoor operative temperatures. Build. Environ. 2013, 59, 250–260. [Google Scholar] [CrossRef] [Green Version]
  12. Moon, J.W. Performance of ANN-based predictive and adaptive thermal-control methods for disturbances in and around residential buildings. Build. Environ. 2012, 48, 15–26. [Google Scholar] [CrossRef]
  13. Chen, X.; Wang, Q.; Srebric, J. Occupant feedback based model predictive control for thermal comfort and energy optimization: A chamber experimental evaluation. Appl. Energy 2016, 164, 341–351. [Google Scholar] [CrossRef]
  14. Nouvel, R.; Alessi, F. A novel personalized thermal comfort control, responding to user sensation feedbacks. In Building Simulation; Springer: New York, NY, USA, 2012; pp. 191–202. [Google Scholar]
  15. West, S.R.; Ward, J.K.; Wall, J. Trial results from a model predictive control and optimisation system for commercial building HVAC. Energy Build. 2014, 72, 271–279. [Google Scholar] [CrossRef]
  16. Holopainen, R.; Tuomaala, P.; Hernandez, P.; Häkkinen, T.; Piira, K.; Piippo, J. Comfort assessment in the context of sustainable buildings: Comparison of simplified and detailed human thermal sensation methods. Build. Environ. 2014, 71, 60–70. [Google Scholar] [CrossRef]
  17. Moujalled, B.; Cantin, R.; Guarracino, G. Comparison of thermal comfort algorithms in naturally ventilated office buildings. Energy Build. 2008, 40, 2215–2223. [Google Scholar] [CrossRef]
  18. Morgan, C.; De Dear, R. Weather, clothing and thermal adaptation to indoor climate. Clim. Res. 2003, 24, 267–284. [Google Scholar] [CrossRef] [Green Version]
  19. Castilla, M.; Alvarez, J.; Berenguel, M.; Rodriguez, F.; Guzman, J.; Perez, M. A comparison of thermal comfort predictive control strategies. Energy Build. 2011, 43, 2737–2746. [Google Scholar] [CrossRef]
  20. Newsham, G.R. Clothing as a thermal comfort moderator and the effect on energy consumption. Energy Build. 1997, 26, 283–291. [Google Scholar] [CrossRef]
  21. Lee, K.H.; Schiavon, S. Influence of Three Dynamic Predictive Clothing Insulation Models on Building Energy Use, HVAC Sizing and Thermal Comfort. Energies 2014, 7, 1917–1934. [Google Scholar] [CrossRef]
  22. De Carli, M.; Olesen, B.W.; Zarrella, A.; Zecchin, R. People’s clothing behaviour according to external weather and indoor environment. Build. Environ. 2007, 42, 3965–3973. [Google Scholar] [CrossRef]
  23. Konarska, M.; Sołtynski, K.; Sudoł-Szopińska, I.; Chojnacka, A. Comparative evaluation of clothing thermal insulation measured in a thermal manikin and on volunteers. Fibres Text. East. Eur. 2007, 15, 73–79. [Google Scholar]
  24. Lee, J.-H.; Kim, Y.-K.; Kim, K.-S.; Kim, S. Estimating Clothing Thermal Insulation Using an Infrared Camera. Sensors 2016, 16, 341. [Google Scholar] [CrossRef]
  25. Miura, J.; Demura, M.; Nishi, K.; Oishi, S. Thermal comfort measurement using thermal-depth images for robotic monitoring. Pattern Recognit. Lett. 2019. [Google Scholar] [CrossRef]
  26. Humphreys, M.A.; Nicol, J.F. The validity of ISO-PMV for predicting comfort votes in every-day thermal environments. Energy Build. 2002, 34, 667–684. [Google Scholar] [CrossRef]
  27. Brager, G.S.; De Dear, R.J. Thermal adaptation in the built environment: A literature review. Energy Build. 1998, 27, 83–96. [Google Scholar] [CrossRef]
  28. Parsons, K.; Webb, L.; McCartney, K.; Humphreys, M.; Nicol, J. In A climatic chamber study into the validity of Fanger’s PMV/PPD thermal comfort index for subjects wearing different levels of clothing insulation. In Proceedings of the CIBSE National Conference, London, UK, 5–7 October 1997. [Google Scholar]
  29. Humphreys, M.; Nicol, J. Conflicting criteria for thermal sensation within the Fanger predicted mean vote equation. In Proceedings of the Cibse/Ashrae Joint National Conference, Harrogate, UK, 29 September–1 October 1996; pp. 153–158. [Google Scholar]
  30. Choi, J.-H.; Loftness, V. Investigation of human body skin temperatures as a bio-signal to indicate overall thermal sensations. Build. Environ. 2012, 58, 258–269. [Google Scholar] [CrossRef]
  31. Choi, J.-H.; Yeom, D. Investigation of the relationships between thermal sensations of local body areas and the whole body in an indoor built environment. Energy Build. 2017, 149, 204–215. [Google Scholar] [CrossRef]
  32. Karjalainen, S. Gender differences in thermal comfort and use of thermostats in everyday thermal environments. Build. Environ. 2007, 42, 1594–1603. [Google Scholar] [CrossRef]
  33. Indraganti, M.; Rao, K.D. Effect of age, gender, economic group and tenure on thermal comfort: A field study in residential buildings in hot and dry climate with seasonal variations. Energy Build. 2010, 42, 273–281. [Google Scholar] [CrossRef]
  34. Park, J.Y.; Nagy, Z. Comprehensive analysis of the relationship between thermal comfort and building control research—A data-driven literature review. Renew. Sustain. Energy Rev. 2018, 82, 2664–2679. [Google Scholar] [CrossRef]
  35. Jiang, L.; Yao, R. Modelling personal thermal sensations using C-Support Vector Classification (C-SVC) algorithm. Build. Environ. 2016, 99, 98–106. [Google Scholar] [CrossRef] [Green Version]
  36. Ghahramani, A.; Castro, G.; Becerik-Gerber, B.; Yu, X. Infrared thermography of human face for monitoring thermoregulation performance and estimating personal thermal comfort. Build. Environ. 2016, 109, 1–11. [Google Scholar] [CrossRef] [Green Version]
  37. Mert, E.; Psikuta, A.; Bueno, M.-A.; Rossi, R.M. Effect of heterogenous and homogenous air gaps on dry heat loss through the garment. Int. J. Biometeorol. 2015, 59, 1701–1710. [Google Scholar] [CrossRef]
  38. Wang, Y.; Li, X.; Lu, Y. Effects of Body Postures on Clothing Air Gap in Protective Clothing. J. Fiber Bioeng. Inform. 2011, 4, 277–283. [Google Scholar] [CrossRef]
  39. Alfano, F.R.D.; Palella, B.I.; Riccio, G. The role of measurement accuracy on the thermal environment assessment by means of PMV index. Build. Environ. 2011, 46, 1361–1369. [Google Scholar] [CrossRef]
  40. Frackiewicz-Kaczmarek, J. Determination of the Air Gap Thickness and the Contact Area under Wearing Conditions; Université de Haute Alsace-Mulhouse: Mulhouse, France, 2013. [Google Scholar]
  41. Minitab Statistical Software, 13; Minitab, LLC: State College, PA, USA, 2000.
  42. Helsel, D.R. Statistics for Censored Environmental DataUsing Minitab® and R; John Wiley & Sons: New York, NY, USA, 2011; Volume 77. [Google Scholar]
  43. Efroymson, M. Multiple regression analysis. In Mathematical Methods for Digital Computers; Ralston, A., Wilf, H.S., Eds.; Wiley: New York, NY, USA, 1960. [Google Scholar]
  44. Ghani, I.M.M.; Ahmad, S. Stepwise Multiple Regression Method to Forecast Fish Landing. Procedia Soc. Behav. Sci. 2010, 8, 549–554. [Google Scholar] [CrossRef] [Green Version]
  45. Bhargava, N.; Sharma, G.; Bhargava, R.; Mathuria, M. Decision tree analysis on j48 algorithm for data mining. Proc. Int. J. Adv. Res. Comput. Sci. Softw. Eng. 2013, 3. [Google Scholar]
  46. Zhao, Y.; Zhang, Y. Comparison of decision tree methods for finding active objects. Adv. Space Res. 2008, 41, 1955–1959. [Google Scholar] [CrossRef]
  47. Davoodi, F.; Hassanzadeh, H.; Zolfaghari, S.A.; Havenith, G.; Maerefat, M. A new individualized thermoregulatory bio-heat model for evaluating the effects of personal characteristics on human body thermal response. Build. Environ. 2018, 136, 62–76. [Google Scholar] [CrossRef] [Green Version]
Figure 1. Floor plan of the experimental chamber.
Sustainability 11 05702 g001
Figure 2. Measuring the skin (forehead) and clothing surface (chest and thighs) temperatures.
Sustainability 11 05702 g002
Figure 3. Flowchart of experiments.
Sustainability 11 05702 g003
Figure 4. Interval plot of skin temperature by clo value and air temperature.
Sustainability 11 05702 g004
Figure 5. Interval plot of top clothing temperature by clo value and air temperature.
Sustainability 11 05702 g005
Figure 6. Interval plot of bottom clothing temperature by clo value and air temperature.
Sustainability 11 05702 g006
Figure 7. Interval plot of predicted clo level (six test datasets).
Sustainability 11 05702 g007
Figure 8. Interval plot of predicted clo level (Subjects 1–6).
Sustainability 11 05702 g008aSustainability 11 05702 g008b
Figure 9. Accuracy of decision trees according to combinations of attributes.
Sustainability 11 05702 g009
Figure 10. Interval plot of skin temperature by clo value, air temperature, and BMI.
Sustainability 11 05702 g010
Figure 11. Interval plot of top clothing surface temperature by clo vlaue, air temperature, and BMI.
Sustainability 11 05702 g011
Figure 12. Interval plot of bottom clothing surface temperature by clo value, air temperature, and BMI.
Sustainability 11 05702 g012
Figure 13. Interval plot of predicted clo values by BMI.
Sustainability 11 05702 g013
Table 1. Specifications of the experimental instruments.
Measuring VariablesExperimental InstrumentAccuracy
Air temperatureTesto 480 ±0.5 °C
Mean radiant temperatureTesto 480 ±1.5 °C
Relative humidity Testo 480 ±(1.8% rh + 0.7% of measured value)
Wind speedTesto 480 ±(0.03 m/s + 4.0% of measured value)
CO2TSI IAQ-Calc M7515±(50 ppm or 3.0% of measured value)
Skin and clothing temperatureThermocouple T-type±(1.0 °C or 0.75% of measured value)
Data acquisition board 1NI-cDAQ 9178 Resolution: 32 bits, Sampling rate: 1.6 MS/s
Data acquisition board 2NI 9213Resolution: 24 bits, Sampling rate: 75 S/s
Table 2. Information on the human subjects.
Number of Test ParticipantsBody Mass Index (BMI)AgeHeight (cm)Weight (kg)
2021.6 ± 2.0325.9 ± 1.73173.2 ± 4.0464.7 ± 6.37
Table 3. Seasonal clothing ensembles.
Season I c l   ( clo ) Clothing Ensemble
Winter0.96Briefs, singlet, shirt, thick sweatshirts, sweatpants, and slippers
Spring/Fall0.70Briefs, singlet, sweatshirts, sweatpants, and slippers
Summer0.41Briefs, singlet, short-sleeve shirt, shorts, and slippers
Table 4. Stepwise analysis of all variables and clo values.
Step 1Step 2Step 3Step 4Step 5Step 6Step 7
Coef.PCoef.PCoef.PCoef.PCoef.PCoef.PCoef.P
Ta−0.0960.000−0.0900.000−0.0610.000−0.0540.000−0.0350.000−0.0840.000−0.0840.000
Tcl_bottom −0.0920.000−0.1240.000−0.1430.000−0.1380.0000.1280.0000.1270.000
Tcl_top −0.1240.000−0.1440.000−0.1370.000−0.1400.000−0.1410.000
BMI −0.0240.000−0.0170.000−0.0170.000−0.0160.000
Tsk 0.0590.0000.0500.0000.0490.000
MRT 0.0360.0000.0330.000
rh −0.0020.000
R-sq34.59%49.56%64.45%71.64%73.83%74.44%74.80%
∆ R-sq 14.97%14.89%7.19%2.19%0.61%0.36%
Table 5. Accuracy of decision trees according to combinations of attributes.
Combination of AttributesAccuracy (%)
ATa69.46
BTa and Tcl_b65.02
CTa, Tcl_b, and Tcl_t 80.44
DTa, Tcl_b, and Tcl_t, and BMI88.04
ETa, Tcl_b, Tcl_t, BMI, and Tsk75.77
FTa, Tcl_b, Tcl_t, BMI, Tsk, and Tr74.87
GTa, Tcl_b, Tcl_t, BMI, Tsk, Tr, and rh76.16
HTa, Tcl_b, Tcl_t, BMI, Tsk, Tr, rh, and V76.16
Table 6. Confusion matrix of classified clo values.
Classification
LowMidHigh
cloLow565700
Mid86937110
High041758
Precision 86.79%89.41%87.33%
Table 7. BMI classification of subjects by WHO.
BMIRangeSubjects
Underweight18.51
Normal weight18.5–24.916
Overweight25.0–29.93
Obese300
Total 20
Table 8. Error in predicted clo values by BMI.
Clo Value
0.410.70.96
BMIHighLowHighLowHighLow
Predicted clo0.530.520.770.760.910.98
Δ ( Predicted   clo     actual   clo ) 0.120.110.070.060.050.02
Error29.27%26.83%10.00%8.57%5.21%2.08%

