Parametric Modeling for Form-Based Planning in Dense Urban Environments


Abstract
:
1. Introduction
“… it arranges in useful order the elements of urbanism by classifying them from rural to urban. Every urban element finds a place within its continuum. For example, a street is more urban than a road, a curb more urban than a swale, a brick wall more urban than a wooden one, and an alley of trees more urban than a cluster. Even the character of streetlights can be assigned in the transect according to the fabrication from cast iron (most urban), extruded pipe, or wood post (most rural)”.[9]
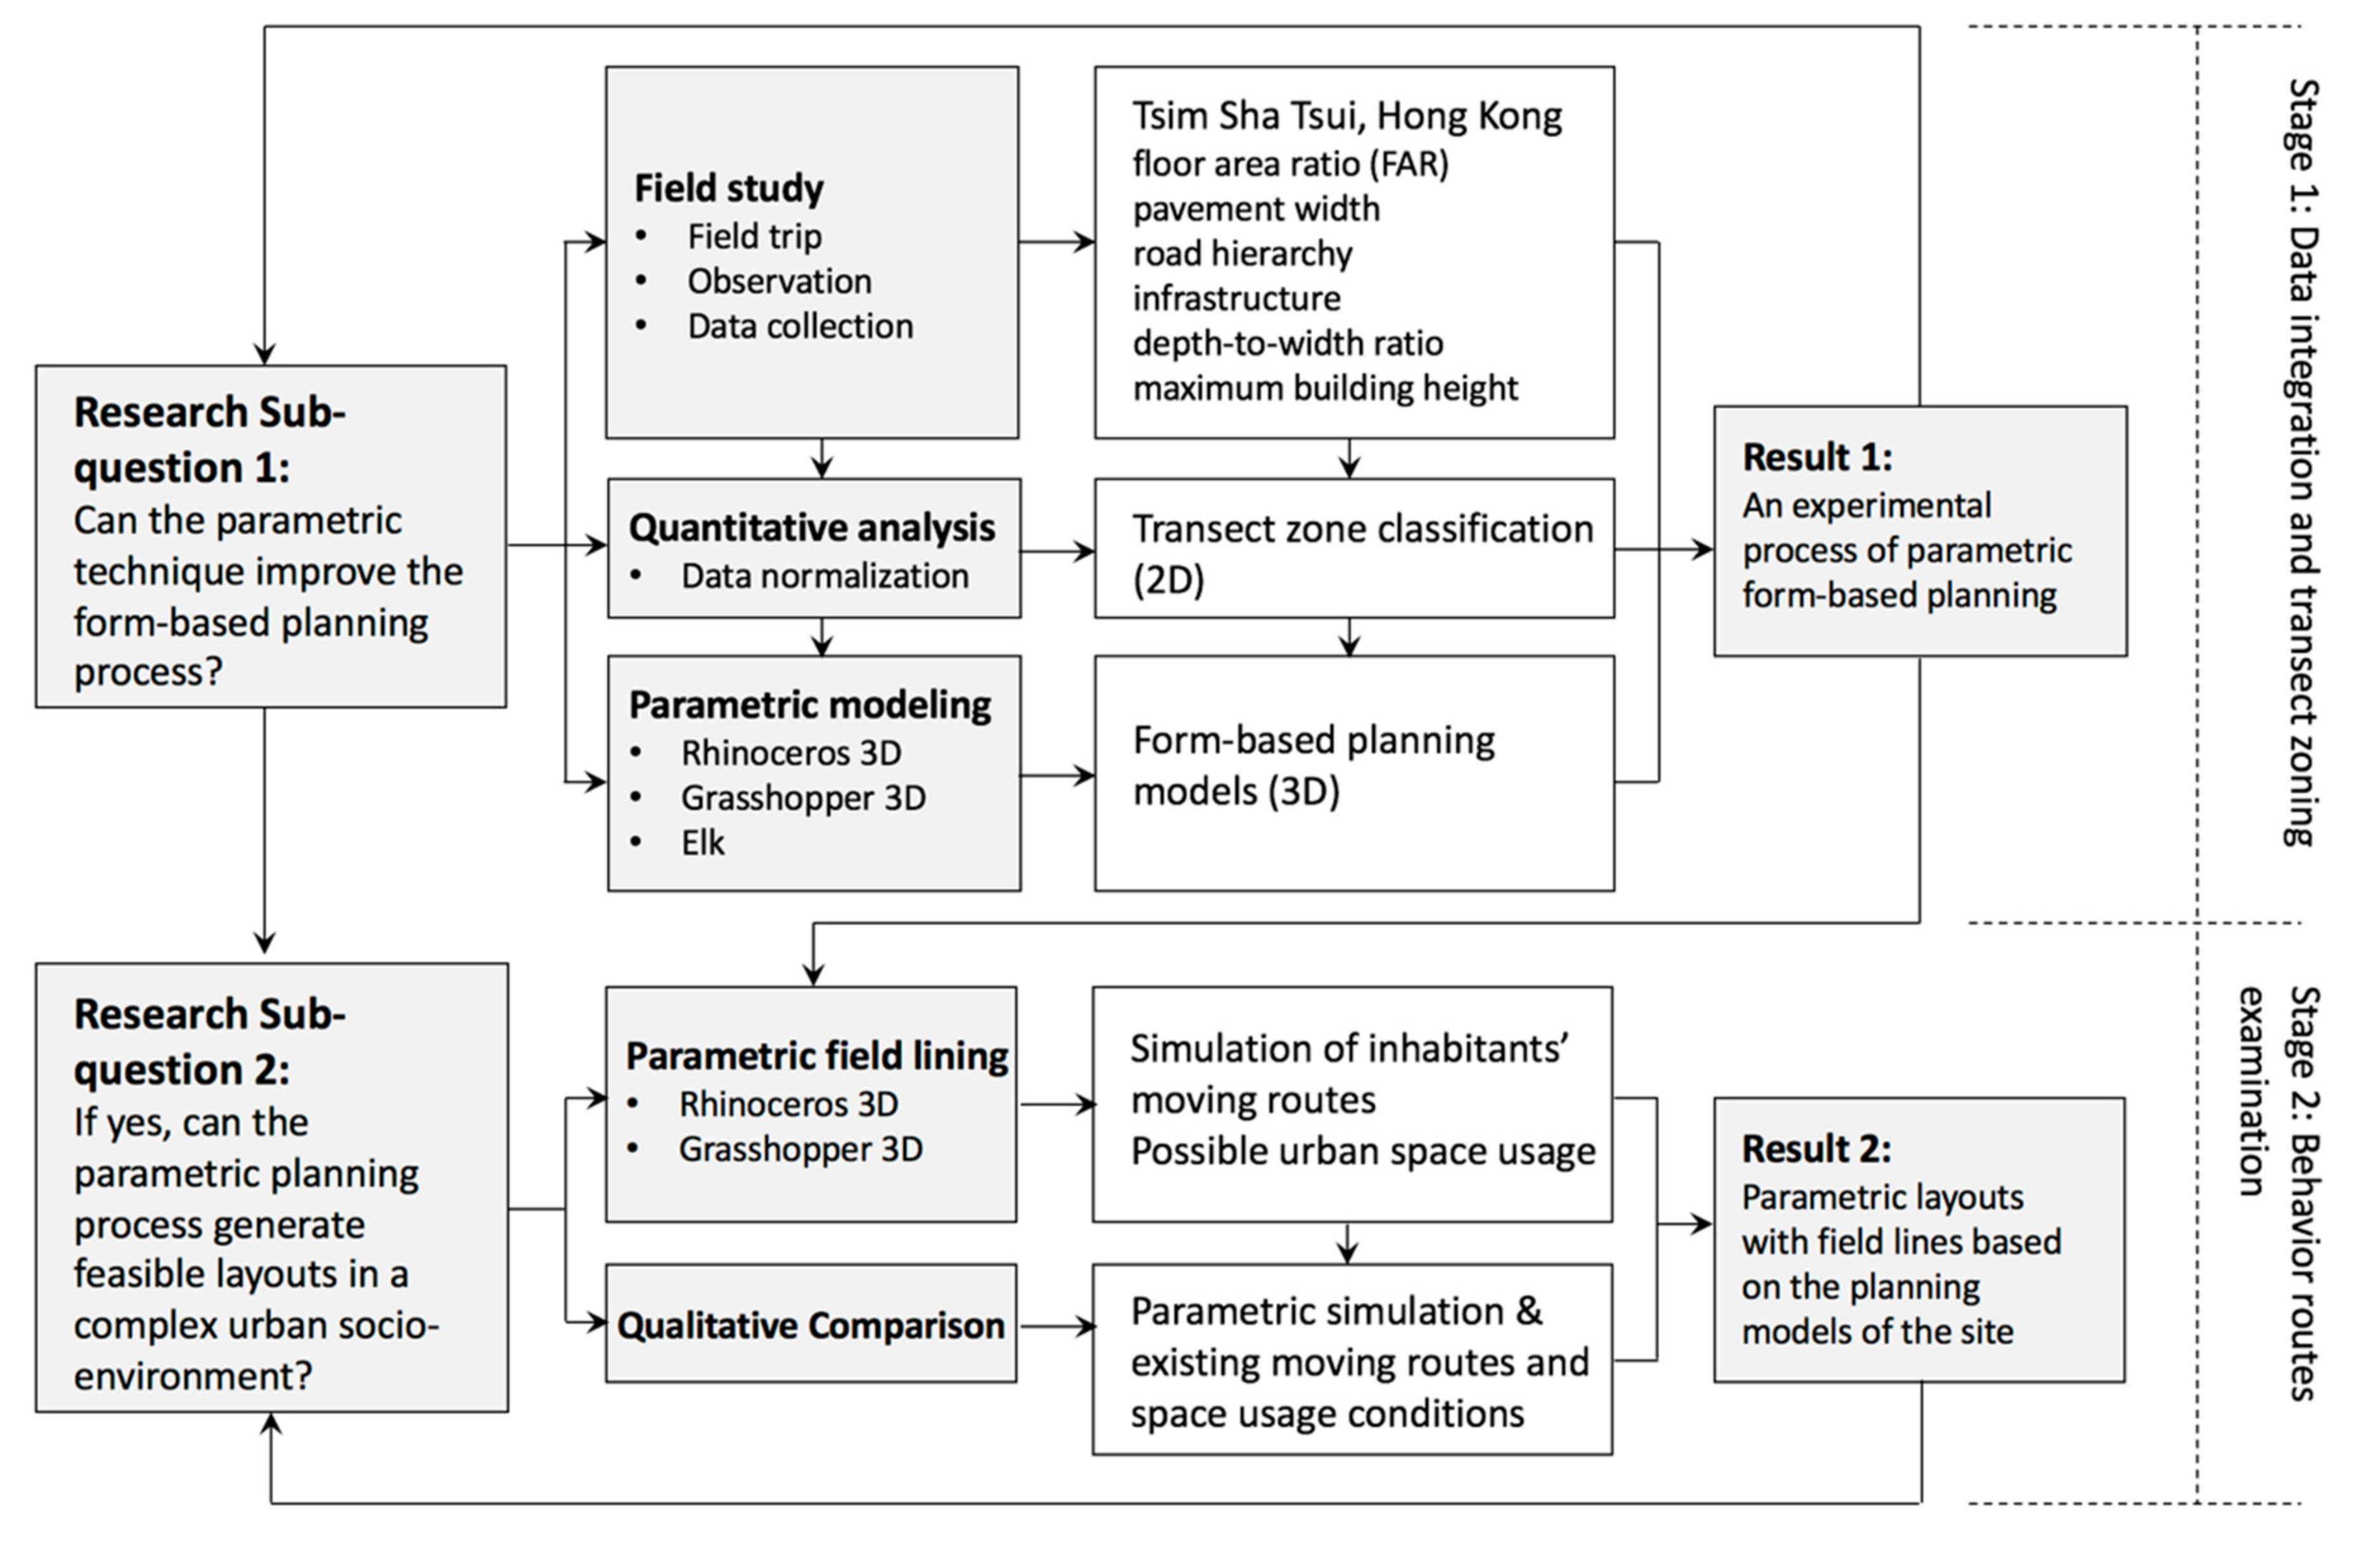
2. Methods
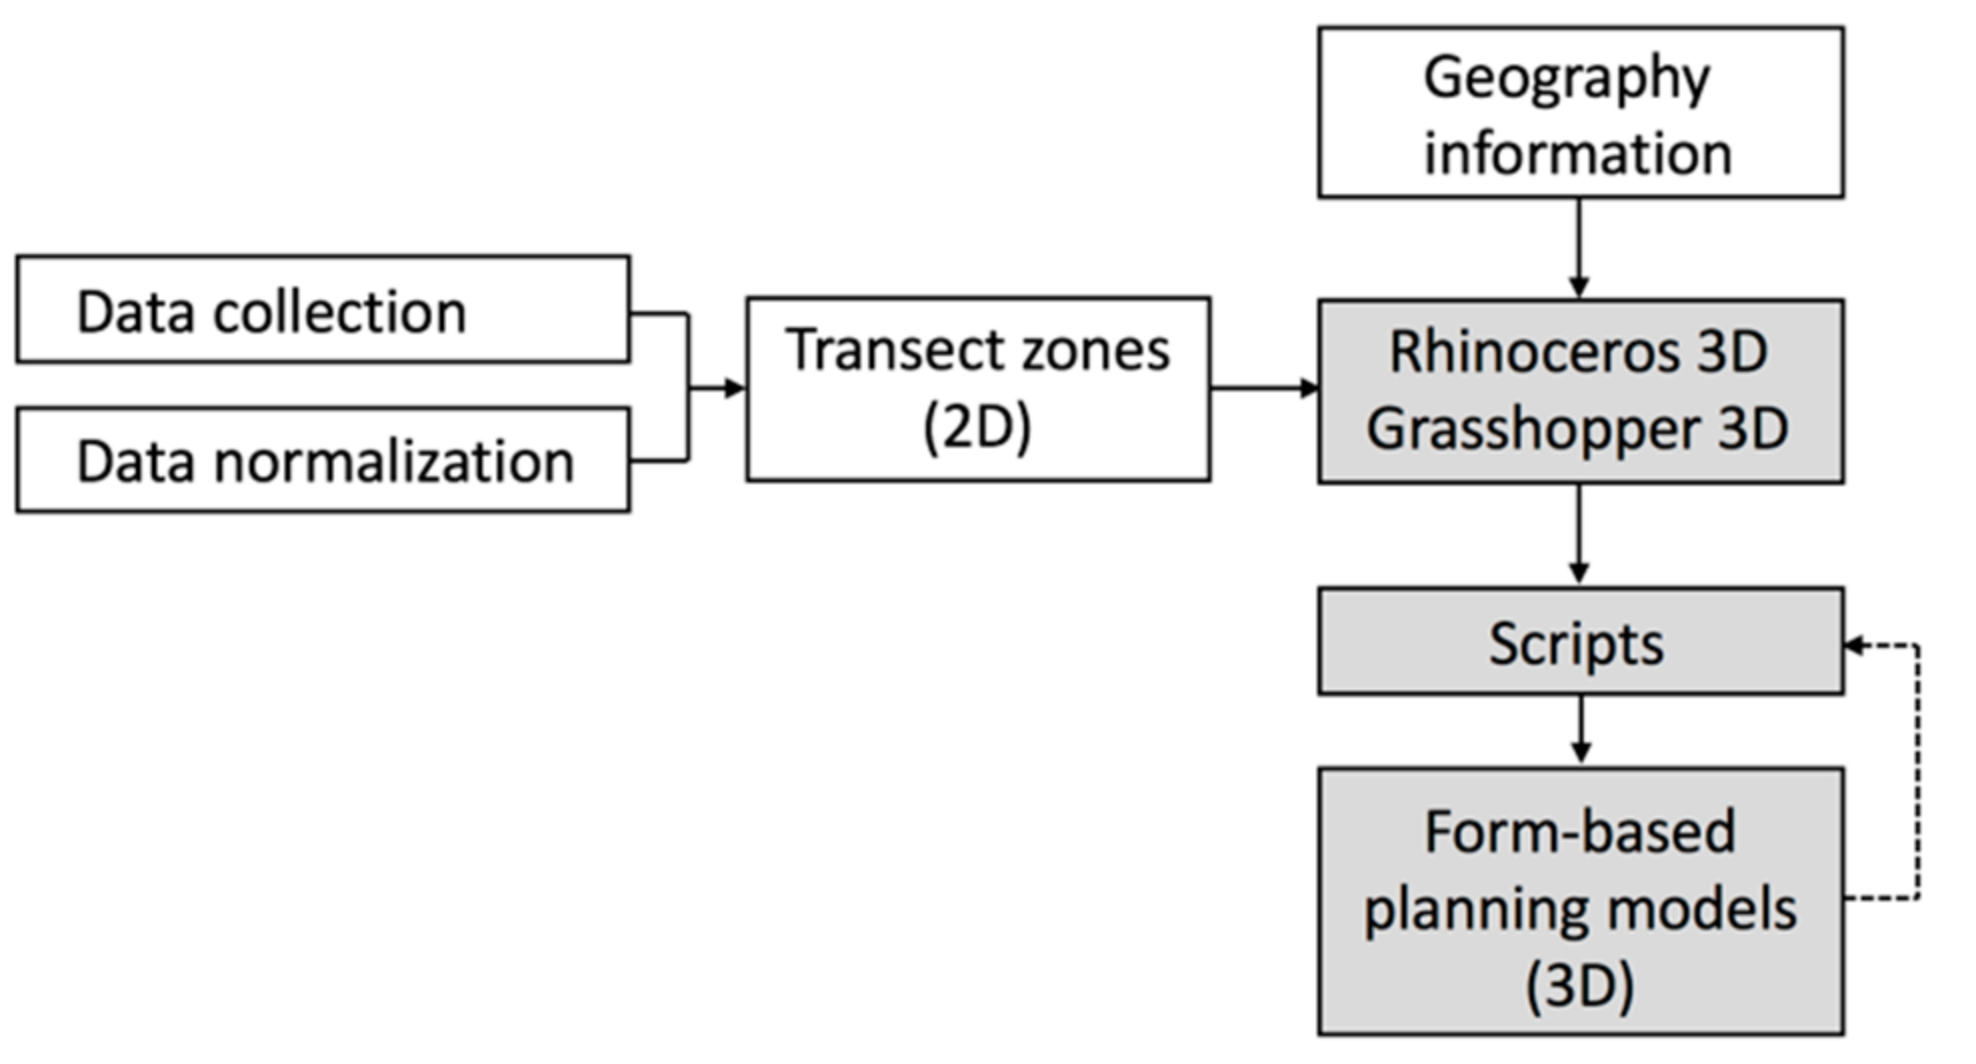
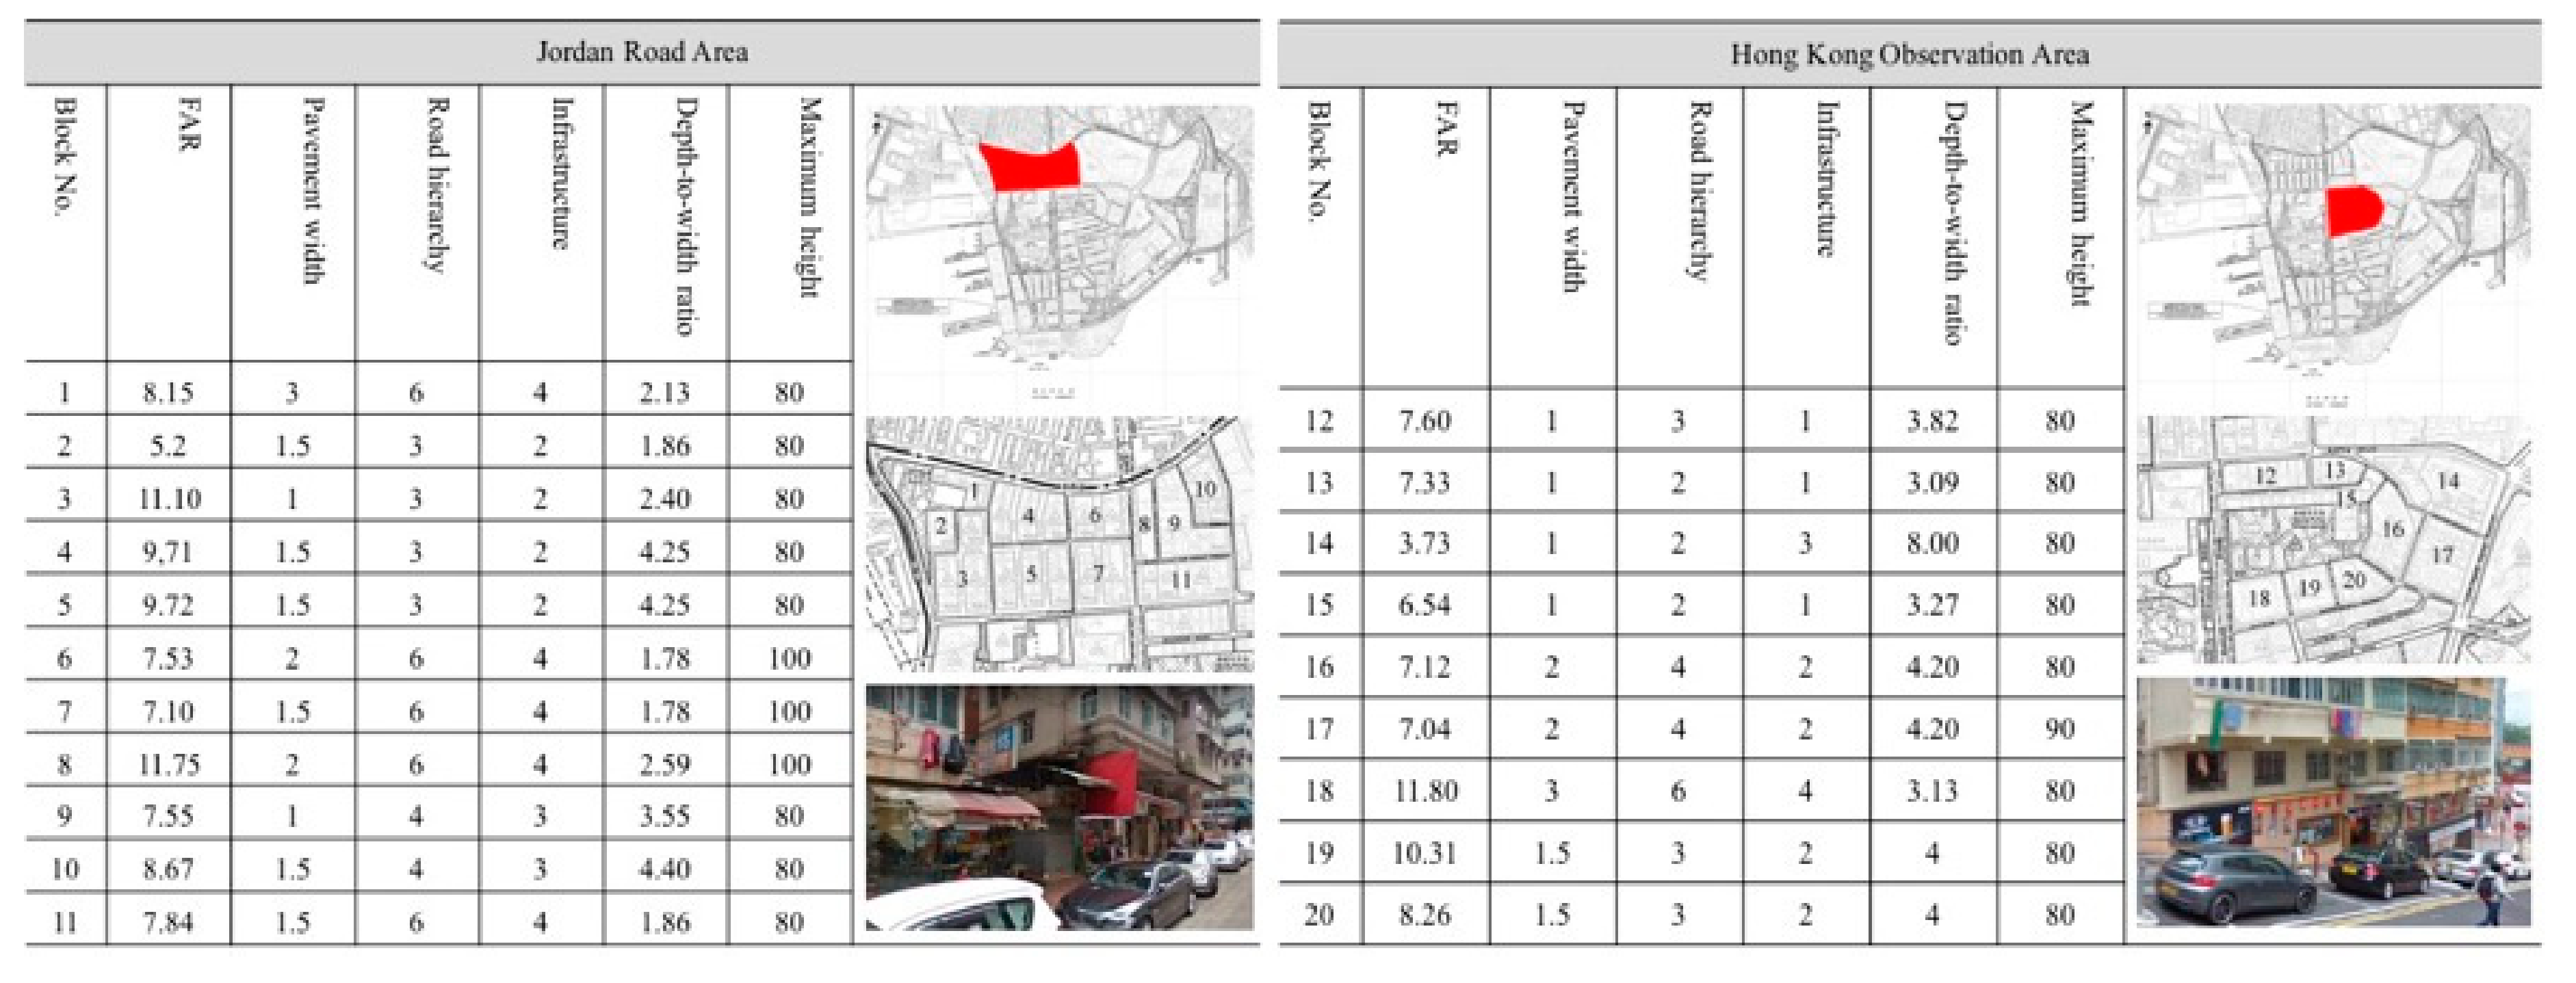
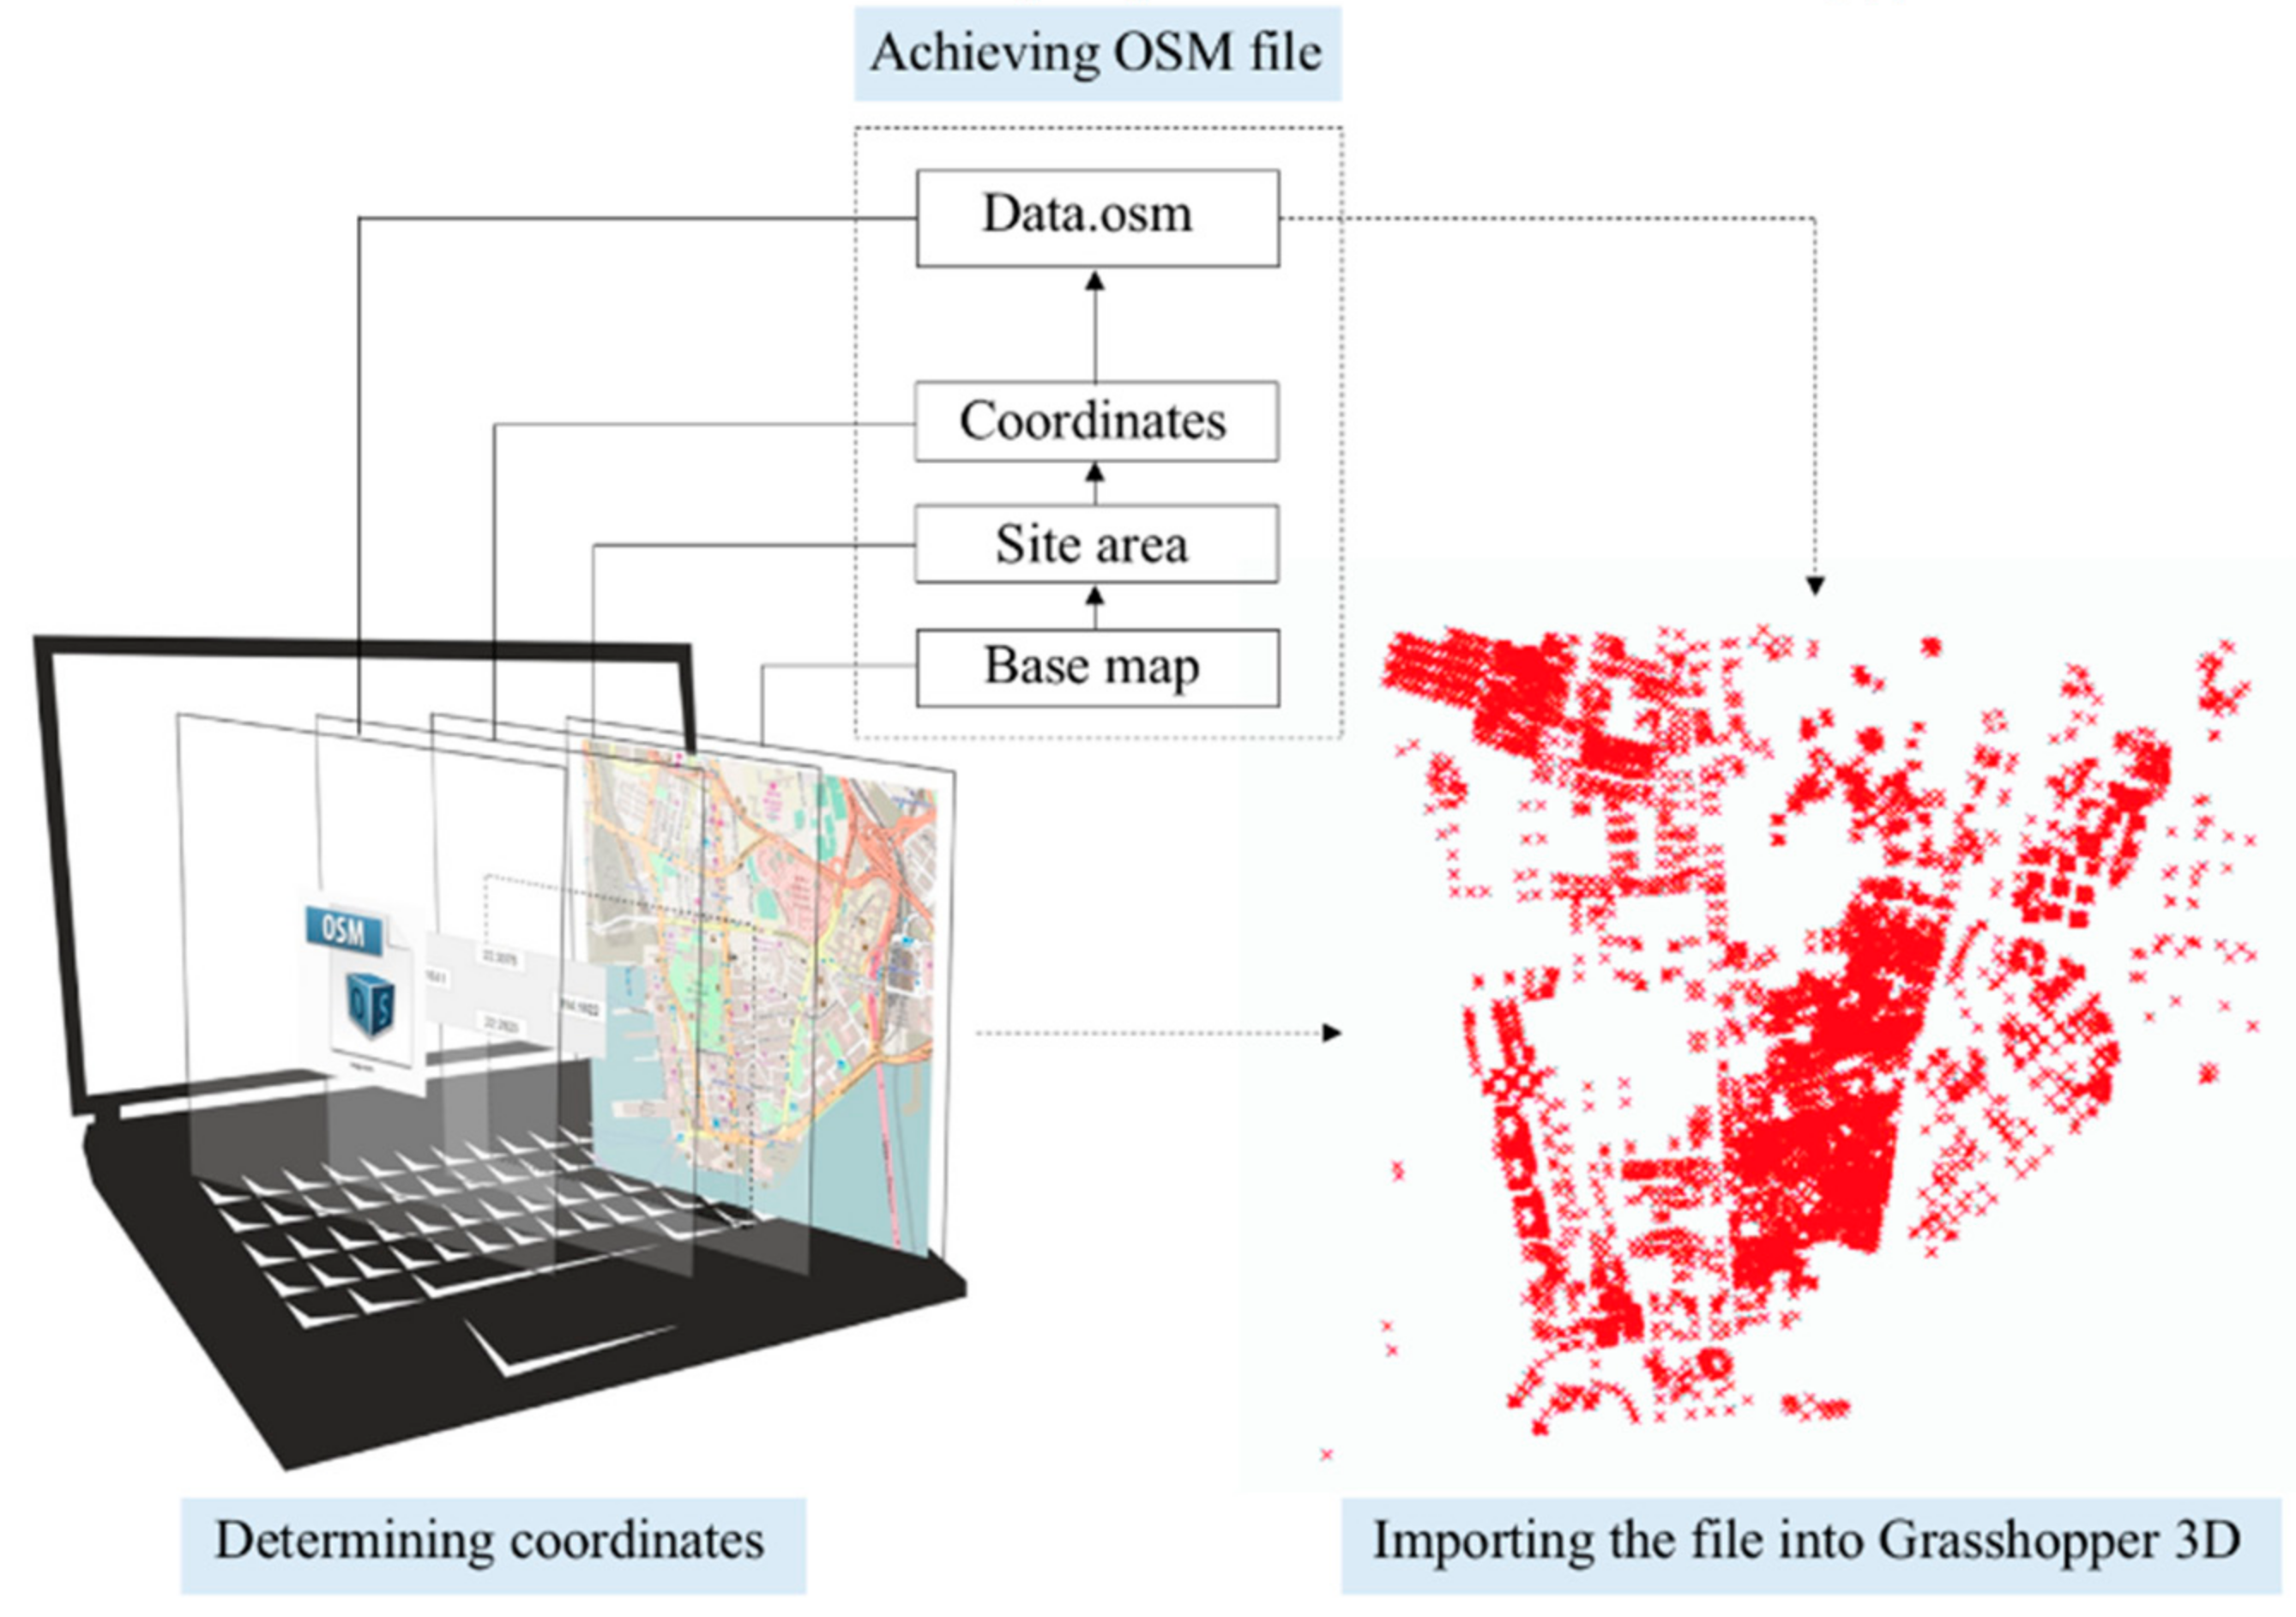
2.1. Stage 1: Data Integration and Transect Zoning
2.1.1. Field Study
2.1.2. Quantitative Analysis
2.1.3. Parametric Modeling
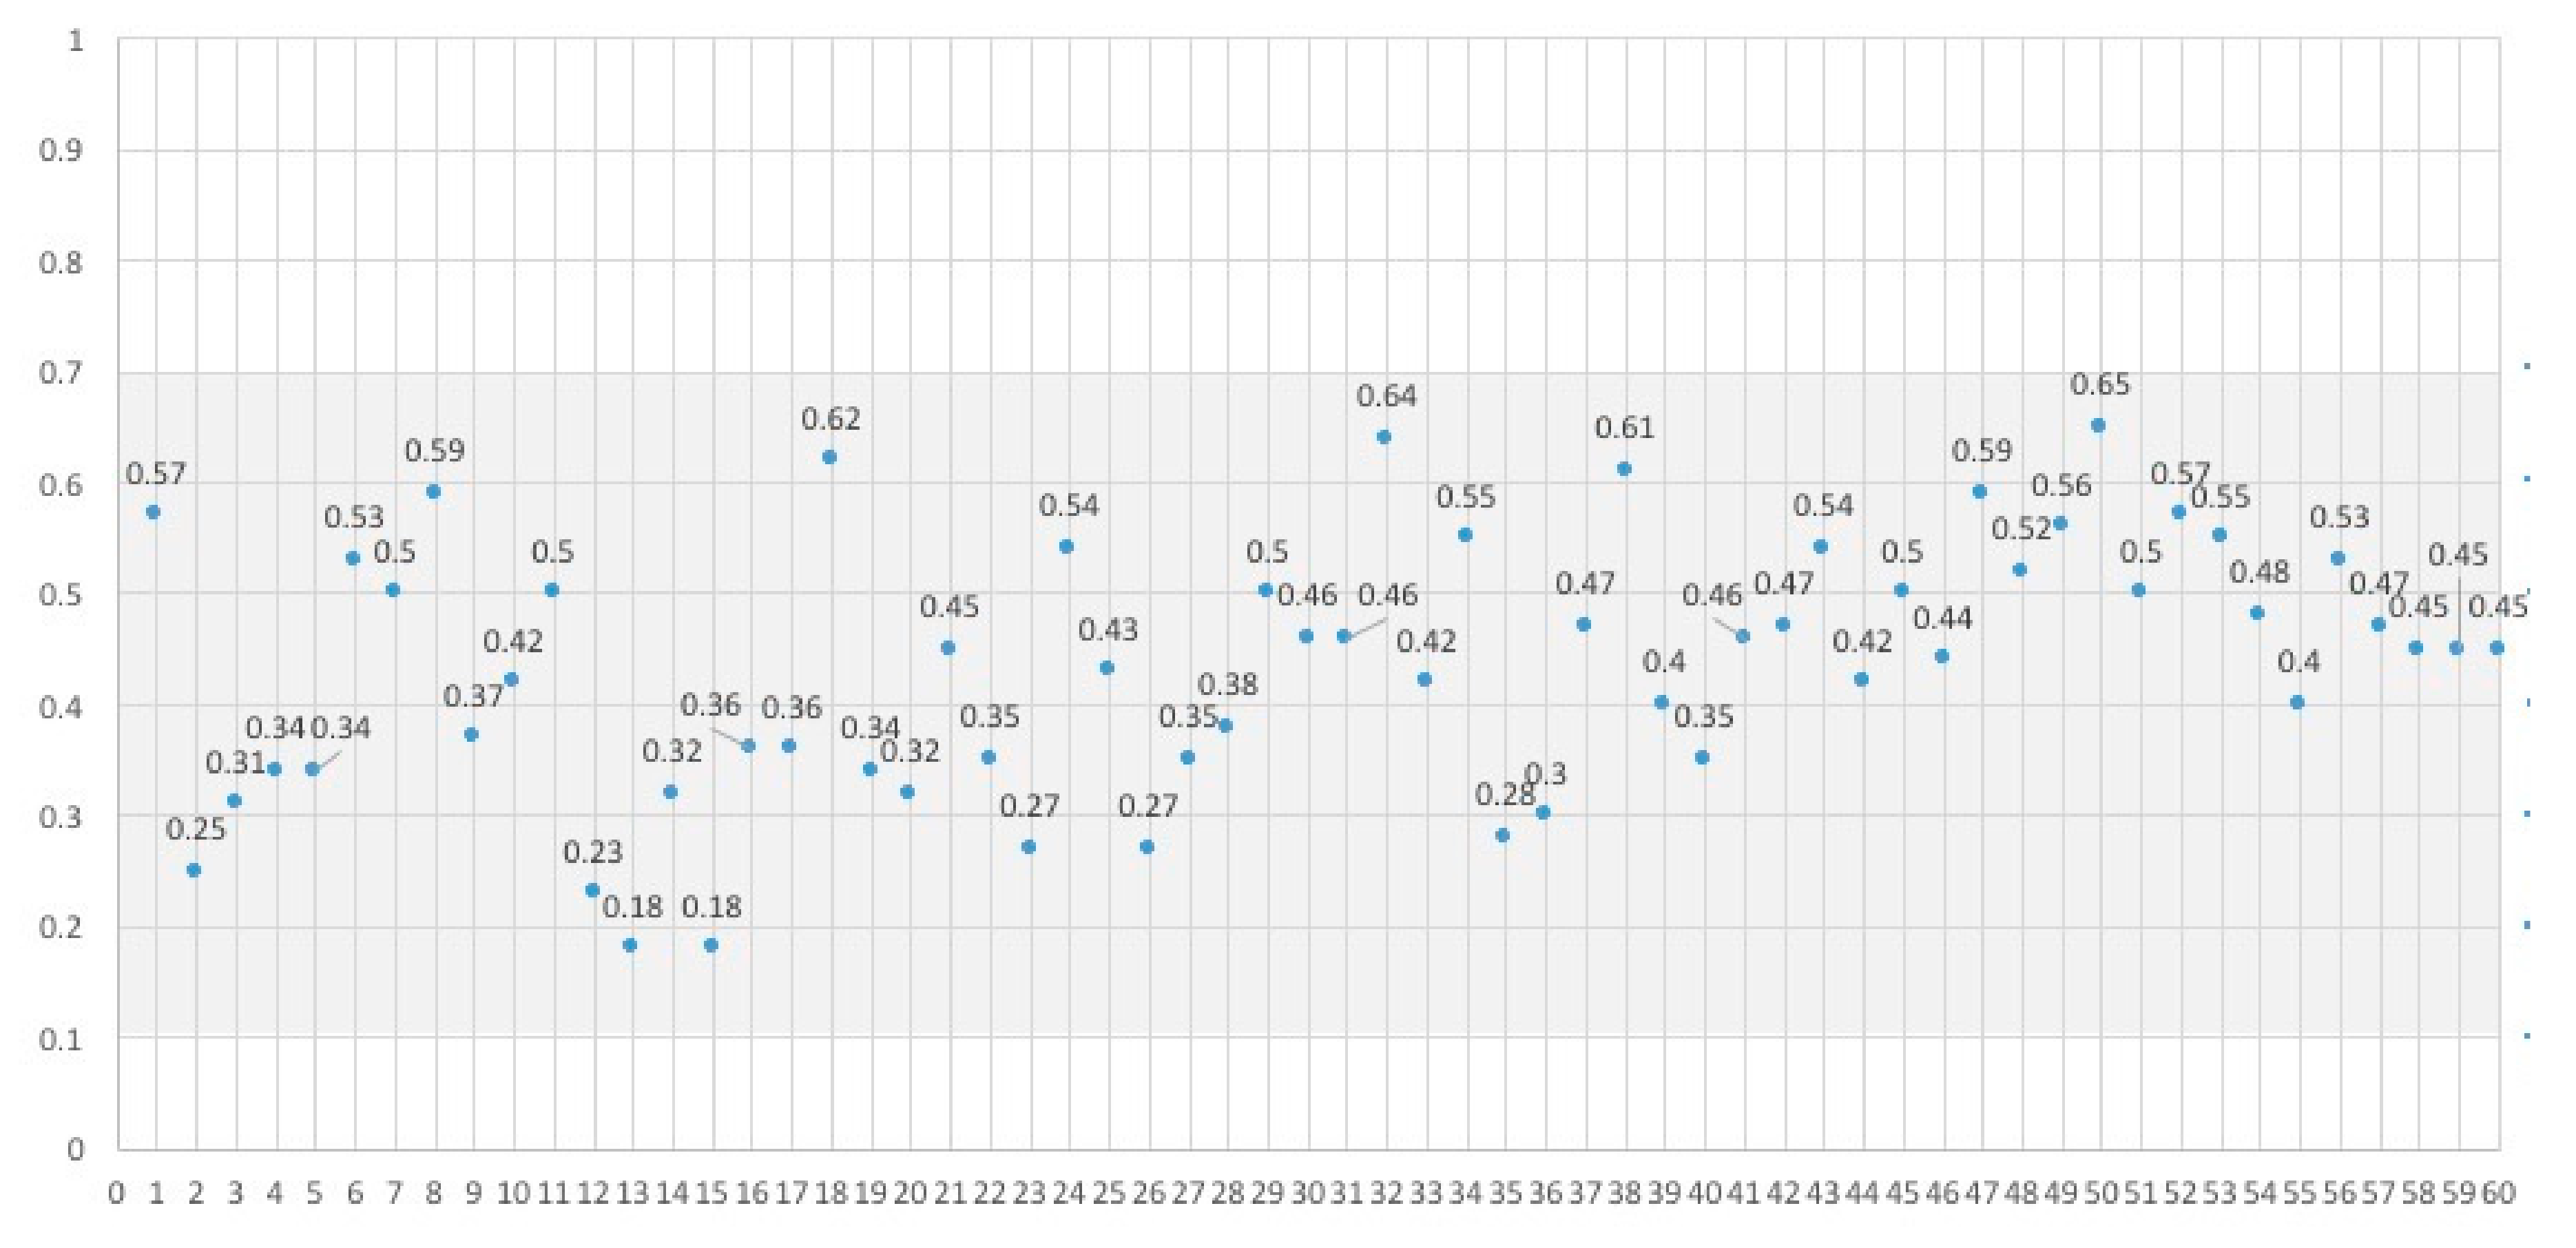
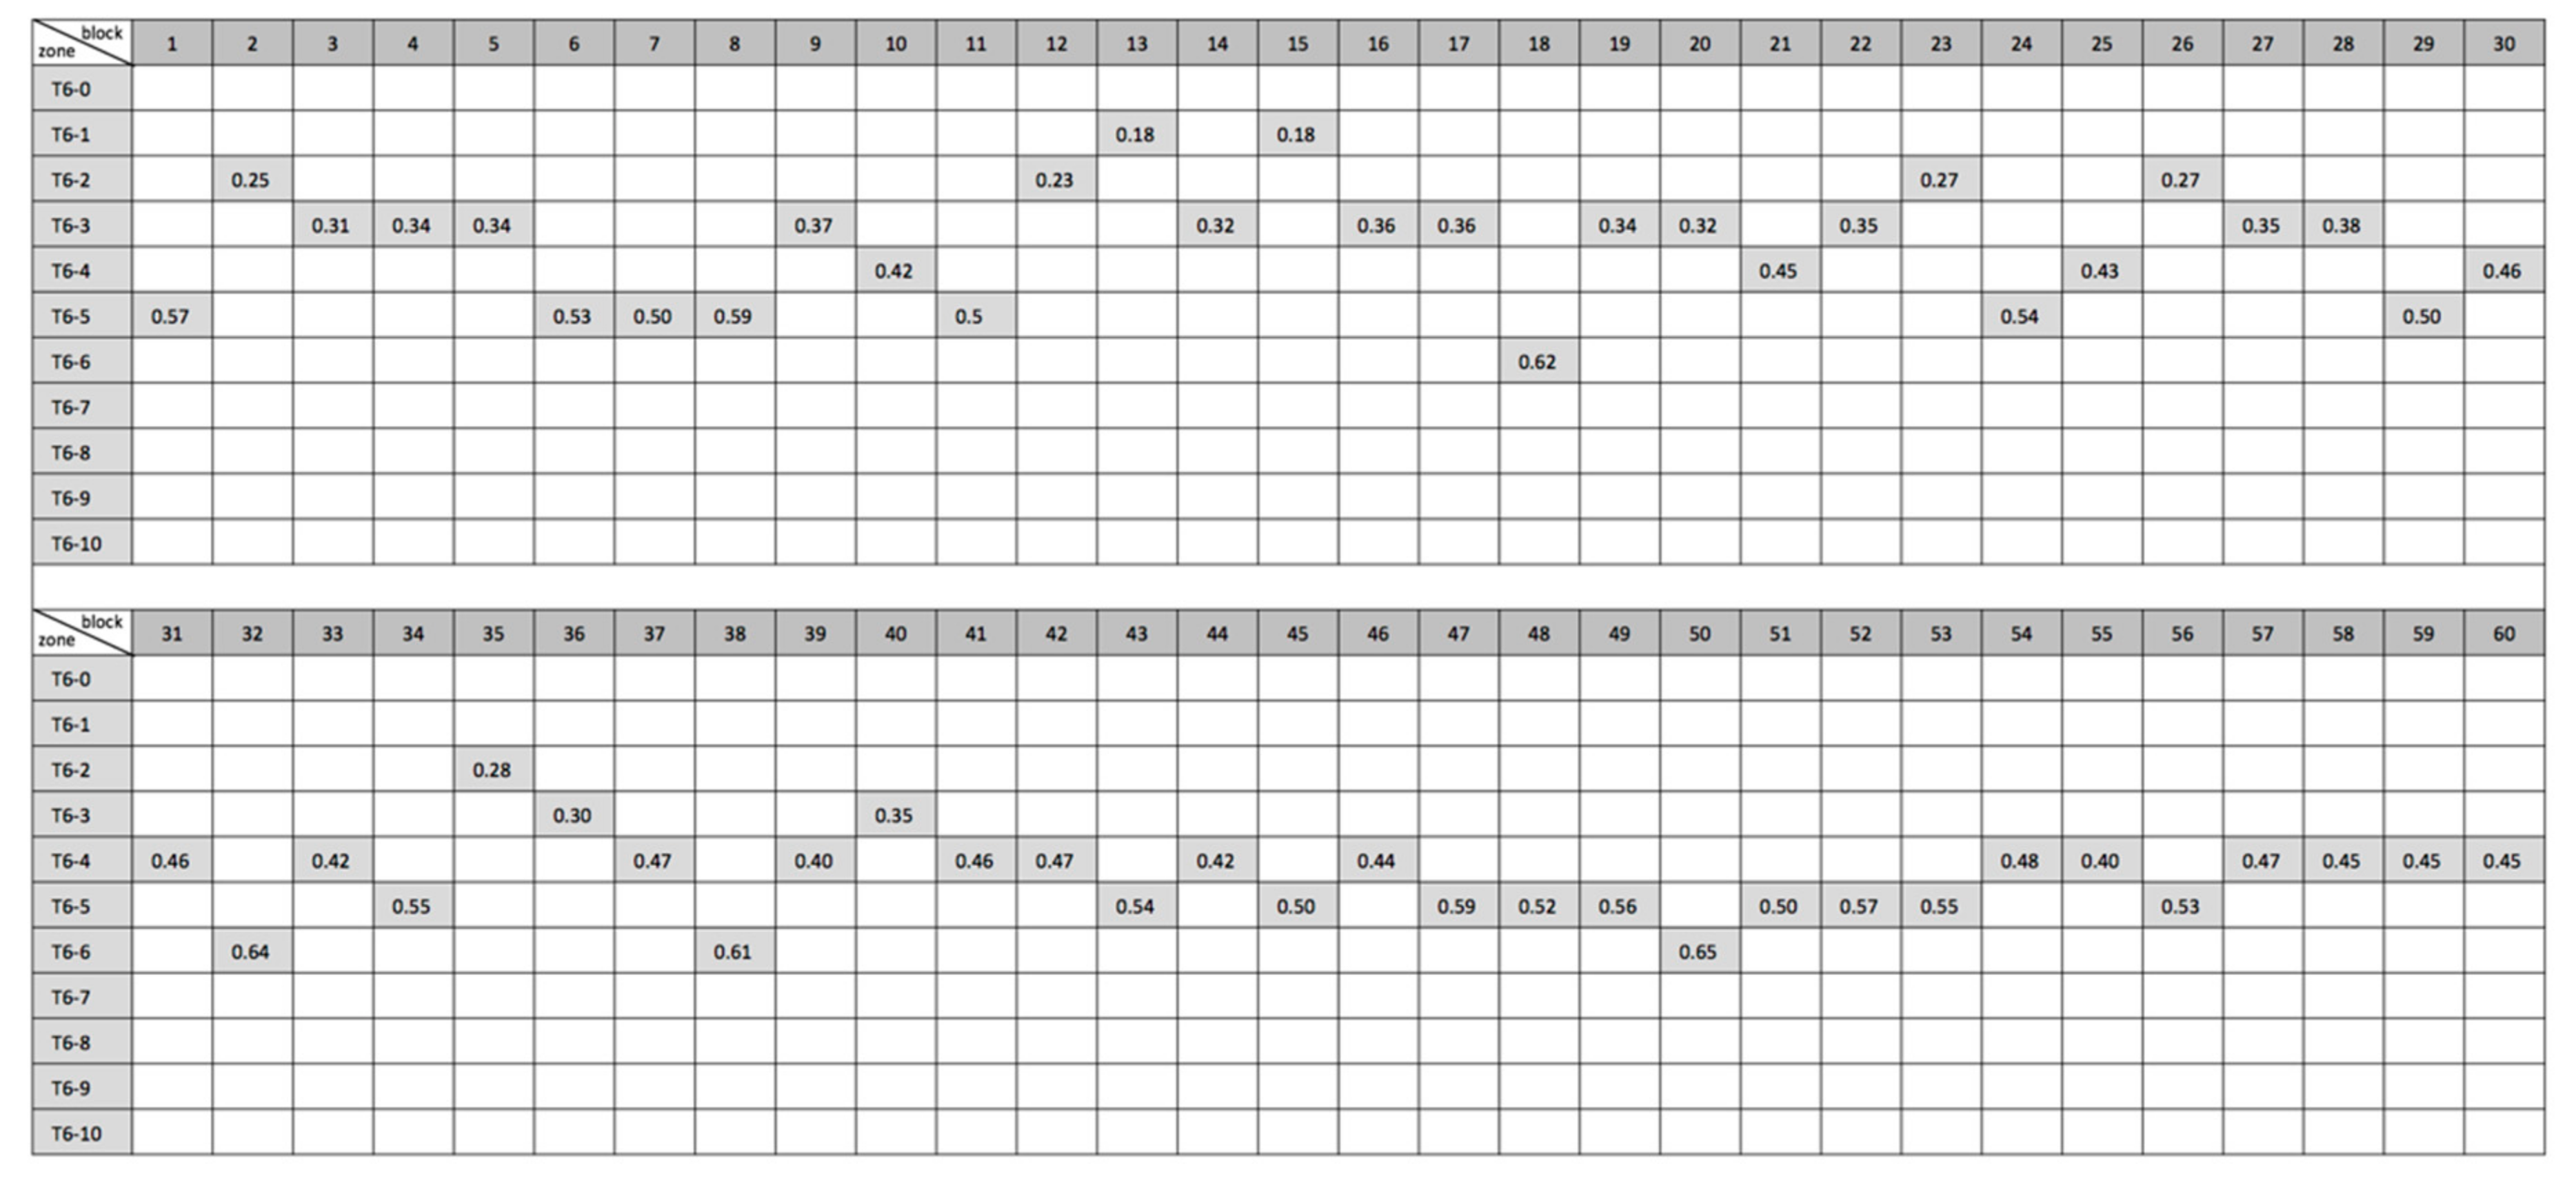
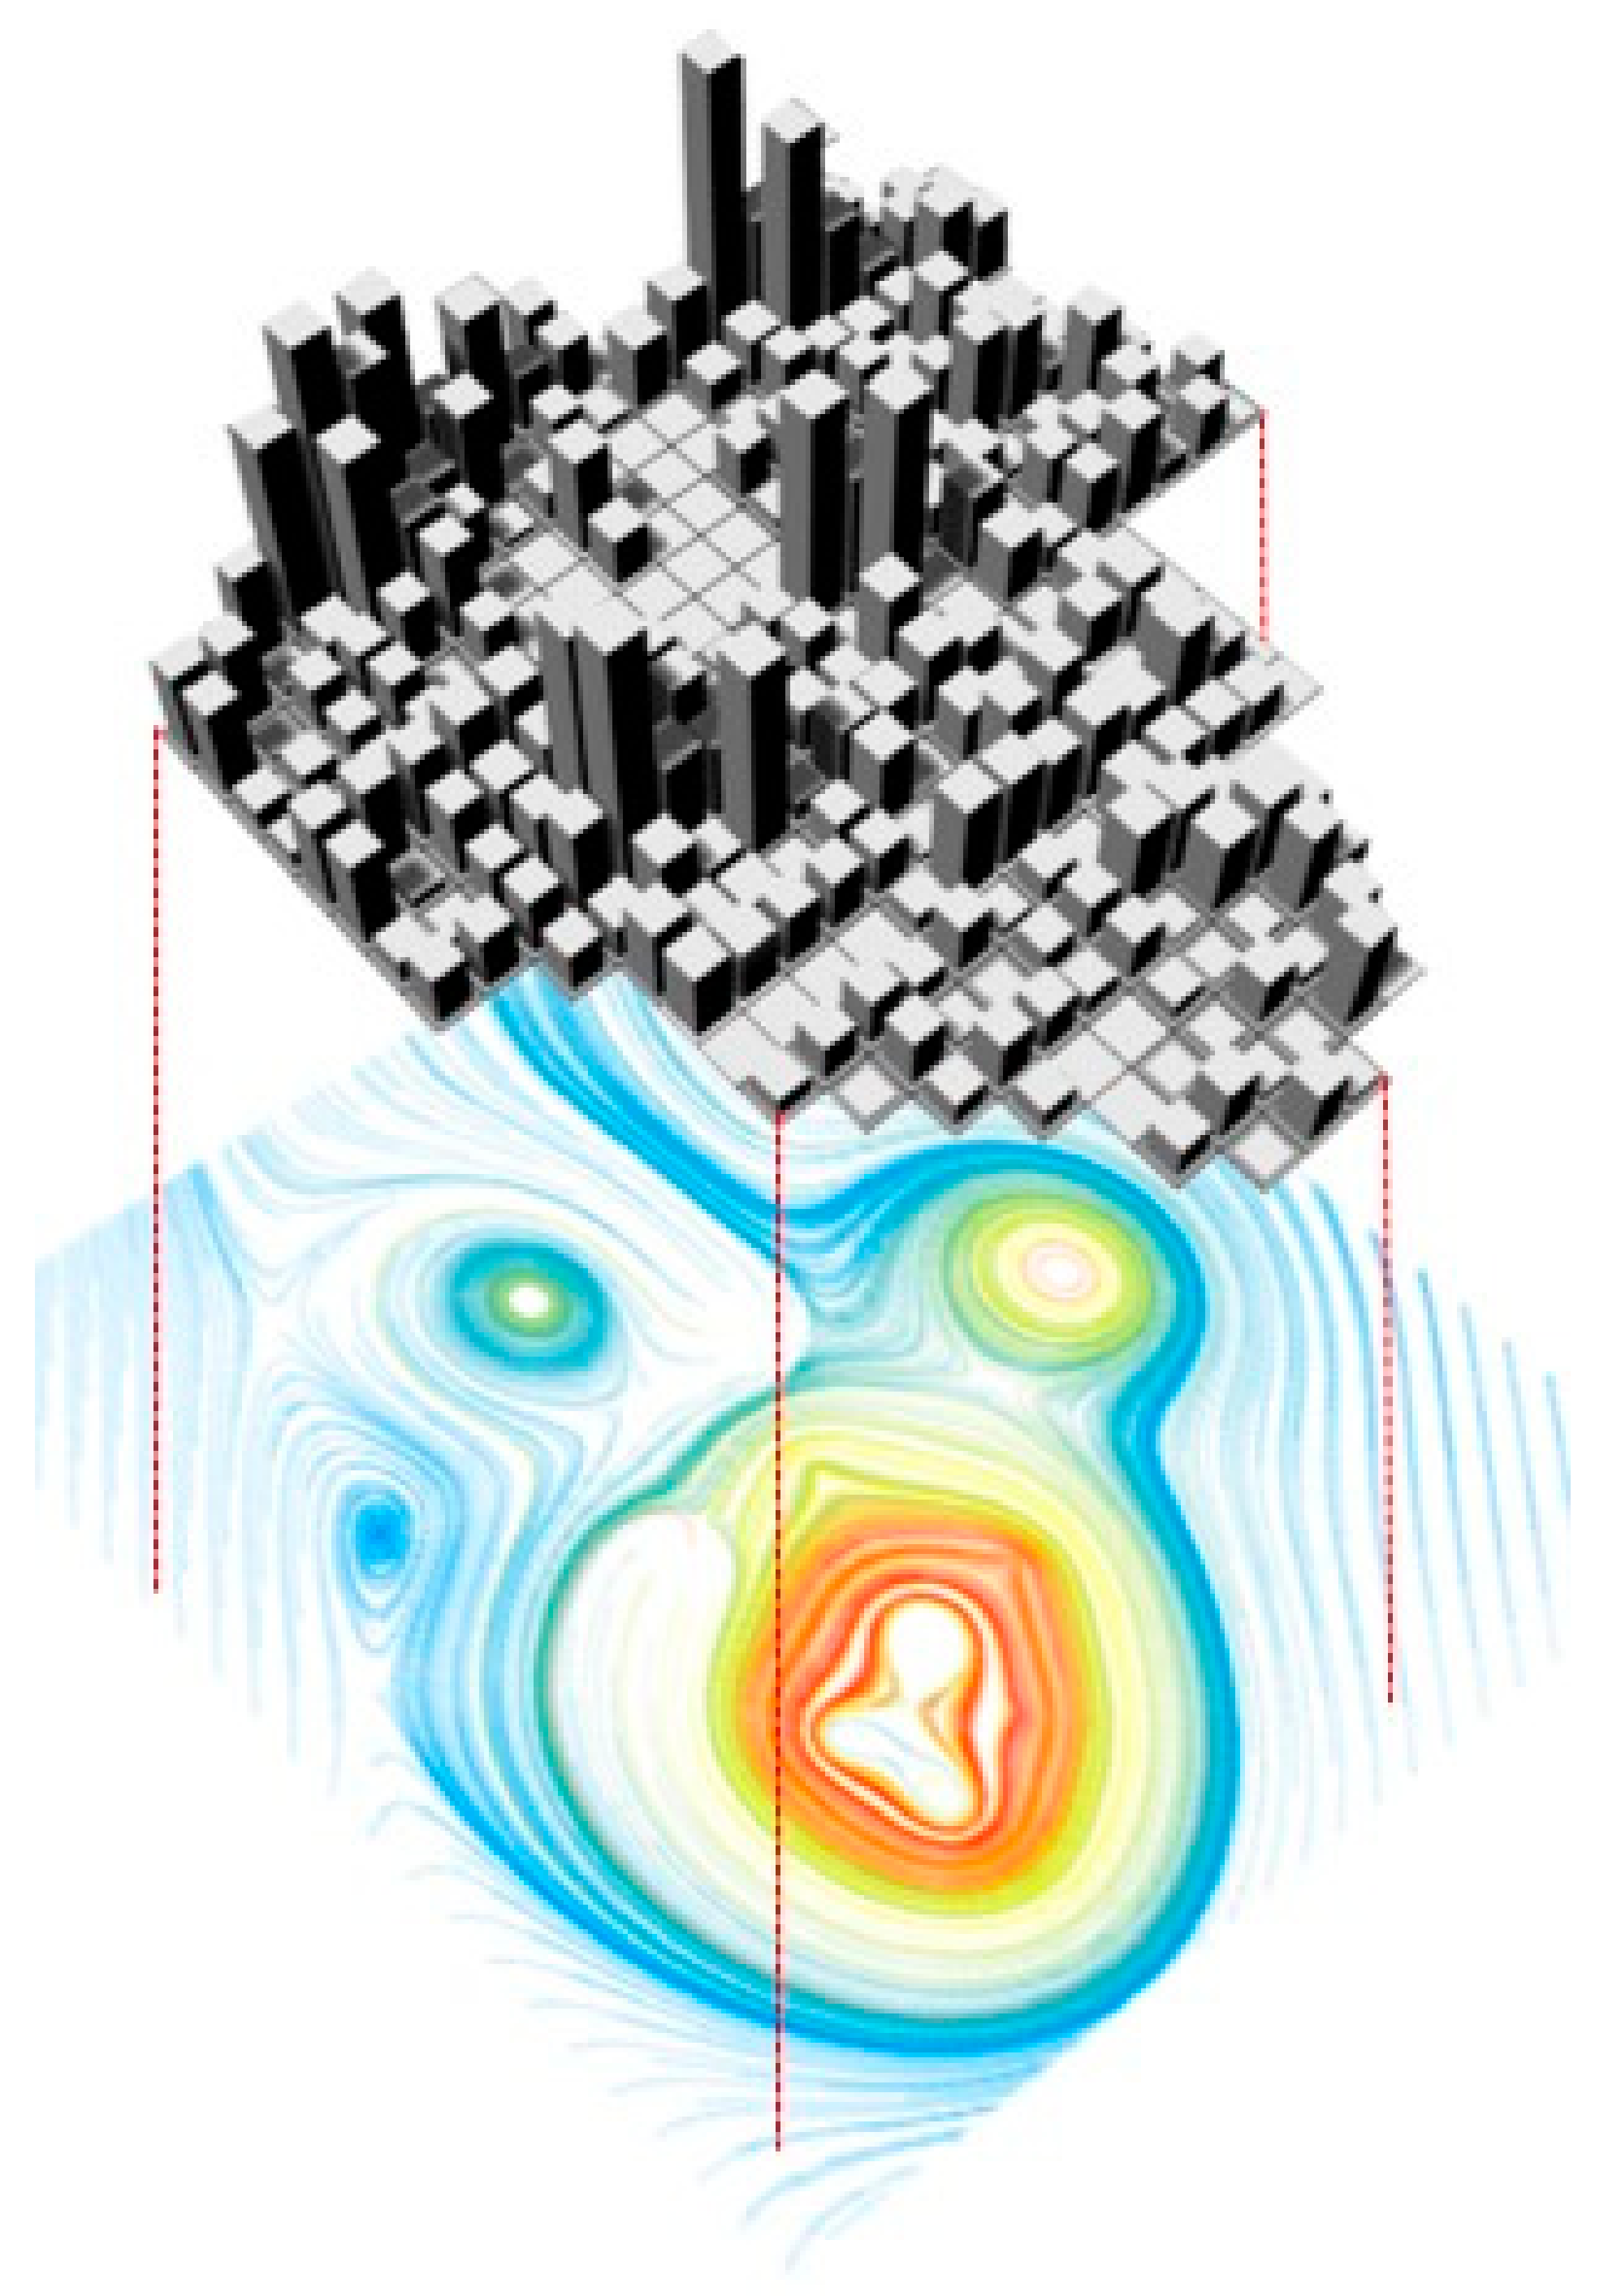
2.2. Behavior Route Examination
2.2.1. Parametric Field Lining
2.2.2. Qualitative Analysis
3. Results and Discussion
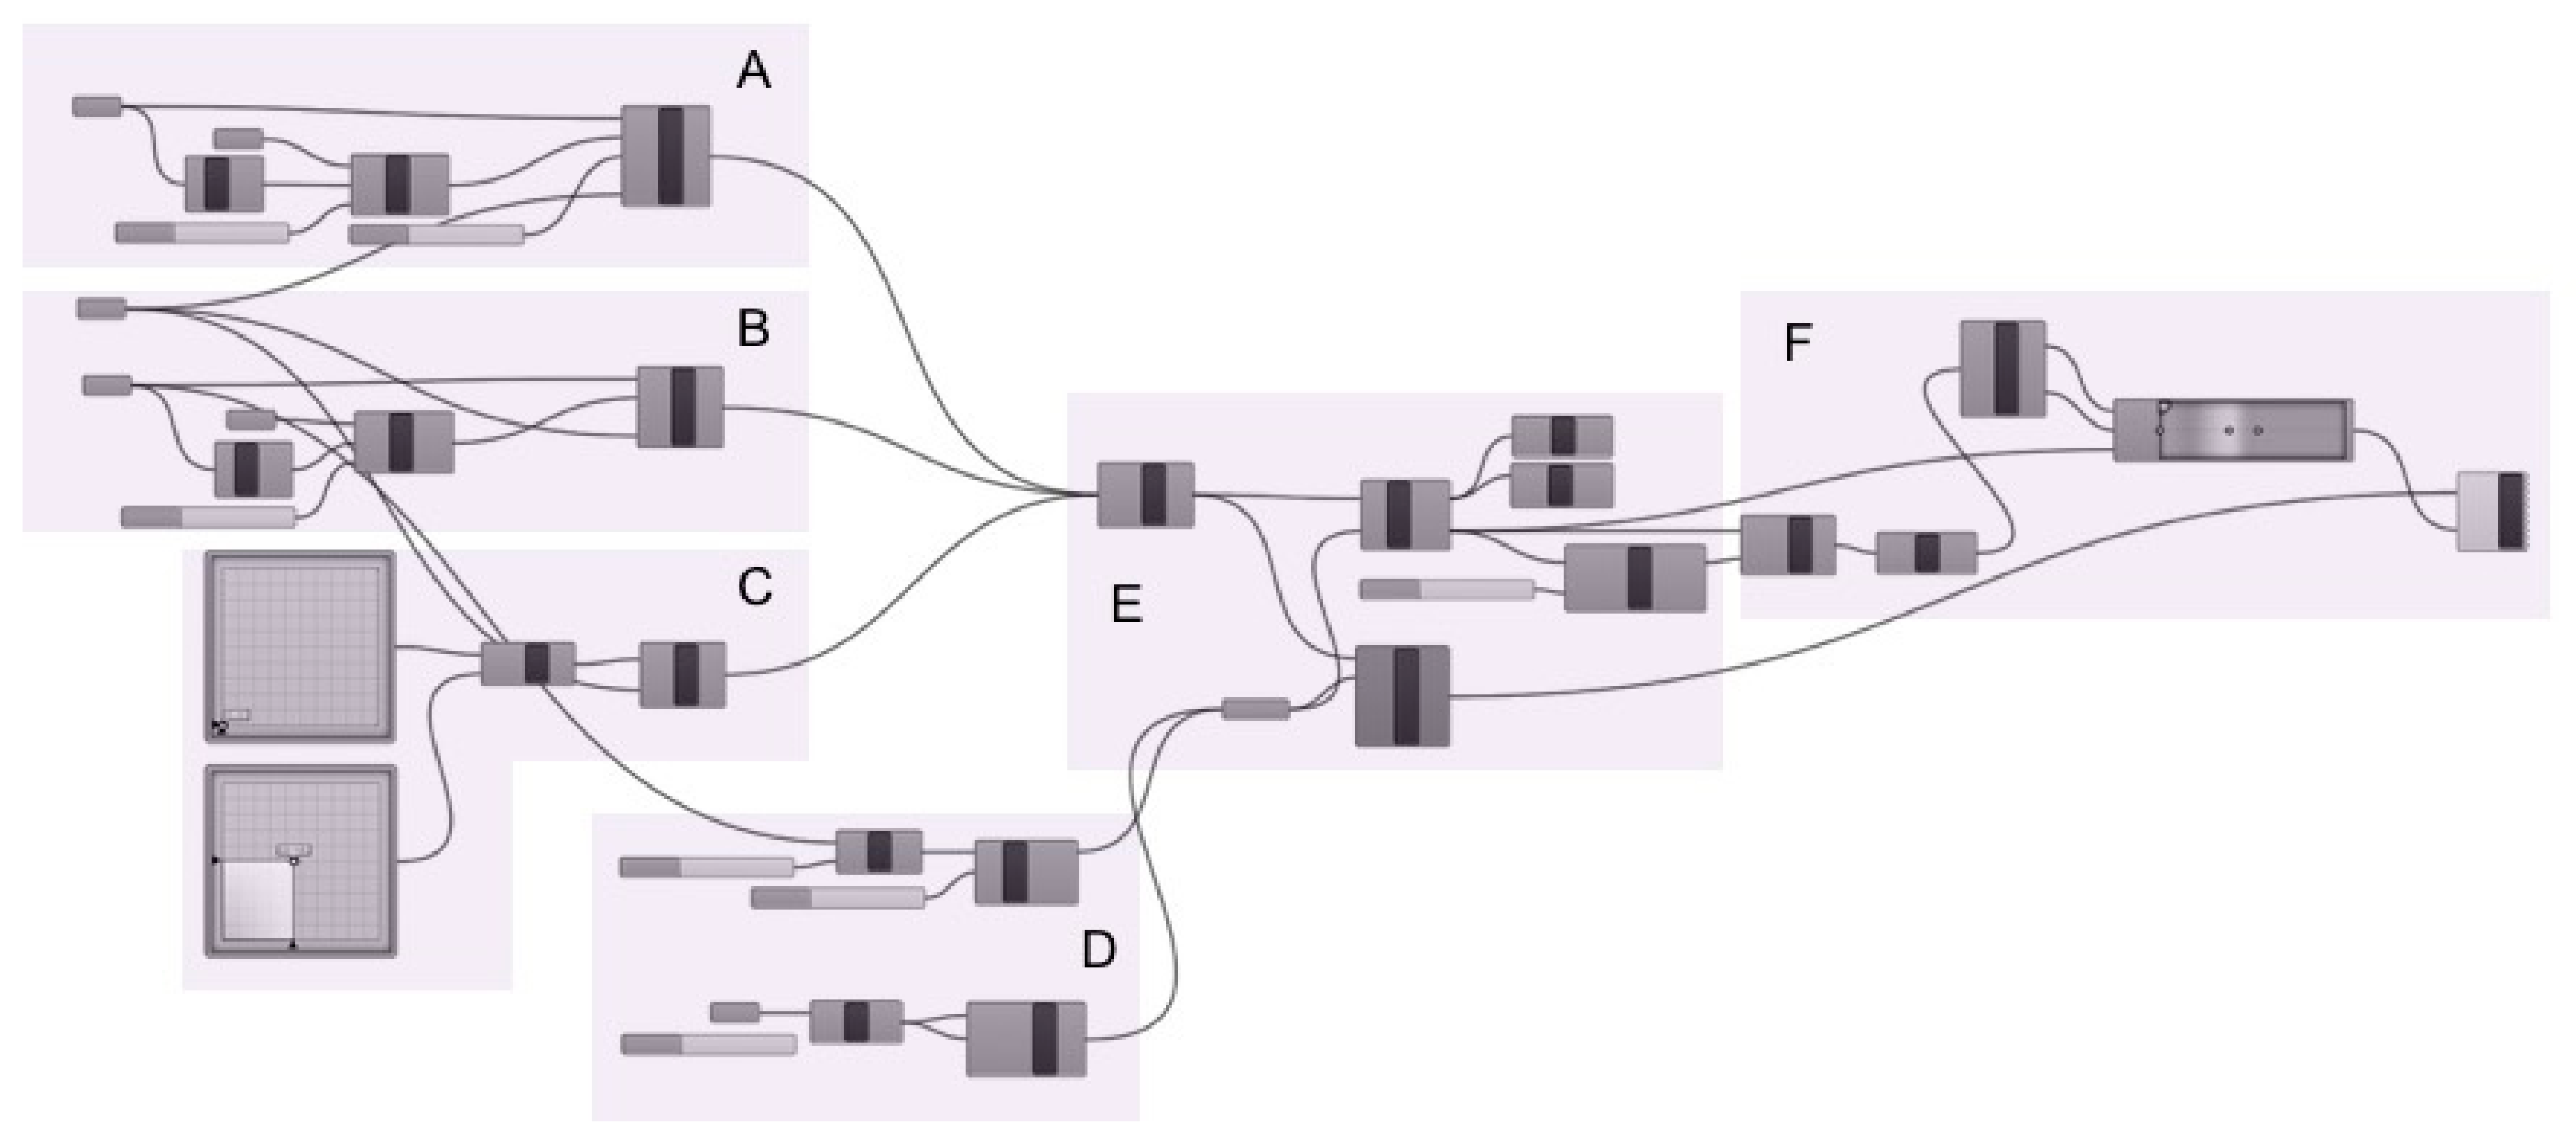
3.1. An Experimental Process of Parametric Form-Based Planning
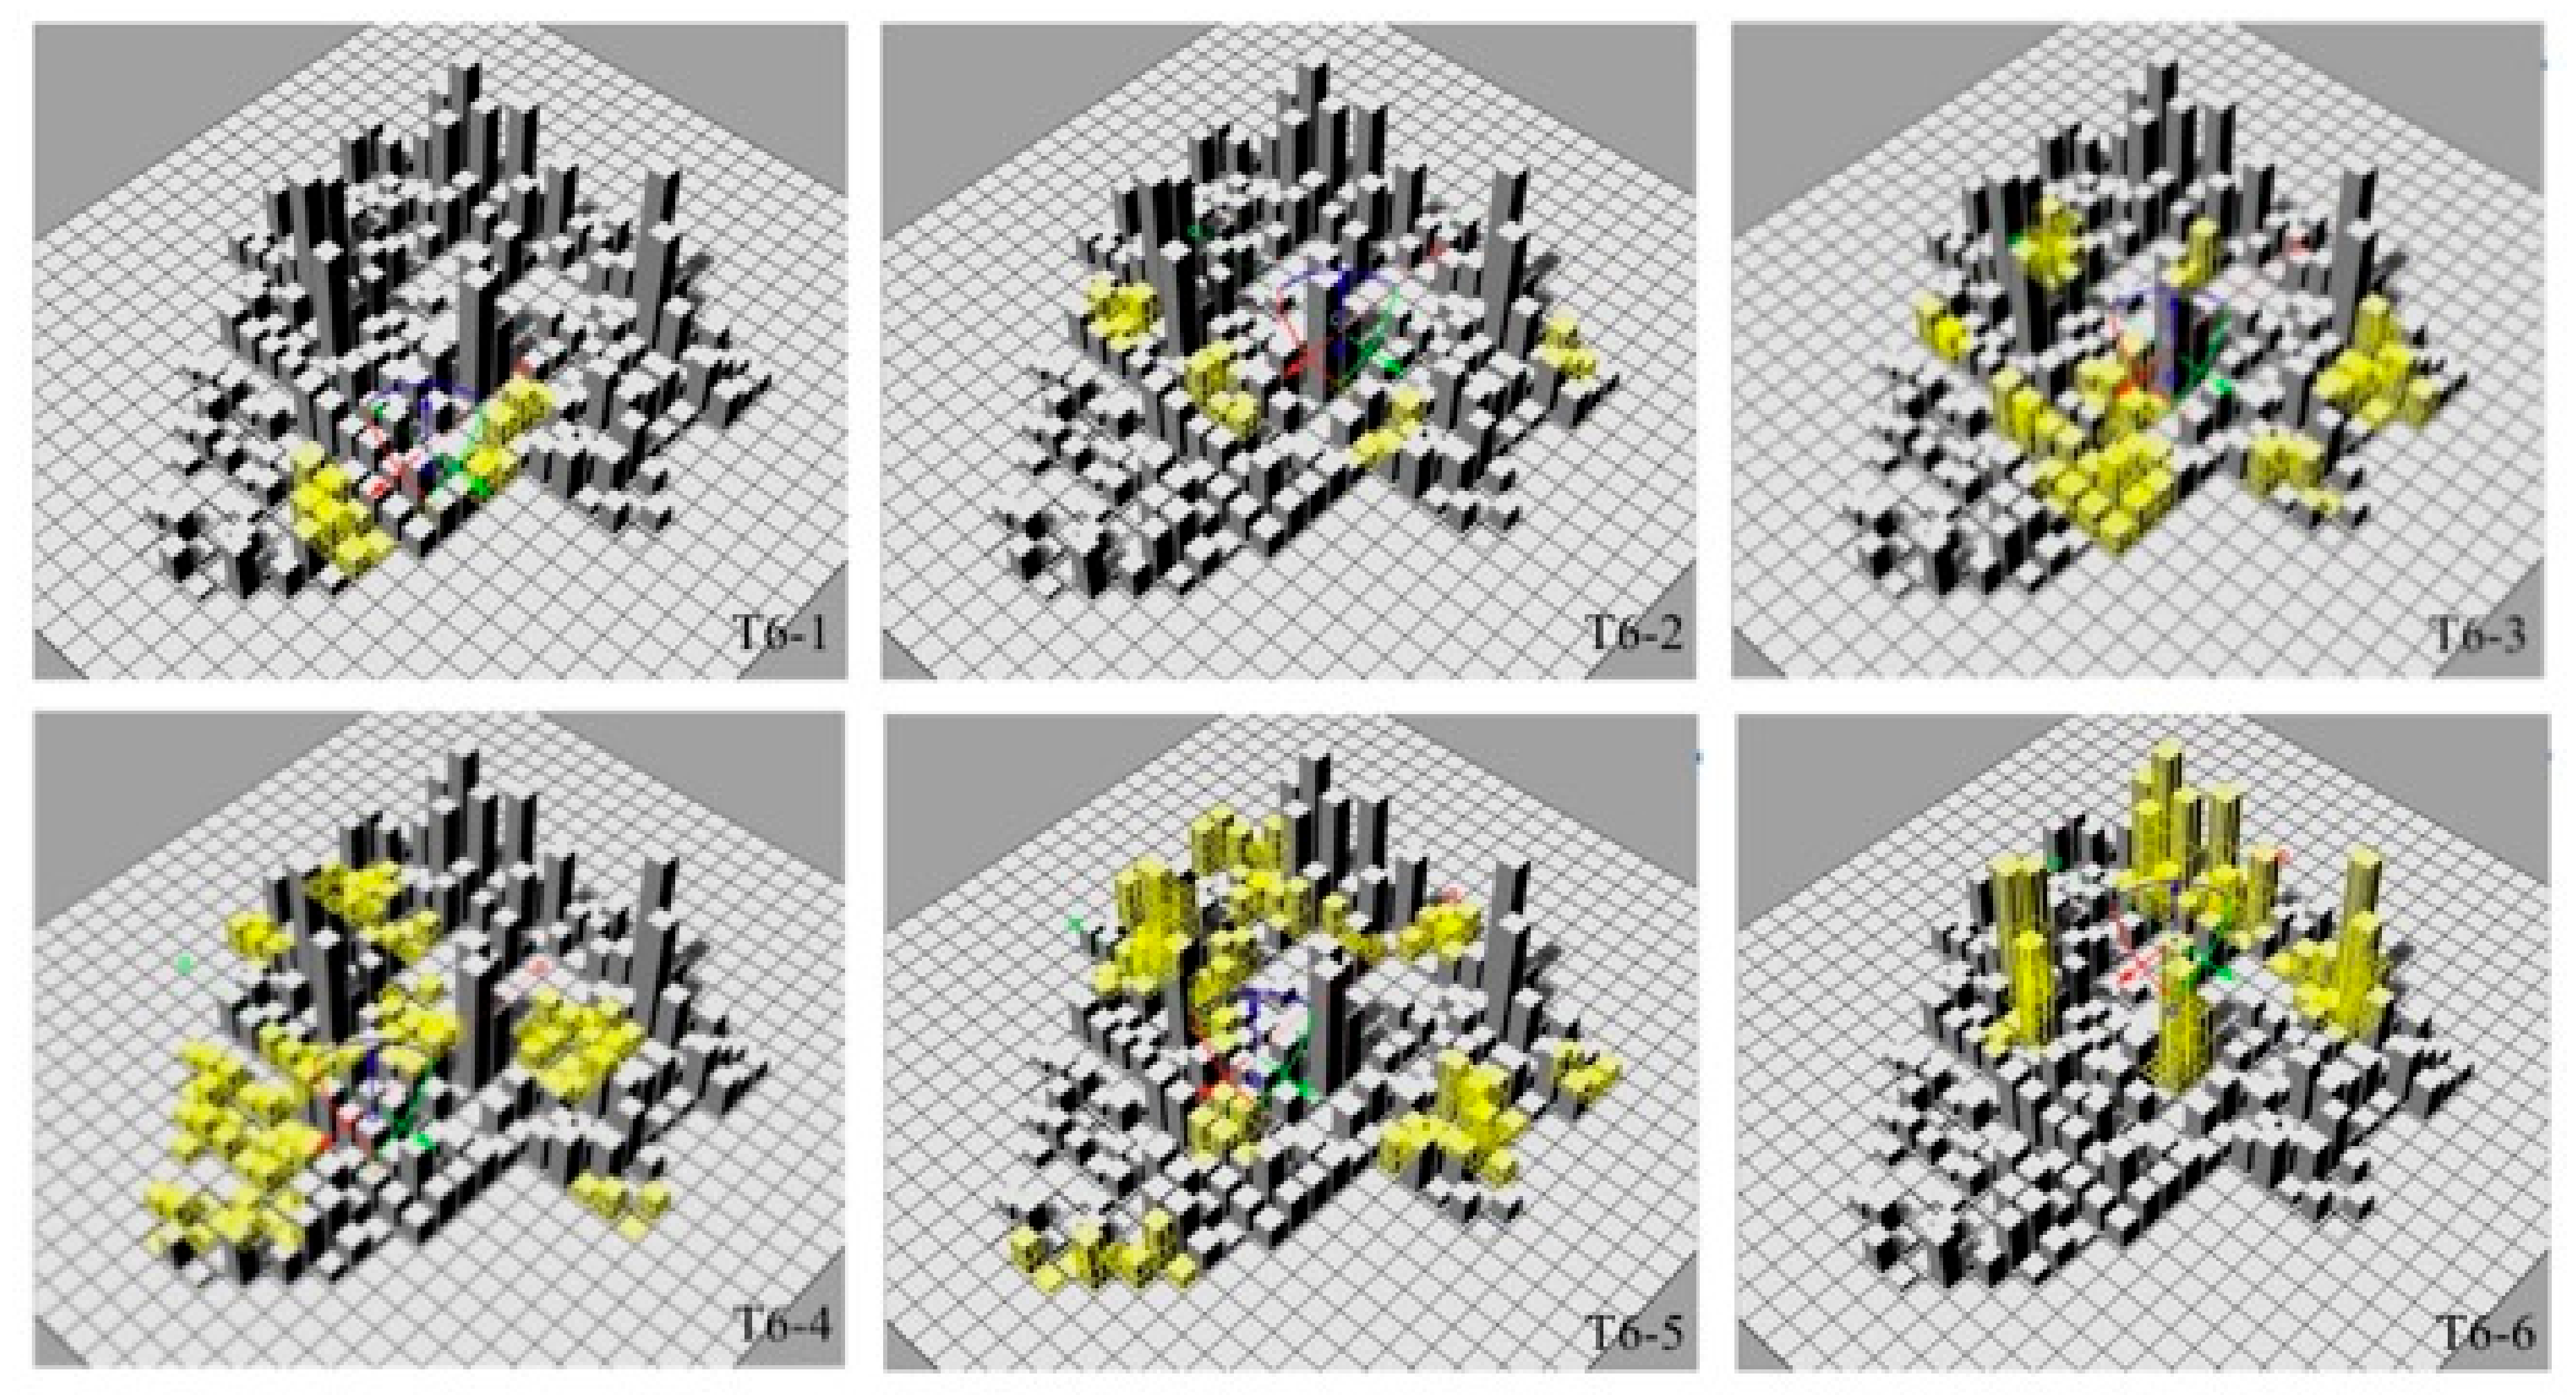
3.2. Parametric Layouts
4. Conclusions
Author Contributions
Funding
Conflicts of Interest
References
- Heidari, A.; Sahebzadeh, S.; Sadeghfar, M.; Taghvaei, B.E. Parametric architecture in its second phase of evolution. J. Build. Perform. 2018, 9, 13–20. [Google Scholar]
- Kan, C.H. Form-Based Urban Planning Code and Its Implications in Hong Kong. Master’s Thesis, The University of Hong Kong, Pokfulam, Hong Kong, 2012. [Google Scholar]
- Forsyth, A. Measuring density: Working definitions for residential density and building intensity. Des. Brief. 2003, 8, 2–8. [Google Scholar]
- Hascic, I. Essays on Land Use Regulation. Ph.D. Thesis, Oregon State University, Corvallis, OR, USA, 2006. [Google Scholar]
- Ligmann-Zielinska, A. Exploring Normative Scenarios of Land Use Development Decisions with an Agent-Based Simulation Laboratory. Ph.D. Thesis, University of California, Oakland, CA, USA, 2008. [Google Scholar]
- Stephenson, B. The roots of the New Urbanism: John Nolen’s garden city ethic. J. Plan. Hist. 2002, 1, 99–123. [Google Scholar] [CrossRef]
- Kim, J.B. Parametric Urban Regulation Models for Predicting Development Performances. Ph.D. Thesis, Texas A&M University, College Station, TX, USA, 2014. [Google Scholar]
- Duany, A.; Plater-Zyberk, E.; Speck, J. Suburban Nation: The Rise of Sprawl and the Decline of the American Dream; Farrar, Straus and Giroux: New York, NY, USA, 2010. [Google Scholar]
- Congress for the New Urbanism. Available online: https://www.cnu.org/publicsquare/transect (accessed on 15 December 2015).
- Von Thunen, J.H. The Isolated State; Pergamum: Oxford, UK, 1826. [Google Scholar]
- Clay, G. Crossing the American Grain with Vesalius, Geddes, and Jackson: The cross section as a learning tool. In Everyday America: Cultural Landscape Studies After J.B. Jackson; Groth, P., Wilson, C., Eds.; University of Chicago Press: Chicago, IL, USA, 1980. [Google Scholar]
- Center for Applied Transect Studies. Available online: https://transect.org/codes.html (accessed on 12 May 2015).
- Congress for the New Urbanism. Available online: https://www.cnu.org/resources/tools (accessed on 22 June 2019).
- Borys, H.; Talen, E.; Lambert, M. The code study. Available online: http://www.placemakers.com/how-we-teach/codes-study/ (accessed on 6 August 2019).
- Kim, J.B.; Clayton, M.; Yan, W. Parametric Form-Based Codes: Incorporation of land-use regulations and object-oriented parametric modeling of BIM. In Proceedings of the 31th Association for Computer Aided Design in Architecture (ACADIA) Conference; Taron, J.M., Ed.; The University of Calgary: Calgary/Banff, Canada, 2011; Available online: http://papers.cumincad.org/data/works/att/acadiaregional2011_025.content.pdf (accessed on 11 October 2019).
- Diwan, A. Investigate assignment: A study of urban rules. Unpublished master’s research. Chines University of Hong Kong, Hong Kong, China, 2013. [Google Scholar]
- Nagy, D. Computational design in Grasshopper. Available online: https://medium.com/generative-design/computational-design-in-grasshopper-1a0b62963690 (accessed on 11 October 2019).
- Zhang, Y. Enhancing Form-Based Code: A Parametric Approach to Urban Volumetric Morphology in High Density Cities. Ph.D. Thesis, Victoria University of Wellington, Wellington, New Zealand, 2019. [Google Scholar]
- Davis, D. A History of Parametric. Available online: http://www.danieldavis.com/a-history-of-parametric/ (accessed on 20 June 2017).
- OpenStreetMap. Available online: https://www.geofabrik.de/geofabrik/openstreetmap.html (accessed on 21 July 2019).
- Brown, B.B.; Werner, C.M.; Amburgey, J.; Szalay, C. Walkable route perceptions and physical features converging evidence for en route walking experiences. Environ. Behav. 2007, 39, 34–61. [Google Scholar] [CrossRef]
- Koffka, K. Principles of Gestalt Psychology; Routledge: New York, NY, USA, 1935. [Google Scholar]
- Hambleton, D. Field Line in Grasshopper 3D. Available online: https://www.grasshopper3d.com/forum/topics/vector-field-integration?xg_source=activity (accessed on 12 December 2018).
- Rogers, H. Theory of Recursive Functions and Effective Computability; The Massachusetts Institute of Technology press: Cambridge, MA, USA, 1987. [Google Scholar]
- Knuth, D. Semi-Numerical Algorithms: The Art of Computer Programming; Addison Wesley Press: Boston, MA, USA, 1969. [Google Scholar]
- Jabi, W.; Johnson, B.; Woodbury, R. Parametric Design for Architecture; Laurence King Publishing: London, UK, 2013. [Google Scholar]
- Woodbury, R. Elements of Parametric Design; Routledge: New York, NY, USA, 2010. [Google Scholar]
- Schumacher, P. Parametricism-A new global style for architecture and urban design. Archit. Des. 2009, 79, 14–23. [Google Scholar] [CrossRef]


© 2019 by the authors. Licensee MDPI, Basel, Switzerland. This article is an open access article distributed under the terms and conditions of the Creative Commons Attribution (CC BY) license (http://creativecommons.org/licenses/by/4.0/).
Share and Cite
Zhang, Y.; Liu, C. Parametric Modeling for Form-Based Planning in Dense Urban Environments. Sustainability 2019, 11, 5678. https://doi.org/10.3390/su11205678
Zhang Y, Liu C. Parametric Modeling for Form-Based Planning in Dense Urban Environments. Sustainability. 2019; 11(20):5678. https://doi.org/10.3390/su11205678
Chicago/Turabian StyleZhang, Yingyi, and Chang Liu. 2019. "Parametric Modeling for Form-Based Planning in Dense Urban Environments" Sustainability 11, no. 20: 5678. https://doi.org/10.3390/su11205678
APA StyleZhang, Y., & Liu, C. (2019). Parametric Modeling for Form-Based Planning in Dense Urban Environments. Sustainability, 11(20), 5678. https://doi.org/10.3390/su11205678