Article

Exploring Options for Improving Potato Productivity through Reducing Crop Yield Gap in Loess Plateau of China Based on Grey Correlation Analysis

Shaanxi Key Laboratory of Chinese Jujube, College of Life Sciences, Yan’an University, Yan’an 716000, China
*
Author to whom correspondence should be addressed.
These authors contributed equally to the work.
Sustainability 2019, 11(20), 5621; https://doi.org/10.3390/su11205621
Submission received: 22 September 2019 / Revised: 7 October 2019 / Accepted: 11 October 2019 / Published: 12 October 2019

Abstract

:
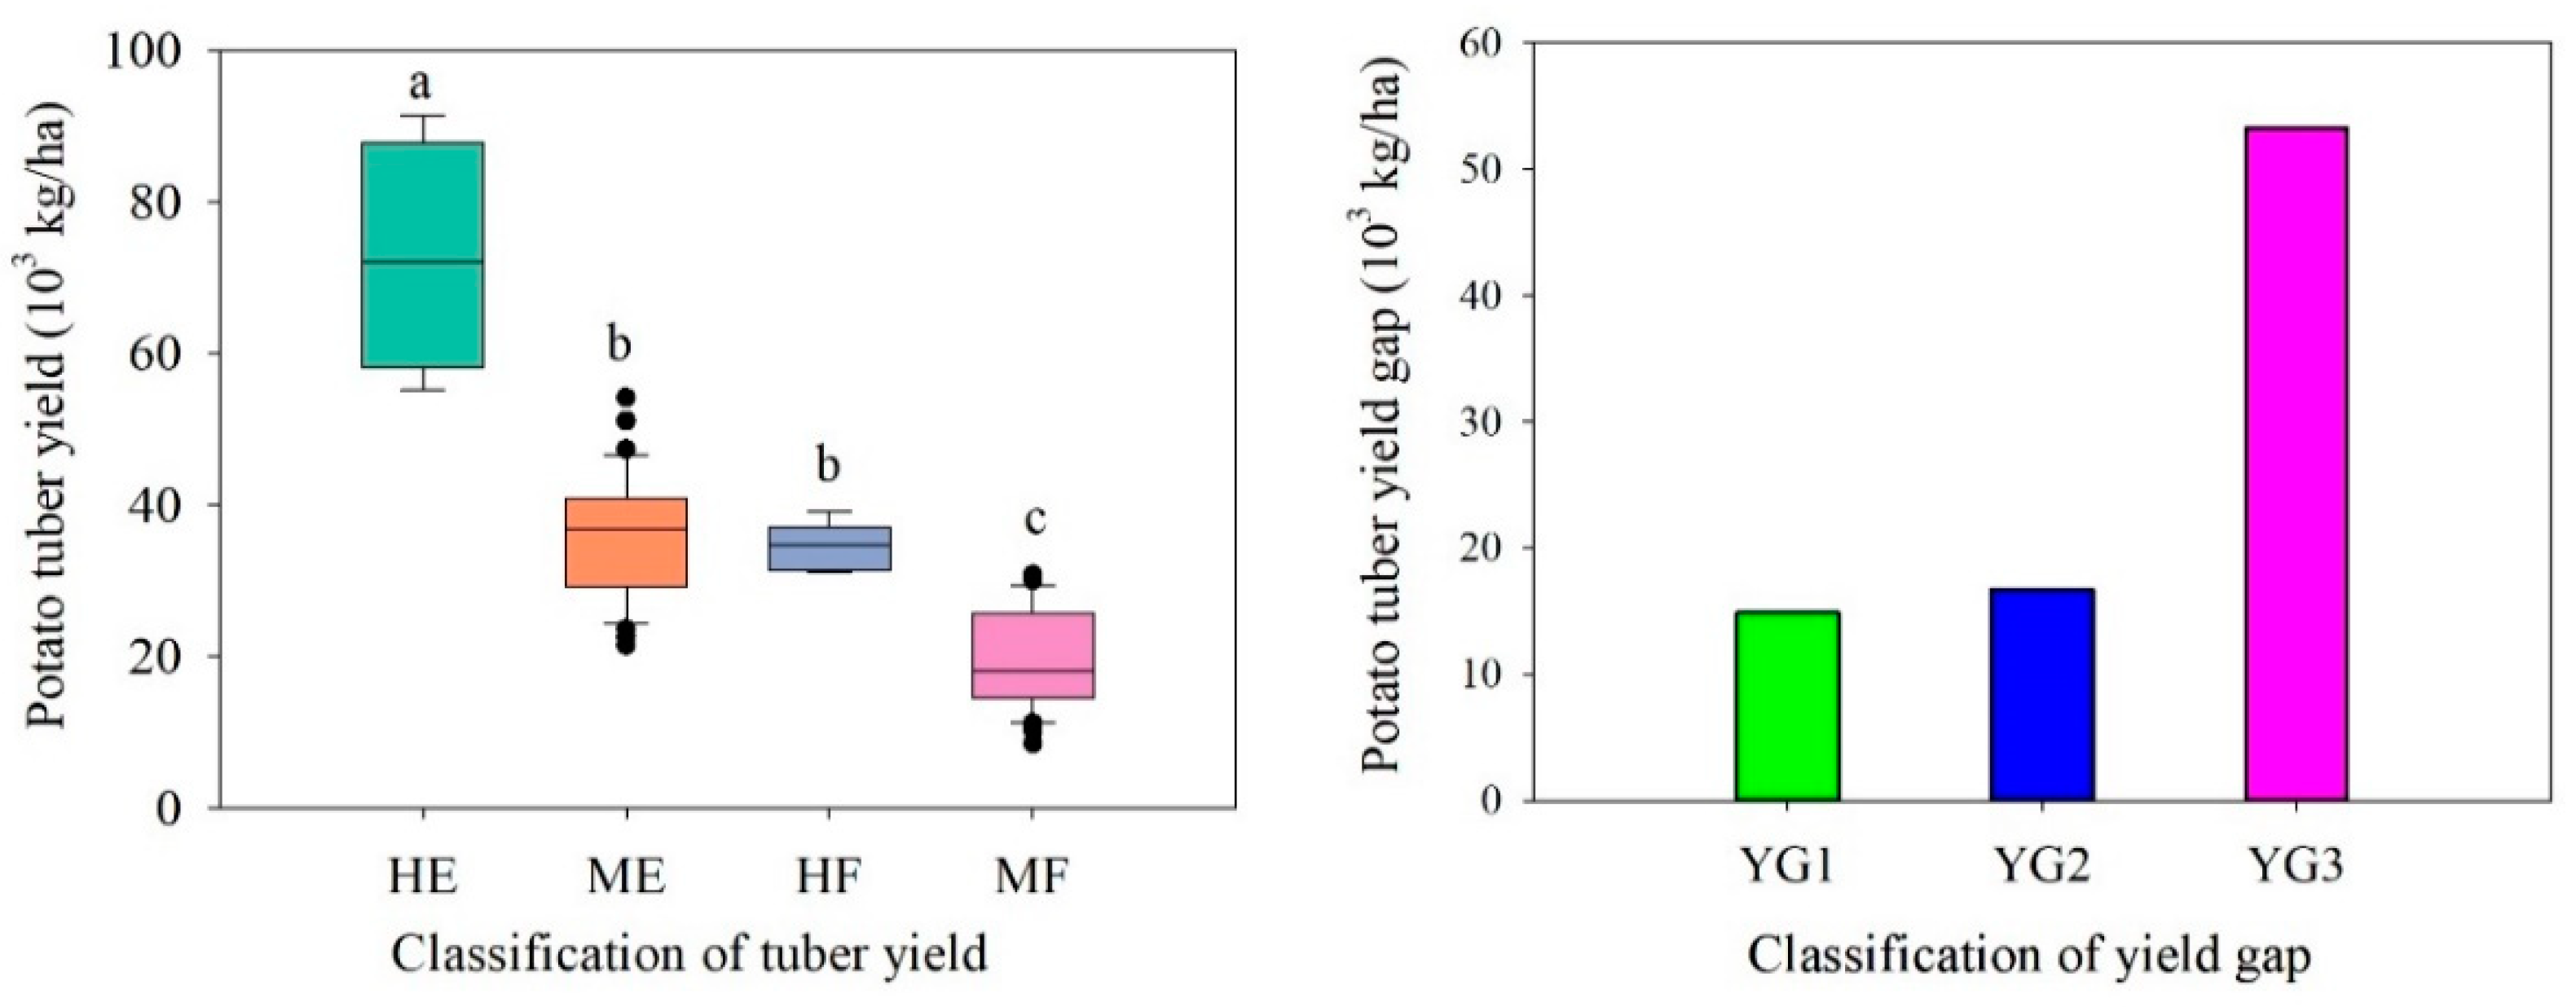
Differences in crop yield between different fields in the same region have existed for a long time. Methods for improving the productivity of low-yield fields are a hot topic in large-scale agriculture. This experiment was carried out in potato planting farmland and at a potato experimental station in the Loess Plateau in China to study the effects of soil moisture and soil nutrients on potato yield potential and yield gap. The relationships between potato yield and soil nutrient factors were analyzed using the grey correlation method. The grey correlation method is a new technique for performing prediction, relational analysis and decision-making in many areas. The results indicate that (1) the high-yield group at the potato experimental station (HE) was 72,678 kg/ha; the mean-yield group at the potato experimental station (ME) was 36,083 kg/ha; the high-yield group in the potato planting farmland (HF) was 34,259 kg/ha; and the mean-yield group in the potato planting farmland (MF) was 19,386 kg/ha. (2) The yield gap (YG1) between HF and MF was 14,873 kg/ha; the yield gap (YG2) between ME and the MF was 16,697 kg/ha; the yield gap (YG3) between HE and the MF was 53291 kg/ha. (3) The effects of soil moisture and nutrients on potato yield were ranked from large to small: soil available potassium content > soil nitrate nitrogen content > soil organic matter content > soil water content > soil available phosphorus content. The results of correlation analysis and grey correlation analysis showed that the available potassium had the strongest correlation with potato tuber yield. (4) The content of nitrate nitrogen was significantly correlated with the content of available potassium and available phosphorus, while the water content was significantly correlated with the content of organic matter. According to the influence of soil moisture and nutrients on the potato tuber yield, it is suggested that integrated water and fertilizer cultivation measures be implemented, and the input of potash fertilizer and nitrogen fertilizer be increased.

1. Introduction

Potato (Solanum tuberosum L.) is one of the major traditionally cultivated food crops in the Loess Plateau of China, accounting for 36% of China’s total potato cultivation area [1]. The annual planting area of potatoes in the Loess Plateau is about 15.3 × 10⁴ ha; second only to corn and small grains. The average yield per unit area of the three major grain crops used to be much higher than the world average level, and the planting area will continue a downward trend in the short term. In recent years, the yield per unit area has basically not increased. The improvement of potato yield per unit area and full production capacity is an important way of solving problems related to food security in China. In addition, the policy of reforestation in China over many years has led to a decrease in total cultivated area, so increasing potato yield per unit area is the main way of ensuring the stability of the grain yield [2,3].
DeDatta first put forward the concept of yield difference, which was mainly focused on rice [4]. Currently, the yield levels defined by researchers include simulated yield potential, experimental yield potential, high-yield farmer yield and average farmer yield [5,6,7]. Some of these grades may be substituted by different researchers for the particular situation they are studying. The research scales of crop yield gap are divided into global scale, regional scale and field scale [8]. Previous studies on potato yield potential and the factors affecting yield difference have mainly explored these issues with respect to supplying water and fertilizer and agricultural measures [9,10,11]. Zhang et al. conducted the coupling effect of water and fertilizer on potato plants in the Loess Plateau and obtained the average yield of 53,628 kg/ha [12].
Generally, large numbers of potatoes are cultivated by small farmers, with varying yield potential and tuber size in the Loess Plateau of China. There are three possible reasons for the large variation in yield in the same region. First, potatoes are sensitive to soil nutrients, and different fertilizer application may be the primary reason for this result [13]. Second, the difference of soil moisture supply between irrigated and rainfed fields is another important reason for the large variation in yield in the same region [6]. The storage capacity of soil moisture and nutrients is the third reason for the large difference in potato yield [14]. In addition, different potato varieties may be another potential reason for this result. The potato tuber yield increases with the increase in soil moisture content, modern potatoes were more sensitive to soil water and nitrogen than traditional potatoes [15]. Some researchers have analyzed the regression relationship between soil water storage in 0–100 cm cultivated layer and potato yield; the results showed that the correlation coefficient between soil water storage in 20–40 cm cultivated layer and potato yield was the highest [16,17,18]. Many previous studies have shown that potato yield and fertilizer application amount are significantly correlated, and reasonable fertilizer application can significantly improve potato starch content and yield [19,20,21]. The results showed that the effect of fertilizer on the increase of potato yield ranged from large to small: potassium fertilizer > nitrogen fertilizer > phosphate fertilizer [22]. The results showed that the effects of nitrogen, phosphorus and potassium fertilizer on potato yield were, in turn, decreasing [23]. Therefore, it is of great importance to explore the influence of basic soil fertility on potato yield in the main potato growing areas in the Loess Plateau to guide rational fertilization and field management in this region.
Previous studies have pointed out that there is a significant positive correlation between crop fertilization yield and basic soil fertility, and crop fertilization yield increases with the increase of basic soil fertility [24,25]. Fan et al. [26] used the contribution rate of soil fertility to evaluate the influence of basic soil fertility on fertilizer yield, and improving the basic soil fertility could increase crop yield. Under the condition of reasonable fertilization, the higher the soil base fertility, the better the stability and sustainability of crop yield [27]. However, there are no reports on the current situation of soil foundation fertility in the main potato producing areas in the loess plateau, and the effect of soil foundation fertility on potato yield in the main potato producing areas is still unclear. It is very important to explore the relationship between basic soil fertility and fertilization effect and potato yield to guide potato scientific fertilization under soil fertility in different ecological zones.
This study collected data from 294 test sites of the main potato planting farmland and potato experimental station of typical peasant households in the Loess Plateau from 2015 to 2018. The present study tries to (1) investigate the effects of soil moisture and nutrients on the yield and yield gap in the main potato growing areas in the Loess Plateau, and (2) explore the main limiting factors affecting the field potato yield in this area, so as to provide a certain basis for potato yield increase in the Loess Plateau. Answering these questions is important for selecting better field management techniques and providing better ideas to increase potato tuber yield in the Loess Plateau region.

2. Materials and Methods

2.1. Site Description

The main potato planting farmland and potato experimental station were located in the Loess Plateau of China (36°40′–39°21′N, 108°46′–109°44′E, altitude of 772–1320 m above sea level), which belongs to the typical hilly landscape of the Loess tableland area, with an arid and semi-arid continental monsoon climate (Figure 1). The average annual rainfall ranges from 300 to 700 mm. The total annual radiation ranges from 5016 to 5852 MJ/m2. The average annual temperature is 9 °C. The frost-free period ranges from 156 to 205 days. The soil type mainly comprises yellow spongy soils and wind sand. The average sand, silt and clay contents in the 0–80-cm soil profile were measured with a laser particle size analyzer (Dandong Haoyu Technology Co., Ltd.), and the values were 53.2%–81.1%, 11.32%–3.2% and 7.6%–21.4%, respectively. The organic matter content in the tested soil ranges from 2.16 to 20.2 g/kg. The nitrate nitrogen content ranges from 2.17 to 20.12 mg/kg. The available phosphorus content ranges from 1.49 to 33.78 mg/kg. The available potassium content ranges from 14 to 175.3 mg/kg. There are 168 sampling sites in the main potato plantation, and each sampling site has 5 replicates, for a total of 840 sampling sites. There are 126 sampling sites in the main potato planting farmland, and each sampling site has 5 replicates, for a total of 630 sampling sites.

2.2. Sample Collection and Analysis

The distance between the two sampling sites of the farmland was about 30 km, and potato fields with an area greater than 0.2 hm2 were randomly selected. The location software was used to record the name of the sample plot and its longitude and latitude, and to collect and record planting practices and fertilization of the sample plots at the same time. Plant spacing and row spacing of potatoes were measured with a tape. After the potato and soil samples had been collected, they were marked and sealed and taken back to the laboratory for analysis.
The potato experimental station sampling sites were selected according to the variety of potato, and the amount of fertilizer and irrigation throughout the whole growth period. Plant spacing and row spacing of potatoes were measured with a tape. After the potato and soil samples had been collected, they were marked and sealed and taken back to the laboratory for analysis.
Potato tuber samples were taken every year from September 1 to September 18. The fresh tuber weight per plant (g plant−1) was determined from the plants harvested (10 plants) from the central rows of the plots. Soil samples and potato tuber samples were collected simultaneously. The soil measurements were made in the horizontal direction at three observation sites: 10 cm from the plants, towards the furrow at 30 cm, and towards the ridge at 30 cm. Soil organic matter content was determined by potassium dichromate volumetric method (external heating method) with five replications and with a sampling depth interval of 20 cm to 100 cm [28]. A spectrophotometer (UV-VIS 8500, China) was used to determine the soil nitrate nitrogen content. First, 0.5 g of fresh soil was put into a 100 mL triangular bottle. In addition, 50 milliliters of 2 mol/L potassium chloride and the solution were added together. The solution was shaken for half an hour and reached uniformity. The solution was then filtered, and 5 mL was placed in a spectrophotometer at a wavelength of 210 nanometers. This methodology was carried out in accordance with Wang et al. [29]. Available phosphorus was determined by molybdenum antimony anti-spectrophotometry method with NaHCO3 extraction [30]. Available potassium was determined by flame photometry method with NH4OAc extraction [30].
According to the classification method of Lobell and Ortiz-Monasterio [31], the potato yield data sets collected were divided into four categories. The first type is denoted the high-yield test, and the top 5% of the high-yield potato data planted in the potato experimental station (HE) is extracted. The second category is recorded as the average yield in the test, and 80% of the mean-yield data of potatoes planted at the potato experimental station (ME) is extracted. The third category is classified as the high yield of farmers, and the top 10% of the yield data of potato planting farmland (HF) is extracted. The fourth category is denoted peasant household average, and the first 80% of the mean potato field yield data in the potato planting farmland (MF) is extracted.
Accordingly, with respect to the definition of the yield gaps among these four types—HE, ME, HF and MF—YG1 is the yield gap between HF and MF, YG2 is the yield gap between ME and MF, YG3 is the yield gap between HE and MF.

2.3. Grey Correlation Method

The grey correlation method put forward by Deng [32] provides a theoretical basis for the analysis, modeling, prediction and control of small samples and limited information systems [33]. In this study, the grey correlation method was used to explore the best combination of soil parameters in order to achieve the minimum resource input to obtain the required yield. The best parameter settings for one response can be detrimental to other responses. Therefore, multi-objective optimization is needed to obtain optimal parameter settings. In the grey correlation method, the experimental values of the measured quality characteristics are normalized within the range of 0–1. When the correlation coefficient is greater than 0.7, the independent variable is considered to be the influencing factor, and the important factor of correlation degree ranges from 0.5 to 0.7 [33]. This can be defined as “grey association generation”. The grey correlation coefficient is then calculated, which can be used to sort the evaluation objects and find out the primary and secondary factors from the complex system under investigation, so as to provide information for comprehensive decisions for the system, and to improve the comprehensive benefit. The overall soil parameters that affect yield depend on the calculation of grey relational grade. The multi-attribute process optimization problem is transformed into a single objective problem [34]. The highest grey relational grade will be regarded as the best combination of parameters. For “grey correlation generation”, the potato yield was obtained by the principle of “the higher the better”. The calculation process is as follows:
(1)
The reference sequence X0 and the comparison sequence Xi
Determine the reference sequence that reflects the behavior characteristics of the system and the comparative sequence that affects the behavior of the system. The data sequence reflecting the behavior characteristics of the system is called the reference sequence. The data sequence composed of factors that affect the behavior of the system is called the comparative sequence.
Let the reference sequence (also known as the parent sequence) be X0 = {X0(k) | k = 1, 2..., n}; meanwhile, let the comparison sequence (also known as subsequence) be Xi = {Xi(k) | k = 1,2..., n}, I = 1, 2..., m.
(2)
The transformation of the original data has to be dimensionless before correlation analysis to transform it into a comparable data sequence, because the units of each index are not consistent. In this study, the initial value transformation is selected for the original sequence.
(3)
Calculated correlation coefficient, ξ
ξ i ( k ) = min i min k | x 0 ( k ) x i ( k ) | + ρ max i max k | x 0 ( k ) x i ( k ) | | x 0 ( k ) x i ( k ) | + ρ max i max k | x 0 ( k ) x i ( k ) |
Type in the factor ξi(k): X0 and Xi at the k point correlation coefficient, ρ: discrimination coefficient, generally take 0.5, | x 0 ( k ) x i ( k ) | : X0 series and Xi series in k absolute difference, min i min k Δ i ( k ) | x 0 ( k ) x i ( k ) | : represents the second-order minimum absolute difference, max i max k | x 0 ( k ) x i ( k ) | : represents the second-order maximum absolute difference.
(4)
Seek the correlation: ri
r i = 1 n k = 1 n ξ i ( k )
Take the average value of the correlation coefficient of each index, namely, the correlation degree (r) of each index.
(5)
Arrange the association order and list the incidence matrix.
According to the size of correlation degree ri, rank the correlation order.

2.4. Statistical Analysis

The differences between all treatments were detected using Tukey’s multiple comparisons tests at the 0.05 significance level. Statistical analyses and data plotting were performed using SPSS Statistics Software 16.0 and Sigma Plot 14.0, respectively.

3. Results

3.1. Potato Yield Potential and Yield Gap

The classification of potato tuber yield and tuber yield gap in Loess Plateau is shown in Figure 2. The results showed that there was a significant difference between HE and ME, while there was no significant difference between ME and HF. The highest potato tuber yield was observed in HE, and was 101.4%, 112.1%, and 274.9% higher than those in ME, HF and ME, respectively. The potato tuber yield of ME was 5.3% higher than HF. The order of potato tuber yield gap from large to small was YG3 > YG2 > YG1. The highest potato tuber yield gap was observed in YG3, which was 69% and 72% higher than that in YG2 and YG1, respectively.

3.2. Effects of Different Yield Groups on Soil Water and Nutrient Content

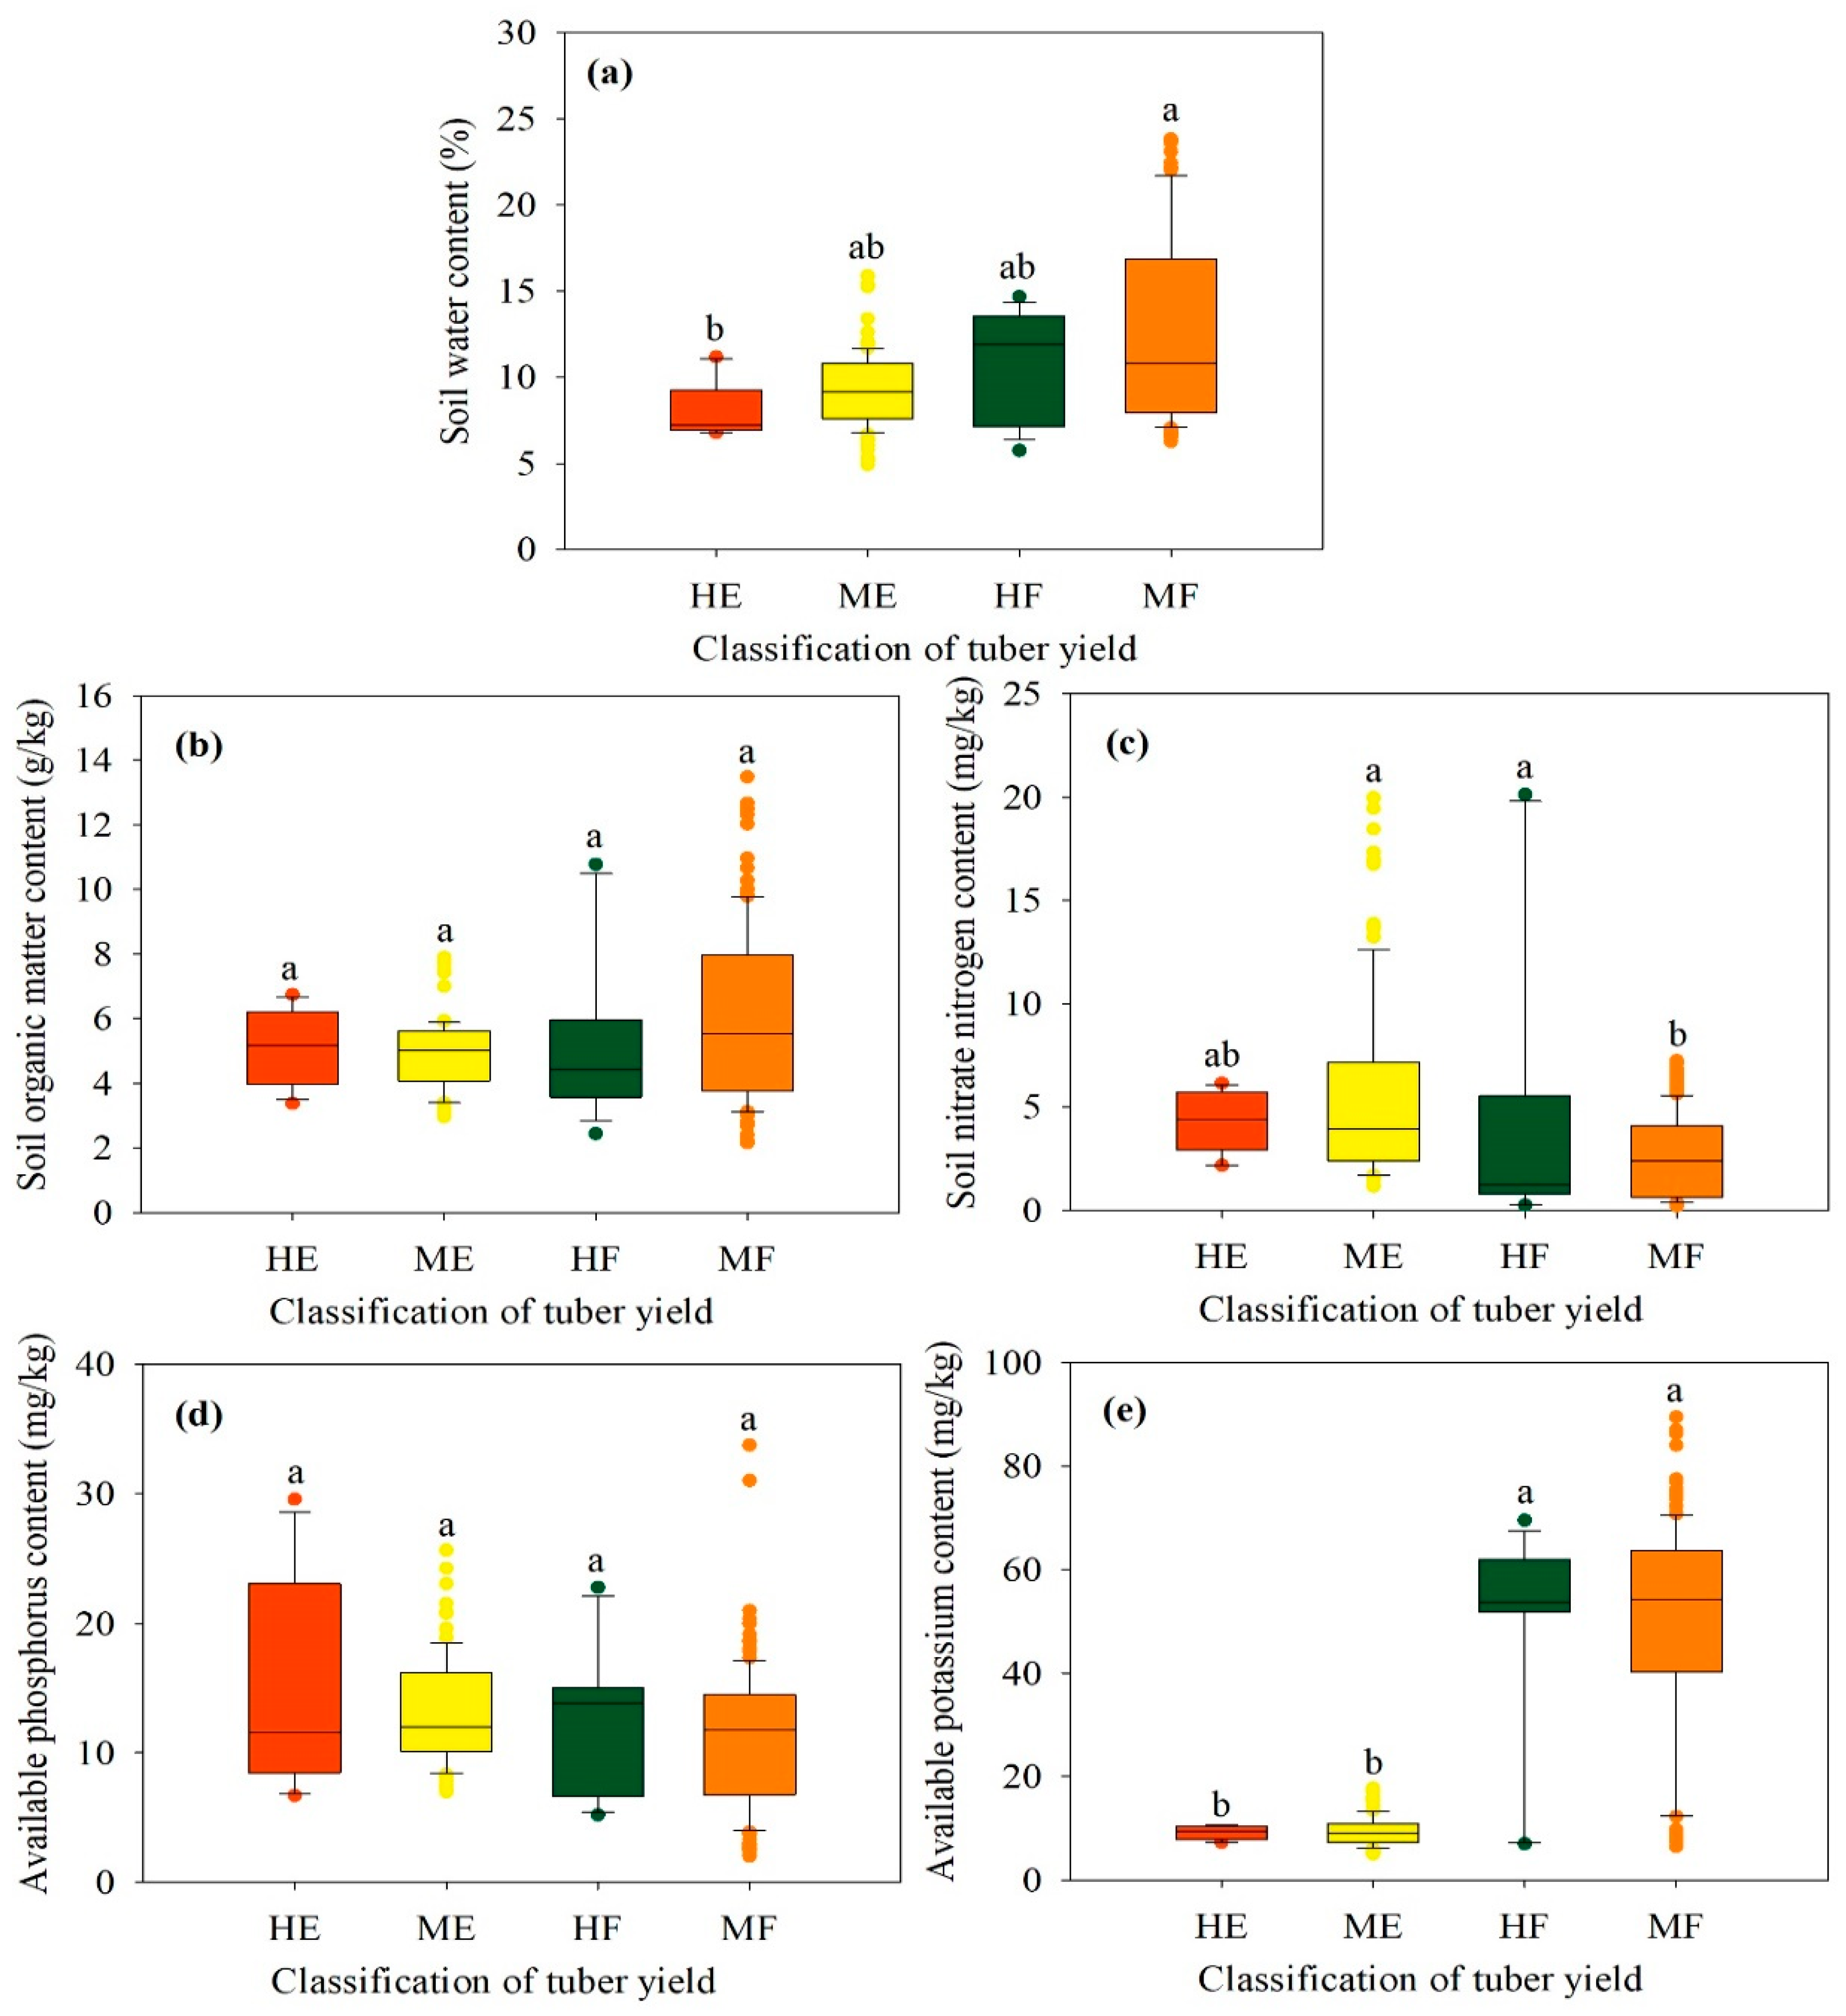
There was a significant difference in soil water content between HE and MF (Figure 3a). The soil water content decreased with the increase of potato tuber yield. The order of soil water content from large to small was MF > HF > ME > HE. The highest soil water content was observed in MF, and was 16.8%, 35.4% and 53.6% higher than those in HF, ME and HE, respectively. There was no significant difference in soil organic matter content between the different yield groups (Figure 3b). The highest soil organic matter content was observed in MF (6.1 g/kg), and was 15%, 23.8% and 19.3% higher than those in HF, ME and HE, respectively. At the potato experimental station, the soil organic matter content was higher in HE than that in ME, but the soil organic matter content was higher in MF than in HF in the potato planting farmland.
There was a significant difference in soil nitrate nitrogen content between ME, HF and MF (Figure 3c). The order of soil nitrate nitrogen content from large to small was ME > HF > HE > MF. The highest soil nitrate nitrogen content was observed in ME (5.6 mg/kg), and was 6.3%, 29.8% and 114.8% higher than those in HF, HE, and MF, respectively. There was no significant difference in soil available phosphorus content between different yield groups (Figure 3d). The soil available phosphorus content increased with the increase of potato tuber yield. The highest soil available phosphorus content was observed in HE (14.5 mg/kg), and was 9.9%, 14.1% and 29.7% higher than those in ME, HF, and MF, respectively. The soil available potassium content was significantly higher in potato planting farmland than in the potato experimental station (Figure 3e). The highest soil available potassium content was observed in MF (50.1 mg/kg), and was 3.5%, 430.5% and 444.6% higher than those in HF, ME and HE, respectively.

3.3. The Relationship between Potato Tuber Yield and Soil Water and Nutrient Content

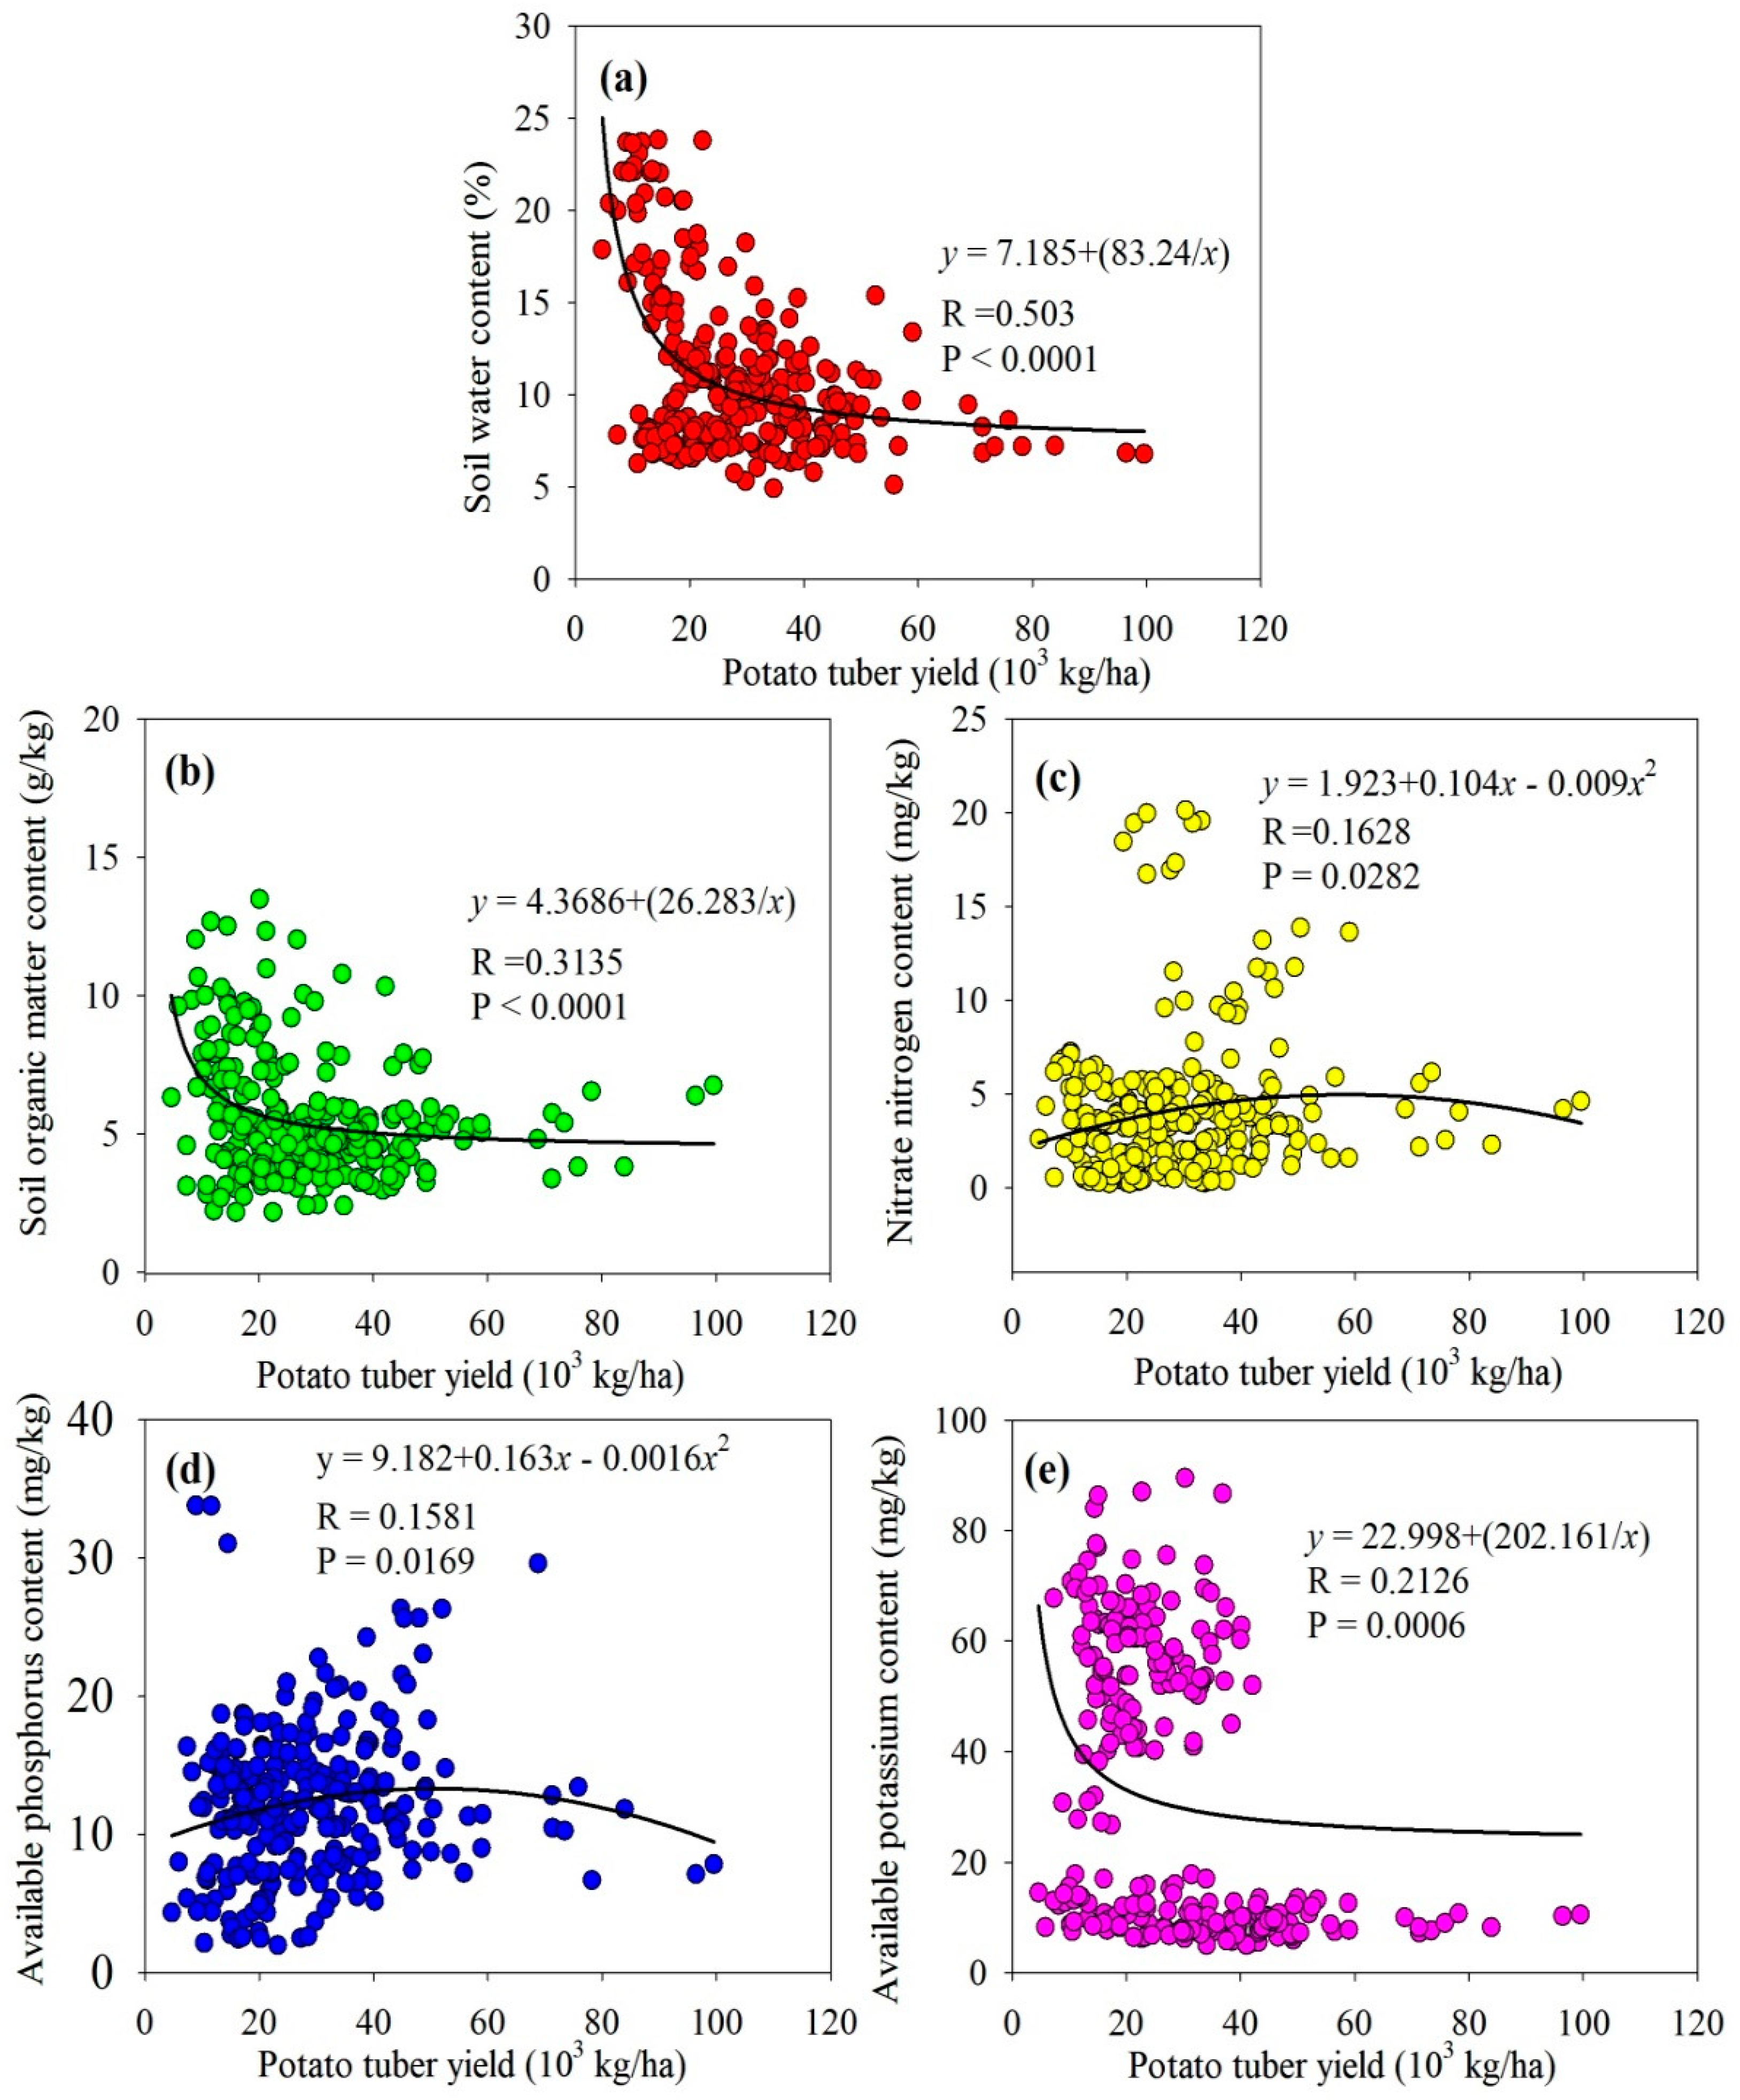
Potato tuber yield was significantly correlated with soil water content, soil organic matter content and soil available potassium content (P < 0.01) (Figure 4). The soil water content of farmland soil in the Loess Plateau ranged from 4.8% to 24%, and the data of 60% soil water content were distributed in the range of 6% to 12%. The water content in the areas with yield of less than 20,000 kg/ha was higher than that in areas with yield greater than 20,000 kg/ha. The coefficient of determination between potato tuber yield and soil water content was 0.155 (Figure 4a). The soil organic matter content ranged from 2.15–12.49 g/kg, among which 60% of organic matter data were distributed in the range of 4–6 g/kg (Figure 4b). Areas with potato tuber yields less than 20,000 kg/ha had a high content of organic matter and a large coefficient of variation. The soil organic matter content was stable when the yield was greater than 20,000 kg/ha (Figure 4b).
Soil nitrate content ranged from 0.21 to 20.12 mg/kg, and 89% of values for soil nitrate content were below 7 mg/kg (Figure 4c). Soil nitrate nitrogen content for potato tuber yields greater than 40,000 kg/ha was less than 5 mg/kg. The soil nitrate nitrogen content for yields less than 40,000 kg/ha varied significantly in this region (Figure 4c). The content of available phosphorus in the soil ranged from 1.98 to 33.78 mg/kg (Figure 4d). The soil available phosphorus content of potato tuber yields greater than 60,000 kg/ha was relatively low (Figure 4d). The content of available phosphorus in soil with yields less than 40,000 kg/ha was significantly different (Figure 4d). The available potassium content of soil in the Loess Plateau area ranges from 5 to 89.5 mg/kg (Figure 4e). There are two significant value ranges for the available potassium content: the first is that the available potassium content in 43.9% of the farmland soil is higher than 40 mg/kg, and the second is that the available potassium content in 52.9% of the experimental soil is lower than 20 mg/kg. The content of available phosphorus in soil with potato tuber yields greater than 40,000 kg/ha was lower than that of potato tuber yields less than 20,000 kg/ha (Figure 4e).

3.4. Correlation Analysis and Grey Correlation Analysis

The amount of fast-effect phosphorus is in a normal distribution, and the production, moisture content, organic matter, nitrate and the fast effect potassium are not in a normal distribution (Table 1).
There was an extremely significant negative correlation between yield and water content, organic matter and available potassium. These results indicated that the lower the content of soil water content, organic matter and available potassium, the more the potato absorbed during the growth process, and the higher the potato yield. The content of available potassium had the greatest influence on potato yield (−0.448) (Table 2). The yield was positively correlated with soil nitrate nitrogen. There was a significant positive correlation between water content and organic matter, indicating that the larger the water content was, the larger the organic matter content in the soil was, indicating that soil organic matter played a positive role in soil water retention. There was a significant positive correlation between nitrate nitrogen and available phosphorus, and a significant negative correlation between nitrate nitrogen and available potassium, indicating that nitrate nitrogen plays a very important role in the absorption of various nutrients by plants in soil.
Grey correlation analysis results show that the influence of potato tuber yield from large to small is soil available phosphorus > soil organic matter > soil nitrate nitrogen > soil available potassium (Table 3). Soil nutrient content was negatively correlated with potato absorption during potato harvest. Therefore, the order of effect of soil nutrients on potato tuber yield was soil available potassium > soil nitrate nitrogen > soil organic matter > soil water content > available phosphorus.

4. Discussion

Analysis of yield gap and yield potential is an important basis for improving crop production [35]. Under conditions in which there are excellent environmental factors, Haverkort and Struik [36] used the model to predict a maximum potato yield of 140,000 kg/ha. In this investigation, the yield of the high-yielding potato group in the Loess Plateau region reached up to 72,678 kg/ha, achieving 51.9% of the predicted high-yield of the model, indicating that the potato crops in this region had great potential for increased production. Therefore, the maximum yield of potato can be divided into two steps: the first step is to study the field management and nutrient management of the high yield potatoes through the experimental field, and the second step is to promote the high-yield technology of the experimental field to the farmland. The results of this study showed that the average yield of potatoes was 29,000 kg/ha, which was close to the yield data of this region collected by Xu et al. [37] for many years, indicating that the potato yield in this region had been relatively stable over the years, and the change of potato planting measures and planting area of farmers was relatively small. In addition, there was no significant difference between the yield data of the HF and the ME in this study, which indicated that the whole area had the basic ecological conditions to realize the yield of the average yield group of the experiment, and some farmers had mastered the technical requirements of potato high yield.
Yield gaps are calculated on the basis of three different levels of potentially limited water and nutrient yields for land-based cereals, taking into account weather, soil and crop characteristics. The fertility of the soil determines the level of grain production [38]. The results of this study indicated that the significant factors affecting potato tuber yield were soil water content, soil organic matter content, soil nitrate nitrogen content and soil available potassium content, among which the soil available potassium content in the soil had the greatest influence factor. Soil water storage is an important factor affecting potato yield [18]. The results of this study show that soil water content and yield have a significant negative correlation. There may be two reasons for this phenomenon. On the one hand, the potato needs more water throughout the whole growth stage [39], and areas with large potato yields before harvest have a good supply of soil water. On the other hand, part of the potato ground withers and soil moisture evapotranspiration increase after harvest, and the mature stage of potato is the peak period of soil evaporation, while the evaporation of other growth stages is relatively stable [40].
This study concluded that the average content of organic matter in this area was 5.56 g/kg, belonging to level 6 in the Second National Soil Census Nutrient Classification Standard [41]. The content of organic matter absorbed in potato during the growth period was about 19%, and only a small amount of organic matter accumulated in the subsoil [42]. The data of soil organic matter measured in this study indicated that the content of soil organic fertilizer in the whole Loess Plateau area was relatively low, which might be related to the low amount of application and large cumulative consumption. In this study, potato tuber yield was negatively correlated with organic matter content. There were no significant differences between different yield groups, which may be related to the large amount of organic fertilizer applied to the experimental field. The distribution of moisture and nitrate nitrogen in soil profile is significantly changed by planting crops, which is mainly related to the absorption and utilization of crops [43]. There was a significant positive correlation between soil nitrate nitrogen content and yield, and potato yield increased first and then decreased with the increase of nitrogen fertilizer application [44]. It is speculated that the higher the nitrogen content accumulated in the field soil, the higher the nitrogen fertilizer applied in the early stage. The possibility that the fertilizer loss rate was too high, and the potato yield was reduced due to factors such as precipitation was not excluded.
The results of correlation analysis and grey correlation analysis in this study showed that the content of available potassium in soil had a significant negative correlation with the yield, and the determination coefficient reached 0.1599. Potassium plays an important role in the transportation and accumulation of substances in potato plants [45]. Potato is an inefficient crop of potassium, and only when the amount of potash is greater than the amount needed for potato growth can the potato absorb enough potassium from the soil [46]. The potato tuber yield of the farmers group was low, while the content of available potassium in the soil was high in our study. Buresh et al. [47] proved that the content of available potassium in soil remained at a certain level even without the application of potassium fertilizer. However, from the perspective of maintaining the potassium supply capacity and sustainable utilization of soil, rational application of potassium fertilizer was still needed in agricultural production. Zelelew et al. [48] found that unreasonable application of potassium fertilizer would lead to a decline in the yield. However, the yield in the loess plateau area is still below its peak, which may be due to the under-utilization of available soil potassium in the surveyed farmland. There was a significant positive correlation between the content of available potassium in soil and potato yield [49]. Contrary to the results of this study, this may be related to the significant increase in the mineralization capacity of available potassium in soil by mulching. The fertilization ratio in this study area is not uniform, and the lack of other soil nutrients will have a negative effect on the growth and development of potatoes, indirectly affecting the absorption of soil available potassium. When the soil nutrient ratio is not reasonable, the efficiency of crops in absorbing certain nutrients will decrease. According to the above conclusions, it can be concluded that the content of available potassium in the fields of Loess Plateau area remains at a medium level, but the absorption and utilization efficiency of potato is relatively low, so promoting the use of available potassium for potato is one of the keys to increase production. In this experiment, the content of available potassium in the soil of the test group was relatively low, which may be due to the homogenization treatment of the plot before planting to reduce the influence of the original nutrients in the soil on the fertilization treatment. On the other hand, the utilization rate of potash in the test group was far higher than that of the farmer group.
In this study, it was concluded that soil nitrate nitrogen content was significantly correlated with soil available phosphorus content and soil available potassium content. In addition, soil nitrate nitrogen content was positively correlated with available phosphorus and negatively correlated with available potassium. The factors that affect the utilization efficiency of nitrogen fertilizer are nitrogen application amount, water supplement amount, distribution of water and fertilizer application period, application amount of organic fertilizer and application amount of potassium. Moderate irrigation and fertilizer application are the prerequisite for high yield and healthy soil. The single application of nitrogen is not conducive to the effective utilization of phosphate and potash [17]. Therefore, it is necessary to study the relationship between fertilizer ratio and fertilizer use efficiency to determine fertilizer ratio in the future. A moderate amount of nitrogen will promote crops on soil water and nitrogen utilization, increase the biomass and potato yield [50,51]. Therefore, improving nitrogen fertilizer application level is beneficial to the accumulation of phosphorus and potassium in soil and further promotes the absorption and utilization of soil water by potato.

5. Conclusions

There is a large gap between the potato experimental station and the farmers in the Loess Plateau, which means there is a huge potential for increased potato output in this region. An in-depth study of the factors influencing the yield in this region, the development of appropriate farming and fertilization measures, and the gradual elimination of yield differences at all levels will greatly increase the potato yield in this region.
In this study, the content of available potassium in the Loess Plateau soil had the greatest impact on potato yield. It is suggested that a way be found to activate the available potassium in the soil of this region to improve the utilization rate of potash in this region. Reasonable supply of soil potassium fertilizer is the key measure for ensuring the sustainable utilization of soil potassium. Soil water content is more important to the growth and development of potatoes, especially the rainfall conditions in this area. It is suggested that the water supply should be improved under conditions of less rainfall during the growth period of potatoes, so as to guarantee the basic conditions of potato growth and promote the increase of yield. The soil nitrate nitrogen content is significantly correlated with that of other elements, which indicates that the application of nitrogen fertilizer in combination with other fertilizers plays an important role in the yield. Soil water content is the key to achieving potato growth and development. Considering the low precipitation in this area, it is suggested that water-saving measures such as drip irrigation be adopted to maintain high water content to provide potato growth needs.

Author Contributions

N.W. and Y.X. wrote the paper, X.W. designed the study idea and applied the model to calculated, N.W. and Y.X. collected and arranged the all database, Y.X. and X.W. analyzed and discussed. N.W., Y.X. and X.W. revised the manuscript.

Funding

This research was funded the National Key Research and Development Program of China (grant no. 2017YFC0504704) and the National Natural Science Foundation (51809224), Shaanxi Innovation Talent Promotion Program - Young Science and Technology Star Project (2018KJXX-080) and Key Scientific Research Program of Education Department of Shaanxi Province (18JS117). The APC was funded by the National Natural Science Foundation (51669034).

Acknowledgments

We thank Jia Yun, Huihui Zhang, Wenting Jiang, Tao Guo and Tianmei Li for providing us with experimental field plots and helping us to collect the data.

Conflicts of Interest

The authors declare no conflict of interest.

References

  1. Chen, Y.; Chai, S.; Tian, H.; Chai, Y.; Li, Y.; Chang, L.; Cheng, H. Straw strips mulch on furrows improves water use efficiency and yield of potato in a rainfed semiarid area. Agric. Water Manag. 2019, 211, 142–151. [Google Scholar] [CrossRef]
  2. Wang, J.; Zhang, Z.; Liu, Y. Spatial shifts in grain production increases in China and implications for food security. Land Use Policy 2018, 74, 204–213. [Google Scholar] [CrossRef]
  3. Lei, Y.; Zhang, H.; Chen, F.; Zhang, L. How rural land use management facilitates drought risk adaptation in a changing climate—A case study in arid northern China. Sci. Total Environ. 2016, 550, 192–199. [Google Scholar] [CrossRef] [PubMed]
  4. Datta, D. Principles and Practices of Rice Production; International Rice Research Institute: Manila, Philippines, 1981. [Google Scholar]
  5. Cassman, K.G. Ecological intensification of cereal production systems: Yield potential, soil quality, and precision agriculture. Proc. Natl. Acad. Sci. USA 1999, 96, 5952–5959. [Google Scholar] [CrossRef] [PubMed] [Green Version]
  6. van Ittersum, M.K.; Cassman, K.G.; Grassini, P.; Wolf, J.; Tittonell, P.; Hochman, Z. Yield gap analysis with local to global relevance—A review. Field Crop. Res. 2013, 143, 4–17. [Google Scholar] [CrossRef]
  7. Rockström, J.; Falkenmark, M. Semiarid crop production from a hydrological perspective: Gap between potential and actual yields. Crit. Rev. Plant Sci. 2000, 19, 319–346. [Google Scholar] [CrossRef]
  8. van Wart, J.; Kersebaum, K.C.; Peng, S.; Milner, M.; Cassman, K.G. Estimating crop yield potential at regional to national scales. Field Crop. Res. 2013, 143, 34–43. [Google Scholar] [CrossRef] [Green Version]
  9. Deng, X.; Shan, L.; Zhang, H.; Turner, N.C. Improving agricultural water use efficiency in arid and semiarid areas of China. Agric. Water Manag. 2006, 80, 23–40. [Google Scholar] [CrossRef]
  10. Finger, R.; Swinton, S.M.; Benni, N.E.; Walter, A. Precision farming at the nexus of agricultural production and the environment. Annu. Rev. Resour. Econ. 2019, 11, 313–335. [Google Scholar] [CrossRef]
  11. D’Anna, F.; Sabatino, L. Morphological and agronomical characterization of eggplant genetic resources from the Sicily area. J. Foodagriculture Environ. 2013, 11, 401–404. [Google Scholar]
  12. Fucang, Z.; Yue, G.; Wanru, J.; Wenhui, H. Effects of water and fertilizer supply on growth, water and nutrient use efficiencies of potato in sandy soil of Yulin area. Trans. Chin. Soc. Agric. Mach. 2017, 48, 270–278. [Google Scholar]
  13. Qin, S.; Zhang, J.; Dai, H.; Wang, D.; Li, D. Effect of ridge-furrow and plastic-mulching planting patterns on yield formation and water movement of potato in a semi-arid area. Agric. Water Manag. 2014, 131, 87–94. [Google Scholar] [CrossRef]
  14. Daryanto, S.; Wang, L.; Jacinthe, P.-A. Drought effects on root and tuber production: A meta-analysis. Agric. Water Manag. 2016, 176, 122–131. [Google Scholar] [CrossRef] [Green Version]
  15. Fandika, I.R.; Kemp, P.D.; Millner, J.P.; Horne, D.; Roskruge, N. Irrigation and nitrogen effects on tuber yield and water use efficiency of heritage and modern potato cultivars. Agric. Water Manag. 2016, 170, 148–157. [Google Scholar] [CrossRef]
  16. Liu, C.-A.; Li, F.-R.; Zhou, L.-M.; Zhang, R.-H.; Yu, J.; Lin, S.-L.; Wang, L.-J.; Siddique, K.H.M.; Li, F.-M. Effect of organic manure and fertilizer on soil water and crop yields in newly-built terraces with loess soils in a semi-arid environment. Agric. Water Manag. 2013, 117, 123–132. [Google Scholar] [CrossRef]
  17. Wang, X.; Fan, J.; Xing, Y.; Xu, G.; Wang, H.; Deng, J.; Wang, Y.; Zhang, F.; Li, P.; Li, Z. The effects of mulch and nitrogen fertilizer on the soil environment of crop plants. In Advances in Agronomy; Sparks, D.L., Ed.; Academic Press: Cambridge, MA, USA, 2019; Volume 153, pp. 121–173. [Google Scholar]
  18. Xu, S.; Zhang, L.; McLaughlin, N.B.; Mi, J.; Chen, Q.; Liu, J. Effect of synthetic and natural water absorbing soil amendment soil physical properties under potato production in a semi-arid region. Soil Tillage Res. 2015, 148, 31–39. [Google Scholar] [CrossRef]
  19. Šrek, P.; Hejcman, M.; Kunzová, E. Multivariate analysis of relationship between potato (Solanum tuberosum L.) yield, amount of applied elements, their concentrations in tubers and uptake in a long-term fertilizer experiment. Field Crop. Res. 2010, 118, 183–193. [Google Scholar] [CrossRef]
  20. Abuarab, M.E.; El-Mogy, M.M.; Hassan, A.M.; Abdeldaym, E.A.; Abdelkader, N.H.; B. I. El-Sawy, M. The effects of root aeration and different soil conditioners on the nutritional values, yield, and water productivity of potato in clay loam soil. Agronomy 2019, 9, 418. [Google Scholar] [CrossRef]
  21. Ghazouani, H.; Rallo, G.; Mguidiche, A.; Latrech, B.; Douh, B.; Boujelben, A.; Provenzano, G. Effects of saline and deficit irrigation on soil-plant water status and potato crop yield under the semiarid climate of Tunisia. Sustainability 2019, 11, 2706. [Google Scholar] [CrossRef]
  22. Rosen, C.J.; Kelling, K.A.; Stark, J.C.; Porter, G.A. Optimizing phosphorus fertilizer management in potato production. Am. J. Potato Res. 2014, 91, 145–160. [Google Scholar] [CrossRef]
  23. Khan, M.Z.; Akhtar, M.E.; Safdar, M.N.; Mahmood, M.M.; Ahmad, S.; Ahmed, N. Effect of source and level of potash on yield and quality of potato tubers. Pak. J. Bot. 2010, 42, 3137–3145. [Google Scholar]
  24. de Ponti, T.; Rijk, B.; van Ittersum, M.K. The crop yield gap between organic and conventional agriculture. Agric. Syst. 2012, 108, 1–9. [Google Scholar] [CrossRef]
  25. Dong, W.; Zhang, X.; Wang, H.; Dai, X.; Sun, X.; Qiu, W.; Yang, F. Effect of different fertilizer application on the soil fertility of paddy soils in red soil region of Southern China. PLoS ONE 2012, 7, e4450. [Google Scholar] [CrossRef] [PubMed]
  26. Fan, M.; Lal, R.; Cao, J.; Qiao, L.; Su, Y.; Jiang, R.; Zhang, F. Plant-based assessment of inherent soil productivity and contributions to China’s cereal crop yield increase since 1980. PLoS ONE 2013, 8, e74617. [Google Scholar] [CrossRef] [PubMed]
  27. Kraaijvanger, R.; Veldkamp, T. Grain productivity, fertilizer response and nutrient balance of farming systems in Tigray, Ethiopia: A Multi-perspective view in relation to soil fertility degradation. Land Degrad. Dev. 2015, 26, 701–710. [Google Scholar] [CrossRef]
  28. Wang, Q.; Wang, W.; He, X.; Zhang, W.; Song, K.; Han, S. Role and variation of the amount and composition of glomalin in soil properties in farmland and adjacent plantations with reference to a primary forest in North-Eastern China. PLoS ONE 2015, 10, e0139623. [Google Scholar] [CrossRef] [PubMed]
  29. Wang, X.; Wang, N.; Xing, Y.; Yun, J.; Zhang, H. Effects of plastic mulching and basal nitrogen application depth on nitrogen use efficiency and yield in maize. Front. Plant Sci. 2018, 9, 1446. [Google Scholar] [CrossRef] [PubMed]
  30. Wu, Y.; Li, Y.; Zhang, Y.; Bi, Y.; Sun, Z. Responses of saline soil properties and cotton growth to different organic amendments. Pedosphere 2018, 28, 521–529. [Google Scholar] [CrossRef]
  31. Lobell, D.B.; Ortiz-Monasterio, J.I. Regional importance of crop yield constraints: Linking simulation models and geostatistics to interpret spatial patterns. Ecol. Model. 2006, 196, 173–182. [Google Scholar] [CrossRef]
  32. Deng, J.-L. Control problems of grey systems. Syst. Contr. Lett. 1982, 1, 288–294. [Google Scholar]
  33. Wang, Y.; Liu, X.; Ren, G.; Yang, G.; Feng, Y. Analysis of the spatiotemporal variability of droughts and the effects of drought on potato production in northern China. Agric. For. Meteorol. 2019, 264, 334–342. [Google Scholar] [CrossRef]
  34. Zhou, L.; Mu, T.-H.; Ma, M.-M.; Zhang, R.-F.; Sun, Q.-H.; Xu, Y.-W. Nutritional evaluation of different cultivars of potatoes (Solanum tuberosum L.) from China by grey relational analysis (GRA) and its application in potato steamed bread making. J. Integr. Agric. 2019, 18, 231–245. [Google Scholar] [CrossRef]
  35. Neumann, K.; Verburg, P.H.; Stehfest, E.; Müller, C. The yield gap of global grain production: A spatial analysis. Agric. Syst. 2010, 103, 316–326. [Google Scholar] [CrossRef]
  36. Haverkort, A.J.; Struik, P.C. Yield levels of potato crops: Recent achievements and future prospects. Field Crop. Res. 2015, 182, 76–85. [Google Scholar] [CrossRef]
  37. Xu, Y.; He, P.; Qiu, S.; Xu, X.; Ma, J.; Ding, W.; Zhao, S.; Gao, Q.; Zhou, W. Regional variation of yield and fertilizer use efficiency of potato in China. J. Plant Nutr. Fertil. 2019, 25, 22–35. [Google Scholar]
  38. Bindraban, P.S.; Stoorvogel, J.J.; Jansen, D.M.; Vlaming, J.; Groot, J.J.R. Land quality indicators for sustainable land management: Proposed method for yield gap and soil nutrient balance. Agric. Ecosyst. Environ. 2000, 81, 103–112. [Google Scholar] [CrossRef]
  39. Pourazari, F.; Andersson, M.; Weih, M. Altered tuber yield in genetically modified high-amylose and oil potato lines is associated with changed whole-plant nitrogen economy. Front. Plant Sci. 2018, 9, 342. [Google Scholar] [CrossRef]
  40. Hu, Q.; Yang, N.; Pan, F.; Pan, X.; Wang, X.; Yang, P. Adjusting sowing dates improved potato adaptation to climate change in semiarid region, China. Sustainability 2017, 9, 615. [Google Scholar] [CrossRef]
  41. Wang, D.; Bai, J.; Wang, W.; Zhang, G.; Cui, B.; Liu, X.; Li, X. Comprehensive assessment of soil quality for different wetlands in a Chinese delta. Land Degrad. Dev. 2018, 29, 3783–3794. [Google Scholar] [CrossRef]
  42. Johnston, A.E.; Poulton, P.R.; Coleman, K. Chapter 1 Soil organic matter: Its importance in sustainable agriculture and carbon dioxide fluxes. In Advances in Agronomy; Sparks, D.L., Ed.; Academic Press: Cambridge, MA, USA, 2009; Volume 101, pp. 1–57. [Google Scholar]
  43. Zebarth, B.J.; Drury, C.F.; Tremblay, N.; Cambouris, A.N. Opportunities for improved fertilizer nitrogen management in production of arable crops in eastern Canada: A review. Can. J. Soil Sci. 2009, 89, 113–132. [Google Scholar] [CrossRef]
  44. Badr, M.A.; El-Tohamy, W.A.; Zaghloul, A.M. Yield and water use efficiency of potato grown under different irrigation and nitrogen levels in an arid region. Agric. Water Manag. 2012, 110, 9–15. [Google Scholar] [CrossRef]
  45. Wang, H.; Wang, X.; Bi, L.; Wang, Y.; Fan, J.; Zhang, F.; Hou, X.; Cheng, M.; Hu, W.; Wu, L.; et al. Multi-objective optimization of water and fertilizer management for potato production in sandy areas of northern China based on TOPSIS. Field Crop. Res. 2019, 240, 55–68. [Google Scholar] [CrossRef]
  46. Römheld, V.; Kirkby, E.A. Research on potassium in agriculture: Needs and prospects. Plant Soil 2010, 335, 155–180. [Google Scholar] [CrossRef]
  47. Buresh, R.J.; Pampolino, M.F.; Witt, C. Field-specific potassium and phosphorus balances and fertilizer requirements for irrigated rice-based cropping systems. Plant Soil 2010, 335, 35–64. [Google Scholar] [CrossRef]
  48. Zelelew, D.Z.; Lal, S.; Kidane, T.T.; Ghebreslassie, B.M. Effect of potassium levels on growth and productivity of potato varieties. Am. J. Plant Sci. 2016, 7, 1629. [Google Scholar] [CrossRef]
  49. Kavvadias, V.; Paschalidis, C.; Akrivos, G.; Petropoulos, D. Nitrogen and Potassium Fertilization Responses of Potato (Solanum tuberosum) cv. Spunta. Commun. Soil Sci. Plant Anal. 2012, 43, 176–189. [Google Scholar] [CrossRef]
  50. Saravia, D.; Farfán-Vignolo, E.R.; Gutiérrez, R.; De Mendiburu, F.; Schafleitner, R.; Bonierbale, M.; Khan, M.A. Yield and physiological response of potatoes indicate different strategies to cope with drought stress and nitrogen fertilization. Am. J. Potato Res. 2016, 93, 288–295. [Google Scholar] [CrossRef]
  51. Wang, X.K.; Li, Z.B.; Xing, Y.Y. Effects of mulching and nitrogen on soil temperature, water content, nitrate-N content and maize yield in the Loess Plateau of China. Agric. Water Manag. 2015, 161, 53–64. [Google Scholar] [CrossRef]
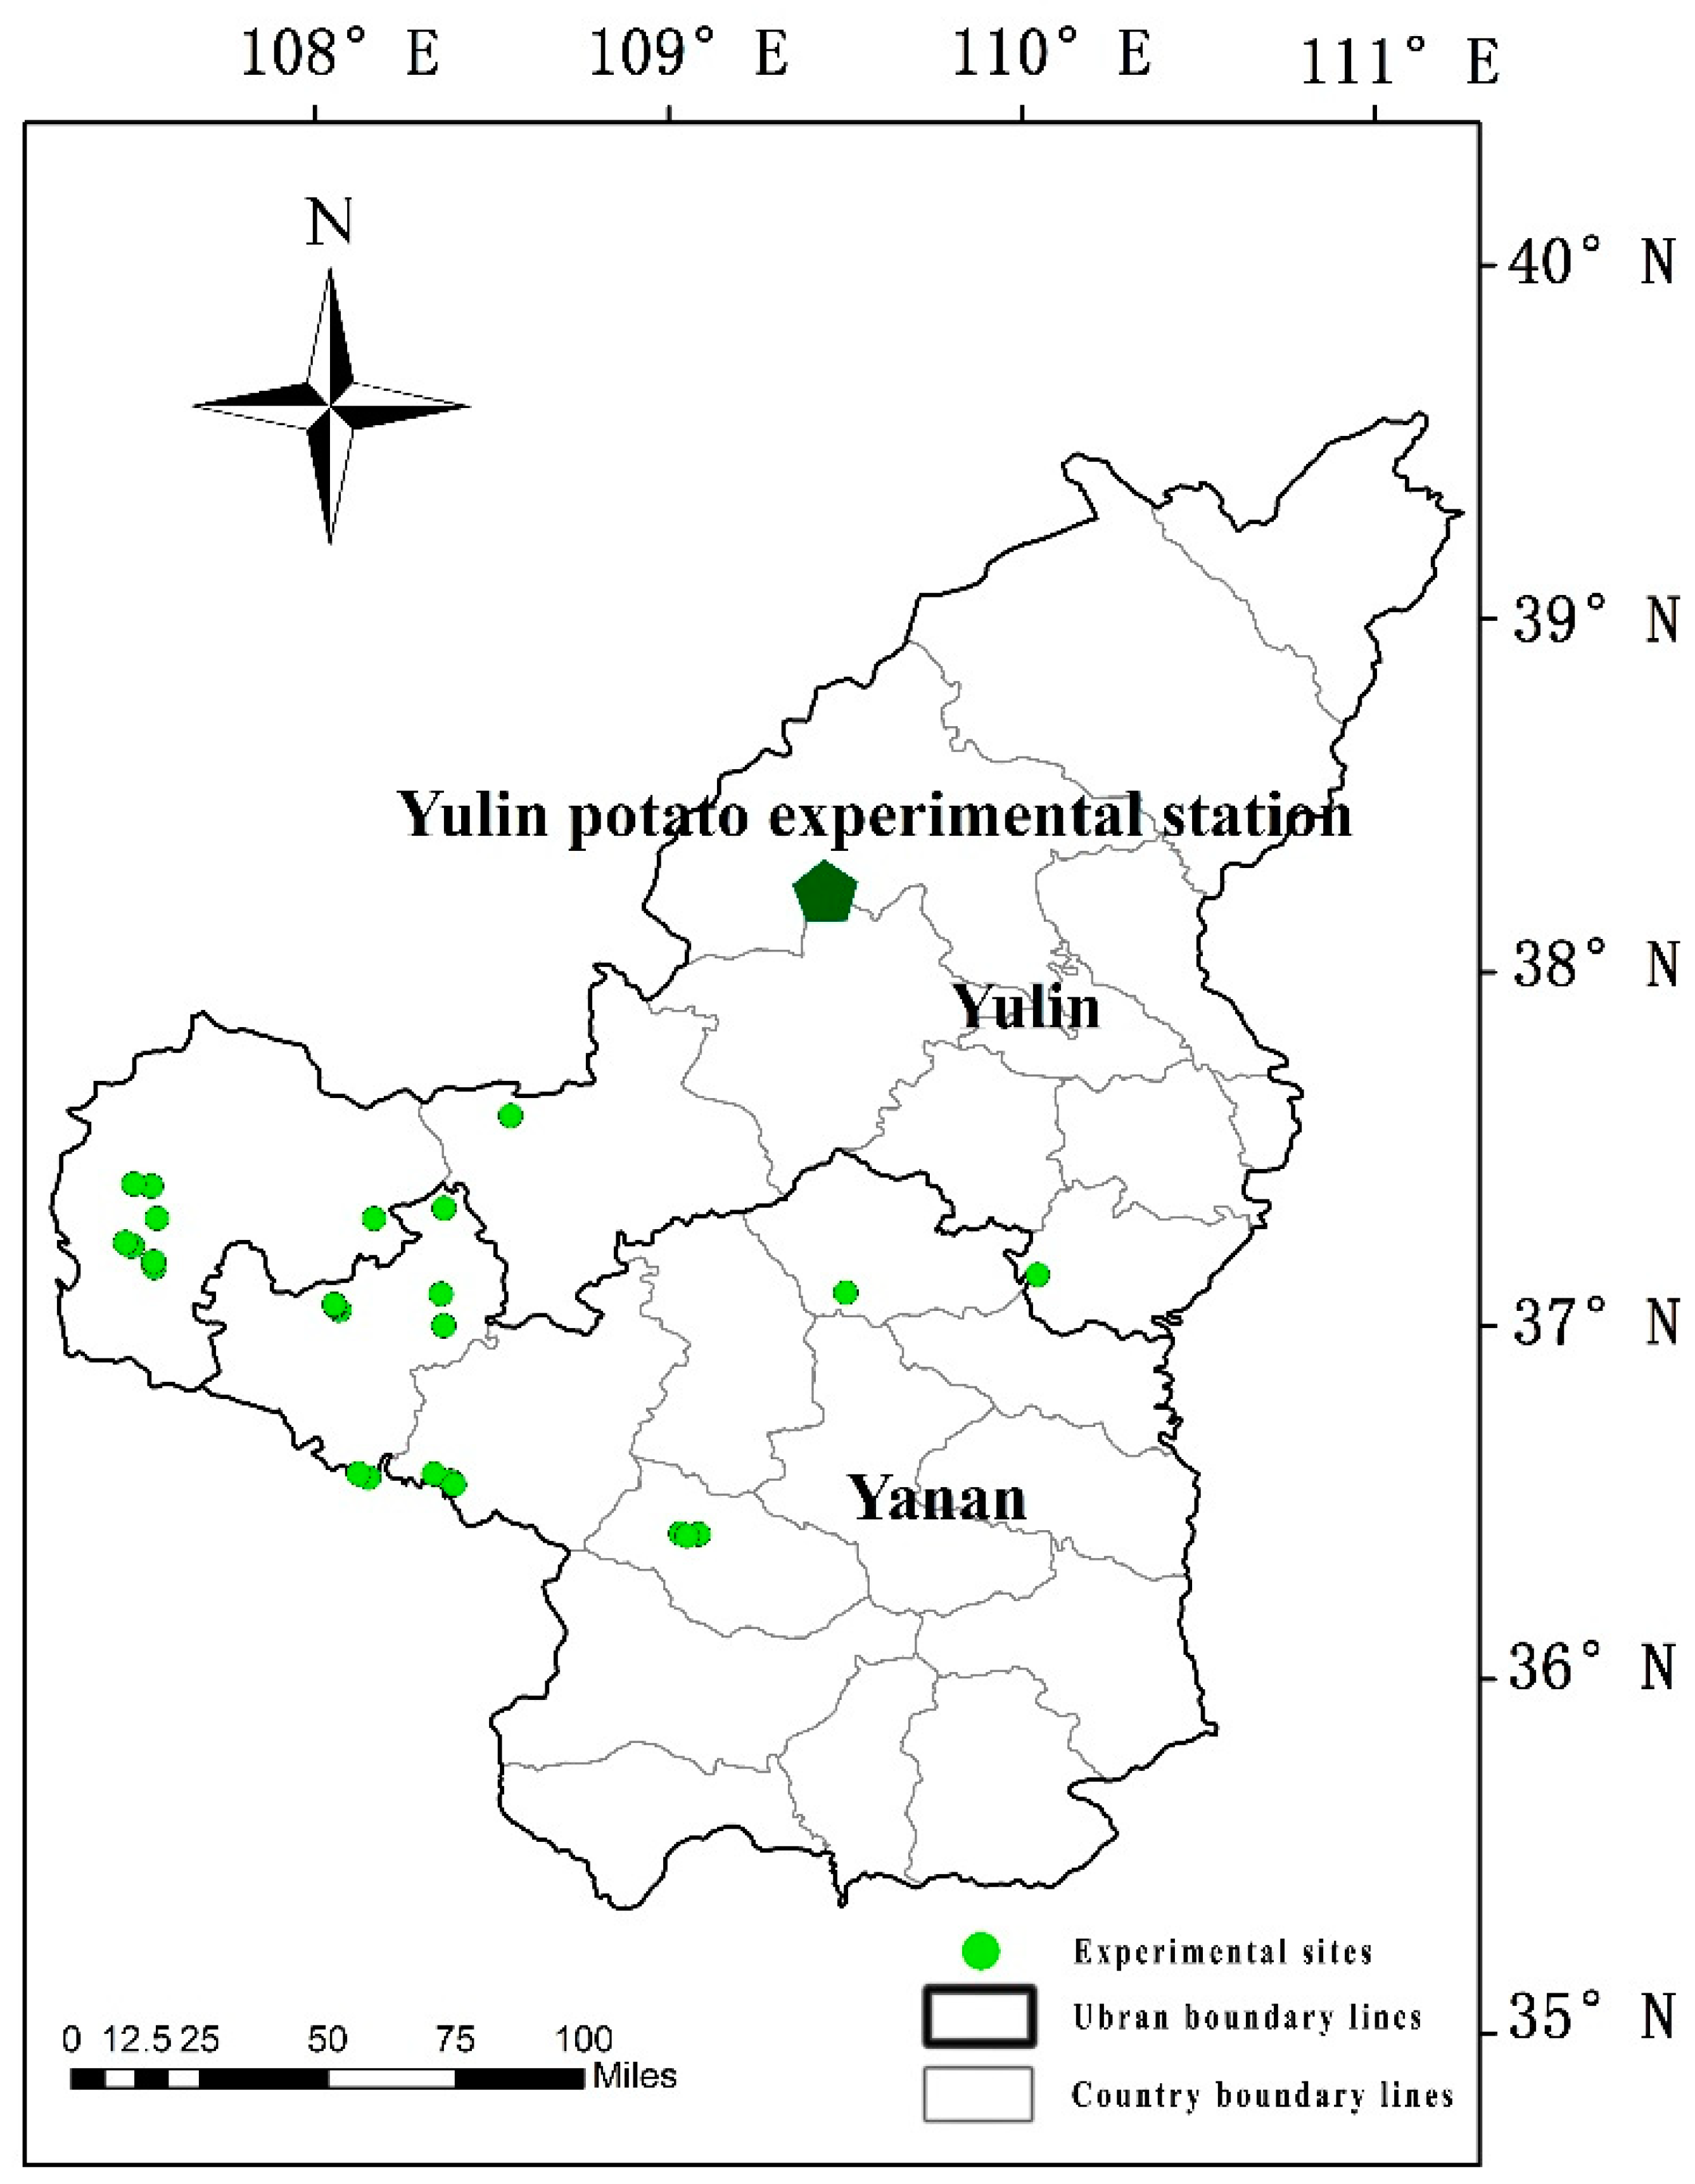
Figure 1. The map depicts the collection area for soil and plant samples in the Loess Plateau of China. The circles show the locations of experimental sites. Thick lines show urban boundaries and fine lines show county boundaries.
Sustainability 11 05621 g001
Figure 2. Classification of potato tuber yield and tuber yield gap in the Loess Plateau. HE, the high-yield group in potato experimental station; ME, the mean-yield group in potato experimental station; HF, the high-yield group in potato planting farmland; MF, the mean-yield group in potato planting farmland. YG1 is the yield gap between HF and MF; YG2 is the yield gap between ME and MF; and YG3 is the yield gap between HE and MF. The solid line in the middle of the box represents the median value. The box boundary represents the upper quartile and the lower quartile. Whisker caps indicate 90th and 10th percentiles. Different letters above the bars indicate a significant difference at P < 0.05.
Sustainability 11 05621 g002
Figure 3. Soil water content (a), soil organic matter content (b), soil nitrate nitrogen content (c), available phosphorus (d), and available potassium (e) in different yield groups. HE, the high-yield group in potato experimental station; ME, the mean-yield group in potato experimental station; HF, the high-yield group in potato planting farmland; MF, the mean-yield group in potato planting farmland. The solid line in the middle of the box represents the median value. The box boundary represents the upper quartile and the lower quartile. Whisker caps indicate 90th and 10th percentiles. Different letters above the bars indicate a significant difference at P < 0.05.
Sustainability 11 05621 g003
Figure 4. The relationship between potato tuber yield and soil water content (a), soil organic matter content (b), soil nitrate nitrogen content (c), available phosphorus (d), and available potassium (e).
Sustainability 11 05621 g004
Table 1. The main characteristics of yield, soil moisture and nutrient content were tested by K-S.
ItemsYieldSoil Water Organic MatterNitrate NitrogenAvailable PhosphorusAvailable Potassium
Average28.9187.3355.5743.98612.22432.420
Range94.88912.6711.33219.9131.884.5
Standard error15.4992.9652.2583.9075.50625.540
Z value1.3912.3162.2992.6491.0424.003
Sig0.0420.0000.0000.0000.2280.000
Table 2. The correlation coefficient between potato yield and soil moisture and nutrients were tested by correlation analysis.
IndicatorYieldWater ContentOrganic MatterNitrate NitrogenAvailable PhosphorusAvailable Potassium
Yield1
Water content−0.308 **1
Organic matter−0.246 **0.334 **1
Nitrate nitrogen0.193 **0.067−0.0431
Available phosphorus0.115−0.047−0.1090.169 **1
Available potassium−0.448 **0.0080.063−0.432 **−0.0931
Note: ** The correlation is significant when the confidence (double measure) is 0.01.
Table 3. Grey correlation analysis of soil water content, soil organic matter, soil nitrate nitrogen, soil available phosphorus, soil available potassium and potato yield.
IndicatorWater ContentOrganic MatterNitrate NitrogenAvailable PhosphorusAvailable Potassium
Correlation0.9340.9330.9270.9420.890
Sequence23415