1. Introduction
At present, university campuses recognize the integration of technologies as a path that leads them to digital transformation. Many of these campuses even work to consolidate information and communication technologies (ICT) on this basis, leading them to be considered as intelligent campuses [
1]. Creating a comfortable, sustainable, and safe environment is characteristic a smart campus, which efficiently contributes to the development of learning and the administrative management of the campus [
2]. To meet these characteristics, ICTs include data acquisition systems, cloud computing, and data analysis on smart campuses [
3]. The integration of these technologies allows for the improvement of the processes of smart campuses and their ability to respond to problems found in this type of environment. One of the problems that a smart campus goes through that has more relevance from an environmental and economic approach is energy consumption. Generally, a smart campus does not have established policies and applications that allow good management of energy resources. This is largely due to the high costs involved in the acquisition of technologies with the ability to integrate all equipment into a single monitoring system. The lack of a system that alerts about alterations in energy consumption results in that, first, there is an incident or damage to a device, then corrective measures are taken, which generates a greater expenditure of resources on the smart campus. An adequate response to this problem is the implementation of a big data framework to monitor the conditions of each team. However, the framework must include versatility and scalability to allow adaptation for any campus, regardless of the infrastructure that it has.
Previous studies have focused on improving learning conditions through the detection of trends in students [
4]. These trends depend on systems capable of detecting any type of event on campus. Such events include sensor and actuator data, safety devices, wireless devices, or learning management systems (LMS) [
5]. The framework monitors and analyses of data provide information that helps decision-making. This work responds to the need from an administrative point of view in situations where energy management acquires greater value due to the importance of its good use [
6]. It is common on university campuses to observe the misuse of energy resources; this causes economic and technical problems in these environments. In a smart campus, this perspective changes dramatically because having a diversity of systems that continuously monitor each area of the campus is feasible in the detection of any anomaly and thus allows for the ability to take action on it [
7]. However, technically this process is more complicated than it seems, as the variables behave dynamically, including a substantial increase in the volume of data [
8]. In addition, the results must be validated on the basis of strict standards established by the manufacturers for each of the pieces of equipment immersed in the energy issue.
This research answers questions such as, “is there enough information within a smart campus to detect the energy consumption of the equipment that is part of the data center?” Moreover, we asked, “does the big data framework provide valid answers to smart campus energy consumption?” For this, the work provides a description of the technological concepts and the main characteristics that serve as a preamble to the development of the analysis. In addition, a brief analysis of the existing research in similar environments is carried out. A detailed description of the existing big data frameworks is made, focusing on which and why it is the most used in the proposed environment [
9]. The development of this work is done with the use of open-source tools on the basis of the method and architecture of the cluster. The use of these types of tools makes the method generic by enabling its implementation on any type of campus [
10]. In addition, the method is validated and refined in the treatment and monitoring of data that identify the voltage variation of the smart campus data center.
The rest of this paper is structured as follows: In
Section 2 the concepts used for the development of the method are presented;
Section 3 describes the analysis of the previous research that has contributed to the development of this proposal;
Section 4 includes a method for establishing the different phases to be considered when implementing a big data platform;
Section 5 presents the results applied to the monitoring and analysis of data;
Section 6 presents the discussion and
Section 7 presents the conclusions.
2. Preliminary Concepts
2.1. Big Data
The concept of big data refers to the analysis of large volumes of data stored in various sources. The data are not necessarily structured or in any specific format. The objective of big data are to meet the needs not previously met by existing technologies, such as business intelligence platforms or statistical data analysis [
11]. When this technology is used in educational environments, it has an impact on academic management. It helps in the use and management of resources by providing knowledge about the data stored in these environments. This has an impact on real-time decisions, which contributes to successful management [
12]. To comply with this process, big data techniques involve the storage and processing of data with specific characteristics, such as
The content format.
The type of data.
The frequency with which the data is made available.
The intention: how the data should be processed (for example, an ad hoc query on the data).
Volume: the size of the data that can come from multiple sources.
Velocity: the speed with which data arrive using units such as tera, peta, or exabytes.
Variety: structured, semi-structured, and unstructured.
2.2. The Smart Campus
Technological advances have allowed societies to talk about concepts such as smart cities that can modify people’s futures. These technologies support the resolution of problems related to the management of environmental resources, the reduction of energy consumption, mobility, and waste management, among others. [
4]. When technology is applied in a university environment, the resulting smart campuses are an illustration of what smart cities could be like. University campuses are places where thousands of people study or work every day [
2]. The use of ICT in smart campuses improves the quality of life of its inhabitants and enhances the coexistence between the university population and their surroundings, properly managing resources within the campus, and providing favorable environments for learning [
13].
2.3. The Internet of Things (IoT)
The Internet has gone from being a network of computers and servers to including a variety of devices that interact with each other and with users [
14]. The devices have the ability to generate data and transfer it through a network automatically without the indispensable interaction of people or computers [
15].
All the devices that make up the IoT capture data from the real environment and send it to be processed and provide a better user experience. The main objective of the IoT is the digitalization of the physical world so that all traditional devices are connected to the network and synchronized with each other provide a better and efficient service to the user [
16].
3. Previous Research
Previous research has allowed us to identify different works aligned with the use of big data in controlled environments, focusing specifically on the use of Hadoop as an analysis architecture [
17,
18]. The research carried out is divided into two groups, and the first provides a perspective on the application of big data in Hadoop architecture [
19,
20]. Much of this architecture focuses on processes that do not necessarily look for results in real time; however, it needs high availability and great processing capacity [
21]. The guidelines define the correct architecture according to the requirements of this study.
The second group of research was carried out in university environments and focuses on meeting the needs of students [
22]. These needs range from improving administrative processes to analyzing the data of the inhabitants [
23]. In this group, there was little research into the architecture or integral analysis where all the data generated in a campus are taken advantage of through a process of big data analysis [
20] to help in efficiently managing processes and resources [
24].
The review of existing research highlights that most of the work solves problems separately, for example, the acquisition of data by IoT, the management of cloud computing, and the use of big data, among others. However, few works have addressed the integration of technologies for the creation of intelligent environments. The integration of technologies allows converting traditional environments into intelligent ones, thus contributing to the implementation of an intelligent campus [
25]. In previous work, the authors propose an intelligent campus model aligned to meet the needs of all residents through data acquisition, storage, and analysis through emerging technologies. The work presented in this paper takes as reference the proposed model and generates a big data framework that adds to previous works in the following ways:
The integration of the equipment in the model so that the framework can access the data they generate.
The capacity of big data nodes being improved to ensure the processing and analysis of variables.
In previous works, the framework with data was considered critical in the administration of campus infrastructure. The inclusion of the data center team in the big data framework offers the possibility of improving the use of each of these resources by supporting the management of an intelligent campus and its sustainability.
4. Method
The objective of the smart campus is to manage the technological, human, and environmental resources properly so that the activities of the inhabitants are balanced with the campus components. To achieve this goal, it is important to analyze the factors that make a campus smart and how they interact with each other to improve the processes and management.
In previous works [
13,
17], the authors defined in detail how to build all the necessary infrastructure to convert a traditional campus into an intelligent campus. This work provides the basis and support to complement the big data framework, focusing on more technical problems, such as the monitoring of voltages in data center equipment. The previous works analyzed the data generated by several systems, such as the mobility system through the wireless system and the vending machine system [
5]. This analysis helped to detect existing trends in the campus population by grouping it in specific periods. However, the model proposed in [
17] was put to the test with the data generated by the equipment that were part of the data center by monitoring more technical variables such as the variation of voltages. These data, unlike those analyzed above, are of high flow, since the collection is constantly carried out, which compromises factors such as processing and storage capacity. In response, the authors have seen the need to adjust the big data framework to perform a much more technical work, including nodes with greater capacity and segmenting tasks to guarantee results when there are simultaneous processes [
9].
The proposed framework is based on the model proposed in [
17], which allows defining what is the best option for the integration of technologies and how they can improve administrative and academic management in these environments.
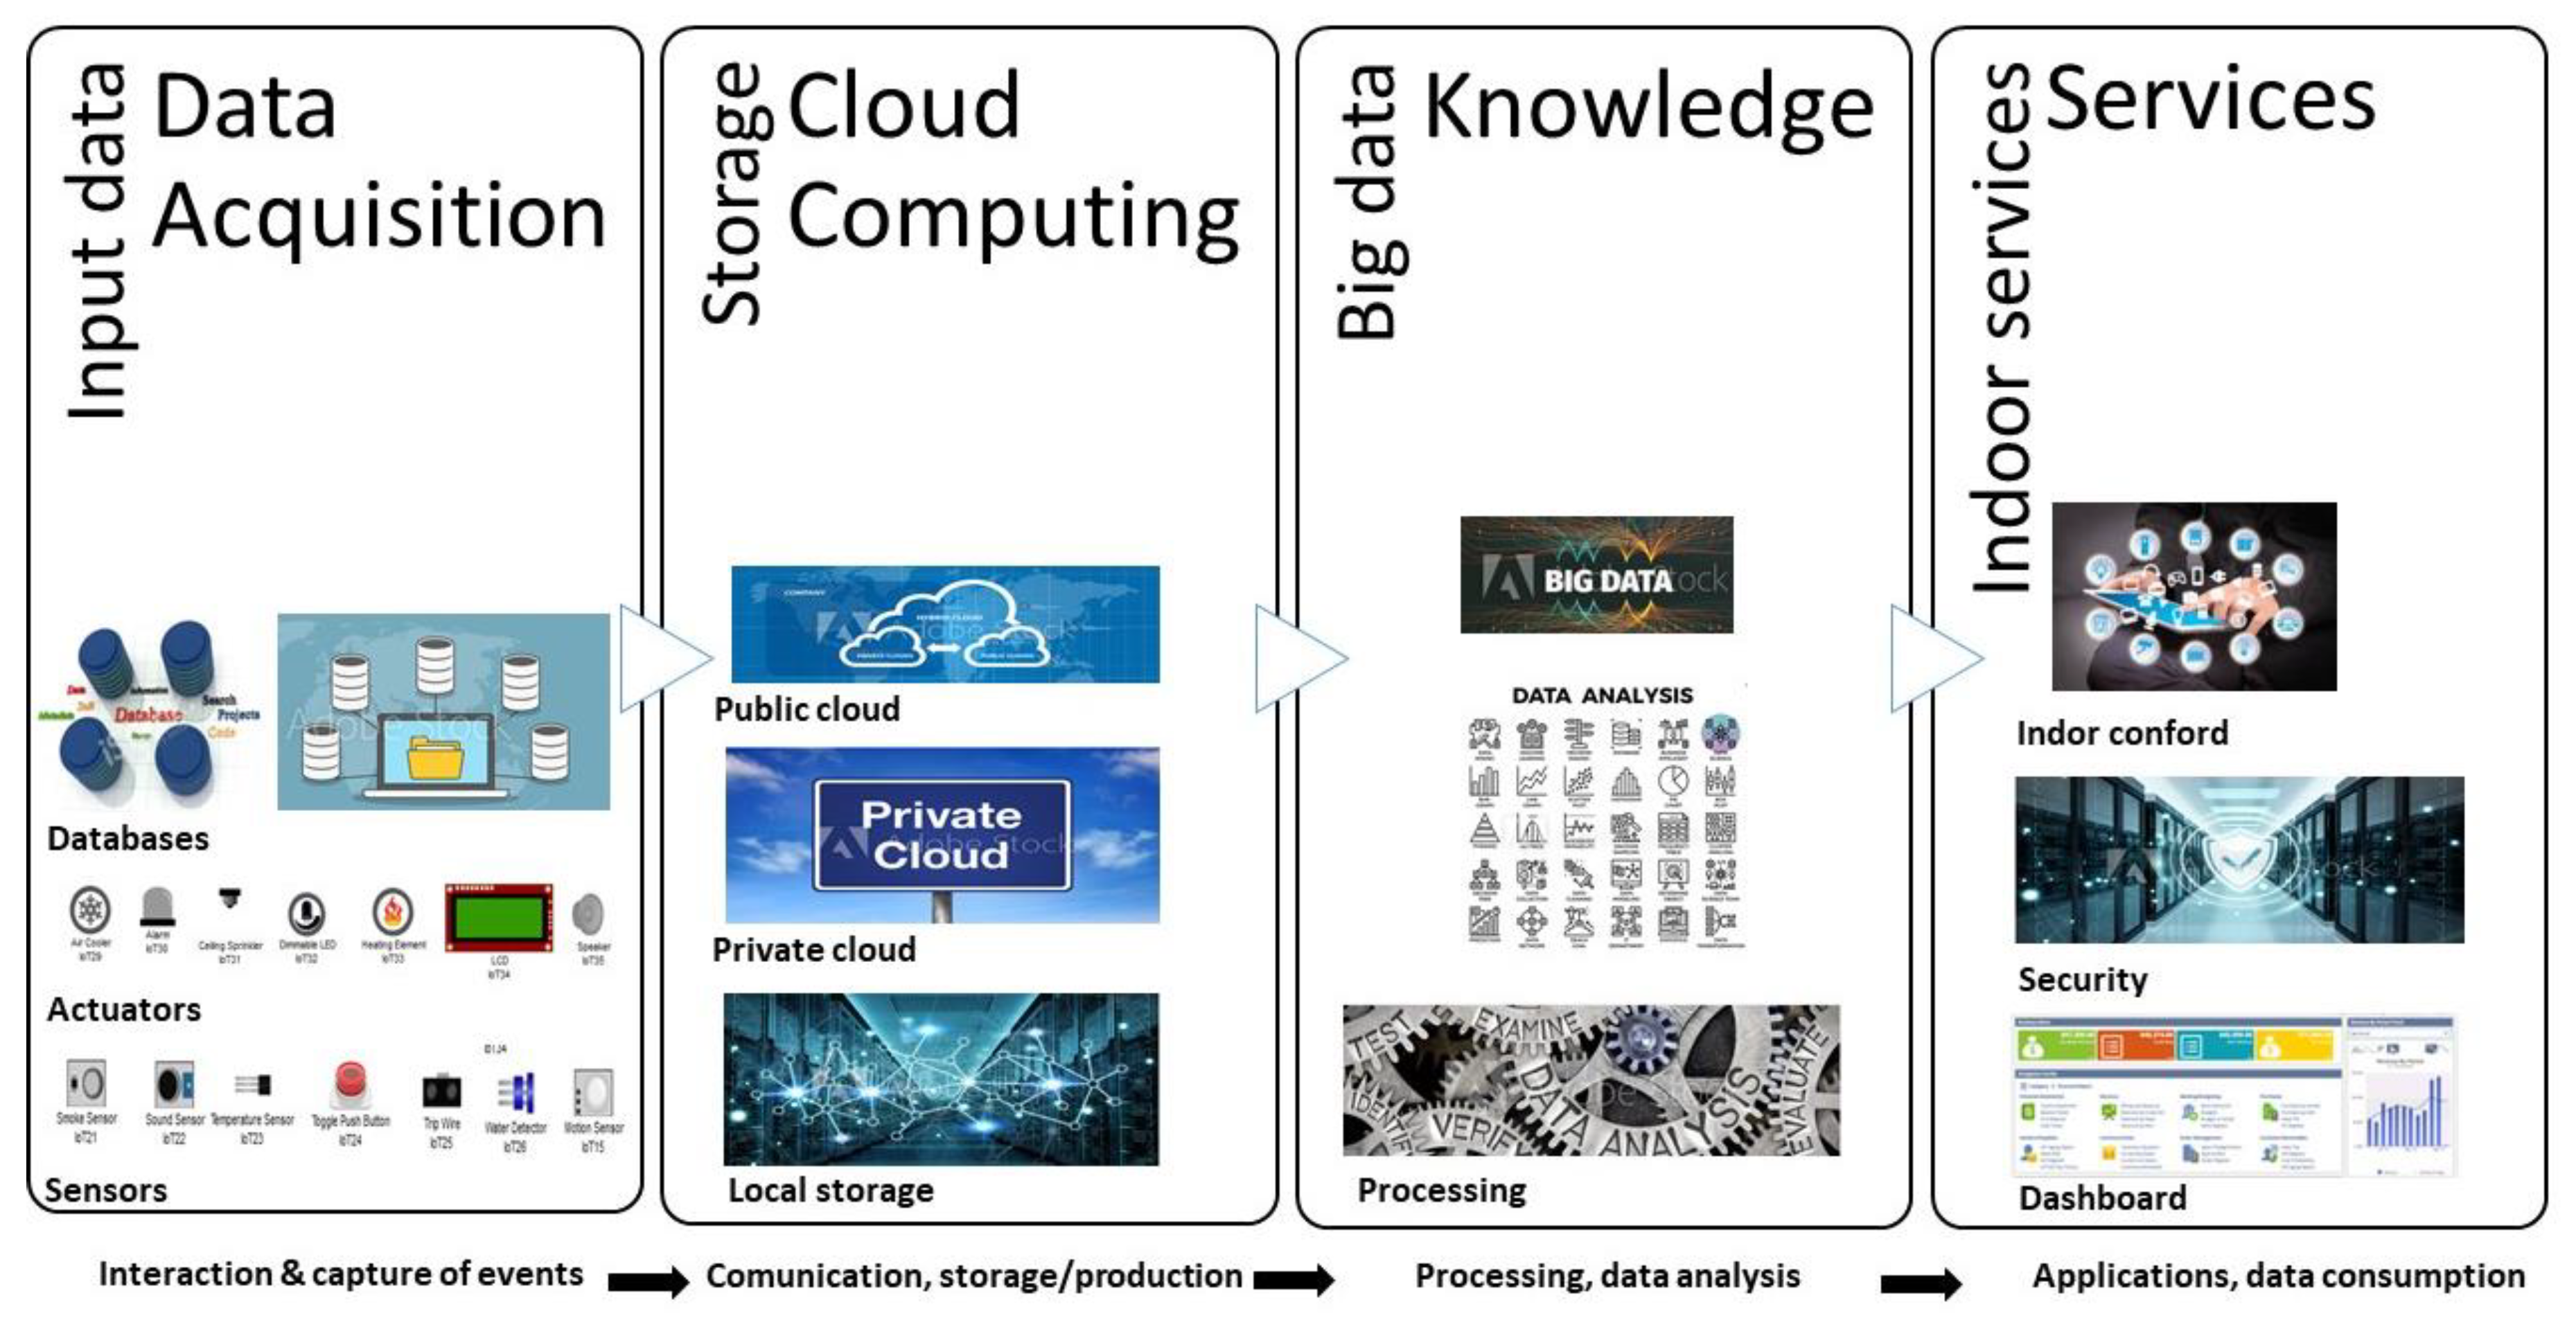
Figure 1 defines the architecture of the intelligent campus; this architecture considers all the phases and equipment that contribute to the development of the framework proposed in this study.
4.1. Tools for Developing a Big Data Framework
For the development of the method, it is important to define the big data tool to use, as this constitutes the basis for the development of the framework. Currently, two frameworks are used as big data ecosystems; these are the Hadoop ecosystem and Apache Spark. For the application of a specific framework, it is important to have an understanding of the ecosystem. Hadoop is a framework for storing large datasets using computer clusters. It can scale from a single computer system to thousands of systems, and it provides local storage and computing power [
26]. Apache Spark was designed for quick calculations, and its main feature is that it processes everything in its own memory, which increases the processing speed. Hadoop is integrated with MapReduce processing and uses persistent storage, whereas Apache Spark has a resilient distributed dataset known as resilient distributed datasets (RDD). Apache Spark performance is fast, processed in memory, and offers real-time analysis. Hadoop was originally designed to continuously collect data from various sources without hitting problems caused by the type of data used in batch processing; thus, it was never built for real-time processing.
Hadoop does not have an interactive mode, but it has add-ons such as Hive and Pig that make working with MapReduce easier [
27]. Hadoop and Spark are projects hosted by Apache, meaning that they are open-source and do not have licensing costs. Processing can be divided into two types, batch-processing and processing by the flow. Hadoop uses a batch-processing framework—it sends a work, reads the data, performs the operation, writes the results, and sends them to the cluster successively. Spark encompasses iterative batch application algorithms, interactive queries, and streaming. MapReduce uses an effective method for fault tolerance by using TaskTracker that issues reports to JobTracker. If this is lost in the report, the JobTracker reprograms all the operations. Spark uses RDD, which is a set of elements that tolerates faults and operates in parallel.
Hadoop has multiple ways to provide security. Kerberos supports and is compatible with other providers such as lightweight directory access protocol (LDAP), and offers encryption with Hadoop distributed file system (HDFS). Spark’s security is partly in the authentication process, which is one reason why it needs HDFS to be executed as it uses, accesses, and gives permission to files.
4.2. Data Acquisition
Within a smart campus, new technologies are integrated so that the IoT acts as a connectivity system and includes a multitude of devices, such as sensors and embedded systems, as it carries out the acquisition of data [
28]. These devices allow data to be collected, which affects the optimization processes [
5]. The processed information allows knowledge to emerge and control the environment, extracting patterns of behavior or information relevant to decision-making. The data generated by the devices on the campus network is stored in the data center and processed and analyzed in search of knowledge [
29]. The way in which sensors interact with the environment and people contributes to creating a knowledge society. Sensors gather information from the environment and send it to the cloud, where interested parties can consume it. Information that is converted into knowledge helps decisions to be made quickly and accurately. The technology proposed by Kamilaris [
30] and Pitsillides [
31] gives greater validity to this work, since the implementation of an ecosystem on the basis of the IoT ensures that students and teachers make sound decisions in relation to their environment. In environments that monitor energy consumption in a data center, it is essential to have a data analysis platform that constantly monitors any variations in voltage and in the equipment, which could prolong its useful life.
4.3. Cloud Computing
University campuses generally have their own infrastructure for data storage and management. They tend to be composed of a data center and communication equipment, which are responsible for unifying the different areas within the data center. A data center, where the information is concentrated and centralized, is advantageous for the deployment of the framework and guarantees the availability and quality of the data [
32]. The data stored comes from the different systems within the university, in addition to the IoT devices deployed throughout the campus. The services offered by the university to its residents are managed through a variety of virtual servers hosted in the different server blades. In addition, some services, such as the Office 365 mail service, are hosted in a public cloud.
In a smart campus, it is not advisable to migrate all services to a public cloud because of issues of control and information security [
33]. For this reason, the data on the campus that are part of this study are stored in a private cloud generated from the information available in the campus infrastructure [
34]. The advantages of this are data security, quality, availability, and flexibility.
4.4. Knowledge
In order to obtain knowledge on a specific topic, it is necessary to analyze the data generated by each of the systems. In many cases, in order to determine the knowledge about an object, it will be necessary to interrelate all the data available on the campus; this implies a great technical and physical processing capacity. Our previous work [
17] specifies the use of Hadoop as a framework used for data processing and analysis [
35]. The knowledge generated at this stage allows for making decisions that contribute to improving processes, as well as implementing systems that act directly on the results and interact with the environments automatically.
4.5. Services
Within the smart campus, technological integration with the framework provides several services that contribute to the operation of the campus [
36]. These services are classified into two groups: the first group is responsible for everything related to administrative management and the second group is responsible for academic management. The framework contributes to administrative management in environments such as human resources, where it provides more efficient management in organizational processes. In addition, it can be used to develop tests for the evaluation and selection of candidates or the creation of resources aligned to the development of transversal competences [
37]. In the energy environment, monitoring and analysis of voltage variation allow the creation of predictive maintenance programs to improve electricity consumption in a safer, more economical and sustainable way [
38].
In academic management, the framework offers new information about students and teachers to the areas of marketing and admissions in order to make strategic decisions in the educational model [
39]. In the learning environment, it applies its own data analysis techniques to optimize educational management, learning, and attention to the student, giving support to personalized education [
40]. The framework is able to offer alert services and generate recommendations, among other benefits [
23].
In this work, the framework is applied in an administrative management environment where the energy environment is included. The problem to be overcome is to improve the life and performance of the electrical components of certain equipment in the data center of the smart campus [
10]. In addition, it seeks to detect anomalies in the power supply that receive this equipment. Once an anomaly is detected, it is possible to generate early alerts and preventive maintenance that guarantee the proper functioning of the data center [
41]. To respond to the problem, the work involves monitoring the electrical consumption of the equipment and analyzing the data in search of any type of harmful event related to this process. In this environment, equipment seen to be critical in the operation of the smart campus data center are considered. The devices are the communication switches responsible for enabling the connection between the data infrastructure of the smart campus and the data center [
8]. The other piece of equipment is the uninterruptible power supply (UPS)—this equipment is the main energy backup in case of lack or failure of the public electricity supply. In the following subsections, the monitoring and analysis of energy consumption data in data center equipment are presented.
Analysis of the Energetic Consumption of the Data Center
To evaluate the big data framework, special monitoring was carried out to gauge the energy consumption of the data center equipment of the campus participating in this study. The monitored equipment were the Nexus 3500, the UPS, and the American power conversion (APC) model AP9215RM. The parameters monitored and integrated into the Hadoop environment for analysis are as follows:
Speeds in each interface (Nexus).
Administration labels (Nexus—UPS).
Input voltages (Nexus—UPS).
Output voltages (Nexus—UPS).
Battery temperature (UPS).
Output current (UPS).
Output and input frequency (UPS).
Battery capacity (UPS).
The implemented big data framework was prepared to process huge amounts of information. To calculate the volume of information to be processed and loaded, Equation (1) was applied.
The variables established for the data acquisition configuration were
n = data sampling period.
y = amount of monitored items (Tags).
t = days/months of monitoring (Time).
r = projection.
p = size.
s = seconds per minute.
m = minutes per hour.
h = hours per day.
The analysis considers the data generated in a period of 3 days, and according to this clarification the following values were obtained:
x = ? (number of records).
X = 1.057.680 (Total records generated in 72 h).
To obtain the projection of records in a period of 6 months, the following were considered:
N = quantity of months.
H = hours per day.
D = days of the month.
Y = number of records.
r = [(H × D) × N] × Y.
r = [(24 × 30) × 6] × 1,057,680.
r = 761,529,600 (total records generated in 6 months).
Once the number of records was identified, it was then important to know their weight in megabytes and gigabytes to ascertain the volume of information being processed by the big data framework. For this calculation, it was first necessary to know the fields consulted the type of data and the size by data type.
Table 1 lists the names of the fields selected for monitoring and includes their data type and size in bytes. The values specified in the table were considered in order to find the size of the query per record, all based on the size of each field corresponding to the item generated in the monitoring.
The variables and values were
Established values:
x = 418.60 MB (this result is the weight of the records currently monitored). To calculate the total size with a projection of six months the value of the records was changed as follows:
5. Results
In order to evaluate the developed framework, the exercise was applied in the monitoring and analysis of the data generated by the communication teams, as well as the UPS. This process tested the entire distribution of the framework from data acquisition to data analysis. The results obtained were compared with the energy consumption data of each of the equipment provided by the manufacturer. Next, the whole process generated for the analysis was detailed, wherein each of the stages and the specific variables in the electrical consumption were included.
5.1. Analysis of Voltage Variations
On the basis of an analysis of the campus infrastructure and data center equipment for six months, an equivalent of 300 GB of information was processed. An important condition to consider in the process was the monitoring of items by devices or new equipment income, as the volume of data can be rapidly increased until it reaches the surrounding terabytes or petabytes of information. It is necessary to emphasize that the data was acquired from the network equipment and the energy control system where information is processed during a 24 h period. To perform a history of events, a regression was carried out that involved processing large amounts of information at the terabyte level. For this reason, the Hadoop framework was configured to process batch information to solve the problem of an environment that required a regression or projection analysis. For the analysis, the framework worked with the input voltage data in the Nexus 3000 family and the input and output voltages of the APC UPS and AP9215RM models.
Table 2 shows the unification of the voltage values of the network equipment, computing, storage, and UPS, which are provided in the datasheets.
In the analysis, the default values detailed in the technical specifications of the equipment were established; the values had a direct line in their input voltage.
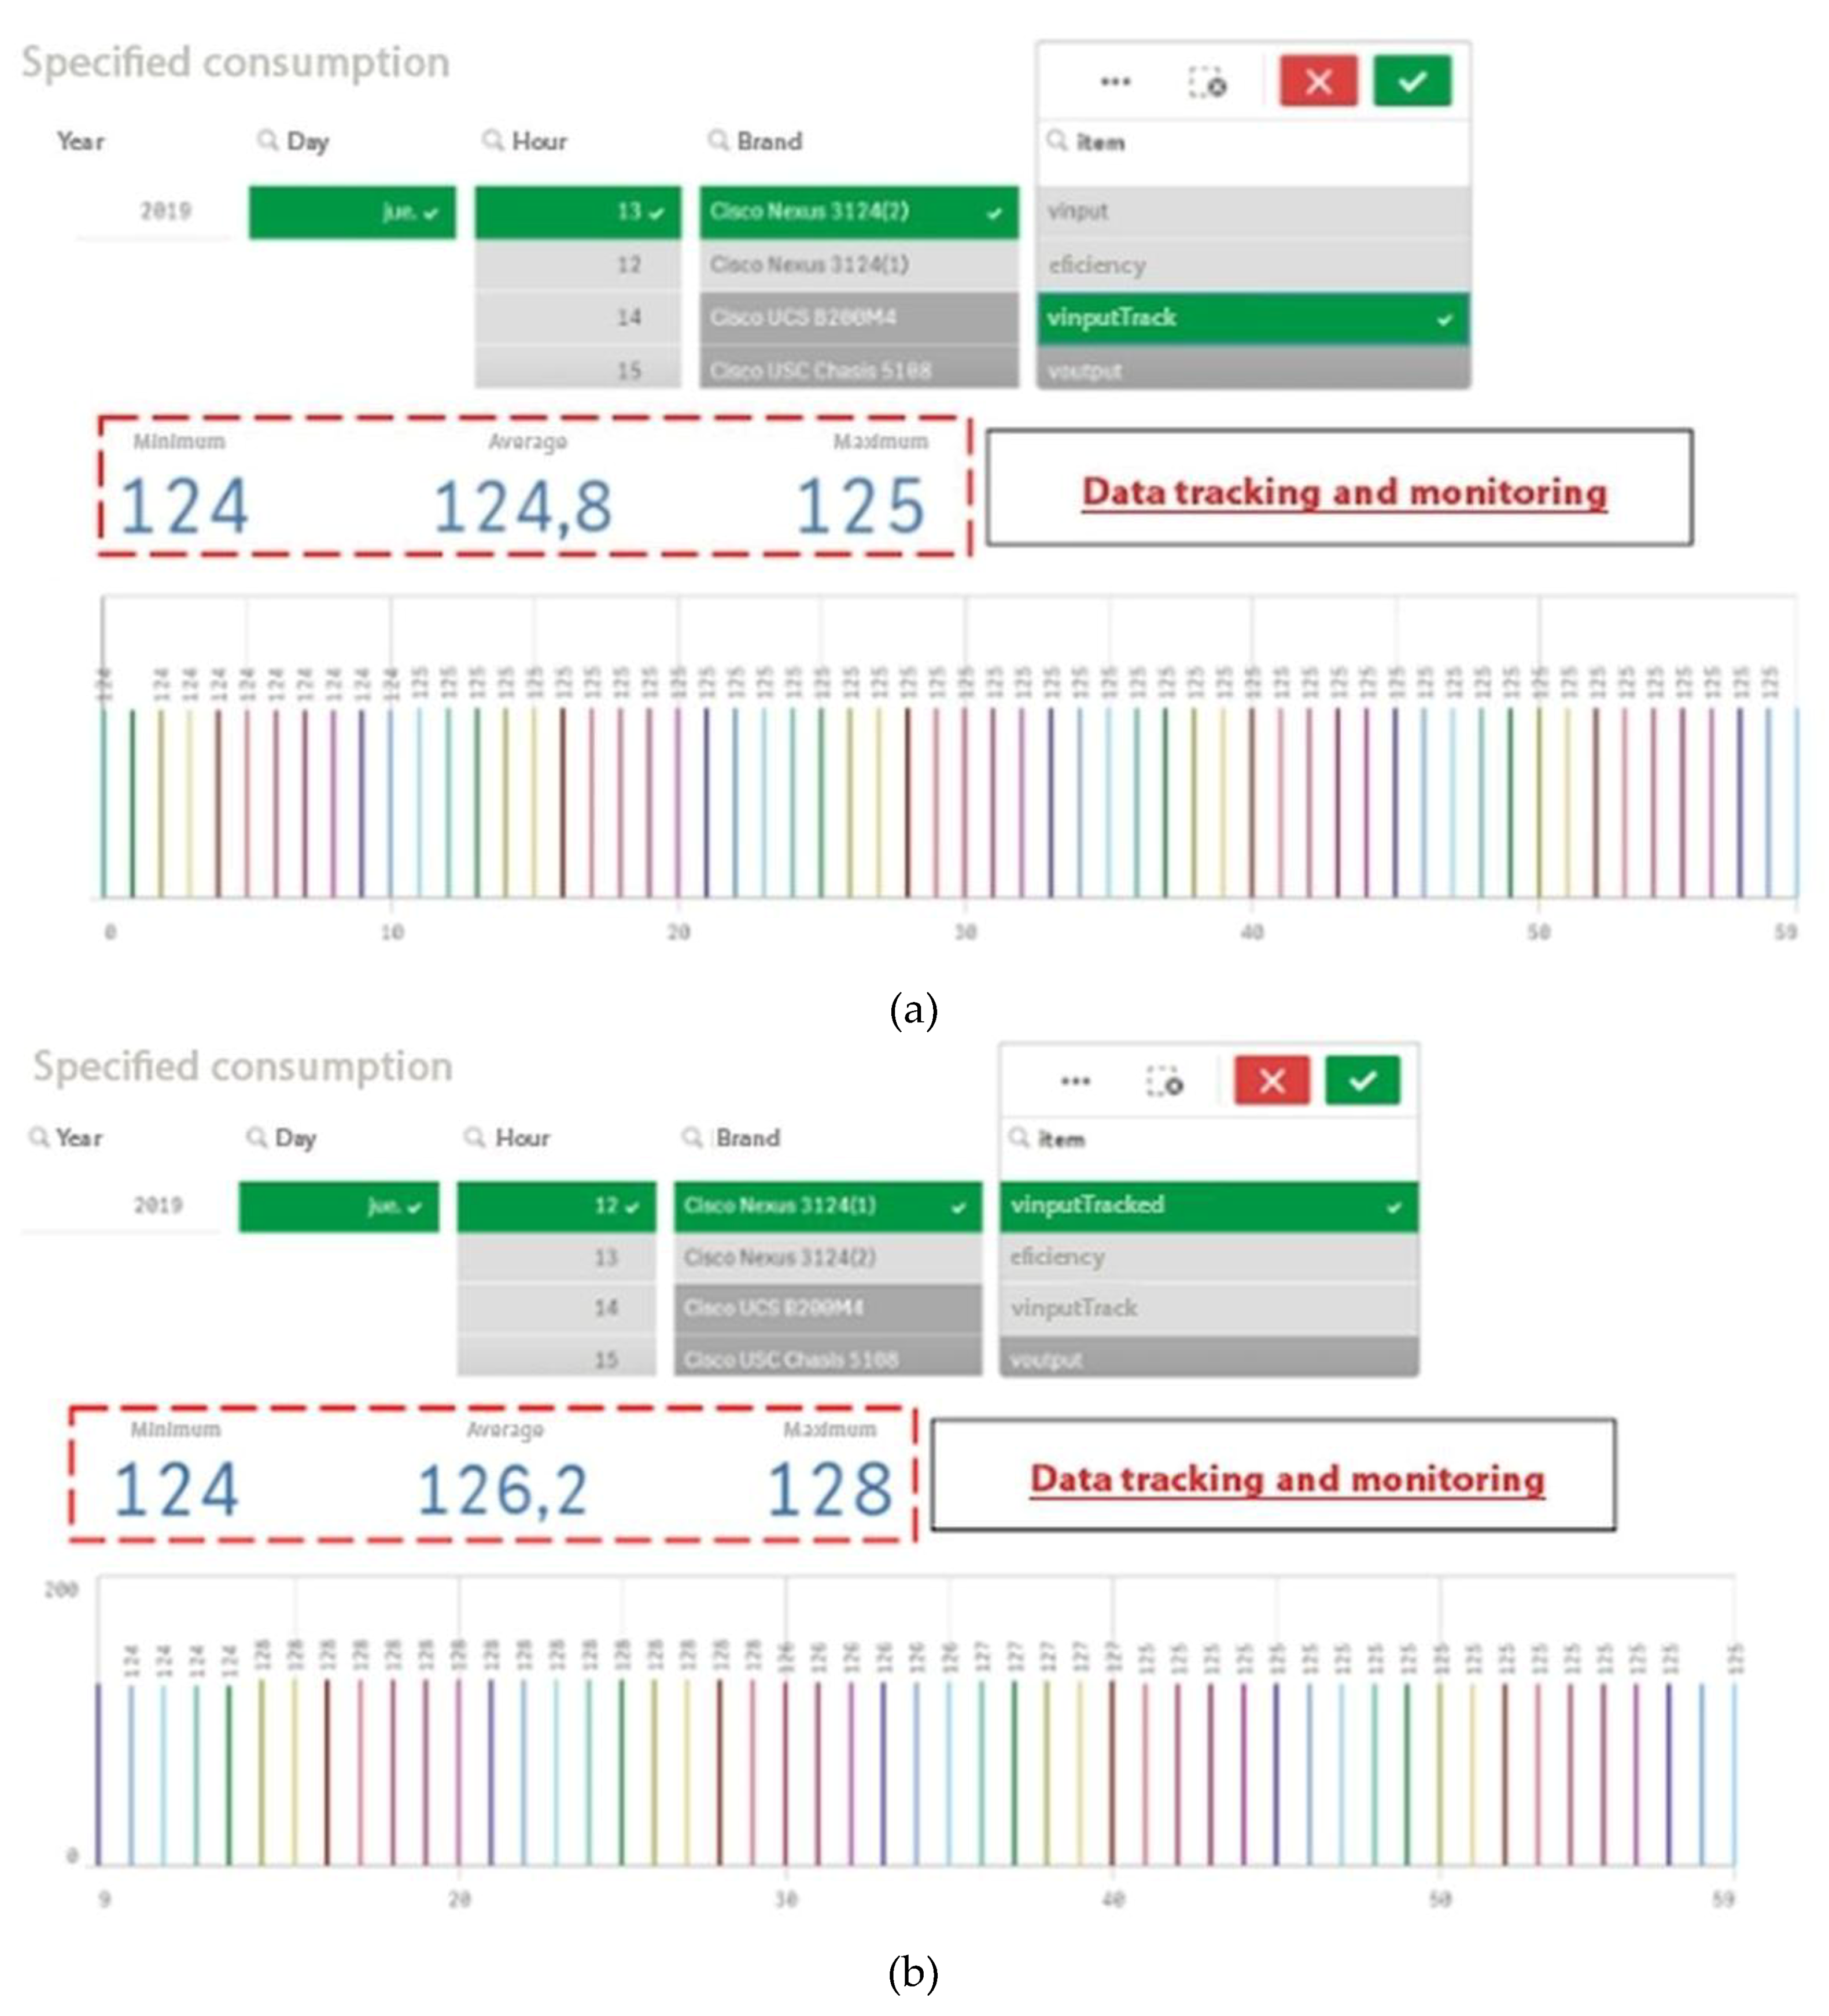
Figure 2 shows the best scenario of input voltage consumption, which was 120 volts—this is the common voltage value of Ecuador, where the work was performed. This can be observed in the left section of the figure, and the real scenario that takes values in relation to those acquired in the monitoring is observed in the right hand section. This ranged from a minimum of 124 to a maximum of 128 volts, considering the average of 124.8 volts on Nexus 3124 devices.
The analysis of the Cisco Nexus 3124 equipment shows that the voltages acquired in the monitoring varied between each piece of equipment. The Nexus (a) had a higher peak voltage, at 128 volts, even so, the values were still in the range specified by the manufacturer. Therefore, on the basis of the technical data sheet, there is an energy efficiency corresponding to the range of 89% to 91% by the equipment. The results imply that the equipment used at the time of monitoring had a performance focused on sustaining the efficient use of energy and was less than or equal to one.
During the analysis, a sample was taken during a period of 6 to 10 hours of monitoring, and as a result, variations of 2 to 8 volts per minute were identified. This means that the equipment underwent a type of overload in short periods, the Nexus equipment (b) in particular. These results indicate that it is important to have constant monitoring policies that verify the values for frequency, power, memory, and processing. The objective was to identify what caused the variations in voltage, even though they were within those established by the manufacturer, as over time they can still cause irreparable damage to the equipment.
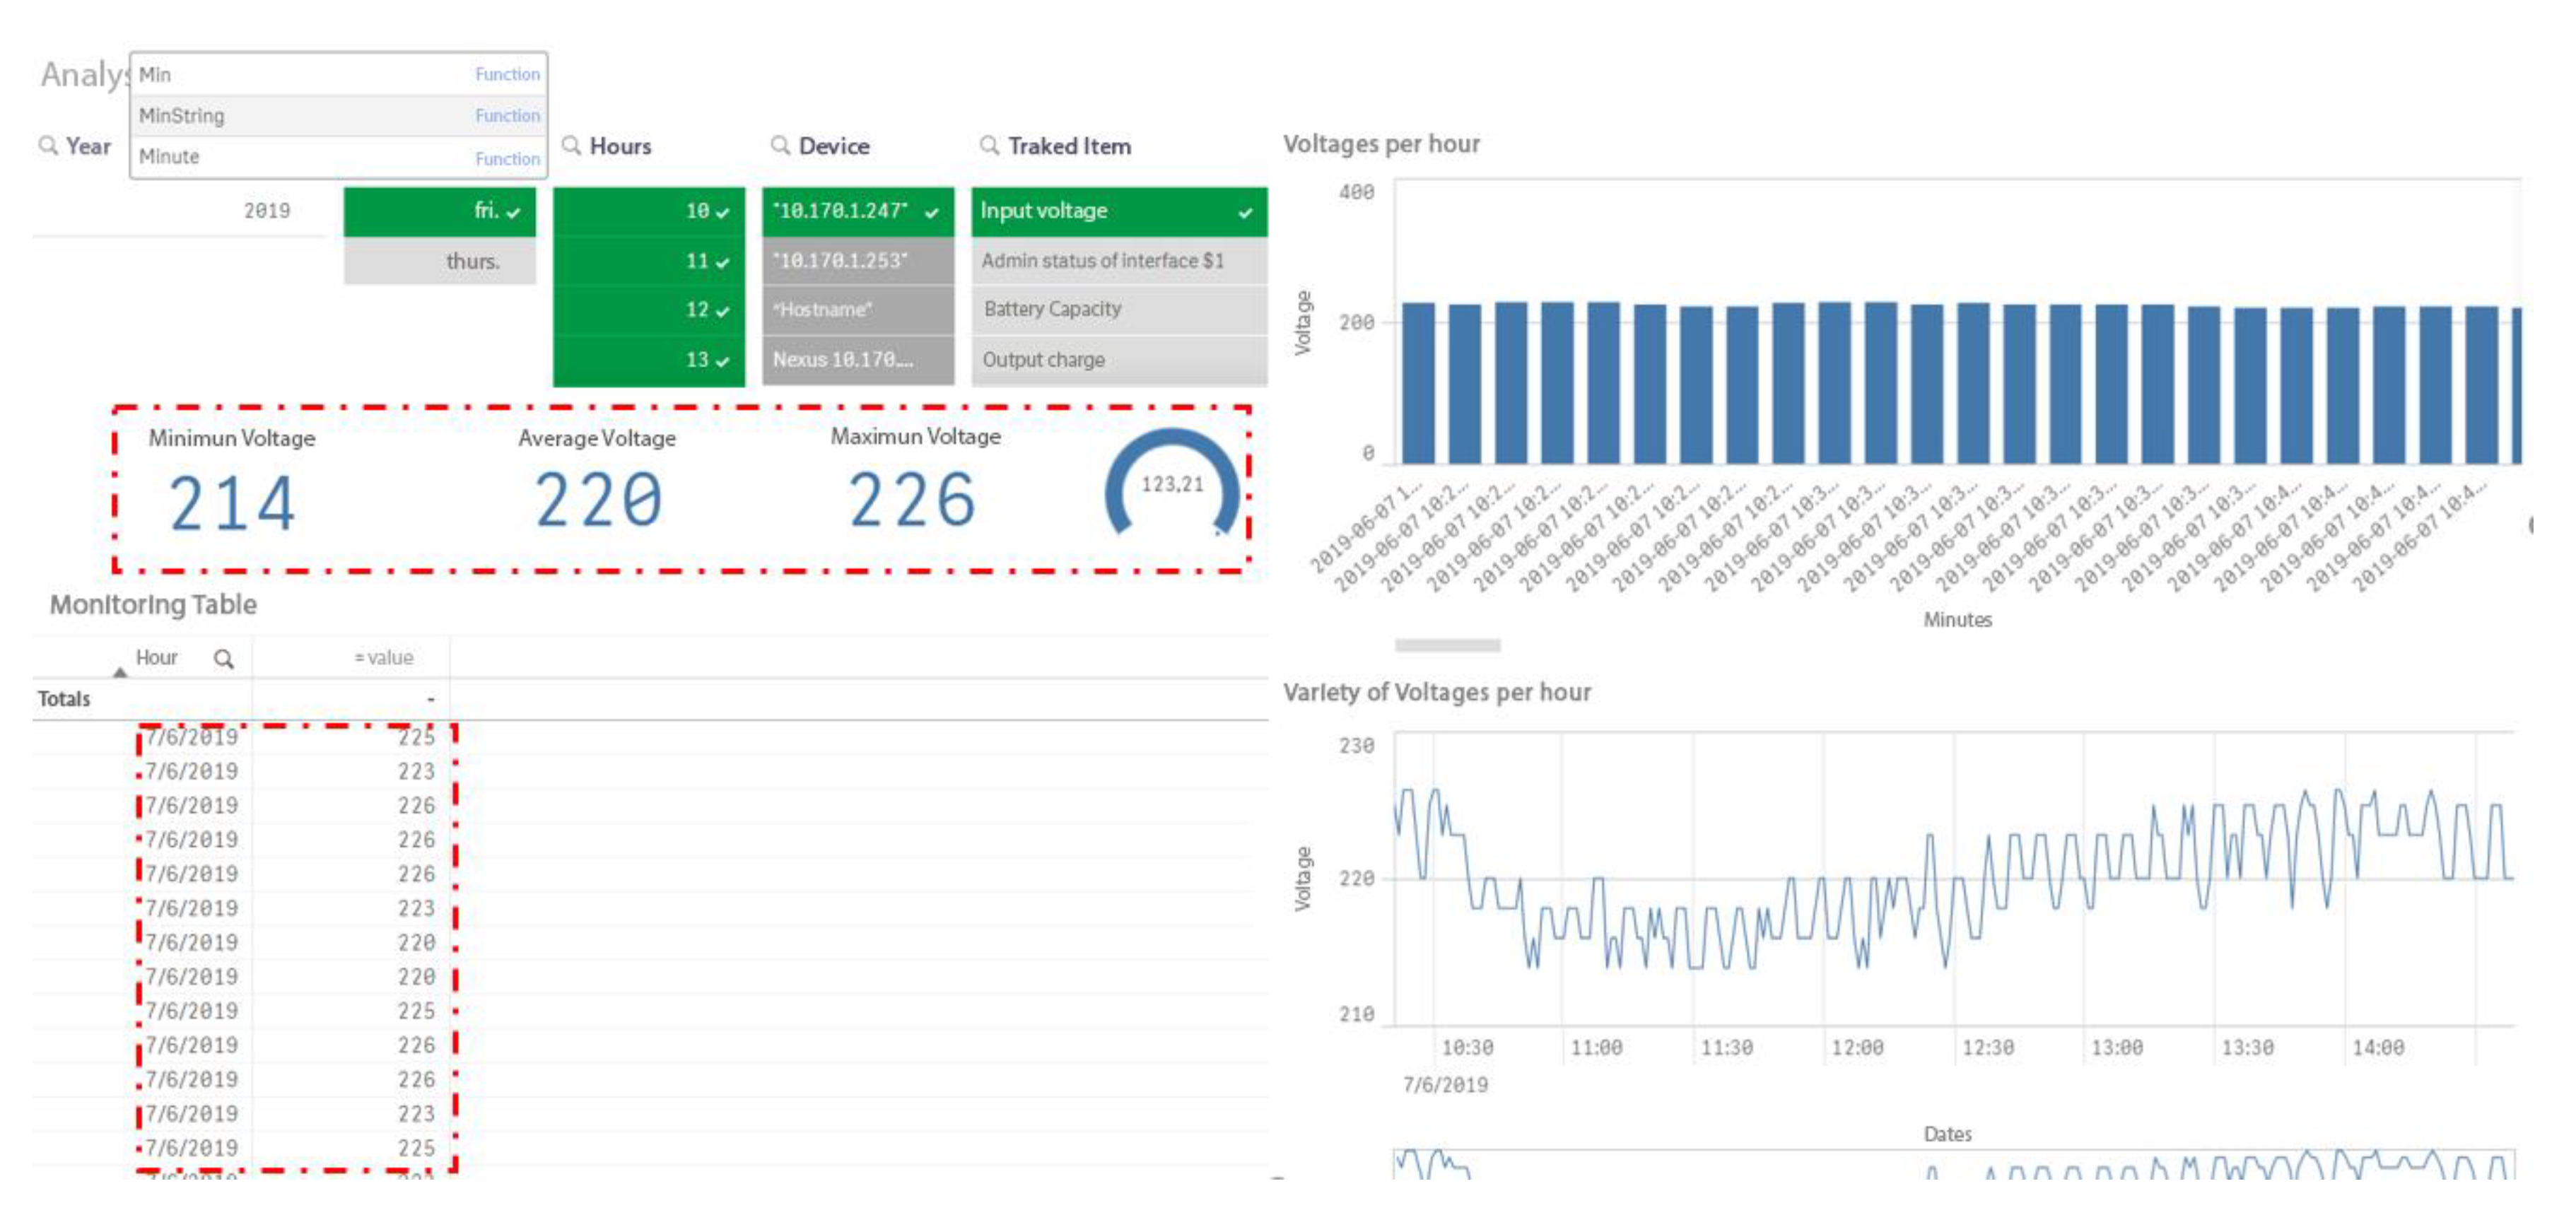
5.2. Voltage Monitoring in the Uninterruptible Power Supply System
The UPS was integrated into the monitoring to handle an approximation closer to the real load consumption of all the equipment. The equipment was connected to this alternating power supply, and, through monitoring, it is possible to verify its total voltage when it is at maximum consumption capacity. The input and output voltages were monitored and compared with the datasheet of the equipment that specified a consumption of between 200 and 240 volts, which guaranteed the efficiency of 89%. Once the data were entered into the framework, the voltages obtained ranged from 214 to 226 volts; thus, it was concluded that the equipment was in favorable conditions and contributed to a PUE close to one.
Figure 3 displays the monitoring during a particular period, and the parameters monitored correspond to the input voltage. A minimum of 214 and a maximum of 226 volts was verified in certain minutes; however, these values were within the range established by the manufacturer.
Figure 3 shows the variations in input voltage, which fluctuated from 11 volts with an average of 220 volts, which was within the range established for the equipment according to its technical data sheet. This measure was taken during a 48 h period, where the load of the equipment was not greater than the standard values. In future, it would be beneficial to analyze the equipment when there is a power cut and when all the devices are connected to the UPS, so as to validate a higher load and determine the minimum and maximum voltages.
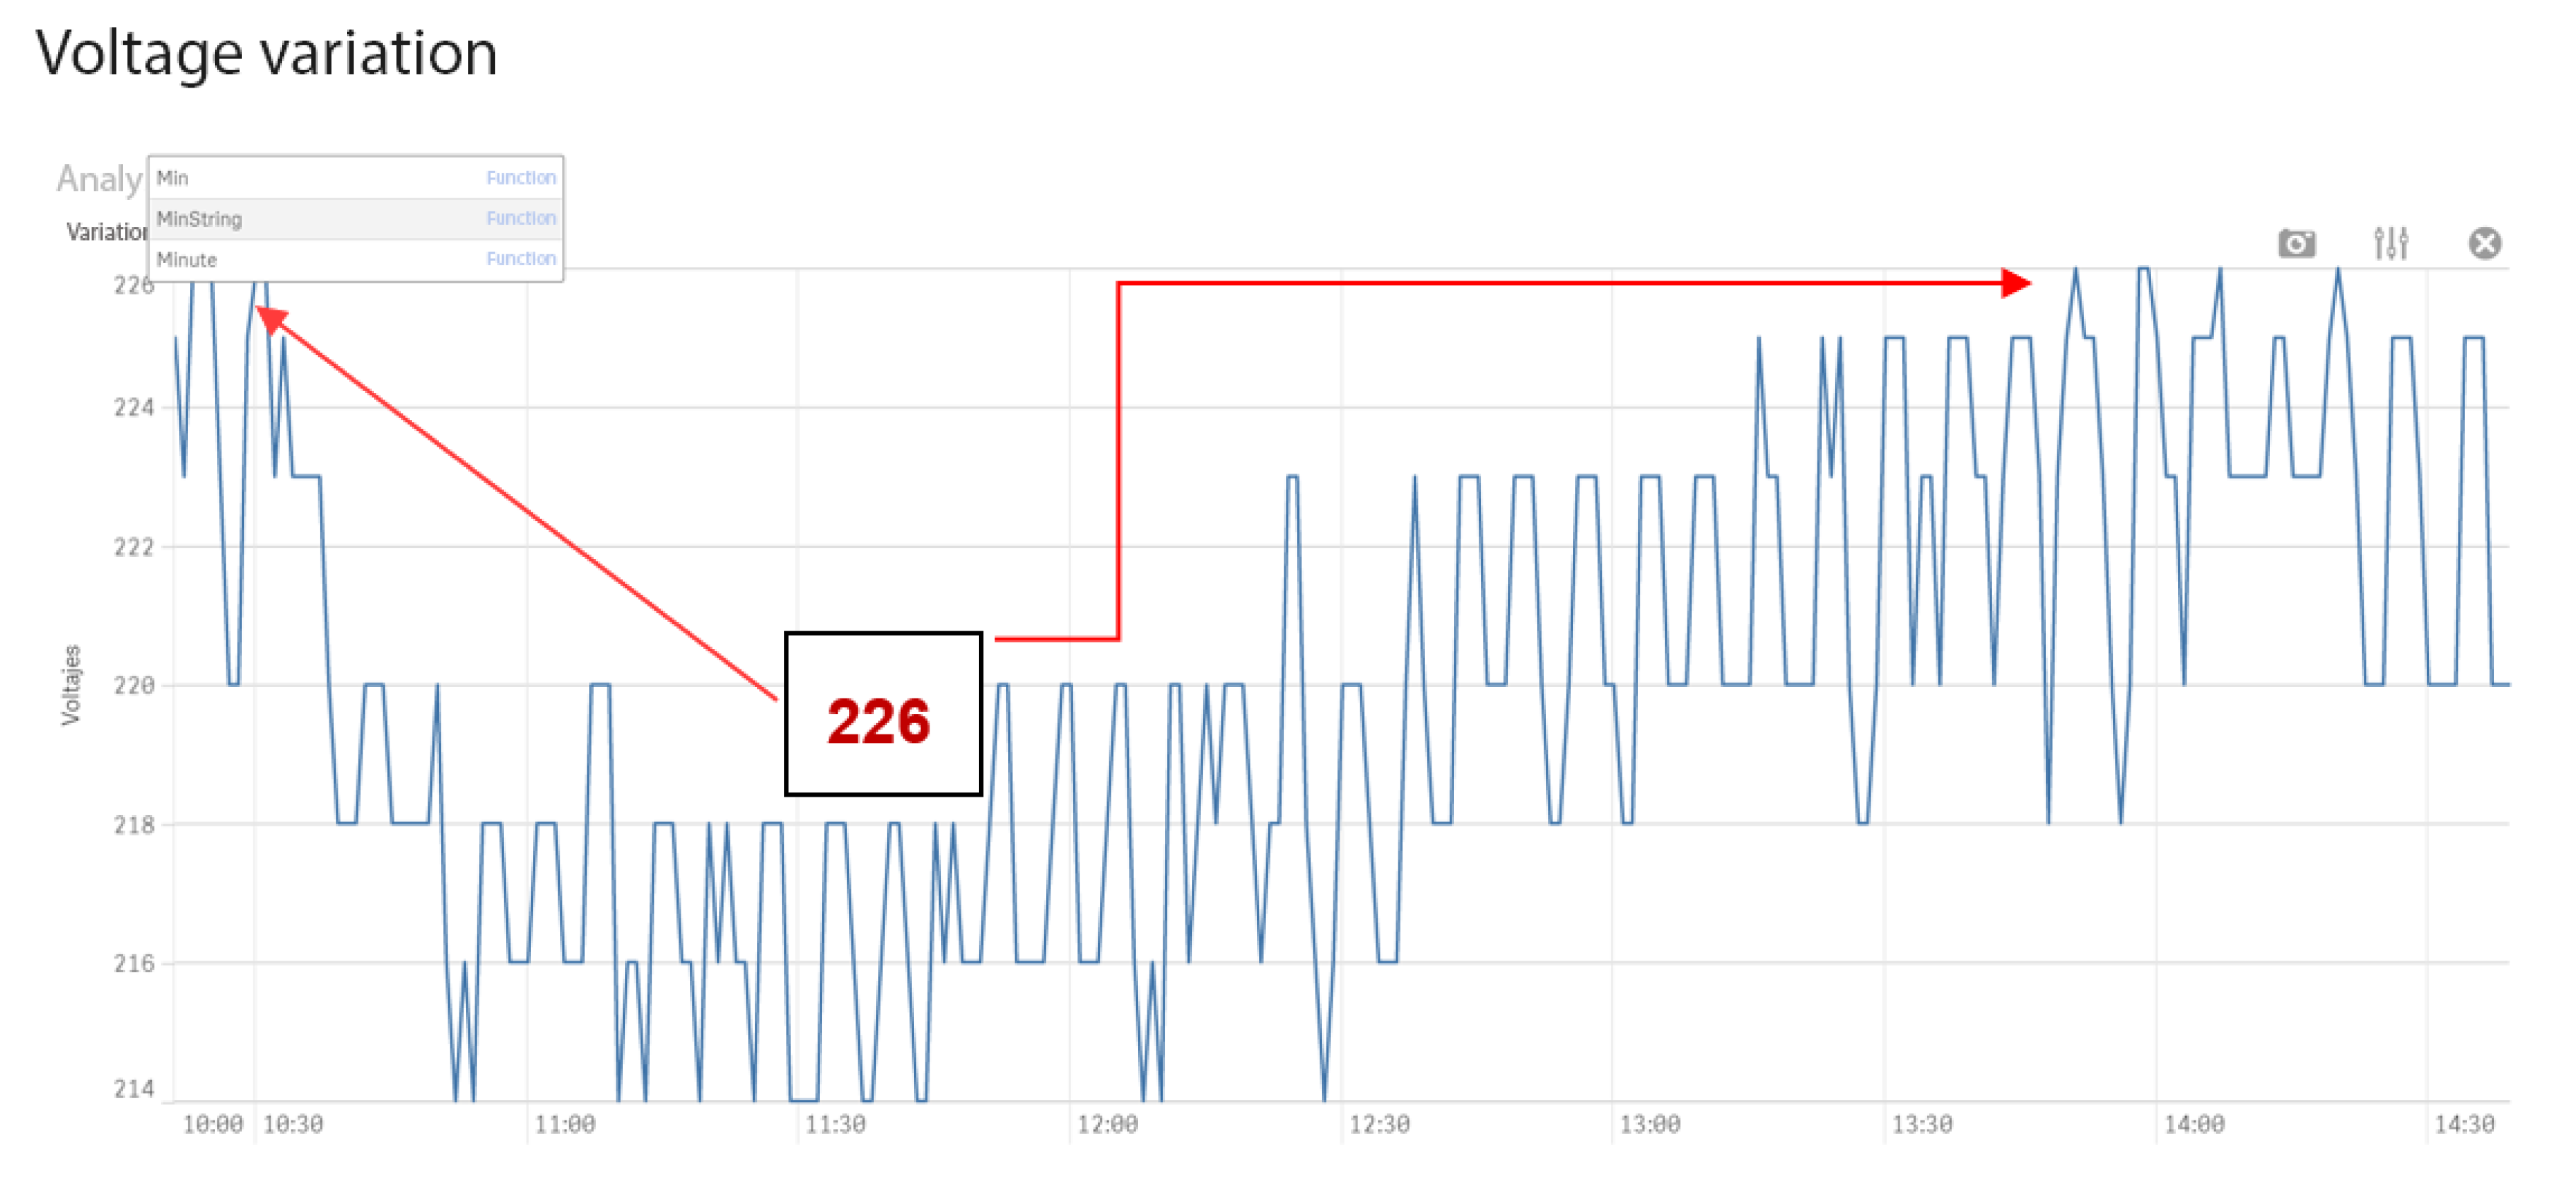
Figure 4 illustrates the monitoring and shows two high peaks during two time periods on a normal operating day, the first between 10:00 and 10:30 and the second between 13:45 and 14:30. The first period corresponded to the peak when additional equipment was connected to the power source in the data center. This type of anomaly explained the higher electrical traffic and increase in voltage. It is important to monitor the equipment during peak hours to verify the minimum and maximum voltages, thus validating that the parameters oscillate in the range determined by the manufacturer.
In the second period from 13:45 to 14:30, it was validated that the peak voltage was due to the machines inside the data center starting up, because as soon as the classrooms went into operation the voltage stabilized within minutes.
6. Discussion
This work integrated technologies that help improve the processes of an environment to the point of turning them into intelligent environments. Under this concept, the integration carried out in this work contributes to the management of campus resources. Its method is to be conceived in a generic way and through utilizing technologies that are mostly open-source, it is able to be replicated on any campus regardless of the infrastructure.
Given the rise of big data and technologies such as cloud computing, the creation of efficient data centers committed to the environment and energy-saving has become a first-order need. This is not only the case environmentally but also economically, as a smart campus invests a large amount of its budget in energy jacks and equipment maintenance.
The big data framework uses Hadoop, which provides the most reliable storage layer on the market using HDFS. It has a batch-processing engine, such as MapReduce, and a yet another resource negotiator (YARN) resource management layer that makes it a scalable and reliable tool. In addition, Hadoop is an open-source tool and can be modified according to the requirements of the smart campus. By default, Hadoop stores three replicas of each block in the cluster and can be changed as needed. Then, if any node falls, the data from that node can be easily retrieved from other nodes. Nodes or task failures are automatically recovered by the framework, which makes it extremely fault-tolerant. Hadoop is easy to use, without consuming excessive human resources in the administration of distributed computing; the framework takes care of everything. Hadoop runs on machines with basic hardware without problems, and, for this reason, it is not necessary to invest in specialized machines with advanced hardware. Hadoop also reduces investment by allowing for the ability to add more nodes on the fly and expand the framework according to the needs of the campus. Therefore, if the needs and resource requirements increase, the framework increases the nodes without any downtime and without requiring prior planning.
In energy consumption, the big data framework manages to introduce predictive maintenance in the infrastructure that are able to save costs and improve the quality of the service-avoiding stopping for events related to energy. Through the effective analysis of the data, it is able to calculate the amount of energy that is really required for the optimal operation of the data center. The next step will be to use the right technology in order to obtain the most efficient consumption.
7. Conclusions
Several related studies were reviewed for this research, with some dealing with similar issues but with very few proposing a framework that is applied to a smart campus. Therefore, this research contributes to scientific research that validates data analysis using big data in applying it to larger environments such as smart cities.
The integration of technologies such as IoT, cloud computing, and big data provides the basis of emerging technologies that helps to generate new management methods or improve existing ones. The IoT within the smart campus replaces the human in many activities, such as to monitor or maintain a certain environment. Cloud computing improves the availability of data and provides greater speed when it is exploited. In a smart campus, this technology is integrated into traditional storage models where computer systems store the data generated in relational databases. This integration allows managing a large amount of data, and, if an analysis is dependent on the information of several systems, the availability to use them is accessible.
The data analysis awarded to the Hadoop framework guaranteed the results obtained in the energy consumption analysis of the campus data center. The results were validated with the parameters recommended by the manufacturer, validating the veracity of the analysis. This helps to make decisions about the use of the equipment, determine the life of the UPS batteries, and improve the management of energy consumption.
Achieving the effectiveness of the results depends on the architecture of the Hadoop framework, which stands out from others such as Spark, which is another architecture currently used by large companies. The comparison between these two frameworks focused on the details and characteristics of each architecture and in which environments they obtain the best results.
The applied framework guarantees high availability and scalability, as during its application to energy monitoring, several types of equipment were added and removed respectively to check the measurements. These factors allow the framework to adjust to the needs of any environment and of agile responses to the needs that each of these presents. In addition, the versatility of the framework allows for the addressing of needs such as learning management, administrative processes, mobility, security, and others.
As a future study, the authors are integrating artificial intelligence (AI) with the smart campus. The integration of AI with technologies used in this work (IoT, cloud computing, and big data) is imminent. AI allows us to take the results of the data analysis and learn from them to personalize the learning. In addition, it will allow for the execution of autonomous processes that, up until now, have been done by people, therein combining production and efficiency. AI can resolve issues such as energy efficiency, climate alerts, internal mobilization, and waste management, which will be treated properly and efficiently. In departments such as marketing and admissions, a Chabot will be implemented with the ability to learn from natural language, which leads it to give information on the smart campus in the same way as a person does.

 ,
, 


