Article

Land Use Change Trends and Their Driving Forces in the Kilombero Valley Floodplain, Southeastern Tanzania

1
School of Environment, Northeast Normal University, Changchun 130024, China
2
Department of Environmental Studies, The Open University of Tanzania, P.O Box 23409 Dar es salaam, Tanzania
3
State Environmental Protection Key Laboratory of Wetland Ecology and Vegetation Restoration, Northeast Normal University, Changchun 130024, China
4
Institute of Resources Assessment, University of Dar es salaam, P.O Box 35097 Dar es salaam, Tanzania
*
Author to whom correspondence should be addressed.
Sustainability 2019, 11(2), 505; https://doi.org/10.3390/su11020505
Submission received: 21 November 2018 / Revised: 5 January 2019 / Accepted: 15 January 2019 / Published: 18 January 2019
(This article belongs to the Section Environmental Sustainability and Applications)

Abstract

:
Land use change (LUC) driven by human activities and natural factors has resulted in the global loss of native biodiversity and the alteration of ecological processes and services across different ecosystems. It is thus necessary to analyze the trends and driving factors that influence land use changes. In this study, moderate resolution Landsat images were freely downloaded from the United States Geological Survey (USGS) archives, analyzed using the random forest (RF) algorithm and mapped in ArcGIS 10.2 software to examine the LUC trends from 1990 to 2016 in the Kilombero valley floodplain (KVFP), Tanzania. Participatory rural appraisals (PRA) and household questionnaire surveys were used to assess the potential drivers of LUC. The results show that, from 1990 to 2016, the agricultural land and grassland increased by 11.3% and 13.3%, respectively, while the floodplain wetland area decreased from 4.6% in 1990 to 0.9% in 2016. Based on a questionnaire survey, the intensification of human activities was identified as the proximate driver while population growth, a growing market demand and price incentives for agricultural and forest products coupled with improved infrastructure and biophysical factors such as soil properties, climate variability and terrain characteristics were identified as the underlying drivers of LUC. However, there is interplay among these factors acting simultaneously as well as differently that influence land use changes. Based on these findings, future sustainable land management strategies should include the introduction of the alternative environmentally friendly sources of livelihood, such as beekeeping, the promotion of community participation and education on the importance of sustainable wetland management.

1. Introduction

Understanding of land use change (LUC) dynamics is crucial for sustainable land resource management in developing countries, especially in Saharan Africa where the majority of the people depend on natural resources from the landscape for their livelihoods [1]. LUC is linked with the sustainable development of a particular geographical area since it is associated with the flow of energy, landscape conditions, biotic conditions and chemical and physical characteristics. Sustainable development entails development that addresses the needs of the present generation without negatively affecting the ability of the future generation to meet their own needs [2]. It refers to environmental sustainability (ecosystem protection, environmental management, etc.), economic prosperity (economic growth, employment opportunity, etc.) and social equity (socio-cultural development, political stability and decorum, etc.), which basically implies addressing issues relating to land use changes. LUC is widely acknowledged to increase soil erosion rates, land degradation, wetland conversion and degradation, habitat degradation and the loss of biodiversity on the earth [3,4,5,6]. Land use is referred to how the land with biophysical resources (land cover) is being utilized such as agriculture, logging, residential and industrial use, and so forth [7]. Land cover refers to the actual cover (biophysical resources) on the surface of the earth. However, the term land use and land cover are used interchangeably in most studies [8]. Land use and land cover change (LULCC) are the results of changes and/or the modification in the intensity of an existing land use and cover type due to natural factors and anthropogenic activities [9]. According to the FAO [10], land use changes are associated with agricultural expansion/intensification, urbanization, deforestation and the conversion of wetlands to pasture and agricultural lands. On a global scale, anthropogenic activities such as agriculture, industry and transport underlined with various socio-economic, political and institutional factors have resulted in land use changes [11]. In Europe, for instance, it is evident that the landscape has been profoundly changed due to political and socio-economic changes that occurred in the first half of the 19th century [12]. In some parts of Africa, the expansion of agriculture influenced by rapid population growth has been recognized as a primary driver of LUC [1]. Despite the influence of anthropogenic activities on land use change, the variability in natural factors such as climate change and variability, soil conditions and terrain characteristics have also accounted for land use changes [13,14]. Therefore, the integration of natural and human factors in the explaining LUC dynamics has become the focus area for most LULCC research [15].
The processes of LULCC have directly impacted the biodiversity, biosphere–atmosphere interactions, ecosystem service provisions and the sustainable utilization of natural resources [16,17]. These impacts have influenced a range of international organizations and scholars in the world to research on the driving force of LUCC, the temporal and spatial changes of LULCC and worldwide forecast model research for LUCC [18]. As early as 1990, the America National Research Committee established the worldwide research framework of LULCC. In 1993, two major international organizations, the International Geosphere and Biosphere Programme (IGBP) and the International Human Dimensions Programme (IHDP) on Global Change, jointly initiated a program, called the Land Use/Land Cover Change (LULCC) Research Program, which addressed important global-change issues on the local, regional and global scales [19,20]. Moreover, in 2000, the Council of Europe adopted the European Landscape Convention due to accelerated land use changes in Europe that negatively impact the landscape ecosystem [21]. To achieve sustainable land use management, it is necessary to understand LUC processes that happen in the use of land resources over time and identify its major driving factors. This will contribute to the improvement of land resource use efficiency, the mitigation of negative landscape impacts associated with LUC as well as the promotion of sustainable landscape ecosystem management practices, including wetland ecosystem.
Wetlands are among the ecosystems that are endangered globally due to land use changes [22]. They account for approximately 6% of the Earth’s land surface [23]. In Tanzania, wetlands cover approximately 10% of the total land area of the country, with four sites being designated wetlands of international importance, including Malagarasi-Muyovozi, Lake Natron Basin, Kilombero valley floodplain (KVFP) and Rufiji-Mafia Kilwa [24,25]. As one of the largest tropical freshwater wetland in Africa, the KVFP provides important ecosystem services and is a critical habitat for diverse assemblages of plant and animal species [26]. Moreover, due to its abundant natural resources including fertile land, reliable water sources and extensive pastures land, the Tanzanian government has made Kilombero valley floodplain as the major focal area for agriculture development, as evidenced by the establishment of The Southern Agriculture Growth Corridor of Tanzania (SAGCOT) program, which has therefore increased the risk of environmental degradation [27,28,29,30,31]. The SAGCOT program aims to bring 350,000 ha of farmland into commercial production [31]. Other ongoing agriculture developments, such as the opening up of large scale commercial rice and sugarcane companies in this floodplain, have accelerated LUC, resulting in altered water regimes, the loss of habitat diversity and an increase in conflicts over resource use and economic opportunities [32,33,34,35].
To make informed local and national decisions on sustainable land use, enable environmental monitoring and support national reporting on global conventions and frameworks, examining the spatial and temporal processes of LUCC and its driving factors is essential [36]. LULCC research uses various mathematical models, statistical models and, recently, remote sensing, geographic information system (GIS) and geo-information map analyses to examine the alteration of regional dynamics of land use and land cover changes [37,38,39,40,41]. Macro scale studies on the dynamics of land use and land cover patterns use remote sensing, GIS, fractal and geo-information map analyses to describe the evolution of change [41].
Moreover, land use change intensity analyses have been used to determine landscape changes of an ecosystem based on the landscape change index (LCI) and its driving factors in different parts of the world [21,42,43]. However, in many cases, analyses of land use change ignore the identification of the factors that could have a significant influence on the change in an ecosystem [20]. Meanwhile, understanding the reasons that underlie land use changes is crucial in the sustainable conservation and management of an ecosystem [20,21]. In the KVFP, for instance, there are numerous studies on LUC. Ntongani et al. [44] examined land use change patterns for a period of 30 years using local knowledge. Leemhuis et al. [36] analyzed land use change effects on water resources and ecosystems in the Kilombero valley floodplain using the SWAT analysis from 1994 to 2014. Seki et al. [45] assessed land cover changes (1990, 1998, and 2011) in the Kibasira Swamp in the Kilombero valley, revealing an increase in agricultural land that affected trends of biodiversity. Kirimi et al. [46] assessed seasonal land cover changes in the Kilombero floodplain to understand how land cover reflects the impact of water balance components. Based on these studies, the driving forces behind the observed land use changes and their relationship to LUC in KVFP have rarely been analyzed.
Land use is subject to the natural environment and intervention of human activities, thus understanding the driving factors behind the LUC is crucial for the land use planning and management of key wetland ecosystems services and functions [36]. Therefore, it is necessary to analyze the land use changes as well as the driving forces behind these changes to lay the foundation for sustainable wetland management. An analysis of driving forces is based on the understanding the cause and effect relationship between the changes and their driving forces. The knowledge of the causes allows the main driving forces and categories of phenomena that cause the change to be classified [21]. For instance, land use change that is mainly agriculture expansion and intensification in wetland ecosystem is caused by population growth that has increased the demand for the land resources to ensure food supply and improving income [47,48]. Other causes of changes are conflicts and unclear land tenure coupled with a desire for higher income, which has driven the community to convert and reclaim large parts of the wetlands in most of the world [49]. Land use-related policies such as agricultural policies and forest policies have also been considered as the driving forces of land use change in wetland ecosystems [50]. Moreover, economic factors such as the incentive for crop prices have resulted in the transition from traditional to extensive cropping systems and the expansion of cultivated land into protected wetlands [25]. Thus, the main focus of our study was to undertake a spatiotemporal analysis of the land use changes and their major driving forces in KVFP.
Within this broader context, the specific objectives of the present study were: (1) to determine of the spatiotemporal LUC trends during the past 25 years in the whole KVFP; and (2) to assess the driving factors that influenced the changes and provided recommendations for future development and sustainable land use management in the KVFP, Tanzania.

2. Materials and Methods

2.1. Overview of the Study Area

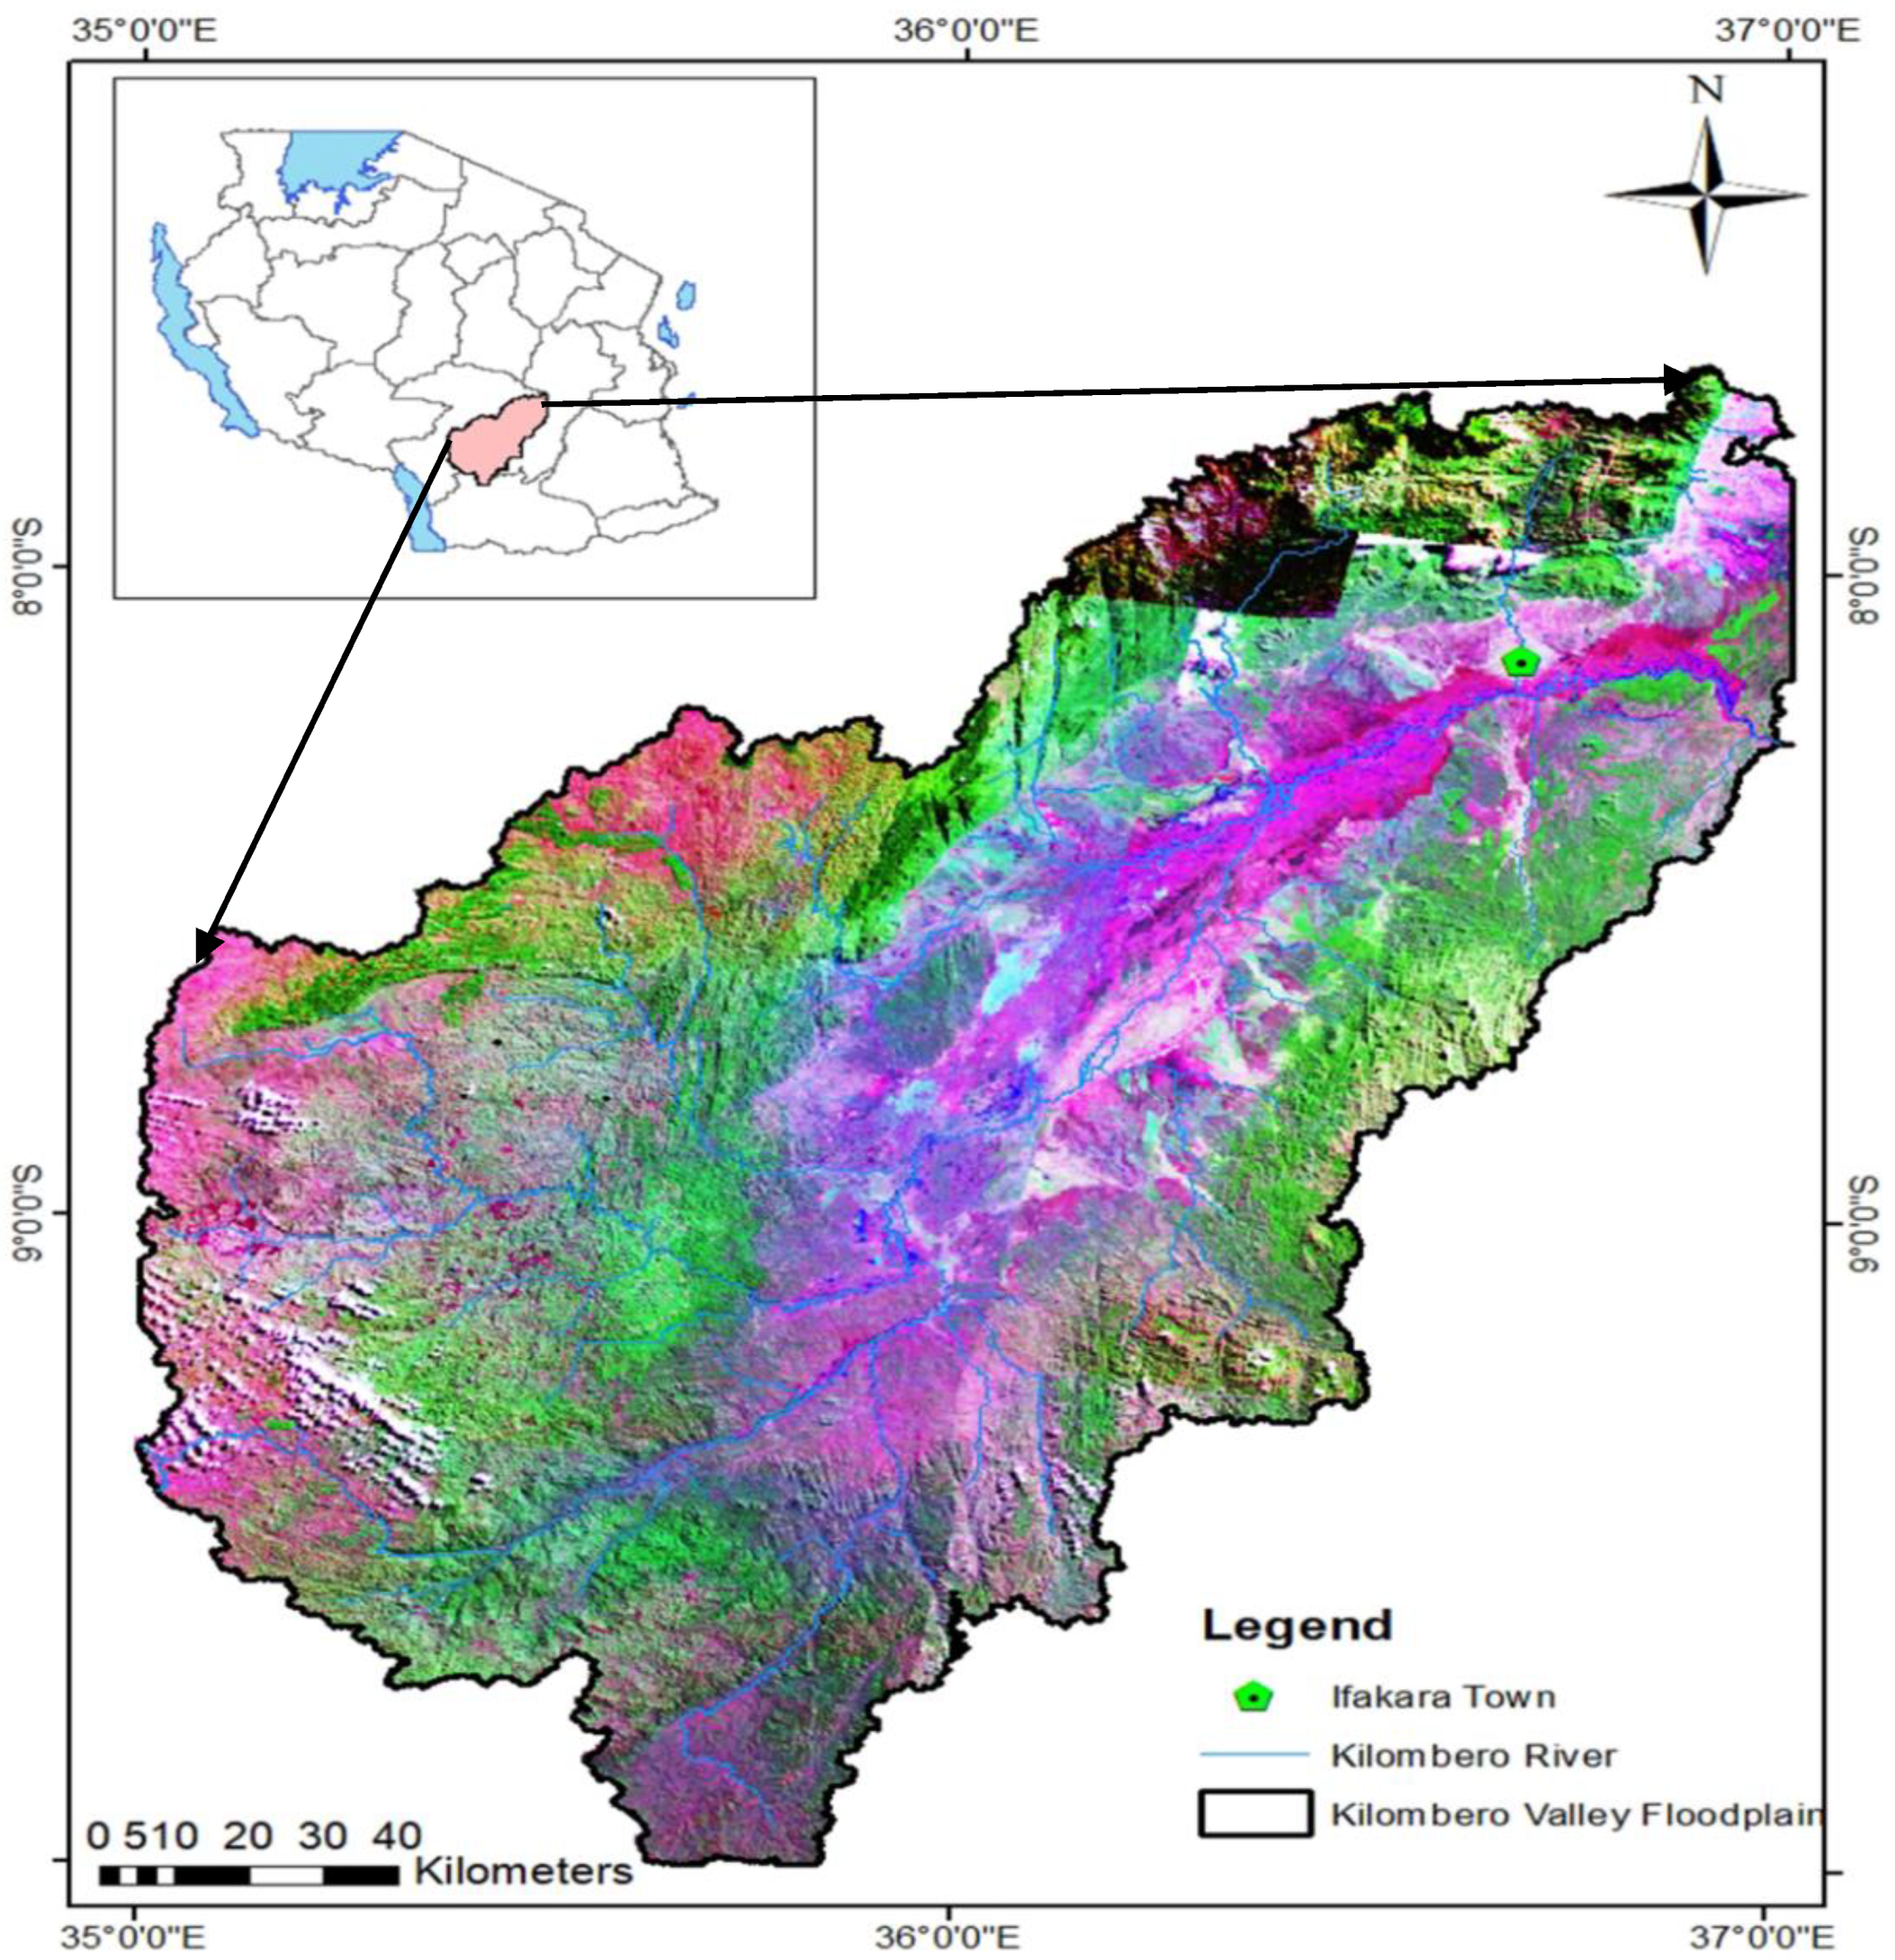
This study was conducted in Kilombero valley floodplain, which lies within latitude 10°00′ S–08°40′ S and longitude 35°10′ E–37°10′ E. The administrative unit is located in Kilombero, Malinyi and Ulanga districts of Morogoro region, Tanzania (Figure 1).
The Kilombero valley runs southwest to northeast, joining the Selous Game Reserve in the east, and covers an area of about 11,700 km2 [51]. It is divided by the Kilombero River and bounded by the Udzungwa Mountains in the Northwest and the Mahenge Mountains in the southeast. The Kilombero catchment covers an area of approximately 40,000 km2 and is one of the largest river catchments in Tanzania [52]. The KVFP was recognized and designated as a Ramsar site in 2002 by the International Union for Conservation of Nature (IUCN) due to its global importance [31]. The vegetation habitats in the KVFP form a gradient from high altitude to the Kilombero River starting with evergreen forest, Miombo woodlands characterized by species of Brachystegia and Julbernardia, teak plantation, grasslands, riverine forest, swampy areas and cropland [33]. Soils of the Kilombero valley floodplain are largely heavy black cotton (mbuga) or montmorillonite soils that hold water over relatively long periods with isolated patches of lighter sandy soils. The KVFP receives approximately 1200–1400 mm of rainfall annually. During rainy season between December and April, the largest part (84–93%) of the valley receives 1400 mm of annual rainfall, while June–September is relatively dry, with typical monthly amounts below 10 mm, except in the Udzungwa Mountains [53].
According to the 2012 national human population census report in Tanzania, the population in the KVFP was 657,246 [54], with an average population growth rate of 3.4%, which is higher than the national average of 2.8%, and the population density was 22 persons per km² in 2002 [24]. The predominant livelihood activity in the KVFP is agriculture with over 80% of the population engaged in small scale rain-fed and subsistence farming. The major crops grown include sugarcane (Saccharum officinarum), maize (Zea mays), rice paddy (Oryza sativa), cassava (Manihot esculata), sesame and more recently cocoa and banana. The production of sugarcane is dependent on both rain-fed and irrigated agriculture [53]. Maize is the major staple food and has the highest per capita consumption rate in the local diet. This is followed by rice production, which ranks second in terms of production in the Kilombero valley floodplain [53]. Livestock keeping is another important livelihood activity practice by recent pastoralist and agro-pastoralist immigrants. Fishing is also regarded as a livelihood activity, even though it is not yet utilized to its full potential. It is carried out along Kilombero River and in small swamps located in the Kilombero valley floodplain.

2.2. General Methodological Approach

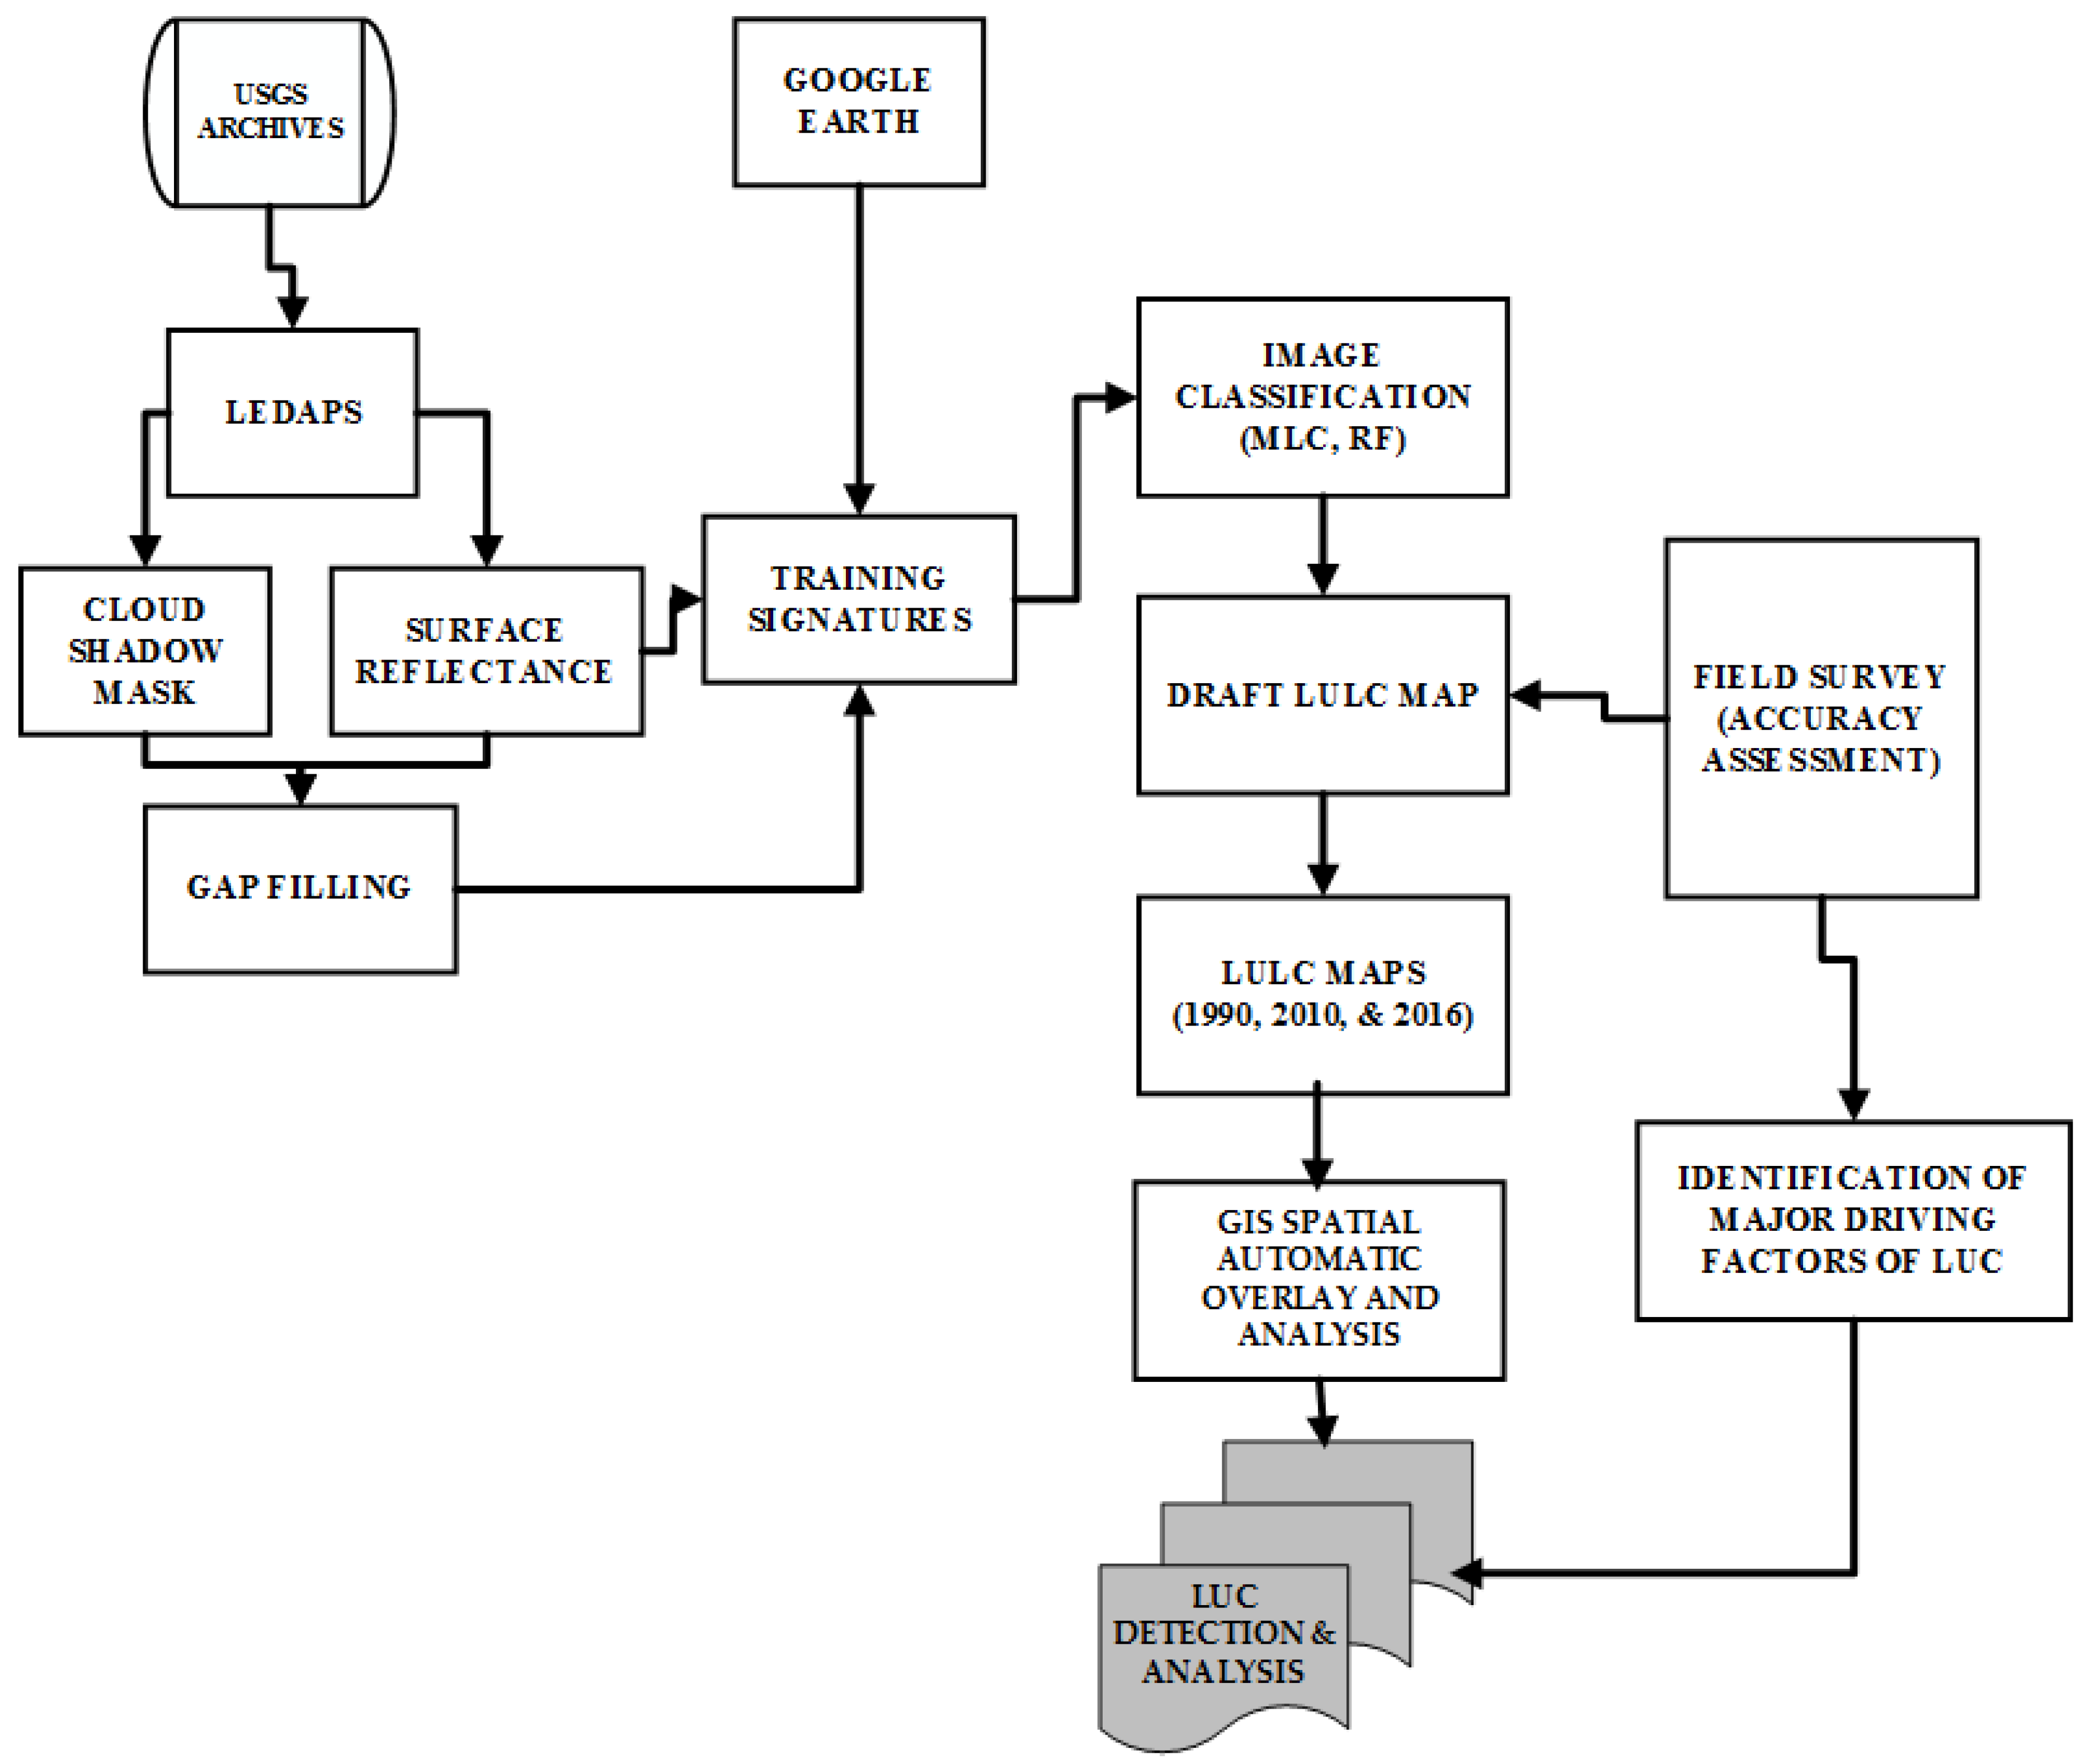
This study focused on trends of land use changes and its major driving factors in the KVFP. It involved the use of mixed methods to complement each other to generate both primary and secondary data. Different methods have their own weaknesses and strengths, and were used together to complement each other. The methods used in this study are: (i) Remote sensing technique and Geographical information system (GIS) to generate data on spatial and temporal changes in land use/land cover. This study employed moderate resolution Landsat images from the United States Geological Surveys (USGS) and Earth Explorer websites (http://glovis.usgs.gov/) to analyze land use change for the past 25 years. The analysis was performed using the Landsat-5 Thematic Mapper (TM) from 1990 and 2010 and the Landsat-8, Operational Land Imager (OLI) from 2016 using random forest (RF) algorithm for classification and ArcGIS 10.2 software for mapping. The end result provided the spatiotemporal patterns of LUC in the study area. Figure 2 shows the land use change (LUC) mapping methodology flow chart employed in this study as modified from [46]. (ii) Socioeconomic survey methods, namely review of relevant literature from both published and unpublished sources to generate secondary data. Besides secondary data collection, household questionnaire survey and participatory methods such as focus group discussion, key informant interviews and participatory field observation were used to generate primary data on the drivers of land use changes in the study area. The data collected through household questionnaire survey were descriptively analyzed using SPSS version 22.

Image Acquisition and Pre-Processing

Three Landsat images were used in this study as follows: Landsat 5 Thematic Mapper (TM) images captured on 20 June 1990 and 17 June 2010 and Landsat 8 Operational Land Imager (OLI) images captured on 20 July 2016. All information about the data sources is shown in Table 1.
The freely available images were downloaded from the United States Geological Surveys (USGS) and Earth Explorer websites (http://glovis.usgs.gov/) for the LUC classification in this study. The images used were from Landsat paths 166 and 168 and rows 65 and 66. It has been noted that time analyses of land use change require a proper selection and preparation to ensure the compatibility of the Landsat images. In this study, the images were selected from the same season (July–September) and with cloud cover not exceeding 10%. The images were obtained from different sensors with similar spectral resolution, i.e., 30 m. However, before processing and analyzing of these remotely sensed images, pre-processing methods were used on the imagery to enhance the quality of the image by reducing or eliminating various radiometric and geometric errors caused by internal and external conditions [55]. The study therefore adopted the Landsat Ecosystem Disturbance Adaptive Processing System (LEDAPS), whereby Landsat images were processed to surface reflectance using an atmospheric correction algorithm and uncertainty analyses. Cloud masking was also performed using the pixel quality file appended to each dataset as generated based on the Fmask algorithm [56,57]. This was followed by the delineation of the catchment area, which was performed based on the 90-m resolution SRTM Digital Elevation Model (DEM) and stream network files downloaded from the Earth Explorer websites, and the spatial analyst tools in hydrology toolbox of the Arc GIS 10.2 software were used for delineation.

2.3. Methods

2.3.1. LUC Classification Methods

Researchers have proposed and experimented with a range of LUC classification methods in recent years [58,59]. In this study, a supervised classification method based on the random forest (RF) algorithm was employed for performing the supervised classification and generating the land use map for each Landsat scene. A supervised classification is the type of classification whereby the user collects samples of the land cover classes (training data) for different land cover classes and the image classification software determines each class by what it resembles most in the training signatures to perform the classification. The RF algorithm is a supervised ensemble classifier developed by Breiman [60] that operates by constructing a multitude of decision trees at training time and outputting the class that is the mode of the classes (classification) or mean prediction (regression) of the individual trees. According to Ned [61], the RF algorithm has several advantages compared to other image classification methods. It is non-parametric, easy to parameterize, not sensitive to over-fitting, good at dealing with outliers in training data, and it is able to calculate useful information about errors, variable importance, and data outliers.
In this study, 177 training polygon samples for forest, 168 for bushland, 90 for grassland, 89 for agriculture, 67 for urban area, 60 for bare soil, 55 for water and 57 for wetland were randomly chosen for each Landsat scene separately using layer stacked bi-temporal images (for 1990, 2010 and 2016). The stacked images were then classified using the RF algorithm and the land use map for each Landsat scene was generated. The stacking of bi-temporal images increases the efficiency at which spectral information can be extracted because it eliminates the need for two separate classifications, and improves accuracy by eliminating the misinterpretation of classes between dates. Moreover, this study used a classification scheme that closely followed the approach described in the IPCC’s Good Practice Guidance for LUC [62], which was adopted by the Tanzania Land Use Planning Commission. The land use types were categorized into the eight classes, i.e., forest, bushland, grassland, agriculture, urban area, bare soil, water, and wetland (Table 2).

2.3.2. Post-Classification Processing

Post-classification tends to produce accurate change detection as the errors present in the classified map products are multiplied when the maps are compared [63]. Post-classification processing included recoding, majority filtering, clumping, elimination and mosaicking. The classified images were recorded into the eight classes: forest, bushland, grassland, agriculture, urban area, bare soil, water, and wetland. Then, a 3 × 3 majority filter was used on the recoded image to reduce the salt and paper effect. Lastly, the classes were filtered to a minimum mapping unit of approximately 0.5 ha to conform to the forest definition, which is a minimum size of 0.5 ha. With this forest definition, most of the woodlands were categorized as forests.

2.3.3. Accuracy Assessment

Land use maps derived from image classification usually contain some errors. Therefore, it is very important to assess the accuracy of the obtained classification results [64]. Error/confusion matrix is a common method used for measuring the accuracy of the classified images. This matrix compares information obtained by reference points to that provided by the classified image in certain sample areas. The reference points of 1990 and 2010 were obtained from a topographic map of 1990 and a visual interpretation of the raw Landsat TM 1990 and 2010 images along with the personal knowledge of the study area and high-resolution images, such as Google Earth. For the 2016 image, random reference points in different land use and cover types were recorded from the field survey conducted using a Global Position System (GPS) map 60CSx at approximately 100 × 100 m2 area of regular of LULC types in the study area. In total, 160 reference points were used to generate an error/confusion matrix whereby 20 reference points were considered for the land use and cover types that have large area coverage while land use and cover type with low area coverage such as urban area, 13 reference points were considered. The user’s accuracy, producer’s accuracy, overall accuracy and Cohen’s kappa coefficient were then calculated from the produced confusion matrix produced. This study adopted Equation (1) from previous study [64] for the calculation of Kappa coefficient.
K = N i = 1 r X i i i = 1 r X i + X + i N 2 i = 1 r X i + X + i
where K is the Kappa coefficient, r is the number of rows and columns in the error matrix, N is the total number of observations (pixels), Xii is the observation in row i and column j, Xi+ is the marginal total of row i, and X+i is the marginal total of column j.
The results of the accuracy indicated good overall classification results with an overall accuracy of 86.7% and a Kappa coefficient of 0.82, satisfying the accuracy test requirements and validating the classification results.

2.3.4. Land Use Change Detection and Analysis

Land use change detection is one of the most important applications of remote sensing techniques due to its capability of repetitive acquisition of imagery information with consistent image quality, at short intervals and on a global scale. This study employed GIS spatial automatic overlay and analysis using Arc GIS 10.2 software to periodically map the LUC. Then, the creation of the land use matrix model that described the changes in land use types between the two study periods of 1990 and 2010, and 2010 and 2016 was performed. The study used the spatial analysis tool of Arc GIS 10.2 software and the zonal tabulate area function to generate a matrix. The generated Markov chain transition matrix of the study area’s land use types was used to analyze the trends of land use change. Equation (2) for the land use Markov chain transition matrix model was based on [65].
S i j = [ S 11 S 1 n S m 1 S m n ]
In the transition matrix, S is the unit area, i and j are the land use type before and after the transition period, i is equal to 1, 2, 3, …, m and j is equal to 1, 2, 3, …, n. Based on the land use matrix model, the study generated the decreased and increased amount of each land use type and the amount of each type’s change for 25 years in the Kilombero valley floodplain. Additionally, the degree of the land use dynamics of various land use types was quantitatively analyzed. The degree of the land use dynamics is described as the quantitative change in certain land use types within a certain time range in a certain study area [66]. The dynamic degree of land use change is expressed as:
K = U 2 U 1 U 1 × 1 T × 100 %
where K indicates the degree of the land use dynamics; U1 and U2 are the area of a land use type at the beginning and the end of a period, respectively; and T is the time interval (years). This equation was used to analyze and compare the rates of change among the different land use types in the study area.

2.3.5. Analysis of the Major Driving Factors to LUC

Land use change (LUC) is a central factor related to changes in the Earth’s climate and the environment in a broad sense. Understanding the relationship between LUC and its driving forces is one of the vital parts of current environmental research and is achieved by analyzing the driving forces through applying models, mathematical/statistical methods and conceptual framework approaches [50].
In this study, socioeconomic survey methods, namely household questionnaire surveys, and participatory rural appraisal (PRA) methods, such as key informant interview, focus group discussions and participatory field observation, were used to obtain information on historical land use change, socioeconomic status and the driving factors that have led to land use changes in the study area. The study used purposive sampling for a questionnaire survey based on the accessibility to the household, whereby a total sample size of 60 households, i.e., 10% of the total households, were selected in the six studied villages. The village register book was used to identify the number of households in each village. The household questionnaire was prepared and pretested followed by modification to make some of the unclear questions more focused and clearer before being administered to the selected household. Six focus group discussions with 5 men and 5 women were conducted, one from each village. The selection of participant in focus group discussion was based on sex, participant knowledge of the local natural resources available in the village and residents who had resided in the village for more than 25 years. Focus group discussions were conducted to supplement the information that was obtained from the questionnaire survey.
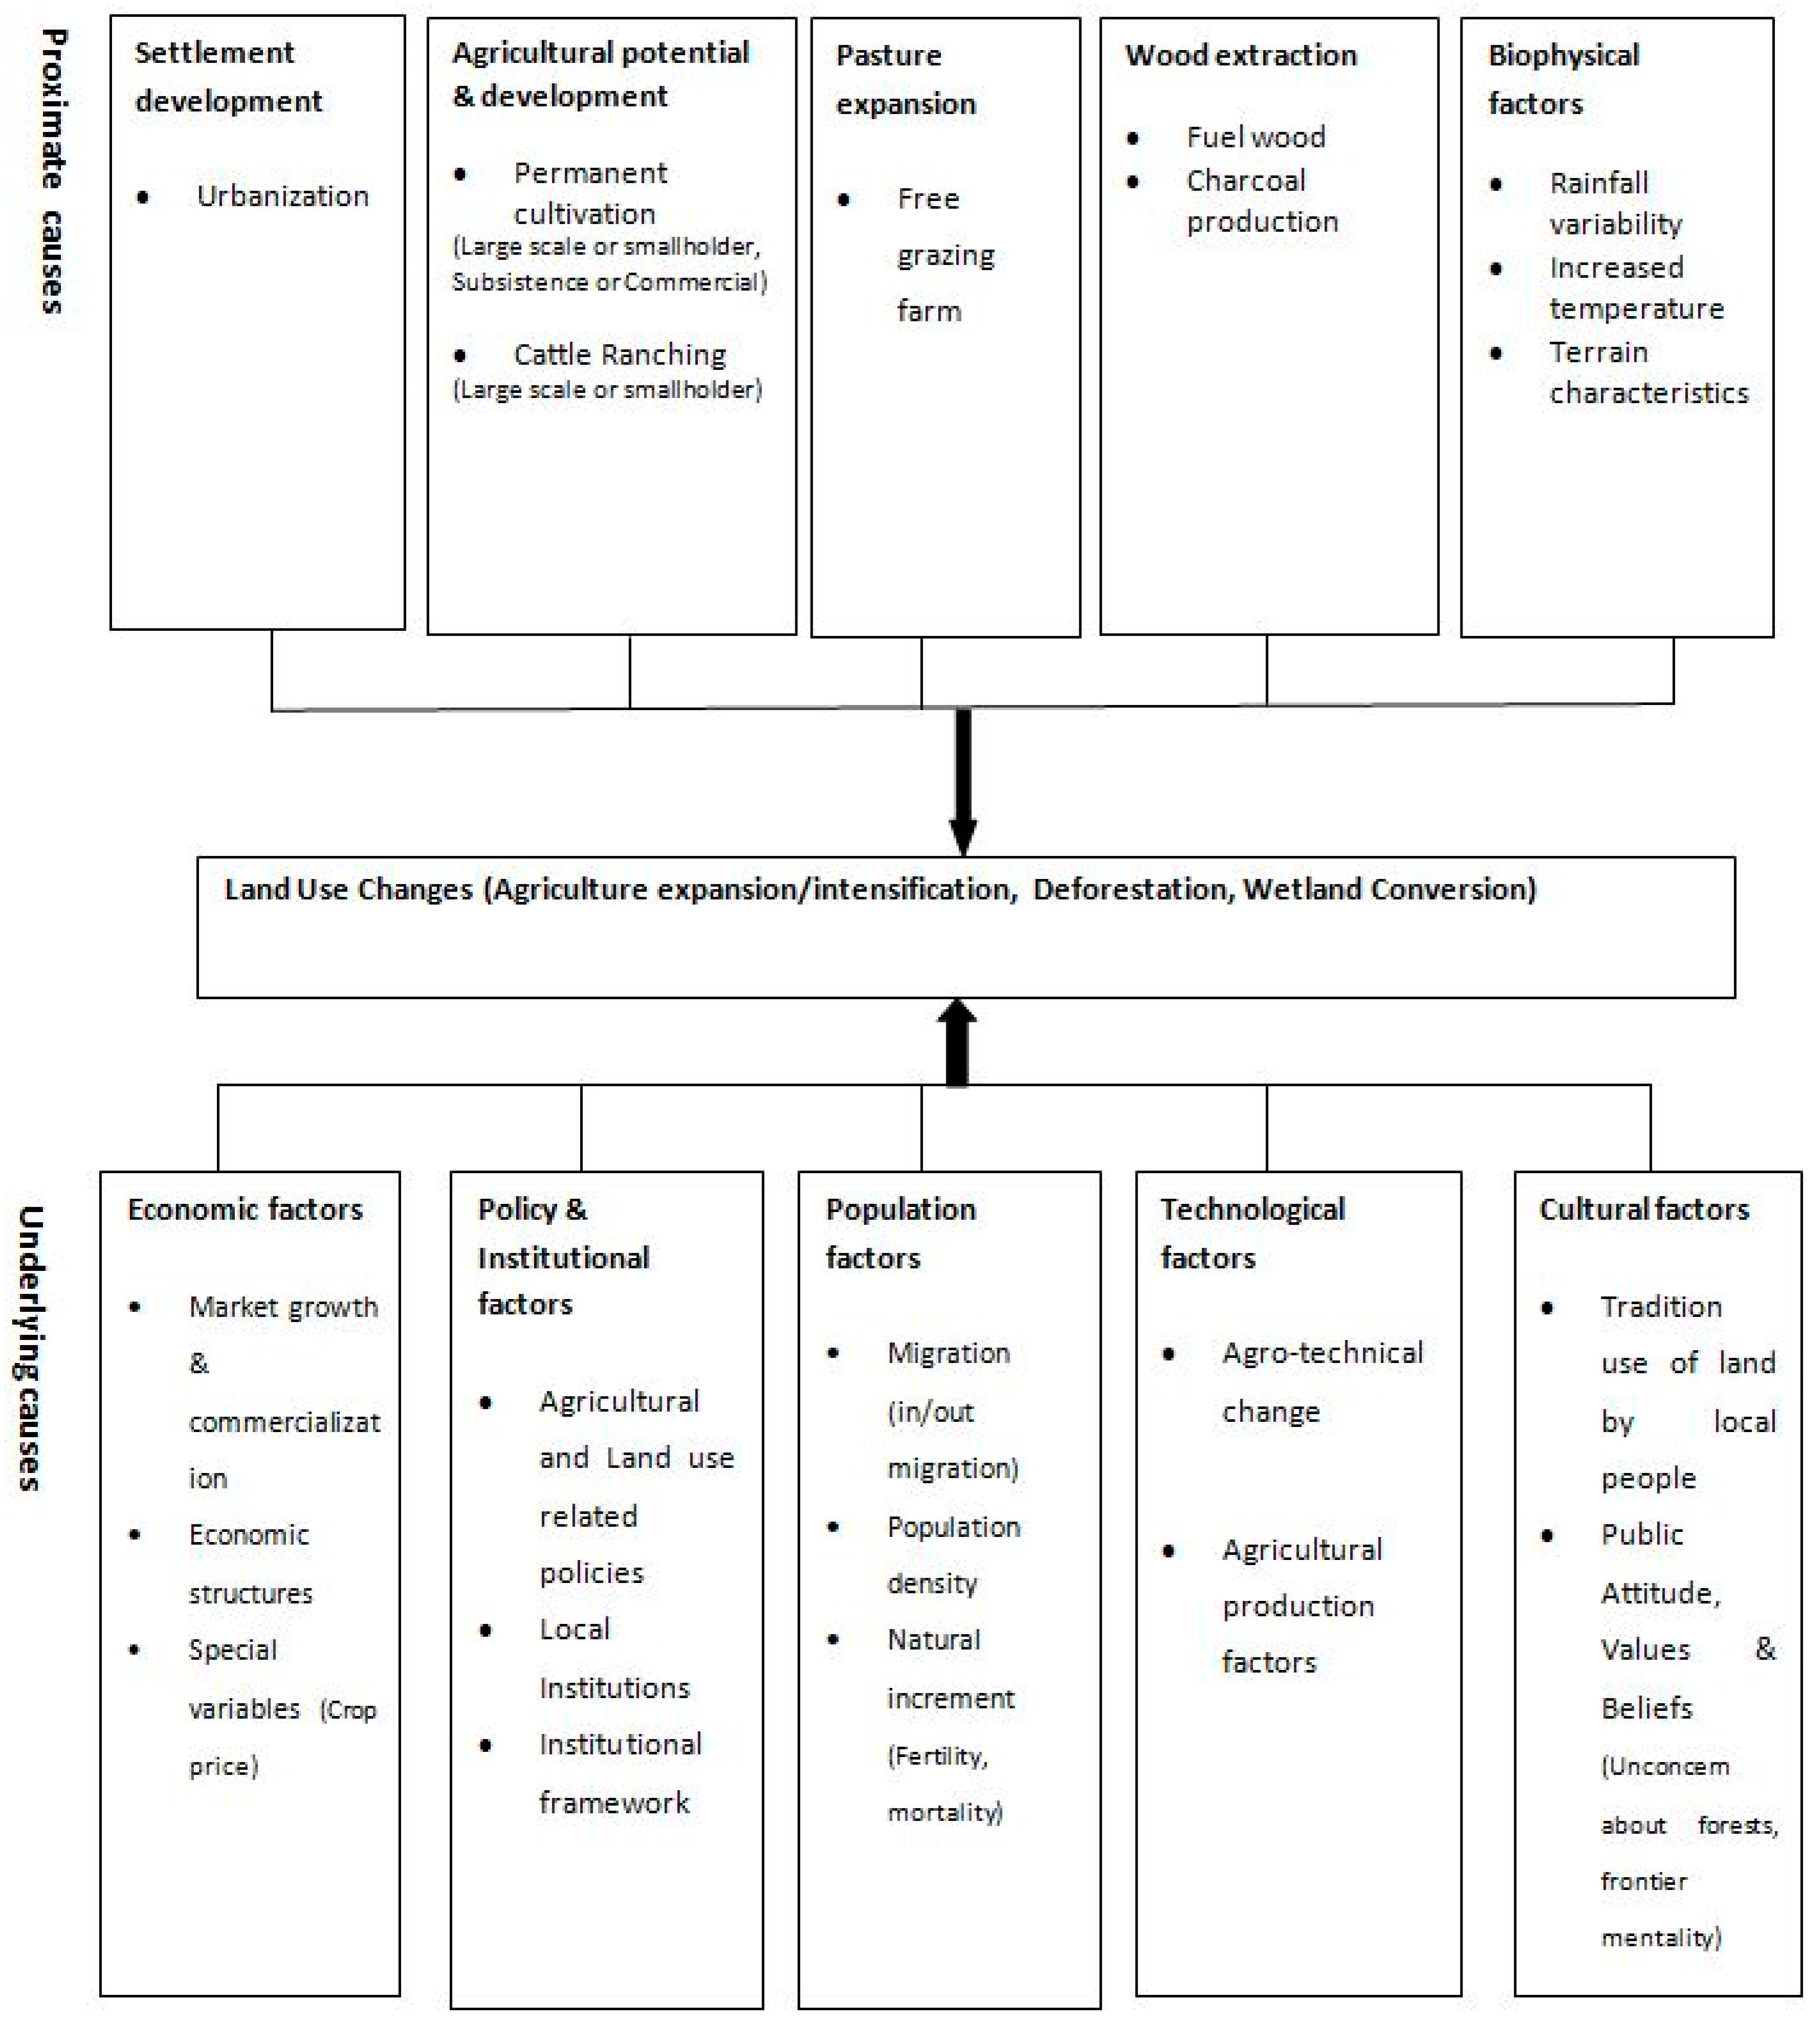
Both quantitative and qualitative data were analyzed during this study. The quantitative data obtained through the household questionnaire survey were coded and entered into the statistical software (SPSS 22) for descriptive statistical analysis. The results were summarized and presented as percentages, tables and figures. The analysis was useful for determining and quantifying the driving factors for land use changes in the study area. On the other hand, the qualitative information collected through PRAs was analyzed by using the content functional analysis and then summarized and presented in subsequent sections in the text. This analysis helped to obtain more information from informed and knowledgeable people on the historical trends in land use change, socio-economic status and the driving factors of change based on the ideal argument raised within the discussions. This study adopted and modified the theoretical framework of Geist and Lambin [9], which identified the proximate and underlying causes of tropical deforestation to elucidate the driving factors of land use change in the Kilombero valley floodplain (Figure 3).
During the analysis of the images, differences in the band composition between the Landsat 5 Thematic Mapper (TM) and Landsat 8 Operational Land Imager (OLI) created RGB composites that were different from one another, making it difficult to identify the land features. To minimize this limitation, we ran the images on Landsat Ecosystem Disturbance Adaptive Processing System (LEDAPS), applying the atmospheric corrections to generate a surface-reflectance product that allowed for the direct comparison of the different images. Analyses of the driving forces behind land use changes also had some limitations as they did not show a direct link of the cause–effect relation, rather were descriptive statistics that show the contribution of different drivers to land use change in the study area. This requires further research design for correlation analysis between each factor and the land use changes, which will provide a full understanding of the processes that shape the landscape.

3. Results

3.1. Spatiotemporal Variation in the Trends of Land Use Change

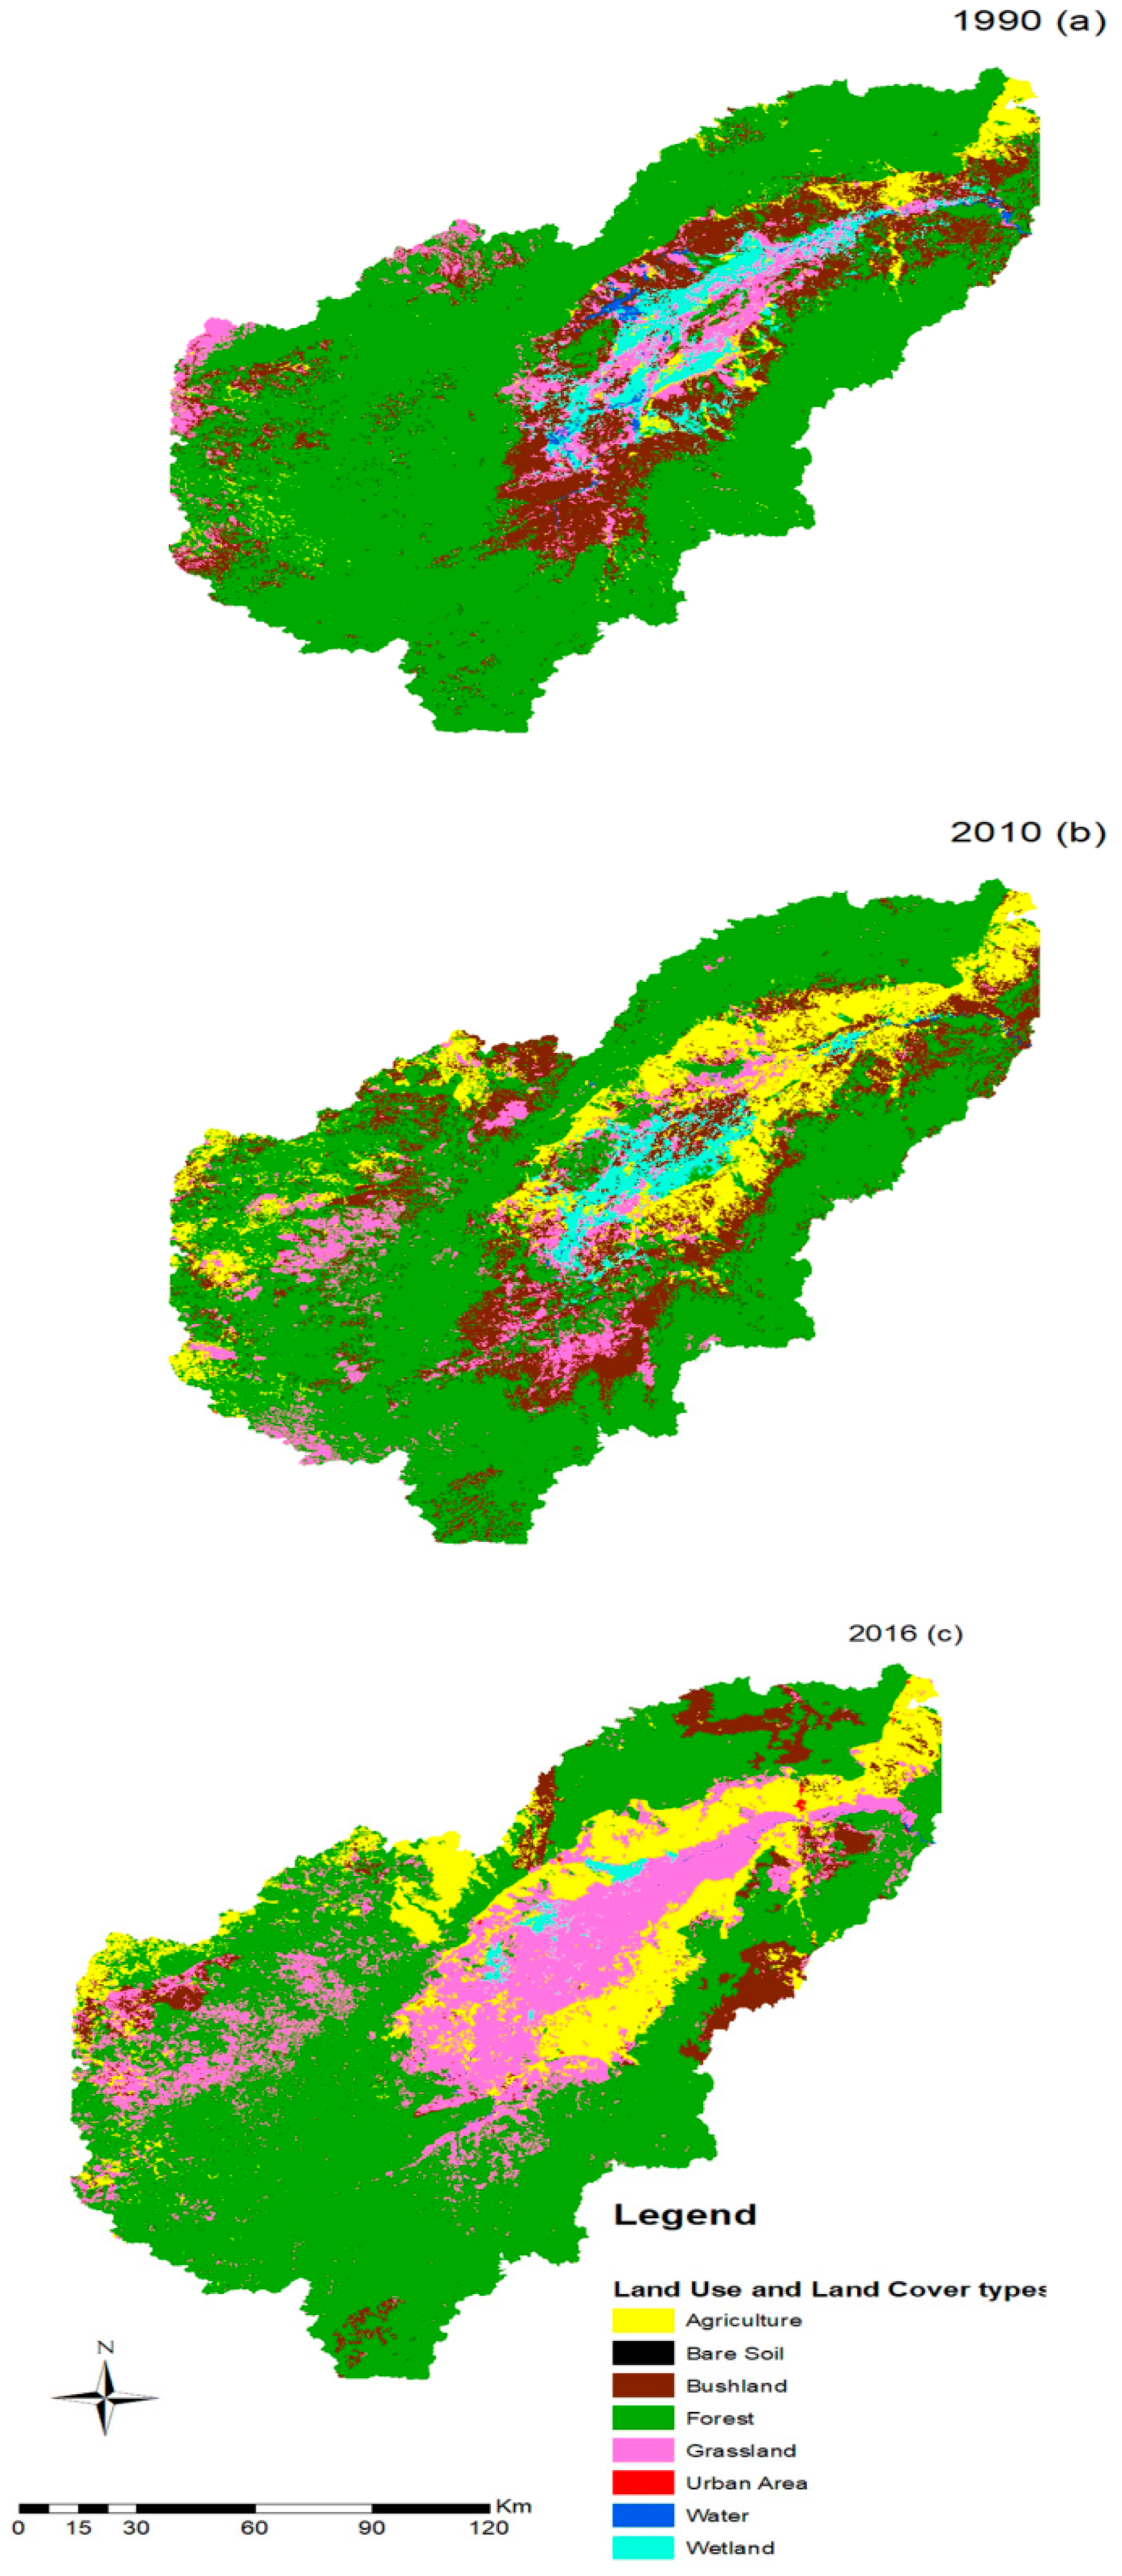
The spatial and temporal variations in land use change over the past twenty-five years in the KVFP were analyzed using the RF algorithm supervised classification method. The land-use classification maps produced for the study area in each year are presented in Figure 4, and the area statistics of each land use type based on the classified images of the study area are shown in Table 3.
Figure 4 and Table 3 show that the Kilombero valley floodplain has experienced the following land use change trends: (1) In the last 25 years, agricultural land has substantially increased by 3430 km2 (11.3%). (2) The area under forest, which is the largest part of land use class, comprising plantations, evergreen forest, open and closed Miombo woodland characterized by Brachystegia and Julbernardia species, has significantly decreased by 3037 km2 (10.3%). (3) The area of bushland considerably decreased from 5497 km2 (18%) in 1990 to 2459.62 km2 (8.1%) in 2016, implying decreasing change of 10%, while the area of grassland substantially increased by 13.3%. (4) The wetland area decreased from 1415 km2 (4.6%) in 1990 to 261 km2 (0.9%) in 2016, while the area with water bodies, which mainly includes the Kilombero River and its tributaries, showed a decreasing trend, from 229 km2 in 1990 to 30 km2 in 2016, implying a decrease of 0.7%. (5) Urban area was also classified, although it was not a major land use and cover class because the area is comprised of low-density settlements blended with farm areas, and it increased by 0.1%. (6) Bare soil did not show a significant change (Table 3).
The statistics of the main types of land use change in the area ratio show that forest, bushland and grassland are among the dominant land cover types in the Kilombero valley floodplain covering 64.1%, 18% and 7.8% of the total land cover types, respectively, in 1990 (Table 3). From 1990 to 2010, agricultural land, grassland, bushland and urban area increased by 8.7%, 1%, 1.5% and 1%, respectively. However, during this period, the forest area decreased from 64% to 55.1%, implying a decrease of 9%. The wetland and water area also showed a decreasing trend of 1.5% and 0.6%, respectively. In particular, from 2010 to 2016, only agriculture, grassland and urban area showed an increasing trend, of 2.6%, 12.4% and 0.1%, respectively, while bushland, forest, wetland and water areas decreased by 11.4%, 1.2%, 2.3% and 0.1%, respectively (Table 3).

3.2. The Land Use Transition Matrix from 1990 to 2016

This study used the spatial analysis tool in Arc GIS 10.2 software and the zonal tabulate area command to calculate the Markov chain transition matrix of land use change in Kilombero valley floodplain. The main goal was to analyze the changing trend of land use types (Table 4 and Table 5). Over twenty-five years, there has been a drastic increase in agricultural land and grassland at the expense of other land use and cover types in the Kilombero valley floodplain.
From 1990 to 2010, agricultural land has increased by 26741 km2, of which 38.4% was from bushland and 30.3%, 21.0% and 8.76.1% were from forest, grassland and wetland, respectively. From 2010 to 2016, agricultural land increased by 789 km2, of which 42% was derived from forest and 38.4%, 13.7% and 6.1% was from bushland, grassland and wetland, respectively. These changes imply that from 1990 to 2016, the increased trend in agricultural land is due to the conversion of forest and bushland to agricultural areas.
Grassland also showed a steady increase at the expense of other land use and cover types. From 1990 to 2010, grassland increased by 290 km2, of which 53.6% and 30.0% were converted from forest and bushland, respectively. From 2010 to 2016, grassland increased by 3765 km2, of which 34% and 32.5% were from bushland and forest, respectively. In addition, grassland gained 20.6% from agricultural land because some agricultural lands are left as grass fallow by local farmers.
Moreover, forest, bushland, wetland and water areas showed decreasing trend over the last 25 years. From 1990 to 2010, forest decreased by 2752 km2, of which 56% changed to bushland and 23.2% and 18.9% were converted to grassland and agriculture, respectively. Bushland during this period showed an increased trend associated with massive deforestation during this time, as 56% of the forest was converted to bushland. From 2010 to 2016, forest decreased by 377 km2, of which 39.5% changed to grassland and 30.5% and 27.0% were converted to bushland and agricultural land, respectively, and bushland decreased by 3483 km2 with 44.7%, 34.1% and 20.5% converted to forest, grassland and agriculture, respectively. From 2010 to 2016, 1359 km2 of bushland changed into forest in 2010 while an area of 2430 km2 of forest changed back to bushland in 2016. This shows that there are alternation changes in land cover between forest and bushland observed whereby bushland is one of the main sources changing to forest as well as forest changing back to bushland. Bushland is converted to agricultural land, showing that there is a considerable amount of transition between forest area, bushland, grassland and agricultural land.
Additionally, from 1990 to 2010, wetlands decreased by 449 km2, with 27.8% changed to grassland and 23.9% to agricultural land. From 2010 to 2016, wetlands were reduced by 705 km2, with 72.6% change to grassland and 18.9% to agricultural land. In summary, the land use changes in the study area are clustered into three major categories: agricultural land and grassland expansion (from forest and bushland to agricultural land and grassland); deforestation (conversion from forest to bushland, grassland and agricultural land); and wetland conversion involving the change from wetland to agricultural land and grassland.

3.3. The Land Use Dynamics from 1990 to 2016

In 25 years, the area of agricultural land increased significantly from 1990 to 2010 and then slowed in 2016. Bare soil showed a decreasing trend, but the reduction in the area of bare soil slowed down from 2010 to 2016. The change in the bushland area slightly increased and then decreased drastically. The area of forest land slightly decreased, while the grassland area dramatically increased. The urban area showed a rapid increase. Wetland and water areas decreased gradually (Table 6).

3.4. Drivers of Land Use Change in the KVFP

3.4.1. Proximate Driver of Land Use Change in the KVFP

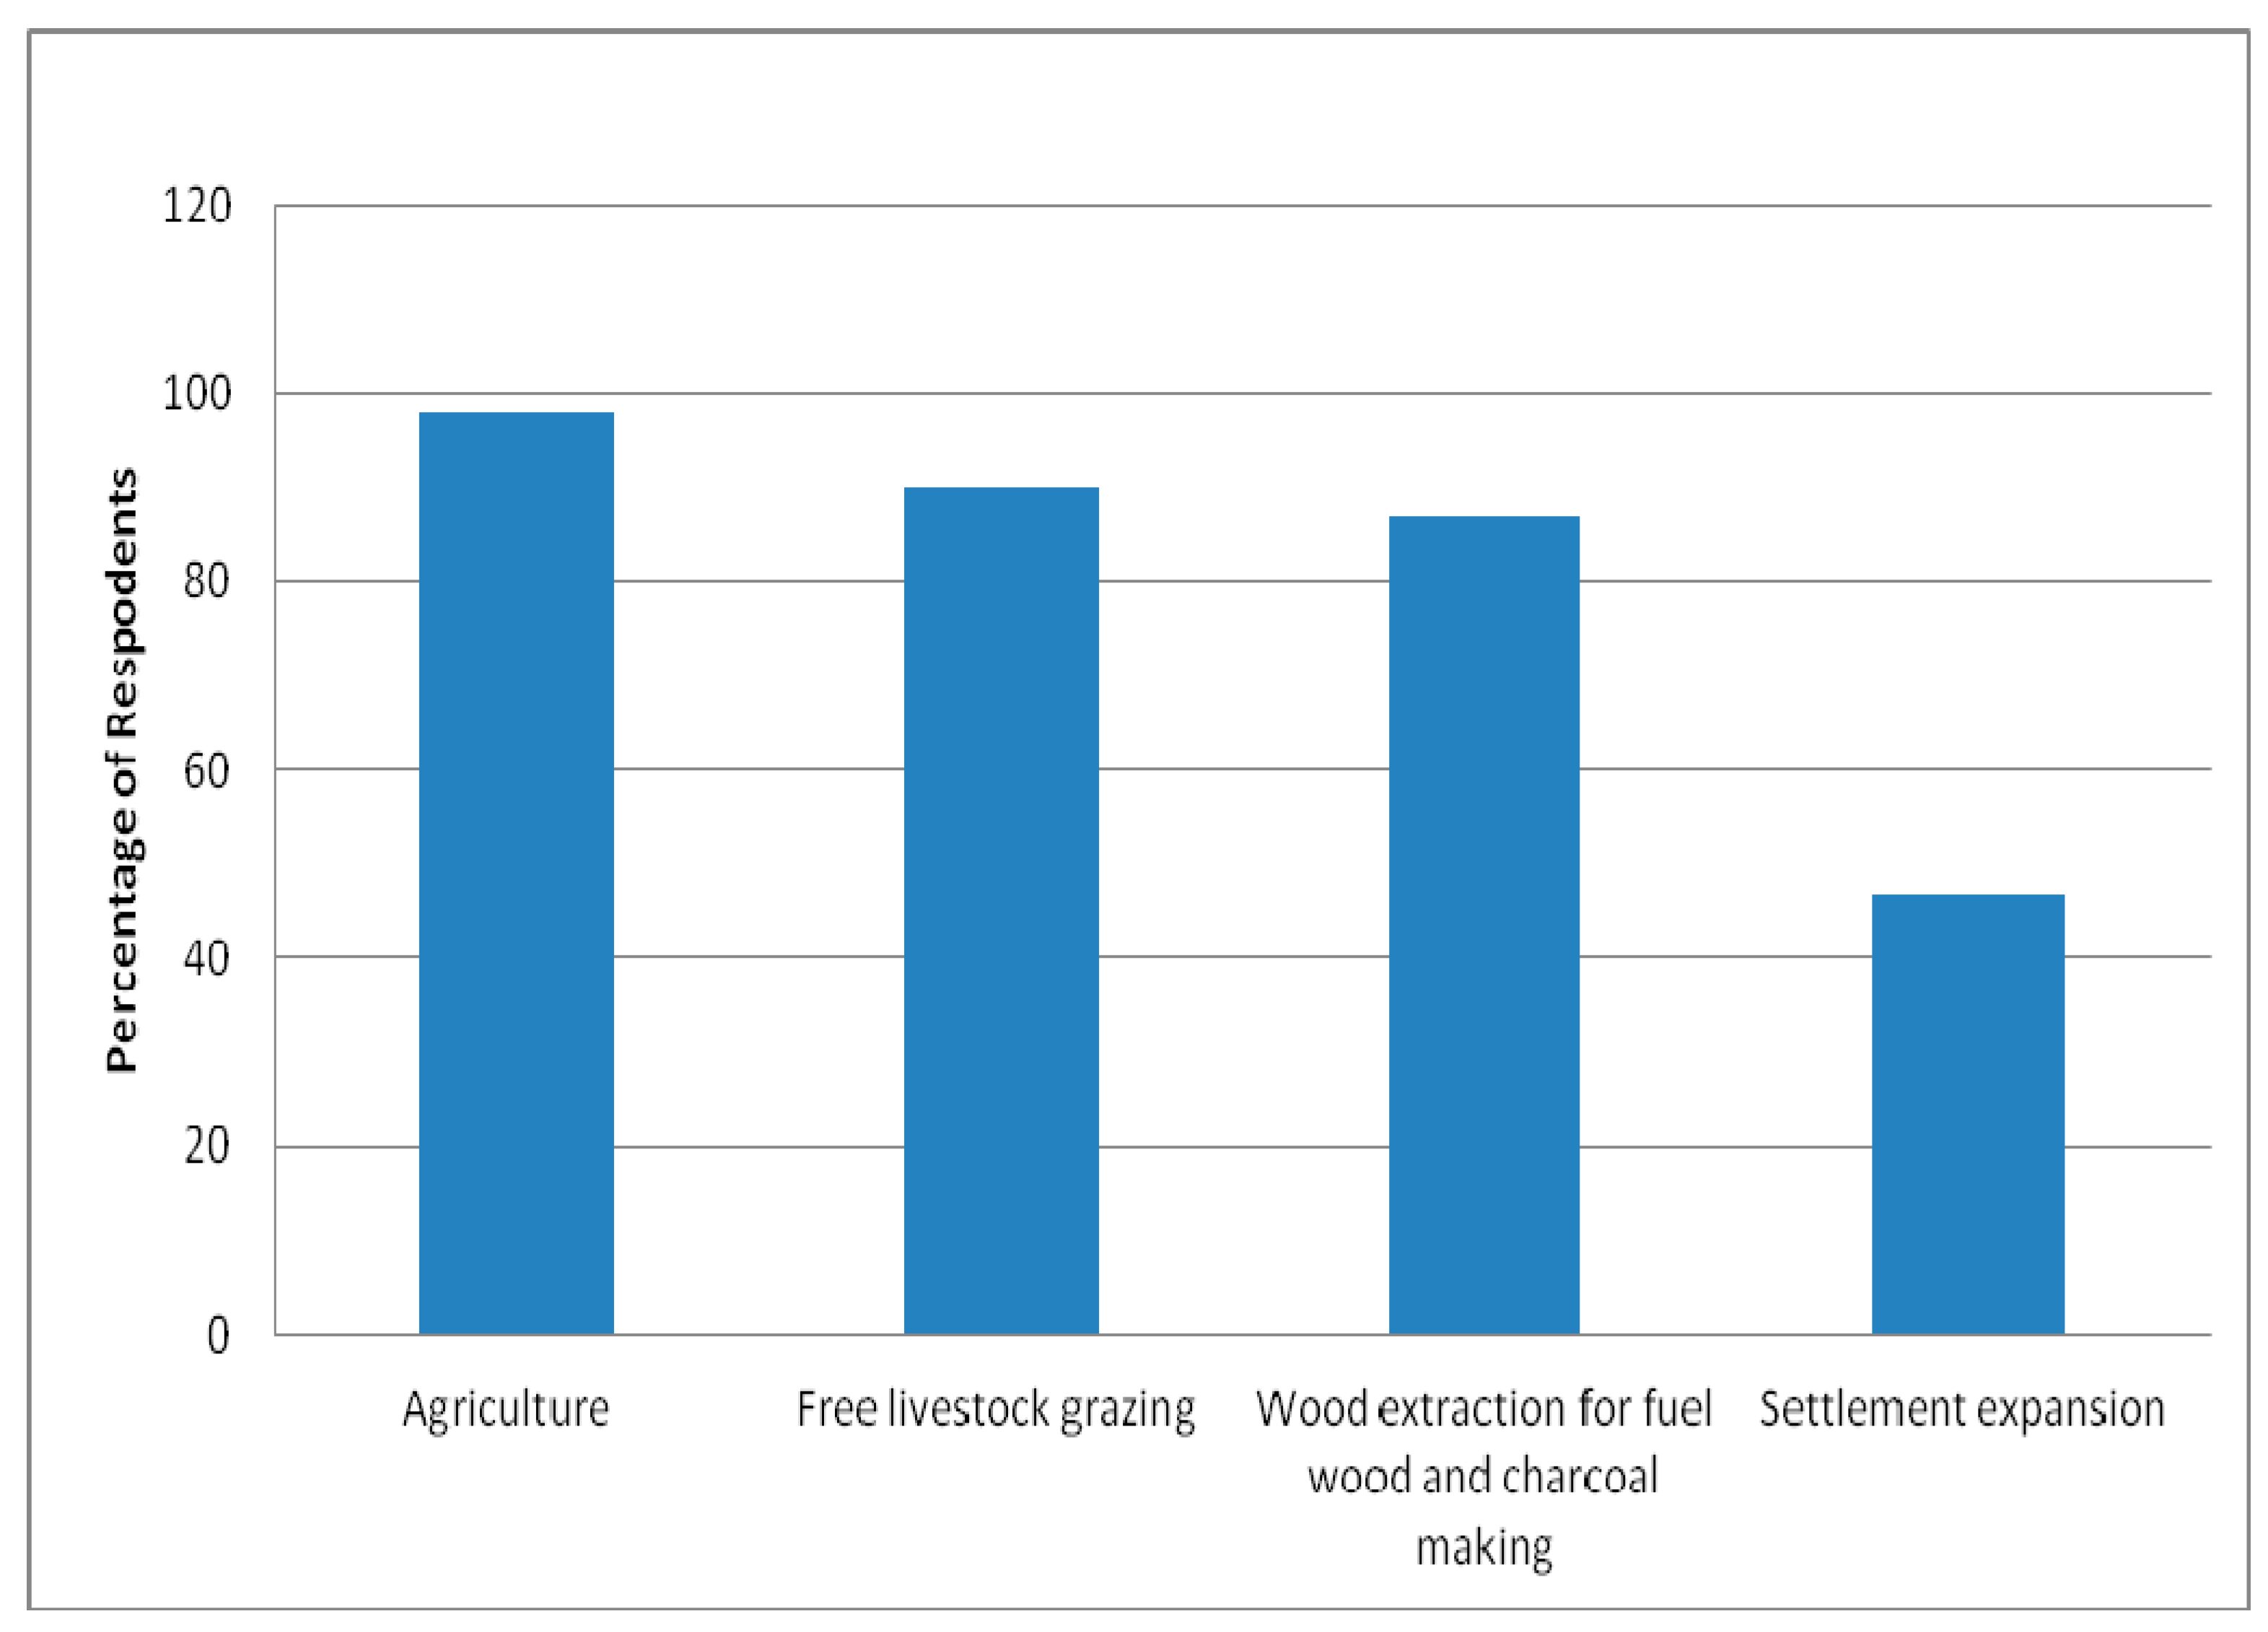
The intensification of human activities seeking to ensure the food supply and improve the income of the growing population is the major proximate driver of land use change [67]. According to the analysis of the household survey, it was revealed that approximately 90% of the total respondents comprehend that the intensification of human activities is the main driver of changes in land use in the KVFP. The associated human activities that drive LUC are expansion of agriculture as reported by 98% of respondents, free livestock grazing (90%), wood extraction for fuel wood and charcoal-making as well as wood for domestic use (87%) and settlement expansion (47%) (Figure 5).
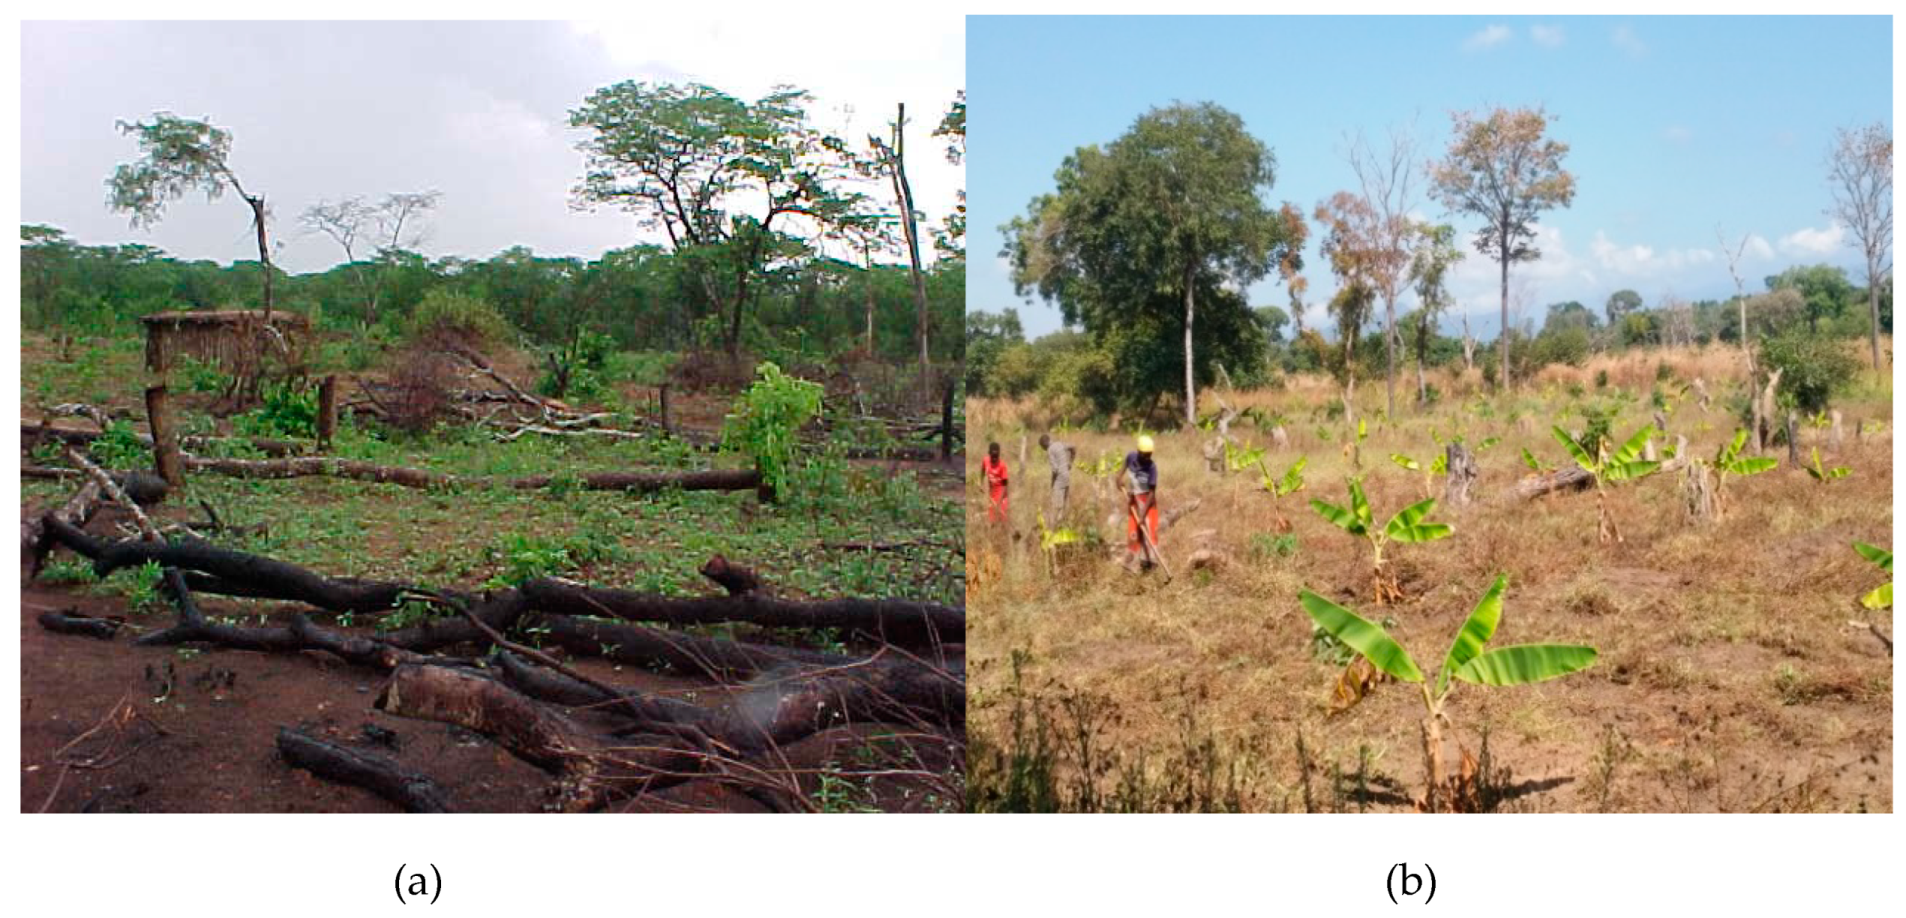
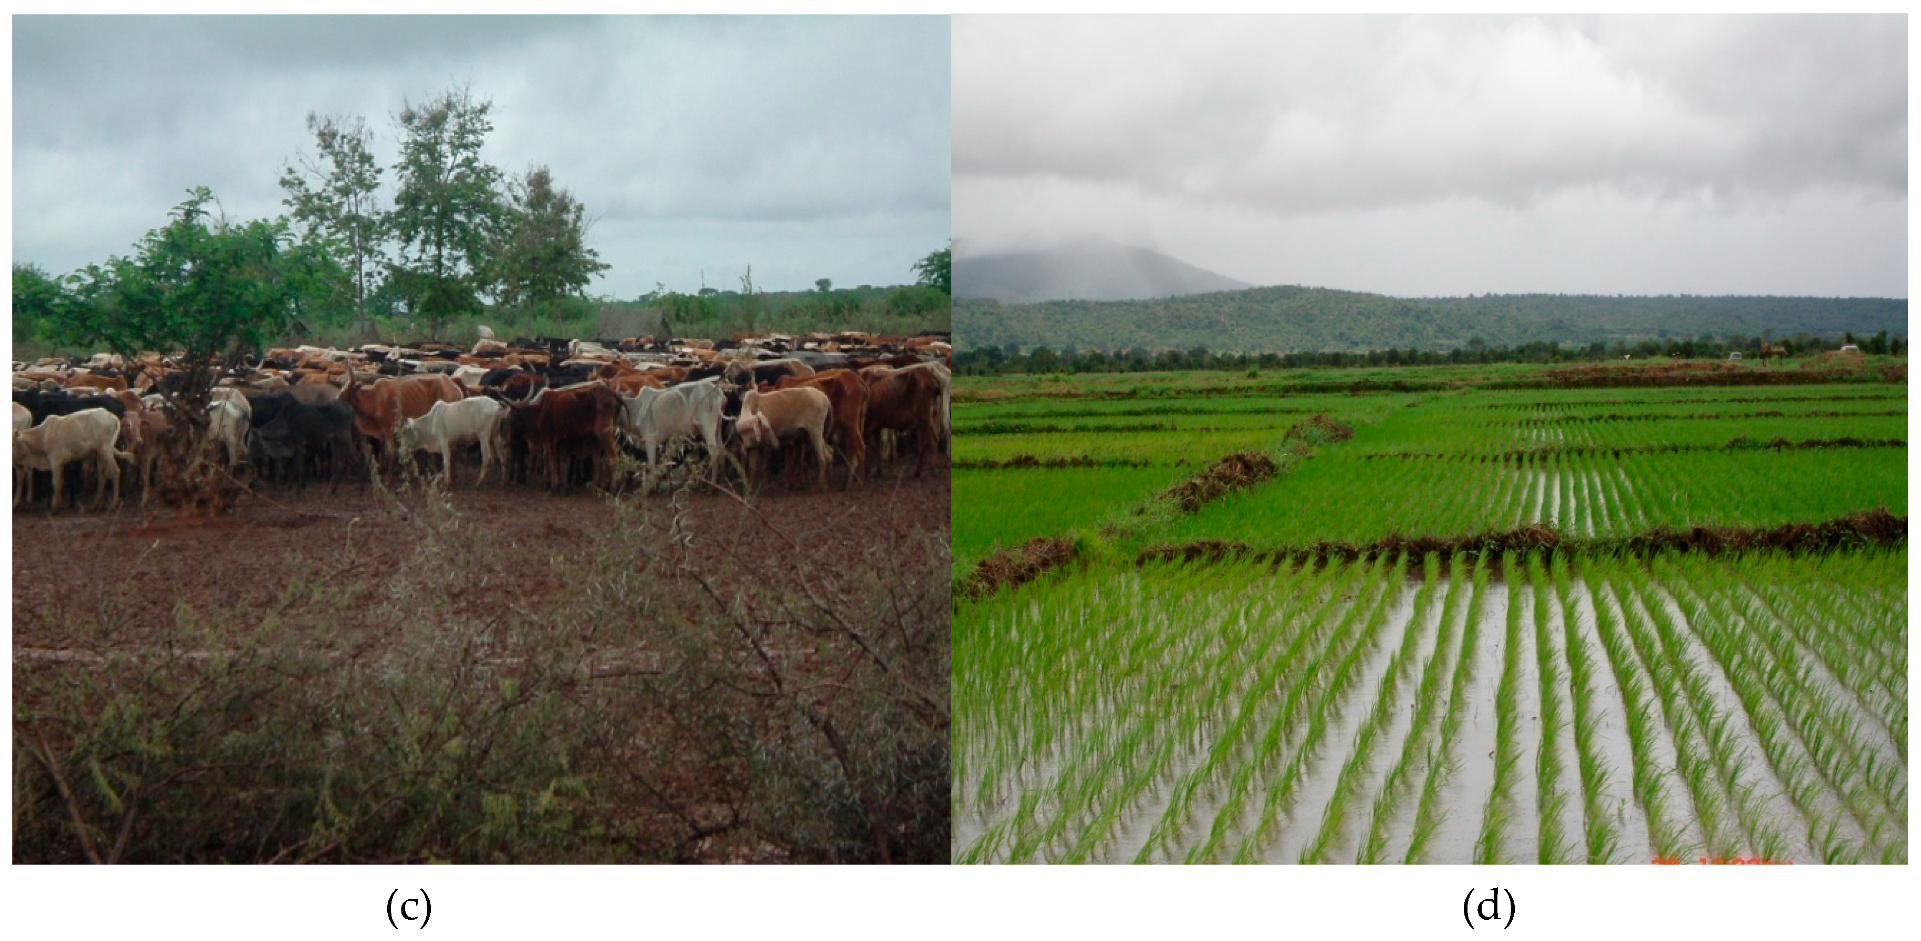
Through field observation, human activities were observed to adversely cause changes in land use in the study area, as shown in Figure 6.

3.4.2. Underlying Drivers of Land Use Change in the KVFP

Economic Factors

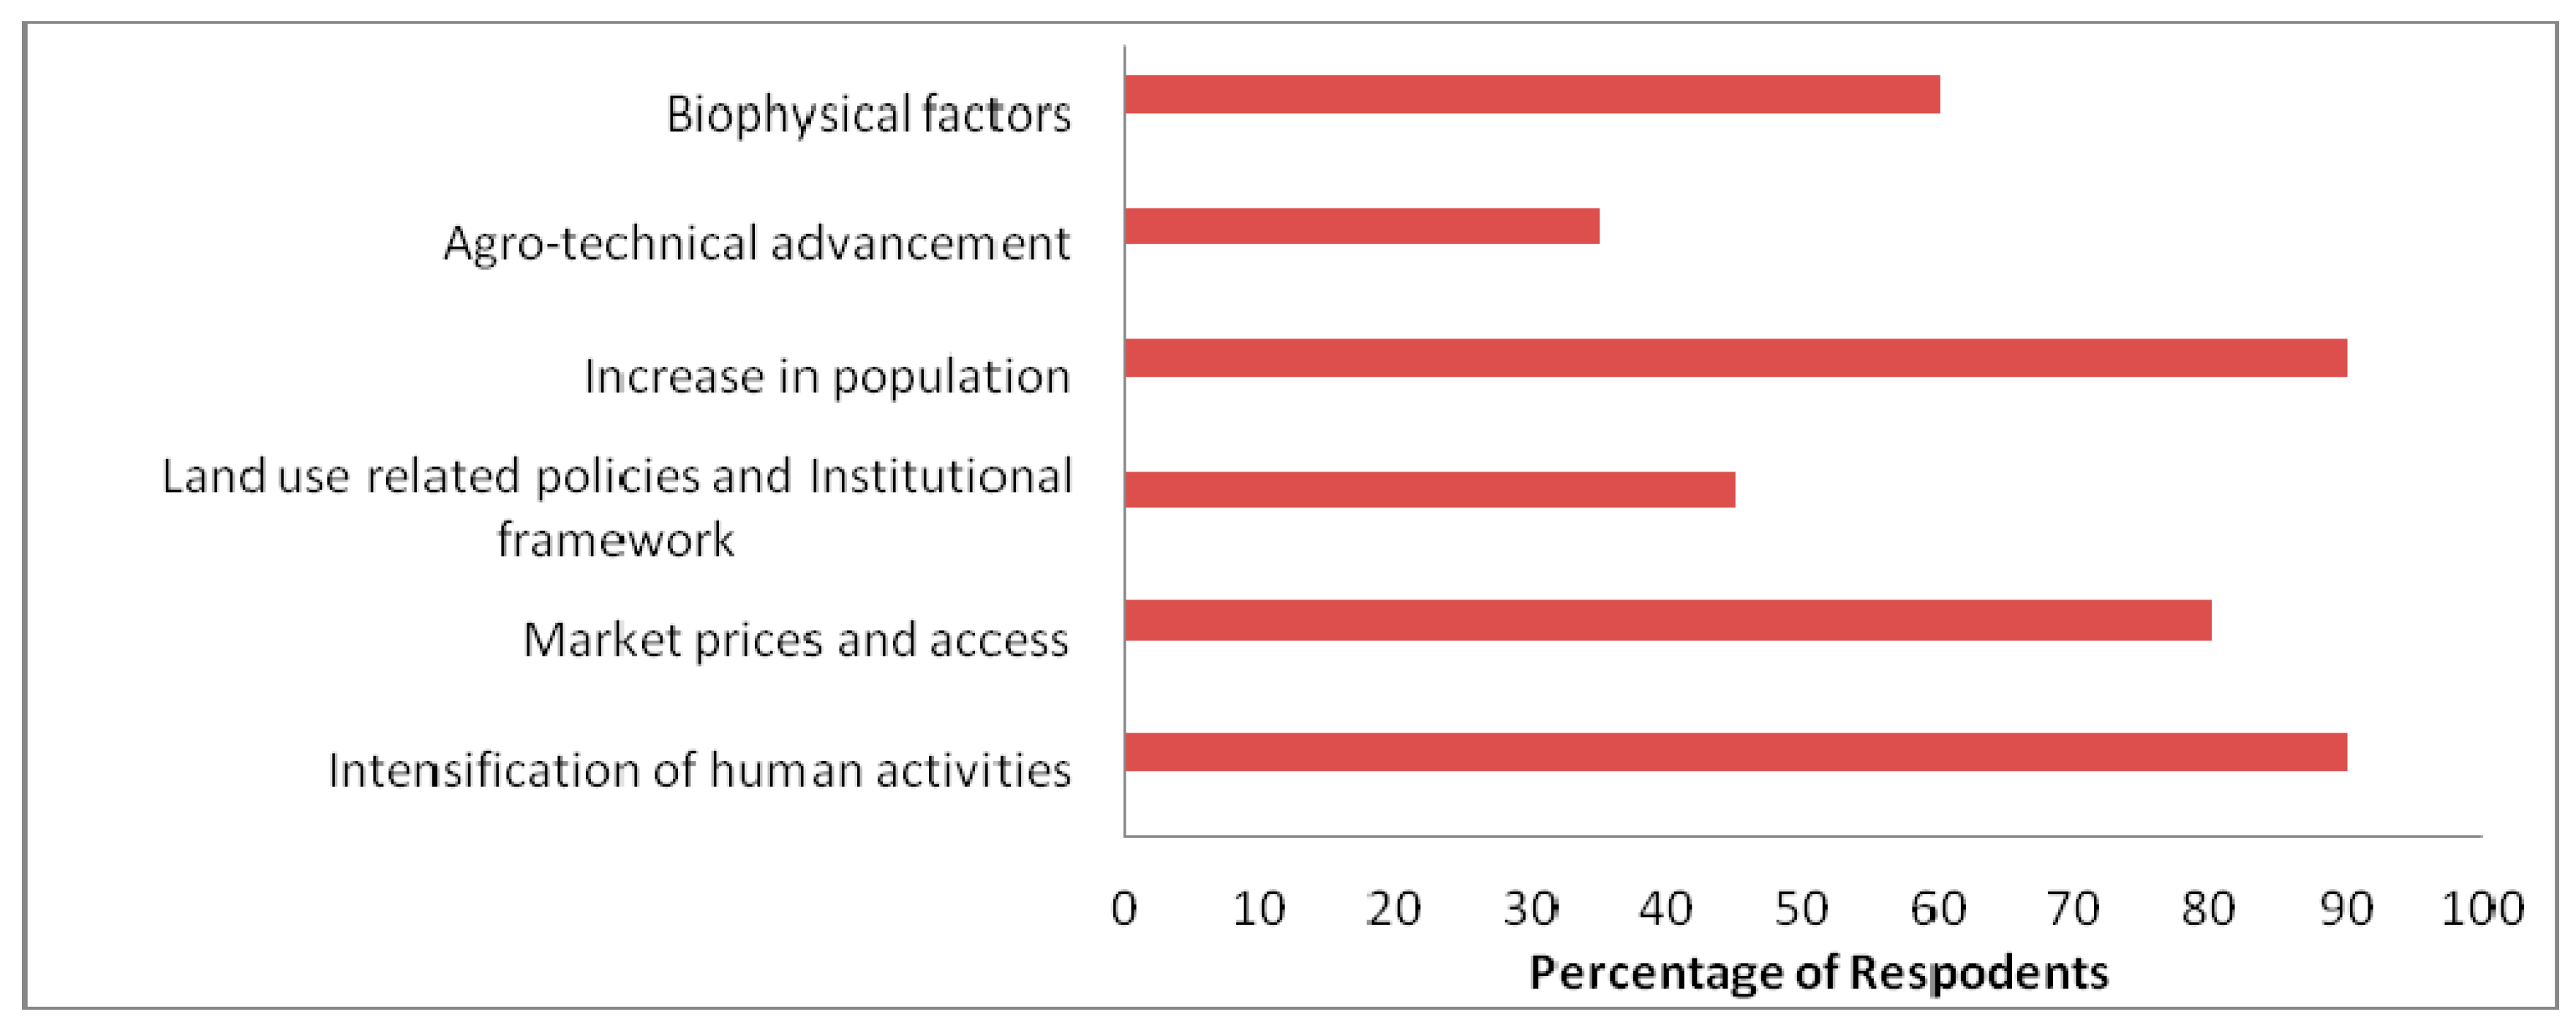
Over 80% of the total respondents in the study area agreed that increased consumption demand and the market price for rice, especially in urban centers, fuel wood and timber, contributed to agricultural expansion of rice fields towards the wetland area in the Kilombero valley floodplain (Figure 6d and Figure 7). This was further supported by the focus group discussion where the local representative said that “The growing urban cities demands are high that increased demand for the fuel wood especially charcoal, this motivates us to cut down trees for charcoal making as the price for a bag of charcoal is rising every time”. Moreover, information from the key informant interviews revealed that the market access for agricultural products such as rice, sesame and sugarcane coupled with improved roads and railways in the study area have facilitated the expansion of agricultural land as compared to other land uses.

National Policies and Institution

Through a questionnaire survey and information from secondary data, this study revealed that 45% of the total respondents believed that the land-use related policies and government initiatives influenced LUC in the area (Figure 7). This is also supported by an interview with district officials responsible for managing the land resources, who declared that the National Forest Policy of 1998, agriculture sector strategies and policies, MKUKUTA and the Structural Adjustment Program (SAP) associated with agricultural market liberalization, have significantly contributed to changes in land use in the KVFP.

Population Growth

The population in the study area has been increasing throughout the period assessed in this study. According to the national census reports [54,68,69], the population in the Kilombero valley floodplain (KVFP), including Kilombero, Ulanga and Malinyi districts, has been increasing (Table 7).
This increase in population has implications for land resources as the need to produce food and the demands for settlement and fuel wood increase in response to growing population needs. This is aligned with the questionnaire survey that revealed that 90% of the total respondents believed that population growth was attributed to land use change in their area (Figure 7).

Agrotechnological Advancement

Based on the analysis of the household questionnaire survey, approximately 35% of the total respondents revealed that the advancement in agrotechnology in the KVFP has influenced land use change in their area (Figure 7). Agrotechnology advancement in the study area includes the use of agriculture inputs such as fertilizers, pesticide, power tillers and tractors. The results from the interview with key informants also revealed that a significant number of people in the KVFP use power tillers, oxen and tractors to prepare farms and assist them in clearing an extensive area for agriculture, hence there is agriculture expansion at the expense of other land use types.

Biophysical Factors

From the questionnaire survey, it was revealed that 60% of the total respondents in the study area considered soil condition, climate variability and terrain characteristics as among the main factors causing land use change in the study area. Moreover, this study analyzed the average temperature and rainfall in the Kilombero valley floodplain using the data from the Tanzania Meteorology Agency (TMA) to show how changes in rainfall and temperature have affected the ecology of the wetlands. Figure 8a,b shows temperature and rainfall data, respectively. The analysis of the data shows that the rainfall has decreased steadily while the temperature has increased in the last 25 years (Figure 8a,b).

4. Discussion

To date, there is an extensive body of literature and theories accounting for land use changes. Land use changes in this study imply agriculture expansion by clearing new land (extensification) or agriculture intensification involving the application of agriculture inputs to increase the output per unit of land, deforestation and wetland conversion. This is also in line with Bilsborrow [70] and much of the land use change literature, especially in Africa, which has focused more on the ability of the ecosystem to respond to population growth and the market growth of crop and timber products. There are two main approaches that can be linked to LUC in the study area. One body of literature is based on consumption or needs-based approaches to land use change. This approach focuses on the relationship between land use changes and population growth. The second body of literature links land use changes with the market. In addition to these two approaches, other literature has considered the structural integration of small households into a large sphere of influence of biophysical (ecological) factors in influencing land use changes. Based on the results, change in land use in the KVFP include deforestation whereby forest area that covers the largest part of land use type in KVFP have decreased from 19,544 km2 (64%) in 1990 to 16,415 km2 (53.9%) in 2016. Deforestation in KVFP is attributed to the expansion of agricultural land to forests, illegal logging as well as the increased demand for the forest products such as fuel wood and charcoal. Similarly, Geist and Lambin [9] reported that human activities and an increased demand of forest products such as fuel wood and logs were the primary drivers of tropical forest deforestation. Despite the decrease in forest area, some parts of the valley were observed to have small patches of teak plantations, replacing the natural forests [36]. The results also show that agricultural land and grassland have substantially increased by 11.3% and 13.3%, respectively, mainly due to increased population growth (Table 7). The increase in population has greatly enhanced the pressure on land resources, ensuing agriculture expansion and intensification, overgrazing and expansion of settlement (Figure 6). Similarly, studies in south-central Senegal have found that increased demographic pressures have resulted in an increase in cultivated and settlement lands at the expense of other land covers [1]. Additionally, bushland, which was the second largest land use type in 1990 covering 18% of the total area in the KVFP, decreased to 8.1% in 2016, implying a decreased change of 10%. On the other hand, the wetland area decreased from 1415 km2 (4.6%) in 1990 to 261 km2 (0.9%) in 2016, implying a decrease change of 3.8%.
Nevertheless, this paper has also shown that there are the proximate driver and underlying drivers that influence the land use changes in the KVFP. The proximate driver was observed to be the intensification of human activities, particularly agriculture expansion, free livestock grazing, wood extraction for fuel wood, charcoal-making and settlement expansion (Figure 5). Government policies, an increased market demand and the prices for crop and timber products coupled with improved infrastructure, human population growth, agrotechnology advancement, soil properties, terrain characteristics and climate variability are the main underlying drivers of land use changes in the KVFP (Figure 7). An interview with the key informants in Kilombero, Malinyi and Ulanga districts reported that implemented government policies such as structural adjustment programs (SAP) of the 1980s, the forest policies and action plans of 1997, the National Land Policy of 1997, the agriculture policy of 2013, the livestock policy of 1997 and the agricultural reform in the agriculture sector have influenced changes in agricultural land use in the KVFP.
The structural adjustment programs (SAPs) were economic reform programs that encouraged the development of the private sector in the economy [71]. Under this reform, the government liberalized the marketing of agricultural inputs leading to the abolishment of pan-territorial pricing for fertilizers and complete removal of subsidies [72]. This reform also removed the state monopoly on crop marketing, creating an opportunity for private sector participation in crop marketing as well as providing an opening for farmers to grow crops of their choice depending on the market condition. These aspects have considerably influenced the changes in agricultural land use systems in the KVFP. National forest policies and action plans also influence encroachment on forests by local people since the policies were formulated when exploitation was being controlled through licensing [73]. Moreover, the implementation of private investment in the forestry sector encouraged by the national forest policy of 1998 influenced the conversion of Miombo woodlands into teak plantations in Kilombero and Ulanga districts. Additionally, land and agriculture policies have been providing an enabling environment for the international investment and private–public partnerships in the agriculture sector. This influenced the opening of large-scale commercial ventures for rice and sugarcane, such as Kilombero Plantation Limited (KPL) and Illovo Sugar Limited, which intensified the use of land resources in the KVFP. In 2008, KPL acquired over 5000 hectares of land in the Kilombero Valley for the establishment of commercial rice plantations in the village lands of Mngeta ward [53]. Moreover, these large companies emphasized out-grower programs where smallholder farmers produce products on their own land according to the company’s specifications and then sell their product to the company that facilitates the agriculture expansion and intensification in the KVFP. In addition, agricultural policies created a favorable environment for many agricultural development programs in the KVFP, including the introduction of an agricultural green growth program which is funded primarily by the United States’ Feed the Future program and the World Bank in the Southern Agricultural Growth Corridor (SAGCOT) in Kilombero District. These programs and interventions have influenced the direction of agricultural land use changes in the KVFP. This study shows that the government decisions and policies have influenced household and national decisions in production, which have consequently determined the nature of land use changes in the study area. Similar observations have also been reported in [11,74].
Furthermore, the role of the market in influencing changes in agricultural land use has been facilitated by policy changes and transport infrastructure improvement [75]. The market liberalization policy in Tanzania has contributed to rapid increase in the producer price for crops such as rice, thus encouraging farmers to increase production as well as to extend the area under production. These aspects have substantially influenced the changes in agricultural land use systems in the study area. Moreover, improved infrastructures such as main roads and TAZARA line link KVFP to urban/city centers, enabling farmers to transport their farm products to more central markets where they expect to fetch better prices, encouraging them to increase production through agricultural intensification and expansion into the marginal areas. Additionally, high urban demand and market prices for rice, cocoa and horticultural crops such as banana and vegetables have motivated farmers to increase production through land expansion and intensification into Kilombero wetlands.
It was further observed that there is a relationship between population increase and change in land use in the KVFP, as already indicated in Section 3.4.2. The population in the KVFP has increased from 174,222 people in 1967 to 672,383 people in 2012 with annual growth rates of 2.4% and 3.7%, respectively, against the national rate of 2.7% (Table 7). This shows that the annual growth rate of the population in Kilombero valley floodplain is higher than the national rate. It is projected that the population will increase to 973,433 people by 2022. This situation is attributed to the immigration of pastoralists and agro-pastoralists since the early 1990s following the Tanzanian government program of removing agro-pastoralists from Usangu Basin and the civil conflicts between pastoralists and farmers in Kilosa district, Tanzania. These groups are mainly engaged in both large-scale livestock keeping and farming since they have technological advancements in using their animals to clear large areas for crop production and capital for hiring tractors. Thus, population increase has increased the demand for arable land and caused excessive environmental degradation. This is in line with other schools of thought regarding the relationship between population growth and land use changes. According to Malthus [76], growing rural population increases the demand for agriculture to feed the ever-increasing population, leading to the expansion of agricultural land into marginal land, land fragmentation, decreased productivity and famine, which are pathways to poverty and environmental degradation. However, Boserup [77] considered that, as a population grows, arable land becomes scarce, which spurs scarcity, necessitating people to intensify agricultural production. From this perspective, agricultural change is driven primarily by the changing consumption need of the local population due to population growth.
Moreover, agrotechnological advancement has directly affected farmers’ behavior and decisions pertaining to resource utilization, contributing to agricultural expansion and intensification [78]. The agrotechnological advancement in the study area includes the use of agriculture inputs such as fertilizers, pesticides, power tillers and tractors. The interviews with key informants also revealed that a significant number of people in the KVFP use agriculture inputs and agricultural machinery such as power tillers, oxen and tractors to prepare farms that assist them to clear extensive area for agriculture, hence agriculture intensification and agriculture expansion at the expense of other land use types. This is in line with Rowcroft [11], who reported that technological innovations have increased the demand for agricultural land and created an incentive to further deplete natural forest resources.
Influence of policies through government intervention, good market incentive, high population growth and agrotechnological advancement are not the only factors, which can explicitly provide an explanation for land use changes in the study area. Biophysical factors such as soils, rainfall variability, prolonged drought, and inaccessibility to irrigation water also have an impact on land use changes. The biophysical factors may act as constraints to agriculture production as they offer certain kinds of limitations to production. It was revealed that climate variability has significantly caused the drying up of the Kilombero wetlands and water resources; added stresses to upland farming compelled farmers to expand cultivation into the wetlands to compensate for declining productivity. The climate variability will continue to have more impact as rainfall decreases and temperature increases (Figure 8). Many ecosystems, particularly wetlands, are sensitive to climate change and variability that affect their hydrology, biogeochemical processes, plant communities and ecosystem function [79]. Moreover, its flat terrain characteristics and heavy black alluvial soils coupled with high water holding capacity that support agricultural production especially for water loving crops such as rice in the Kilombero valley floodplain, have influenced agricultural land use change. In addition, these soils support natural vegetation and pasture for grazing during dry season hence wetland conversion. Through focus group discussion and key informant interviews, it was revealed that soil fertility is declining with continuous cultivation, consequently declining agricultural productivity. Such situation compelled farmers to opt for non-farming activities such as charcoal production, which, when not well controlled, leads to unsustainable wetland resource use. In line with this study, it has also been argued that agricultural land use change is a response to the interaction between human activities and the biophysical environment in which they exists [80]. Based on the study findings, it can be revealed that human–environment relationships that contribute to land use changes are shaped by many obstacles rendered by the physical environment and the technological abilities of households to match with these constraints. It is crucial for us to evaluate the trends in the changes in land use and identify the predominant factors in LUC to contribute towards informing policy makers on appropriate policy-based interventions [17,81].

5. Conclusions

This study concluded that the KVFP has experienced spatiotemporal changes in land use change predominantly with the conversion of land into agricultural land use at the expense of other land use/covers, deforestation and wetland conversion. The land use changes in the study area are a complex process that involves the interaction of various factors. Demographic pressure, agrotechnological advancement, market influence, biophysical factors and policies were among the major factors driving the land use changes. However, there is interplay among these factors acting simultaneously as well as differently with different magnitudes in time and space to influence the land use changes. The presence of strong market demand and prices coupled with improved infrastructure and a high potential for rice production and livestock grazing have influenced the overall process of agricultural changes towards agrarianization, as most households depend on agriculture as their main source of livelihood. Additionally, all of these alterations in the land use change trends if prolonged for the future will adversely affect the wetland ecosystem services and functions. To ensure sustainable development in the KVFP, monitoring the ongoing LUC change over long periods is very important; land use planners and decision makers must properly implement their strategies. Therefore, future management strategies should include the introduction of alternative environmentally friendly sources of livelihood, such as beekeeping, population growth control, the promotion of agricultural land use intensification, the promotion of community participation and education on the importance of wetland conservation.

Author Contributions

N.K.M. designed the study, analyzed the data, and prepared the manuscript with contributions from L.S. and J.L. who contributed to the conceptualization of ideas, the methodology and the review of the manuscript.

Funding

This research was funded by [the Foundation of Jilin Educational Committee] grant number [JJKH20180024KJ]; [the National Key Research and Development Program of China] grant number [2016YFC0500407].

Acknowledgments

Nangware Kajia Msofe is thankful to the Chinese Government Scholarship (CSC) for providing funds to carry out this research as part of her PhD studies. Sincere thanks also go to her supervisor, Sheng Lianxi for his endless support in carrying out the research and developing the manuscript. We also thank the Tanzania Meteorological Data Unit for providing meteorological data. The authors thank the technical and field support provided by Olipa Shija during the conduct of the research in Kilombero, Ulanga and Malinyi districts.

Conflicts of Interest

The authors declare no conflicts of interest.

References

  1. Wood, E.C.; Tappan, G.G.; Hadj, A. Understanding the drivers of agricultural land use change in central Senegal. J. Arid Environ. 2004, 59, 565–582. [Google Scholar] [CrossRef]
  2. Commission, B. Report of the World Commission on Environment and Development: Our Common Future; Oxford University Press: Oxford, UK, 1987; p. 383. [Google Scholar]
  3. Millennium Ecosystem Assessment. Ecosystems and Human Well-Being: General Synthesis; Island Press: Washington, DC, USA, 2005. [Google Scholar]
  4. Lambin, E.F.; Geist, H.J.; Lepers, E. Dynamics of Land Use and Land Cover Change in Tropical Regions. Annu. Rev. Environ. Resour. 2003, 28, 205–241. [Google Scholar] [CrossRef]
  5. Olson, J.; Misana, S.; Campbell, D.; Mbonile, M.; Mugisha, S. The Spatial Pattern and Root Causes of Land Use Changes in East Africa; (LUCID) Project Working Paper 47; International Livestock Research Institute: Nairobi, Kenya, 2004. [Google Scholar]
  6. Foley, J.A.; DeFries, R.; Asner, G.P.; Barford, C.; Bonan, G.; Carpenter, S.R.; Chapin, F.S.; Coe, M.T.; Daily, G.C.; Gibbs, H.K.; et al. Global Consequences of Land Use Change. Science 2005, 309, 570–574. [Google Scholar] [CrossRef] [PubMed]
  7. Lillesand, T.M.; Kiefer, R.W. Remote Sensing and Image Analysis; John Wiley and Sons: New York, NY, USA, 2000; Volume 46, p. 736. [Google Scholar]
  8. SMUWC. Sustainable Management of Usangu Wetland and Its Catchment: Towards a Management Strategy for the Usangu Catchment; Directorate of Water Resources, Ministry of Water and Livestock Development, Government of Tanzania: Dar es salaam, Tanzania, 2001.
  9. Geist, H.J.; Lambin, E.F. Proximate causes and underlying driving forces of tropical deforestation. BioScience 2002, 52, 143–150. [Google Scholar] [CrossRef]
  10. Food and Agriculture Organization. Agriculture and Climate Change: FAO Role; Viale delle Terme di Caracall: Rome, Italy, 1997. [Google Scholar]
  11. Rowcroft, P. Gaining Ground: The Socio-Economic Driving Forces Behind Decisions Regarding Land Use and Land Use Change; An Overview, Working Paper 16; Mekong River Commission: Vientiane, Loas, 2005.
  12. Bičík, I.; Kupková, L.; Jeleček, L.; Kabrda, J.; Štych, P.; Janoušek, Z.; Winklerová, J. Land Use Changes in the Czech Republic 1845–2010, Socio-Economic Driving Forces; Springer: Basel, Switzerland, 2015. [Google Scholar]
  13. Parry, M.L.; Canziani, O.F.; Palutikof, J.P.; van der Linden, P.J.; Hanson, C.E. IPCC Fourth Assessment Report: Climate Change 2007—Impacts, Adaptation and Vulnerability (IPPC WGII AR4); Cambridge University Press: Cambridge, UK; New York, NY, USA, 2007. [Google Scholar]
  14. Serra, P.; Pons, X.; Saurí, D. Land-cover and land-use change in a Mediterranean landscape: A spatial analysis of driving forces integrating biophysical and human factors. Appl. Geogr. 2008, 28, 189–209. [Google Scholar] [CrossRef]
  15. Reid, R.S.; Kruska, R.L.; Muthui, N.; Taye, A.; Wotton, S.; Wilson, C.J.; Mulatu, W. Land-use and land-cover dynamics in response to changes in climatic, biological and socio-political forces: The case of southwestern Ethiopia. Landsc. Ecol. 2000, 15, 339–355. [Google Scholar] [CrossRef]
  16. Liu, J.; Kuang, W.; Zhang, Z.; Xu, X.; Qin, Y.; Ning, J.; Zhou, W.; Zhang, S.; Li, R.; Yan, C.; et al. Spatiotemporal characteristics, patterns, and causes of land-use changes in China since the late 1980s. J. Geogr. Sci. 2014, 24, 195–210. [Google Scholar] [CrossRef]
  17. Houghton, R. The Worldwide Extent of Land-Use Change. Bioscience 1984, 44, 305–313. [Google Scholar] [CrossRef]
  18. Lambin, E.F.; Geist, H.J. Land-Use and Land-Cover Change: Local Processes and Global Impact; Springer: Berlin/Heideberg, Germany, 2006. [Google Scholar]
  19. Lambin, E.F.; Baulies, X.; Bockstael, N. Land-Use and Land-Cover Change (LUCC): Implementation Strategy; IGBP: Stockholm, Sweden, 1995; p. 125.
  20. Turner, B.L., II; Meyer, W.B.; Skole, D.L. Global Land use/Land-cover Change: Towards an Integrated Study. Ambio 1994, 23, 91–95. [Google Scholar]
  21. Krajewski, P.; Solecka, I.; Mrozik, K. Forest Landscape Change and Preliminary Study on Its Driving Forces in Ślęża Landscape Park (Southwestern Poland) in 1883–2013. Sustainability 2018, 10, 4526. [Google Scholar] [CrossRef]
  22. Ramsar Ramsar Information Paper No. 1: What Are Wetlands? Available online: http://www.ramsar.org/ (accessed on 28 May 2018).
  23. Dahl, T.E. Wetlands Losses in the United States to 1980’s; U.S. Department of the Interior: Washington, DC, USA, 1990; p. 1780.
  24. United Republic of Tanzania (URT). A Directory of Wetlands of International Importance. Available online: http://www.wetlands.org/reports/dbdirectory.cfm?site_id=108 (accessed on 16 January 2003).
  25. The Ramsar Convention; Ramsar Center: Gland, Switzerland, 2008.
  26. WWF for a Living Planet. Available online: http://www.panda.org.za/article.php?id=286 (accessed on 15 May 2018).
  27. Kangalawe, R.Y.; Liwenga, E.T. Livelihoods in the wetlands of Kilombero Valley in Tanzania: Opportunities and challenges to integrated water resource management. Phys. Chem. Earth Parts A/B/C 2005, 30, 968–975. [Google Scholar] [CrossRef]
  28. Ministry of Natural Resources and Tourism. The National Wetlands Management Strategy; Ministry of Natural Resources and Tourism: Dar es Salaam, Tanzania, 2007.
  29. Mwakaje, A.G. Wetlands, Livelihoods and Sustainability in Tanzania. Afr. J. Ecol. 2009, 47, 179–184. [Google Scholar] [CrossRef]
  30. Gebrekidan, B.H.; Heckelei, T.; Rasch, S. The Dynamics of Land-Use Change in Kilombero Valley Floodplain Wetland: An Agent Based Modelling Approach. Available online: http://www.tropentag.de/2016/abstracts/links/Gebrekidan_uys0wdGD.php (accessed on 16 October 2018).
  31. Wilson, E.; McInnes, R.; Mbanga, D.P.; Ouedraogo, P. Ramsar Advisory Mission Report; Ramsar Site No. 1173; Kilombero Valley, United Republic of Tanzania: Dar es Salaam, Tanzania, 2018. [Google Scholar]
  32. Jenkins, R.K.B.; Corti, G.R.; Fanning, E.; Roettcher, K. Management implications of antelope habitat use in the Kilombero Valley, Tanzania. Oryx 2002, 36, 161–169. [Google Scholar] [CrossRef]
  33. Nindi, S.J.; Maliti, H.; Bakari, S.; Kija, H.; Machoke, M. Conflicts over land and water resources in the Kilombero Valley floodplain, Tanzania. Afr. Study Monogr. 2014, 50, 173–190. [Google Scholar]
  34. Muro, J.; Lopez, A.; Strauch, A.; Steinbach, S.; Truckenbrodt, J.; Thonfeld, F. 25 years of landscape changes in the Kilombero floodplain, Tanzania. In Proceedings of the Worldcover 2017 Conference, European Space Agency-ESRIN, Frascati, Italy, 14–16 March 2017. [Google Scholar]
  35. Kashaigili, J.J.; McCartney, M.; Mahoo, H.F. Estimation of environmental flows in the Great Ruaha River catchment, Tanzania. Phys. Chem. Earth Parts A/B/C 2007, 32, 1007–1014. [Google Scholar] [CrossRef]
  36. Leemhuis, C.; Thonfeld, F.; Näschen, K.; Steinbach, S.; Muro, J.; Strauch, A.; López, A.; Daconto, G.; Games, I.; Diekkrüger, B. Sustainability in the Food-Water-Ecosystem Nexus: The Role of Land Use and Land Cover Change for Water Resources and Ecosystems in the Kilombero Wetland, Tanzania. Sustainability 2017, 9, 1513. [Google Scholar] [CrossRef]
  37. Shi, G.; Jiang, N.; Yao, L. Land Use and Cover Change during the Rapid Economic Growth Period from 1990 to 2010: A Case Study of Shangai. Sustainability 2018, 10, 426. [Google Scholar] [CrossRef]
  38. Rahman, A.; Kumar, S.; Fazal, S.; Siddiqui, M.A. Assessment of Land use/land cover Change in the North-West District of Delhi Using Remote Sensing and GIS Techniques. J. Indian Soc. Remote Sens. 2012, 40, 689–697. [Google Scholar] [CrossRef]
  39. Gao, Z.; Deng, X. Analysis on Spatial Features of LUCC Based on Remote Sensing and GIS in China. Chin. Geogr. Sci. 2002, 12, 107–113. [Google Scholar] [CrossRef]
  40. Hishe, S.; Bewket, W.; Nyssen, J.; Lyimo, J. Analyzing past land use land cover change and CA-Markov based future modeling in the Middle Suluh Valley, Northern Ethiopia. Geocarto Int. 2018. [Google Scholar] [CrossRef]
  41. Yu, M.; Chen, D.; Huang, R.; Ai, T. A Dynamic Analysis of Regional Land Use and Cover Changing (LUCC) by Remote Sensing and GIS: Taking Fuzhou Area as Example; SPIE Defense, Security, and Sensing; SPIE: Orlando, FL, USA, 2010. [Google Scholar]
  42. Krajewski, P.; Solecka, I. Landscape Change Index as a Tool for Spatial Analysis. IOP Conf. Ser. Mater. Sci. Eng. 2017. [Google Scholar] [CrossRef]
  43. Krajewski, P. Assessing Change in a High-Value Landscape: Case Study of the Municipality of Sobotka, Poland. Pol. J. Environ. Stud. 2017, 26, 2603–2610. [Google Scholar] [CrossRef] [Green Version]
  44. Ntongani, W.A.; Munishi, P.K.; More, S.R.; Kashaigili, J.J. Local Knowledge on the Influence of land use/cover changes and conservation threats on Avian community in the Kilombero Wetlands, Tanzania. Open J. Ecol. 2014, 4, 723. [Google Scholar] [CrossRef]
  45. Seki, H.A.; Shirima, D.D.; Courtney Mustaphi, C.J.; Marchant, R.; Munishi, P.K.T. The impact of land use and land cover change on biodiversity within and adjacent to Kibasira Swamp in Kilombero Valley, Tanzania. Afr. J. Ecol. 2017. [Google Scholar] [CrossRef]
  46. Kirimi, F.; Thiong’o, K.; Gabiri, G.; Diekkrüger, B.; Thonfeld, F. Assessing seasonal land cover dynamics in the tropical Kilombero floodplain of East Africa. J. Appl. Remote Sens. 2018, 12, 26–27. [Google Scholar] [CrossRef]
  47. Meyer, W.B.; Turner, B.L., II. Human Population Growth and Global Land Use/Cover Change. Ann. Rev. Ecol. Syst. 1992, 23, 39–61. [Google Scholar] [CrossRef]
  48. Moser, M.; Prentice, C.; Frazier, S. A Global Overview of Wetland Loss and Degradation; Wetlands International: Ede, The Netherlands, 1998. [Google Scholar]
  49. Nguyen, H.H.; Dargusch, P.; Patrick, M.; Aziz, A.A. Land-use change and socio-ecological drivers of wetland conversion in Ha Tien Plain, Mekong Delta, Vietnam. Land Use Policy 2017, 64, 101–113. [Google Scholar] [CrossRef]
  50. Zhang, F.; Kung, H.; Johnson, V. Assessment of Land-Cover/Land-Use Change and Landscape Patterns in the Two National Nature Reserves of Ebinur Lake Watershed, Xinjiang, China. Sustainability 2017, 9, 724. [Google Scholar] [CrossRef]
  51. Jätzold, R.; Baum, E. The Kilombero Valley; Weltforum: Munich, Germany, 1968. [Google Scholar]
  52. Mombo, F.M.; Speelman, S.; Van Huylenbroeck, G.; Hella, J.; Pantaleo, M.; Moe, S. Ratification of the Ramsar convention and sustainable wetlands management: Situation analysis of the Kilombero Valley wetlands in Tanzania. J. Agric. Ext. Rural Dev. 2011, 3, 153–164. [Google Scholar]
  53. United Republic of Tanzania. Baseline Study of the Kilombero Valley Ramsar Site, Ifakara, Morogoro Tanzania; Department of Zoology and Wildlife Conservation, University of Dar es Salaam: Dar es Salaam, Tanzania, 2010. [Google Scholar]
  54. United Republic of Tanzania. 2012 Population and Housing Census; Government Printer: Dar es Salaam, Tanzania, 2013.
  55. Lillesand, T.M.; Kiefer, R.W. Remote Sensing and Image Interpretation, 3rd ed.; John Willey & Son: New York, NY, USA; Chichester, UK; Brisbane, Australia; Toronto, ON, Canada; Singapore, 1994. [Google Scholar]
  56. Zhu, Z.; Wang, S.; Woodcock, C.E. Improvement and expansion of the Fmask algorithm: Cloud, cloud shadow, and snow detection for Landsats 4–7, 8, and Sentinel 2 images. Remote Sens. Environ. 2015, 159, 269–277. [Google Scholar] [CrossRef]
  57. Zhu, Z.; Woodcock, C.E. Object-based cloud and cloud shadow detection in Landsat imagery. Remote Sens. Environ. 2012, 118, 83–94. [Google Scholar] [CrossRef]
  58. Pal, M.; Mather, P.M. An Assessment of the Effectiveness of Decision Tree Methods for Land Cover Classification. Remote Sens. Environ. 2003, 86, 554–565. [Google Scholar] [CrossRef]
  59. Keuchel, J.; Naumann, S.; Heiler, M. Automatic Land Cover Analysis for Tenerife by Supervised Classification using Remotely Sensed Data. Remote Sens. Environ. 2003, 86, 530–541. [Google Scholar] [CrossRef]
  60. Breiman, L. Manual on Setting Up, Using, and Understanding Random ForestsV3.1; Statistics Department University of California: Berkeley, CA, USA, 2002. [Google Scholar]
  61. Ned, H. Random Forests: An algorithm for image classification and generation of continuous fields data sets. In Proceedings of the International Symposium on Geoinformatics for Spatial Infrastructure Development in Earth and Allied Sciences, Hanoi, Vietnam, 9–11 December 2010. [Google Scholar]
  62. Intergovernmental Panel on Climate Change (IPCC). Guidelines for National Greenhouse Gas Inventories—Volume 4—Agriculture, Forestry and other Land Use; Institute for Global Environmental Strategies: Hayama, Japan, 2006. [Google Scholar]
  63. Olofsson, P.; Foody, G.M.; Herold, M.; Stehman, S.V.; Woodcock, C.E.; Wulder, M.A. Good practices for estimating area and assessing accuracy of land change. Remote Sens. Environ. 2014, 148, 42–57. [Google Scholar] [CrossRef] [Green Version]
  64. Foody, G.M. Status of land cover classification accuracy assessment. Remote Sens. Environ. 2002, 80, 185–201. [Google Scholar] [CrossRef]
  65. Bell, E.J. Markov Analysis of Land Use Change—An Application of Stochastic Processes to Remotely Sensed Data. Socio-Econ. Plan. Sci. 1974, 8, 311–316. [Google Scholar] [CrossRef]
  66. He, S.; Wang, D.; Li, Y.; Zhao, P. Land Use Chnages and Their Driving Forces in Debris Flow Active Area of Gansu Province, China. Sustainability 2018, 10, 2759. [Google Scholar] [CrossRef]
  67. Müller, D.; Zeller, M. Agricultural Intensification, Population Growth and Forest Cover Change: Evidence from Spatially Explicit Land Use Modeling in the Central Highlands of Vietnam; Springer: Berlin/Heidelberg, Germany, 2004; pp. 495–519. [Google Scholar]
  68. United Republic of Tanzania (URT). 2002 Population and Housing Census; Government Printer: Dar es Salaam, Tanzania, 2003.
  69. United Republic of Tanzania (URT). Population and Housing Census. 1988; Government Printer: Dar es Salaam, Tanzania, 1997.
  70. Bilsborrow, R.E.; Okoth-Ogendo, H.W.O. Population-driven changes in land use in developing countries. Ambio 1992, 21, 37–45. [Google Scholar]
  71. Mung’Ong’O, C.G.; Loiske, V.M.; Simon, D.; Spengen, W.V.; Dixon, C.; Närman, A. Structural Adjustment Programmes and Peasant Responses in Tanzania. 1995, pp. 159–183. Available online: http://hdl.handle.net/20.500.11810/3615 (accessed on 16 January 2019).
  72. Putterman, L. Economic Reform and Smallholder Agriculture in Tanzania: A Discussion of Recent Market Liberalization, Road Rehabilitation, and Technology Dissemination Efforts. World Dev. 1995, 23, 311–326. [Google Scholar] [CrossRef]
  73. National Environmental Management Council (NEMC). Institutional Mandate for Natural Resources Management in East Africa Cross Borders Biodiversity Project Sites in Tanzania; URT: Dar es salaam, Tanzania, 2000. [Google Scholar]
  74. Tiffen, M.; Mortimore, M.; Gichuki, F. More People, Less Erosion: Environmental Recovery in Kenya; John Wiley & Sons Ltd.: New York, NY, USA, 1994. [Google Scholar]
  75. Cooksey, B.; Ellis, F.; Freeman, H.A. Marketing reform? The rise and fall of agricultural liberalisation in Tanzania. Dev. Policy Rev. 2010, 21, 67–91. [Google Scholar] [CrossRef]
  76. Malthus, T. First Essay on Population; Modern Library: New York, NY, USA, 1960. [Google Scholar]
  77. Boserup, E. Population Growth as a Stimulant to Agricultural Development; Springer: Berlin/Heidelberg, Germany, 1988; pp. 61–75. [Google Scholar]
  78. Müller, D. From Agricultural Expansion to Intensification: Rural Development and Determinants of Land-Use Change in the Central Highlands of Vietnam; Deutsche Gesellschaft für: Eschborn, Germany, 2004. [Google Scholar]
  79. Shi, Y.F.; Shen, Y.P.; Li, D.L.; Zhang, G.W.; Ding, Y.J.; Hu, R.J.; Kang, E. Discussion on the present climate change from WARM-DRY to WARM-WET in northwest CHINA. Quat. Sci. 2003, 23, 152–164. [Google Scholar]
  80. Brush, S.P.; Turner, B.L., II. The Nature of Farming System and Views of their Changes. In Comparative Farming Systems; The Guilford Press: London, UK, 1987. [Google Scholar]
  81. Agarwal, C.; Green, G.M.; Grove, J.M.; Evans, T.P.; Schweik, C.M. A Review and Assessment of Land Use Change Models: Dynamics of Space, Time and Human Choice; General Technical Report NE-297; US Department of Agriculture, Indiana University Centre for the study of Institution, Population and Environmental Change: Newton Square, PA, USA, 2002.
Figure 1. Location of the study area. Landsat-5 Thematic MapperTM RGB: Bands 6, 4 and 2.
Sustainability 11 00505 g001
Figure 2. Land use change (LUC) mapping flow chart, as modified from (Kirimi, 2018).
Sustainability 11 00505 g002
Figure 3. Five broad clusters of underlying driving factors underpin the proximate causes of LUC in the KVFP. Modified from Geist and Lambin (2002).
Sustainability 11 00505 g003
Figure 4. Land use maps of the Kilombero valley floodplain: (a) LUC map of the KVFP in 1990; (b) LUC map in 2010; and (c) LUC map in 2016.
Sustainability 11 00505 g004
Figure 5. Contribution of human activities to LUC by percentage of the respondents in the KVFP. Source: Field survey, 2017.
Sustainability 11 00505 g005
Figure 6. (a) Cut down trees for charcoal making; (b) a banana farm in the middle of a forest in Mbingu village; (c) livestock grazing in the lowland of the Kilombero floodplain; and (d) large-scale paddy field in the lowland of the Kilombero floodplain. Source: Field survey, 2017.
Sustainability 11 00505 g006aSustainability 11 00505 g006b
Figure 7. Driving factors of land use change in the KVFP by percentage of respondents. Source: Field survey, 2017.
Sustainability 11 00505 g007
Figure 8. (a) Mean annual temperature during 1994–2017; and (b) annual rainfall during 1990–2017 at Mahenge, Morogoro, Kilombero and Ifakara-Katrin meteorological stations in the study area.
Sustainability 11 00505 g008
Table 1. Data and sources used for the analysis of LUC in the study area.
SatelliteSensorµmBandkmPixelDateSeasonSource
Landsat 5Thematic Mapper (TM)0.45–2.357170 km × 183 km30 m20 June 1990 Dryhttp://glovis.usgs.gov/
Landsat 5Thematic Mapper (TM)0.45–2.357170 km × 183 km30 m17 June 2010Dryhttp://glovis.usgs.gov/
Landsat 8Operational Land Imager (OLI)0.43–1.399170 km × 183 km30 m20 July 2016Dryhttp://glovis.usgs.gov/
Table 2. Land-use classification system and type description.
Land Use/Cover Types National Land Cover Description
ForestAn area of land of at least 0.5 ha, with a minimum tree crown cover of 10% or with existing tree species planted or natural having the potential of attaining more than 10% crown cover, and with trees which have the potential or have reached a minimum height of 3 m at maturity in situ. It includes montane, lowland, mangrove and plantation forests, woodlands and thickets
BushlandBushland is fundamentally defined as being predominantly comprised of plants that are multi-stemmed from a single root base. It includes dense and open bushland
GrasslandFor the most part, grassland occurs in combination with either a limited wooded or bushed component, or with scattered subsistence cultivation
AgricultureLand actively used to grow agriculture crops, including agroforestry systems, wooded crops, herbaceous crops and grain crops
Urban areaLand that includes a settlement
Bare soilLand which includes, bare land and rock outcrop, coastal bare lands, ice cap/snow and coastal sands
WaterIncludes inland water and the Indian Ocean
WetlandLand consisting of marshes or swamps; saturated land
Source: Tanzania Land Use Planning Commission, 2015.
Table 3. Land use change in the Kilombero valley floodplain during 1990–2016.
Land Use/Cover Types Year
1990201020161990–20102010–2016 1990–2016
Land Use/Cover Change
Area (km2)Area Ratio %Area (km2)Area Ratio %Area (km2)Area Ratio %Area (km2)Area Ratio %Area (km2)Area Ratio %Area (km2)Area Ratio %
Agriculture14124.6405313.3484215.926418.77892.6343011.3
Bare soil110.070.070.0−40.000.0−30.0
Bushland549718.0594319.524608.14461.5−3483−11.4−3037−10.0
Forest19,54464.116,79255.116,41553.9−2752−9.0−377−1.2−3129−10.3
Grassland23707.826608.7642521.12901.0376512.4405513.3
Urban area00.010.0380.110.0370.1370.1
Water2290.8560.2300.1−173−0.6−26−0.1−199−0.7
Wetland14154.69663.22610.9−449−1.5−705−2.3−1154−3.8
Total30,47810030,47810030,478100------
Table 4. Transition matrix of land use in the Kilombero valley floodplain from 1990 to 2010 (km2).
1990/2010Agriculture LandBare SoilBushlandForestGrasslandUrban AreaWaterWetland
Agriculture land571313271046726152300
Bare soil22101001
Bushland251316863094585030311
Forest4224161514,022444049198
Grassland9707201285278038258
Urban area00110000
Water40520501310
Wetland57012086324040341
Table 5. Transition matrix of land use in the Kilombero valley floodplain from 2010 to 2016 (km2).
2010/2016Agriculture LandBare SoilBushlandForestGrasslandUrban AreaWaterWetland
Agriculture land194311115120639622177
Bare soil10060000
Bushland360152113591890140
Forest5540243012,328103301638
Grassland1123518421769990016680
Urban area1706133000
Water102420171
Wetland37032105480634
Table 6. Land use dynamics from 1990 to 2016 in the study area.
Land Use ClassRate of Change from 1990 to 2010 (%)Rate of Change from 2010 to 2016 (%)Rate of Change from 1990 to 2016 (%)
Agriculture9.670.979.64
Bare soil−1.46−0.14−1.20
Bushland0.41−2.93−2.12
Forest−0.71−0.11−0.62
Grassland0.627.086.59
Urban area 17.2223.3880.85
Water−3.78−2.28−3.34
Wetland−1.59−3.65−3.14
Table 7. Population Growth trend in the study area from 1967 to 2022.
DistrictCensus Period in YearsProjected Population
19671988200220122022
Kilombero 74,222187,593321,611407,180589,489
Ulanga/Malinyi100,000138,642193,286265,203383,944
Source: United Republic of Tanzania (URT) (1997, 2003, and 2013).