Article

Spatial Heterogeneity in the Determinants of Urban Form: An Analysis of Chinese Cities with a GWR Approach

1
Guangdong Provincial Key Laboratory of Urbanization and Geo-simulation, School of Geography and Planning, Sun Yat-sen University, Guangzhou 510275, China
2
Department of Urban Studies and Planning, Massachusetts Institute of Technology, Cambridge, MA 02139, USA
*
Authors to whom correspondence should be addressed.
Sustainability 2019, 11(2), 479; https://doi.org/10.3390/su11020479
Submission received: 2 December 2018 / Revised: 11 January 2019 / Accepted: 15 January 2019 / Published: 17 January 2019
(This article belongs to the Special Issue Urban Land Use Form in China)

Abstract

:
It is of great significance to investigate the determinants of urban form for shaping sustainable urban form. Previous studies generally assumed the determinants of urban form did not vary across spatial units, without taking spatial heterogeneity into account. In order to advance the theoretical understanding of the determinants of urban form, this study attempted to examine the spatial heterogeneity in the determinants of urban form for 289 Chinese prefecture-level cities using a geographically weighted regression (GWR) method. The results revealed the spatially varying relationship between urban form and its underlying factors. Population growth was found to promote urban expansion in most Chinese cities, and decrease urban compactness in part of the Chinese cities. Cities with larger administrative areas were more likely to have dispersed urban form. Industrialization was demonstrated to have no impact on urban expansion in cities located in the eastern coastal region of China, which constitutes the country’s most developed regions. Local financial revenue was found to accelerate urban expansion and increase urban shape irregularity in many Chines cities. It was found that fixed investment exerted a bidirectional impact on urban expansion. In addition, urban road networks and public transit were also identified as the determinants of urban form for some cities, which supported the complex urban systems (CUS) theory. The policy implications emerging from this study lies in shaping sustainable urban form for China’s decision makers and urban planners.

1. Introduction

Urban form is the spatial structure of urban area, which is believed to significantly affect the spatial configuration of urban land use, transportation, and infrastructures [1]. Over the last few decades, substantial progress has been made in studying urban form [2]. Characterizing and measuring urban form constitutes an important task for policy analysts and urban planners, and there are many ways to measure urban form [3]. Population density is widely used to reflect urban expansion, and is believed to be the most intuitive indicator of urban form [4,5]. With the development of geographical information system (GIS), urban form began to be popularly measured on the neighborhood scale. For example, Song and Knaap measured the urban form of Portland by analyzing land use mixtures, density, and accessibility [6]. Neighborhood-level metrics are based on a quite small scale and are, thus, limited to individual cities. Remote sensing (RS) technologies and landscape metrics make it possible to measure urban form from a macro perspective. For instance, total area, shape index, and aggregation index are usually applied to represent urban expansion, urban shape irregularity, and urban compactness, respectively [7]. Different urban form is likely to result in diverse economic, social, and ecological effects [8], due to which a range of previous studies have investigated the impacts of urban form on a series of socioeconomic and environmental factors, such as carbon emissions [9], air pollution [10,11,12], and urban–rural income [13].
More importantly, an increasing number of studies have turned their attention to the determinants of urban form. Foremost, factors influencing urban expansion have been addressed from various perspectives. A growing population, rising incomes, and falling commuting costs constitute three powerful factors for urban expansion [14], moreover, property taxes [15] and price of rural land [16] have also been believed to affect urban expansion. A case study of the Northern periphery of Mexico Megacity identified six driving factors for urban expansion, including the population growth rate, the share of immigrants, the welfare, scholar age, workers in second and third economic sector, and the distances to roads [17]. Taking the City of Praia, Cape Verde as an example, Silva and Li explored the driving forces of urban expansion, finding that population is not always the persistent driving factor for urban expansion [18]. Studies on urban expansion in China mainly focused on the three major urban agglomerations, namely, the Beijing–Tianjin–Hebei Region, the Yangtze River Delta, and the Pearl River Delta, which constitute the most developed and urbanized regions in China. An empirical investigation of Beijing, the capital of China, demonstrated that urban growth is jointly affected by geographical, socioeconomic, and policy factors [19]. Chen et al. explored the determinants of urban land expansion in Nanjing, one of the subcenters of the Yangtze River Delta, and highlighted the impacts of the economy of scale, agglomeration, accessibility, and government policies on urban expansion [20]. Based on an investigation of Taicang, another city in the Yangtze River Delta, Shu et al. proposed a four-dimensional analytical framework of the determinants of urban expansion, which consists of natural eco-environment, neighborhood, accessibility, and land control policies [21]. An investigation of Guangzhou, which is the center of the Pearl River Delta, indicated that population, GDP, resident income, and urban traffic constitute the dominating driving factors for the expansion of built-up area [22]. In terms of Shenzhen, the subcenter of the Pearl River Delta, economic growth was proved to exert a greater effect on urban expansion than population growth, and the secondary and tertiary sectors were demonstrated to play a more important role than the primary sector in urban expansion [23]. Socioeconomic factors, neighborhood conditions, and accessibility have been shown to significantly affect urban expansion in Dongguan, an important industrial city in the Pearl River Delta [24]. In addition to urban expansion, other urban form metrics, such as shape index and fragmentation index, are also believed to be influenced by some anthropogenic factors, such as socioeconomic factors [25], proximity factors [26,27,28], neighborhood conditions [29], road network [30], and policy factors [31].
Despite many previous studies devoted to investigating the determinants of urban form, the majority of them focused on single cities. The determinants of urban form are poorly understood at the national level, which is not convenient for global comparison. Determinants of urban form, we argued, are likely to differ across cities. That is to say, spatial heterogeneity may exist in the determinants of urban form. Therefore, the contribution of this study is to verify the possible spatial heterogeneity in the determinants of urban form, and thus advance the theoretical understanding of the determinants of urban form. Based on land use data interpreted from Landsat TM and Landsat ETM scenes for the year 2015, three landscape metrics, namely, total area (TA), landscape shape index (LSI), and landscape division index (DIVISION), were used to measure urban form for 289 Chinese prefecture-level cities from the perspective of size, shape complexity, and compactness, respectively. Furthermore, nine influencing factors, which were expected to affect urban form, were selected as explanatory variables. The geographically weighted regression (GWR) modeling technique enabled us to examine spatial variations of the influences of the nine potential determinants on the three urban form variables. The remainder of this paper is organized as follows. Section 2 focuses on data and methods, including the indicators measuring urban form, the influencing factors, and the geographically weighted regression (GWR) modeling technique. Section 3 presents the results, including the spatial differences of urban form and the GWR modeling results. Section 4 provides the discussion about the results. Section 5 provides the conclusions and sets out several policy implications drawn from this study.

2. Data and Methods

2.1. Indicators Measuring Urban Form

Remote sensing (RS) and geographic information systems (GIS) technology make it feasible to efficiently collect accurate land use data. In this study, urban form was evaluated on the basis of urban built-up area boundaries of China’s 289 prefecture-level cities in 2015, which were extracted from Landsat TM and Landsat ETM scenes with a spatial resolution of 30 m × 30 m (http://www.igsnrr.ac.cn). The detailed procedures of RS imagery processing and urban built-up area boundary extractions can be found in relevant literature [32]. Figure 1 shows China’s land use pattern in 2015, which was interpreted from the abovementioned RS image data.
Landscape metrics have been widely used to quantify urban morphology [33], which mainly mirror three aspects of urban form, i.e., size, shape complexity, and compactness [34,35]. Total area (TA) is the total area of urban land, which characterizes the size of urban built-up area and constitutes the foundation of computing other landscape metrics. Therefore, TA is believed to reflect the extent of urban expansion. Landscape shape index (LSI) is able to evaluate the overall geometric complexity of urban built-up area, which measures the perimeter-to-area ratio. The greater the value of LSI, the more irregular the shape of urban built-up area. That is to say, LSI equals 1 when the urban built-up area is a single square, and LSI increases as the shape of urban built-up area becomes more intricate. Landscape division index (DIVISION) is the possibility that two randomly selected pixels are not located in the same urban land patch, which measures the compactness of urban built-up area. DIVISION equals 0 when the urban built-up area is an unbroken patch, while DIVISION reaches its maximum when the urban built-up area is maximally fragmentized. In other words, the smaller the value of DIVISION, the more compact the urban built-up area. Therefore, TA, LSI, and DIVISION were employed to measure urban expansion, urban shape irregularity, and urban compactness for China’s 289 prefecture-level cities in this study, respectively. The detailed description of the three landscape metrics is shown in Table 1.

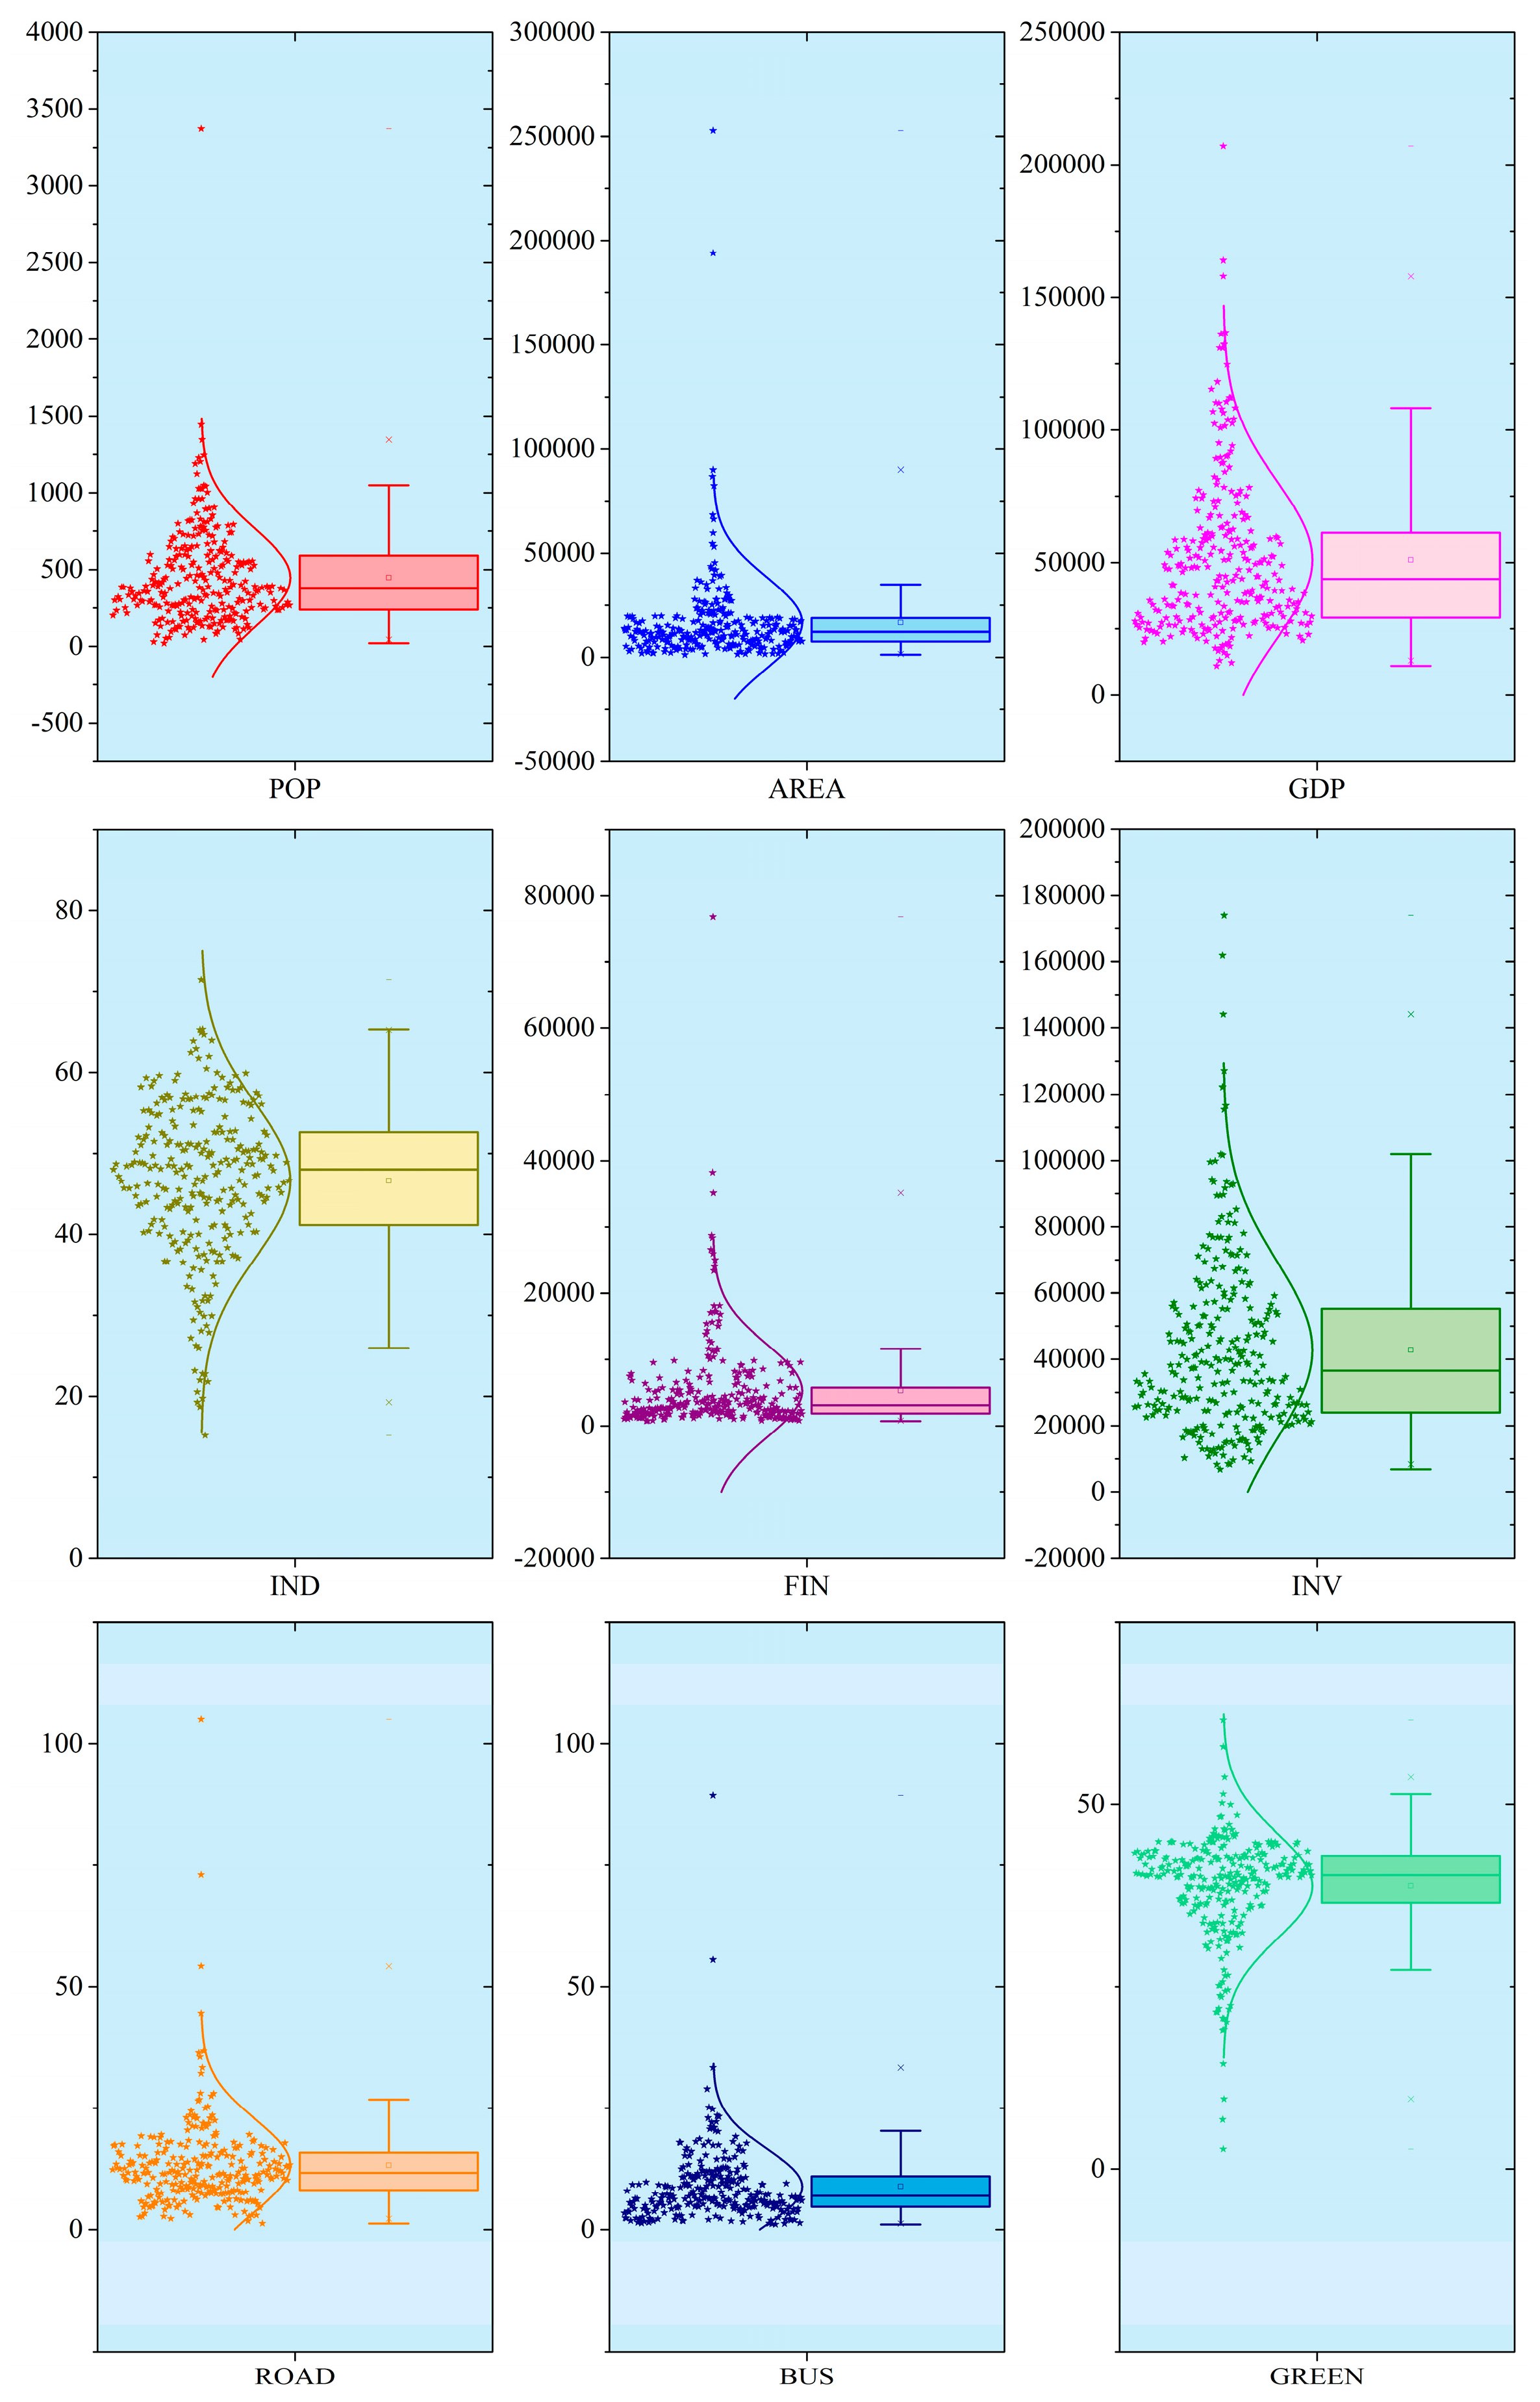
2.2. Influencing Factors

This study developed an analytical framework of determinants for urban form, which incorporated nine influencing factors. Since population (POP) constitutes the foundation of urbanization, POP was expected to significantly influence urban form. In China, a prefecture-level city is a core-periphery system, which consists of urban built-up area and surrounding rural area. Therefore, the administrative area (AREA) is likely to affect urban form. Per capita gross domestic product (GDP) and industrialization level (IND) reflect the economic development level, which are closely connected with urbanization. Thus, both GDP and IND were selected as independent variables. One of the most significant factors driving China’s rapid urbanization is Chinese local governments’ overdependence on benefits from leasing land, which is familiar as “local land finance”. Chinese local governments utilize local financial revenue, a high percentage of which is from “local land finance”, to promote urban development through fixed investment. Therefore, per capita local financial revenue (FIN) and per capita fixed investment (INV) were expected to exert significant impacts on urban form. Urban infrastructures, especially transportation infrastructures, are believed to have significant effects on urban land use form, because of which several urban infrastructure factors were also analyzed, including per capita urban road area (ROAD), number of public transport vehicles per 10000 person (BUS), and green coverage ratio (GREEN). All the determinants data were collected from China city statistical yearbook 2016. Table 2 reviews the details of the nine influencing factors used in this study.
Figure 2 shows the box charts of the nine selected influencing factors, that is, POP, AREA, GDP, IND, FIN, INV, ROAD, BUS, and GREEN, with scatter plot and distribution overlay, wherein the top and bottom of each box represents the 75th and 25th centiles, respectively. The population of most Chinese cities was less than 10 million, while only a few cities had a population more than 10 million, including China’s four municipalities and some other cities located in China’s populous provinces. Most Chinese cities had an administrative area less than 100,000 km2, with the exception of two cities (Hulunbeir and Jiuquan), both of which are located in West China. GDP per capita of most Chinese cities was less than 150 thousand yuan, while the outliers are Erdos, Dongying, and Shenzhen, which either were abundant in mineral resources or had good locational conditions. The distribution of industrialization level was dispersed, with the maximum of 71.45% and the minimum of 15.17%, indicating the considerable regional differences of China’s industrialization. Local financial revenue per capita was found to highly concentrate below 10 thousand yuan, and the most prominent outlier is Shenzhen, China’s first special economic zone, whose local financial revenue per capita was more than 75 thousand yuan. Erdos had the greatest per capita fixed investment as well as the greatest per capita urban road area, which was famous for its real estate bubble. BUS was demonstrated to be mainly concentrated below 25, while the number of public transport vehicles per 10,000 persons of Shenzhen was the largest (89). Green coverage ratio was distributed between 2.71% (Longnan, located in arid West China) and 61.58% (Beijing, the capital of China).

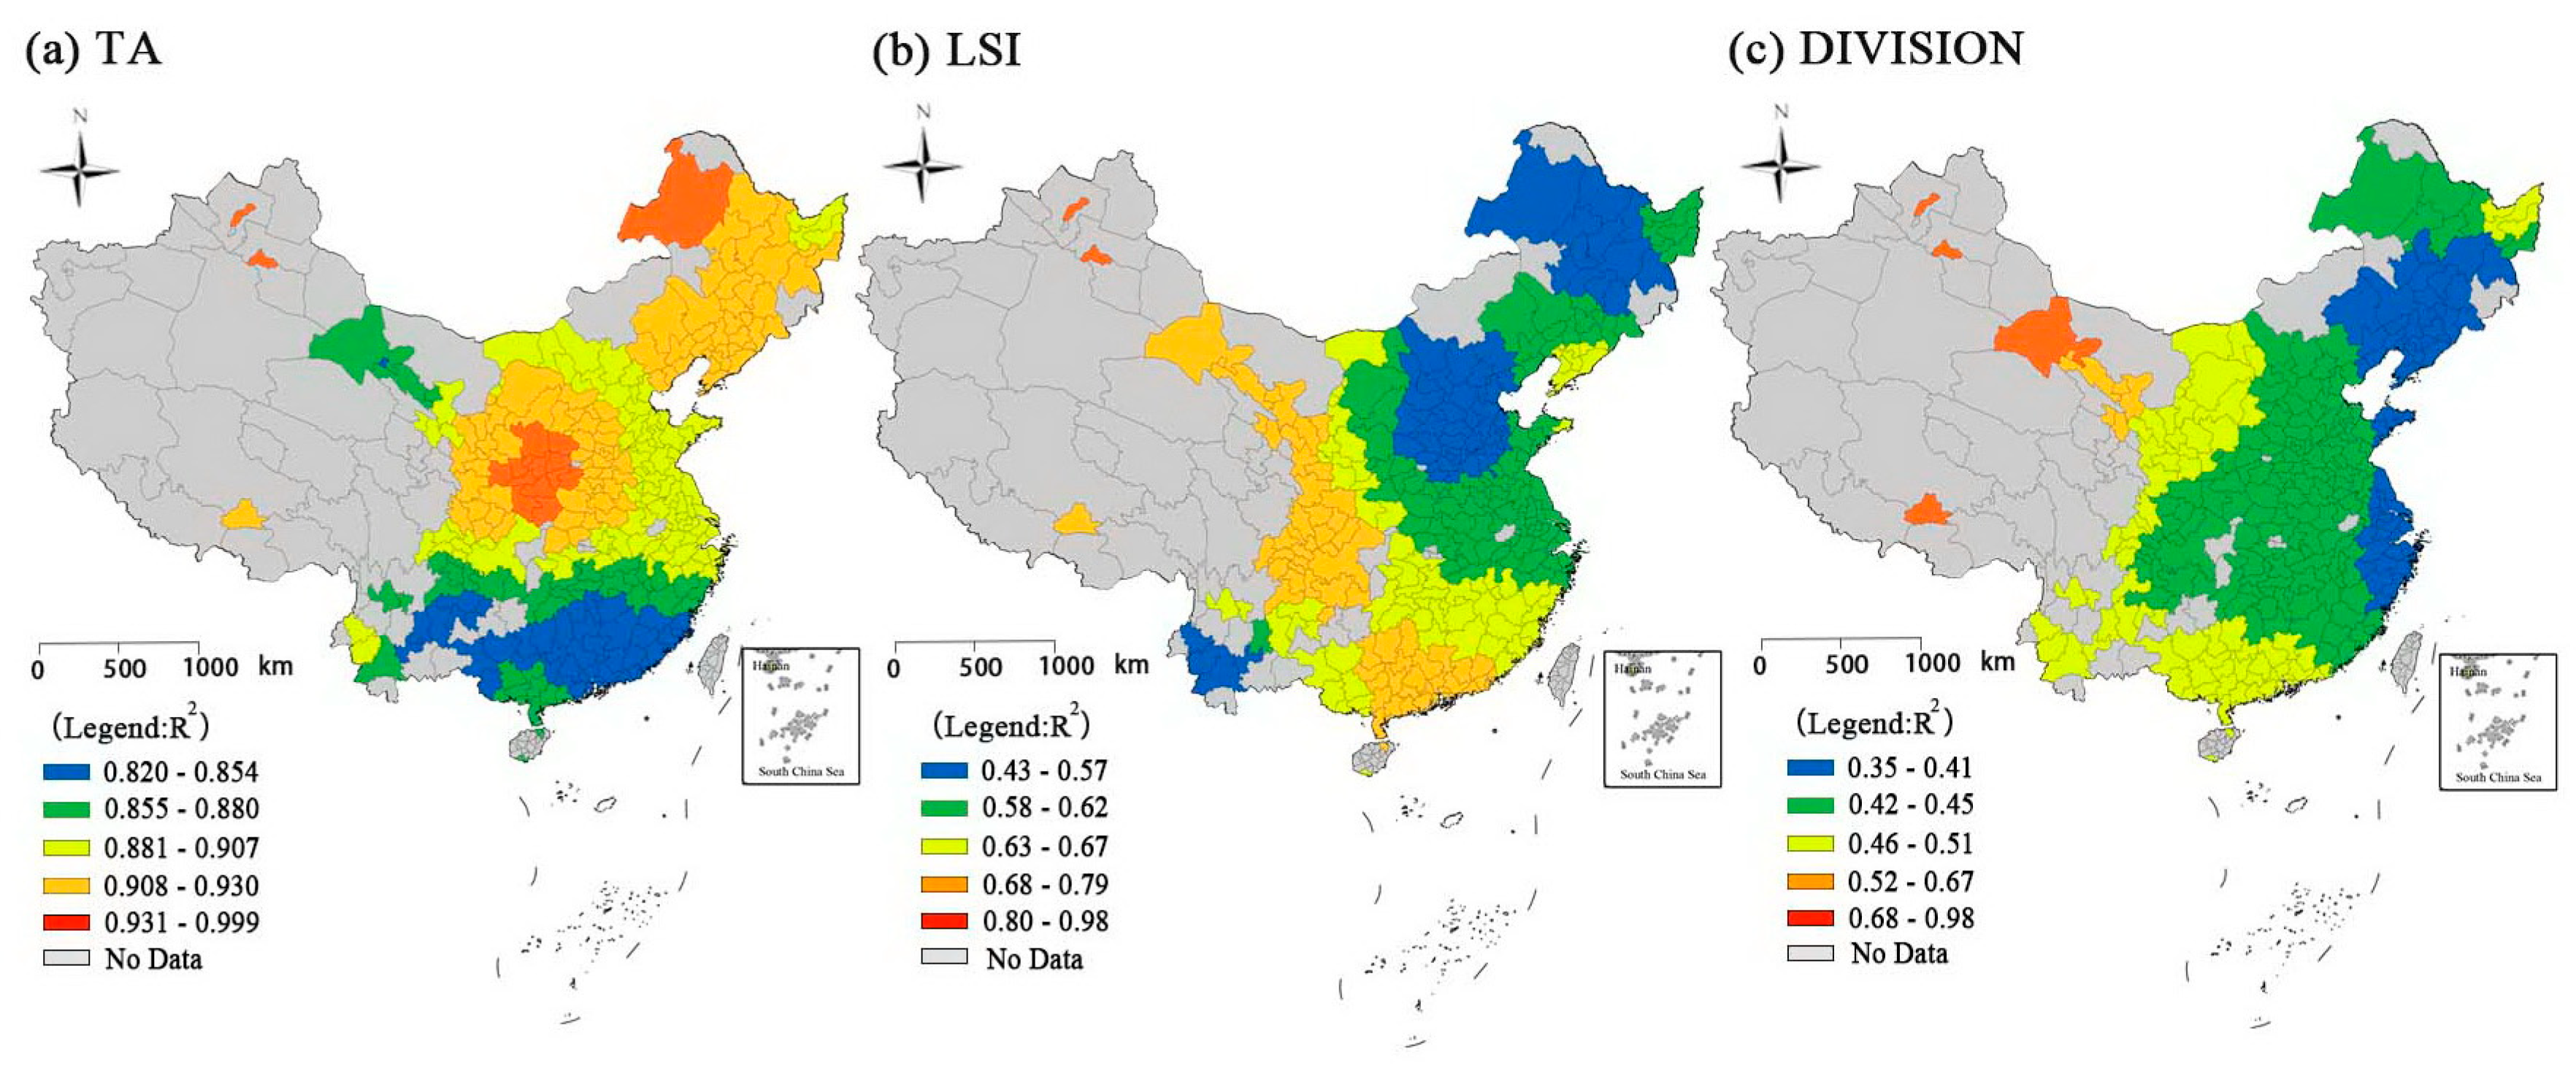
2.3. Geographically Weighted Regression (GWR) Modeling

Multivariate linear regression analysis includes two major types of regression technique. One type is global linear regression approach, such as ordinary least squares (OLS) method, which reflects the overall situation of statistical correlations between dependent variables and several explanatory variables by just one equation. Another type is local linear regression method, such as geographically weighted regression (GWR), which has evident superiority compared with the orthodox global regression. Under the global regression framework, regression coefficients are regarded as constants without regional disparity, which obscures the potential relationship among important local variations. However, GWR takes spatial heterogeneity into consideration, and generates differentiated estimations of regression parameters across spatial locations. The equation of GWR model can be expressed as follows:
y i = β 0 ( u i , v i ) + j = 1 n β j ( u i , v i ) x i j + ε i ,
where y i is the dependent variable; i represents regions of the study area; ( u i , v i ) denotes the location of ith observed region; β j ( u i , v i ) indicates the jth regression parameter at the location of observation i   , which is a function of the geographical position; x i j is the independent variable; ε i is the random error of ith region.
It is local methods, rather than maximum likelihood method that is used to estimate the parameters of the GWR model [36]. The estimated coefficient can be calculated using Equation (2).
β ^ ( u i , v i ) = ( X T W ( u i , v i ) X ) 1 ( X T W ( u i , v i ) Y ) ,
where β ^ is the estimated parameter; X indicates a matrix of independent variable; X T is the transposed form of matrix X   ; Y indicates a matrix of dependent variable; W ( u i , v i ) is a diagonal matrix with elements wij, which represents the spatial weights of chosen regions.
Assuming socioeconomic phenomena in different spatial units have heterogeneous differences may be more in line with the realities [37]. According to Tobler’s first law of geography, everything is related to everything else, but near things are more related to each other [38], which means that the parameter estimation of a certain spatial unit is affected by the parameter estimation of other spatial units, and this impact decreases with distance. A spatial weight matrix W ( u i , v i ) was thus introduced to represent the relative significance among regions, as follows:
W ( u i , v i ) = [ w i 1 0 L 0 0 w i 2 0 0 0 0 w i n ] .
One of the crucial steps in the GWR modeling process is the choice of wij, which is determined by bandwidth, namely, the distance attenuation function. The optimal number of neighboring geographical units were determined based on the Akaike information criterion (AIC) in this study, which is frequently used in previous studies [39]. The regression parameters can be gained after calculating the spatial weight matrix wij. For this study, a bi-square weighting function, which has higher efficiency than Gaussian function [40], was utilized to calculate the weight between cities, and the equation is as follows:
W i j = [ 1 ( d i j q i j ) 2 ] 2   I ( d i q i ) ,
where q i is the distance between the qth neighbor and the regression region; I ( d i q i ) is a condition function.

3. Results

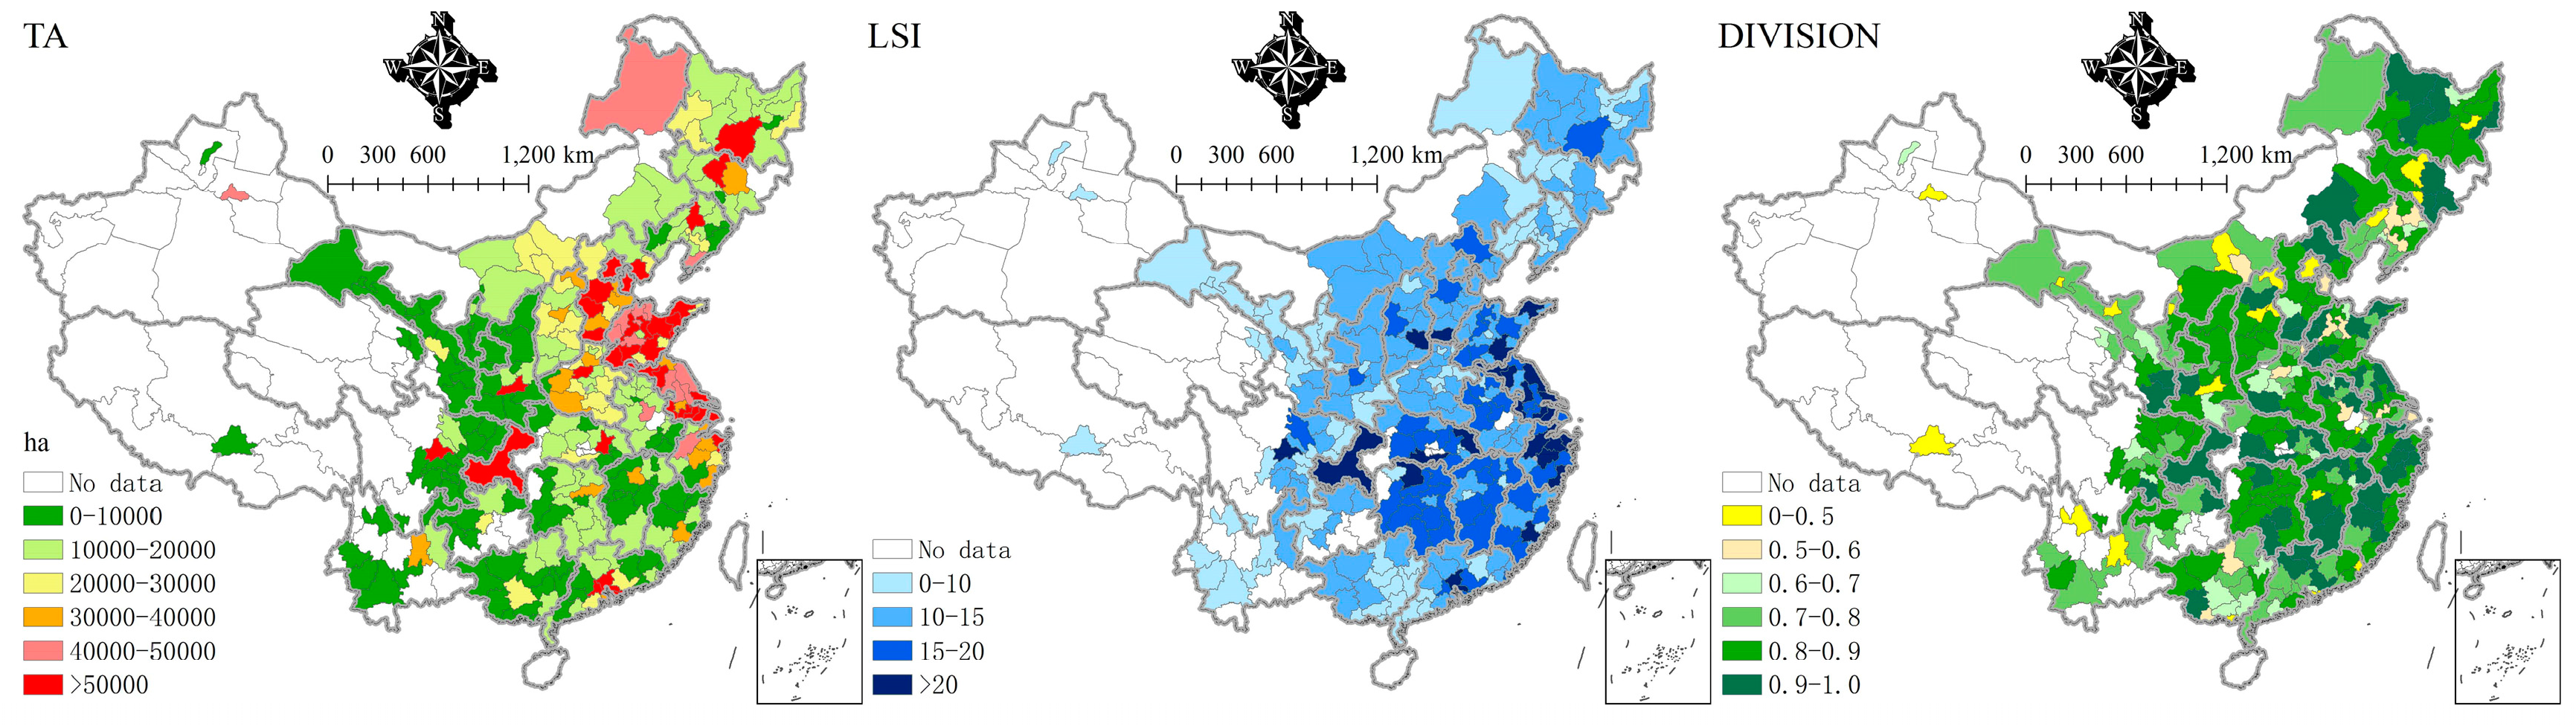
3.1. Spatial Differences of Urban Form

Figure 3 demonstrates the spatial distribution of the three urban form variables of 289 Chinese prefecture-level cities in 2015. TA was found to gradually decrease from the eastern coastal region to Central China, then to West China. Cities located in China’s three major urban agglomerations, i.e., Beijing–Tianjin–Hebei Region, Yangtze River Delta, and Pearl River Delta, had larger TA than other cities. China’s three major urban agglomerations are the country’s fastest-urbanizing region, due to which cities in these regions have larger urban built-up areas. In addition, several cities in Central China and West China standout in TA, including Zhengzhou, Wuhan, Chengdu, Chongqing, and Xian, each of which is either municipality or provincial capital. LSI was found to be larger in the coastal region and the Yangtze River basin, where high-density hydrographic nets exist, indicating that the urban growth of cities in these regions was restricted by natural factors and the geometric shapes of urban built-up areas of these cities were more irregular. The spatial distribution of DIVISION was relatively even, without showing evident cluster. However, it is worth mentioning that the DIVISION values of some cities are quite small, such as Tongling, Urumchi, Haikou, Yinchuan, Taiyuan, and Shenzhen, indicating these cities were likely to have a relatively more compact urban form.

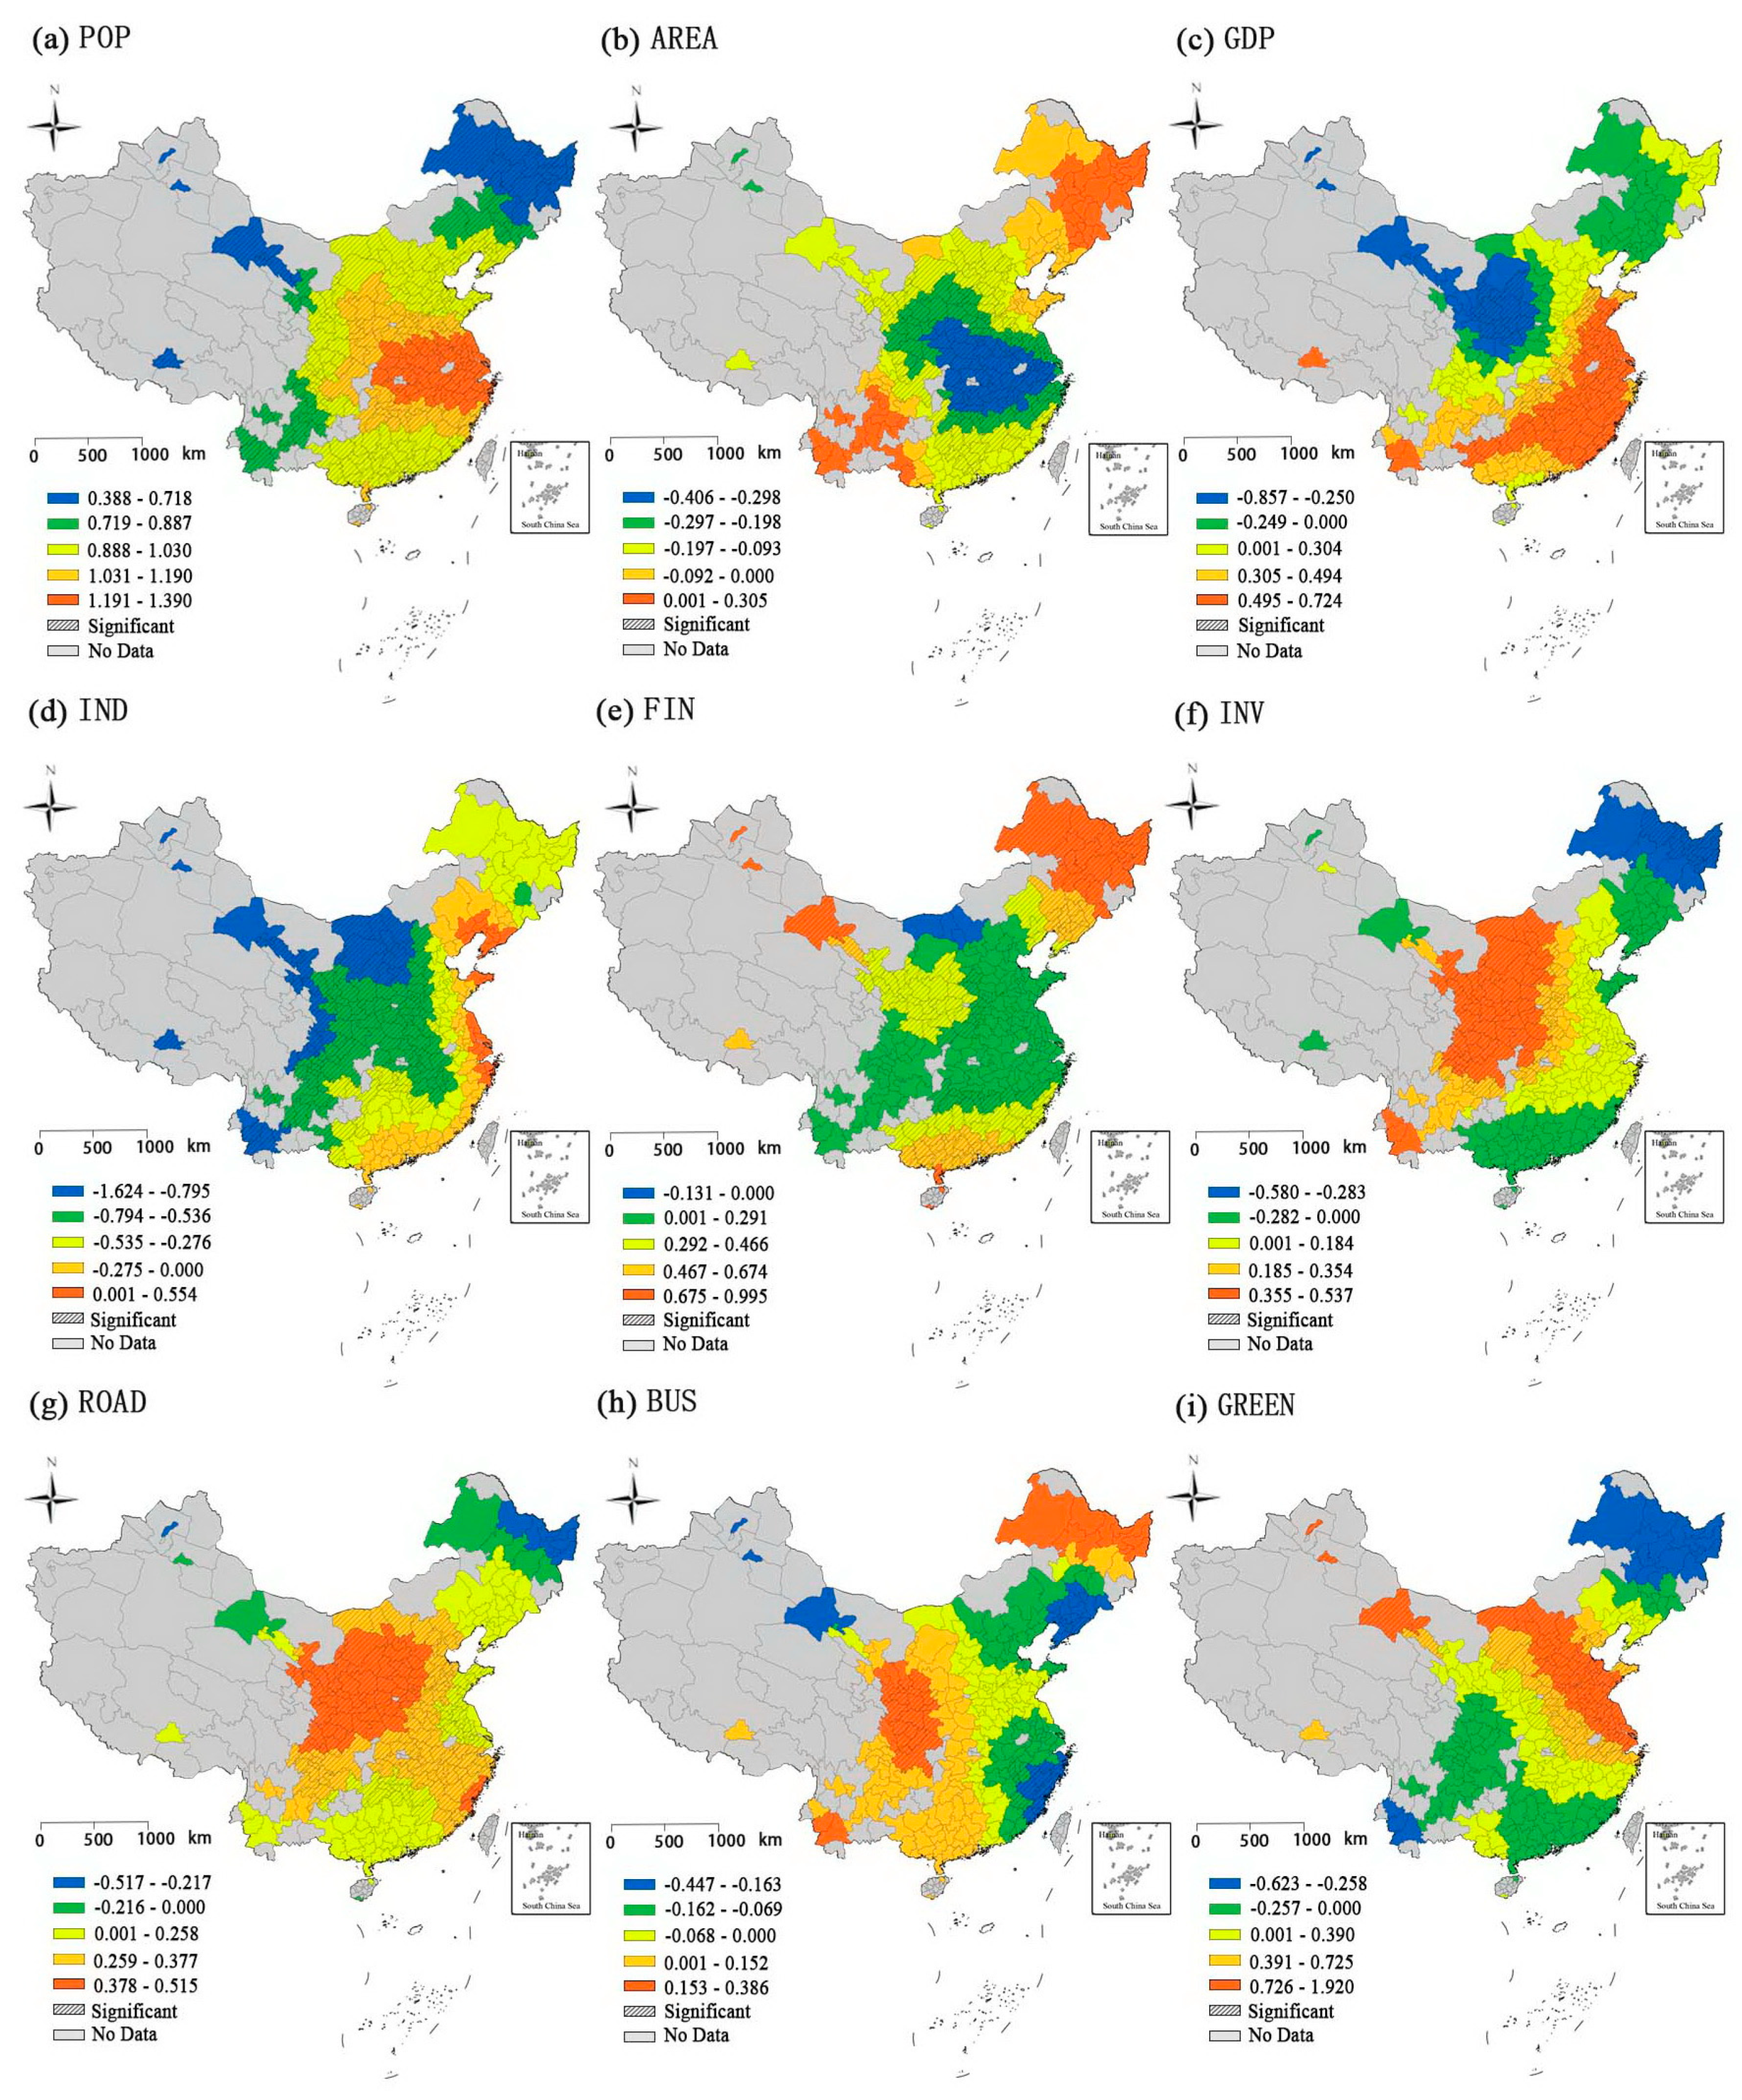
3.2. The Determinants of Urban Form

A variance inflation factor (VIF) test was first run in order to avoid possible multicollinearity among the nine explanatory variables. As shown in Table 3, the VIFs of the nine variables were all found to be less than 10, and the tolerances were all found to be greater than 0.1, indicating that the nine independent variables were not collinear. Therefore, the GWR model was able to be utilized to examine the correlations between urban form and each of the explanatory variables.
Figure 4a–c show the spatial distribution of local R2 derived from the GWR models. As indicated in Figure 4a, local R2 of the TA model in all the cities were greater than 0.82, suggesting that the nine influencing factors explained more than 82% of urban expansion. Figure 4b displays the geographic variation of local R2 of the LSI model, which was greater than 0.5 in almost all the cities. Figure 4c presents the spatial distribution of local R2 of the DIVISION model, which ranges from 0.38 to 0.98.
In order to test the statistical significance and the direction of the regression coefficients for the independent variables, pseudo t-tests were performed. Table 4 reviews the results of the pseudo t-tests, which summarizes the significant correlations between the nine influencing factors and the three urban form indicators derived from the GWR models. It was found that the significance and direction of the correlations between the explanatory variables and dependent variables varied across cities. Moreover, the significant correlations between GDP/INV and TA, and between BUS and TA/DIVISION, were positive for some cities, but were negative for the others. However, no significant correlation between GDP and DIVISION was detected in all the cities.

3.2.1. The Determinants of Urban Expansion

Figure 5 displays the spatial distribution of the regression coefficients for the nine influencing factors derived from the GWR models, with TA being the dependent variable. As indicated in Figure 5a, the coefficient of POP decreased from the center of middle and lower Yangtze River basin, indicating the positive correlation between POP and TA was larger in middle and lower Yangtze River basin, which is the most populous region in China. The correlation between AREA and TA was not significant in the northwest, southwest, and northeast of China, where the administrative area of a prefecture-level city is quite large. GDP was found to have a positive relationship with TA in some cities, while was found to have a negative relationship with TA in some other cities. There was no correlation between IND and TA in the eastern coastal region of China, which is the country’s most developed region. FIN was found to positively correlate with TA in nearly half of the 289 Chines cities. INV was found to have a positive relationship with TA in Central China and West China, which are China’s less developed regions. There was a positive correlation between ROAD and TA in most cities. BUS was found to have a negative relationship with TA in some developed cities, but have a positive relationship with TA in some developing cities.

3.2.2. The Determinants of Urban Shape Irregularity

Figure 6 shows the spatial distribution of the regression coefficients for the nine influencing factors derived from the GWR models, with LSI being the dependent variable. POP was found to have a positive relationship with LSI in most cities. AREA was positively associated with LSI in the Yangtze River basin, the North China Plain, and the Guanzhong Plain, all of which are China’s populous regions. GDP was found to have a negative relationship with LSI in some cities located in northern China. There was no significant correlation between IND and LSI in most cities. FIN was found to have a positive relationship with LSI in more than half of the 289 Chinese cities. A positive correlation between INV and LSI was detected in a few cities. There was a positive relationship between ROAD and LSI in cities situated in East China and Central China, and the extent of the correlation decreased from east to west. BUS was found to have a negative relationship with LSI in cities located in the eastern coastal region of China, which is the most developed region in China. The correlation between GREEN and LSI was not significant in the majority of the 289 cities.

3.2.3. The Determinants of Urban Compactness

Figure 7 shows the spatial distribution of the regression coefficients for the nine influencing factors derived from the GWR models, with DIVISION being the dependent variable. POP was found to have a positive relationship with DIVISION in 42% of the 289 cities. Moreover, the magnitude of the positive correlation between POP and DIVISION decreased from northwest to southeast. AREA was positively correlated with DIVISION in almost all the Chinese cities. No significant correlation between GDP and DIVISION was detected in all the Chinese cities, due to which GDP was not revealed to be a determinant of urban compactness. IND was found to have a positive relationship with DIVISION in 46% of the Chinese cities. A positive correlation between ROAD and DIVISION was detected in cities located in the coastal developed regions. By contrast, BUS was found to have a negative relationship with DIVISION in some northern cities. As indicated in Figure 7e,f,i, DIVISION was found to have a significant relationship with FIN, INV, and GREEN in only a few cities.

4. Discussion

Previous studies generally assumed that the determinants of urban form did not vary across spatial units, while this study addressed the spatial heterogeneity in the determinants of urban form. Our results suggested that evident spatial heterogeneity existed in the determinants of urban form of Chinese cities. For most Chinese cities, population growth was demonstrated to bring about urban expansion, which is consistent with both our expectation and common sense. With the improvement of agricultural productivity, labor force is driven from agriculture to manufacturing and service industry, and increasing rural residents migrate to urban areas, which generates considerable demand for housing and infrastructure and, thus, causes urban expansion [41]. However, the magnitude of the effects of population growth on urban expansion differed across cities. Previous studies generally identified population growth as a negative factor for compact urban development [42], while this hypothesis was not proven in all Chinese cities, indicating that an increased population does not necessarily lead to a less compact urban form. Larger administrative area, we argued, resulted in lower urban compactness in most Chinese cities, a possible explanation for which is that prefecture-level cities with larger administrative areas have more sufficient land resources and are more likely to scatter [43]. A positive correlation between GDP per capita and TA was only found in part of the Chinese cities, which indicated that economic development may be achieved without urban expansion. Moreover, the association between industrialization level and TA was detected in Central China and West China, where the industrialization level was relatively low. However, there was no correlation between industrialization level and TA in China’s eastern coastal region, where the industrialization level was relatively high. This finding seemed to verify the environmental Kuznets curve (EKC) hypothesis, namely, the impact of industrialization on urban expansion first increased and then decreased [44]. The positive correlation between per capita local financial revenue and TA/LSI in many Chines cities revealed the important role local government played in promoting urban expansion and the formation of less regular-shaped urban forms. A positive correlation between per capita fixed investment and TA was identified in less developed cities located in Central China and West China, rather than more developed cites located in East China, demonstrating that fixed investment constituted an important driving force of urban expansion in less developed cities, where fixed investment was mainly made in new area development. Nevertheless, fixed investment may exert inhibitory effects on urban expansion, since fixed investment can be made in urban redevelopment rather than new area development [45]. Both urban road networks and the development of public transit, we argued, were the significant determinants of urban form in some Chinese cities, which provided evidence for the complex urban systems (CUS) theory. Unlike “distance to central business district (CBD)” model, CUS theory identifies connectivity of an urban system network, rather than proximity to CBD, as the key factor generating the clustering of people and businesses. That is to say, firms and residences tend to aggregate in the most well-connected nodes of urban system networks, proximity to which constitutes the strongest source of production externality [46]. By affecting connectivity of an urban system network, the development of urban road networks and public transit can thus exert effects on urban form and structure. Typically, the development of urban road networks and public transit is able to promote the formation of subcenters, such as “edge cities”, shaping decentralized urban form.
The dataset and the methodology of this study have two possible limitations. On the one hand, what this study used was cross-sectional data, which contains relatively few observations and does not have the ability to detect unobserved heterogeneity [47]. Compared with cross-sectional data and time series data, panel data has evident advantages [48]. Firstly, panel datasets can improve the estimation efficiency by reducing the effects of multicollinearity and increasing the degrees of freedom [49]. Secondly, panel datasets are able to control unobserved heterogeneity [50] and, thus, can verify and calculate some indicators that cannot be recognized in pure time series and cross-sectional data models [51]. In order to better address the determinants of urban form, panel data, which can deal with observations from multiple individuals over multiple periods [52], is expected to be used in future studies. On the other hand, it needs to be admitted that urban form consists of multiple aspects and is not limited to urban expansion, urban shape irregularity, and urban compactness. Moreover, landscape metric is not the only measurement to quantify urban form. With the aim of more fully identifying the determinants of urban form, some other methods and indicators are thus expected to be employed in future studies.

5. Conclusion and Policy Implications

Land use change, which constitutes a significant consequence of urbanization, leads to changing urban form. An increasing number of studies devoted to investigating the determinants of urban form, while the majority of them overlooked the possible spatial heterogeneity existing in the determinants of urban form. In order to advance the theoretical understanding of the determinants of urban form, this study attempted to examine the spatial heterogeneity in the determinants of urban form for 289 Chinese prefecture-level cities. Three landscape metrics, i.e., TA, LSI, and DIVISION, were used to measure urban form from the perspective of size, shape irregularity, and compactness, respectively, based on remote sensing land use data. Furthermore, nine influencing factors, which have potential impacts on urban form, were selected as independent variables. In order to address spatial heterogeneity, GWR modeling technique was utilized to examine the correlations between the nine influencing factors and the three urban form variables.
The results of this study demonstrated that the relationships between the urban form indicators and the influencing factors are spatially nonstationary, indicated by clear spatial patterns of parameter estimates obtained from GWR models. In other words, evident spatial heterogeneity existed in the determinants of urban form of Chinese cities. Population growth was found to promote urban expansion in most Chinese cities, since increasing urban residents need more housing and infrastructure. However, the magnitude of the impacts of population growth on urban expansion varied across cities. Population growth was only identified as a negative factor for urban compactness in part of Chinese cities, suggesting population growth does not necessarily result in less compact urban form. It was also found that cities with larger administrative areas were more likely to disperse due to more sufficient land resources. GDP per capita was found to exert a positive effect on urban expansion in not all Chinese cities, indicating that economic development did not have to be achieved at the cost of urban sprawl. In addition, industrialization was demonstrated to have no impact on urban expansion in cities located in the eastern coastal region of China, which were the country’s more developed regions. Per capita local financial revenue was found to be associated with TA and LSI in many Chines cities, revealing the important role China’s local government played in affecting urban form. Fixed investment had a bidirectional impact on urban expansion, and the direction of the impact depended on whether new area development or urban redevelopment was given priority to. The development of urban road networks and public transit affected connectivity of urban system network and thus constituted one of the key determinants of urban form, which supported the CUS theory.
The policy implications emerging from this study lies in shaping sustainable urban form for China’s decision makers and urban planners. On the basis of the above findings, it was suggested that locality-oriented policies should be formulated to control urban expansion and shape regular and compact urban form. First of all, moderate urbanization should be advocated to prevent urban from sprawling and facilitate compact urban development. Moreover, policy instrument, such as urban growth boundaries [53], should be adopted in more and more cites. Last but not the least, for cities where public transit was conducive to shaping sustainable urban form, the development of public transit should be given priority.

Author Contributions

Conceptualization, S.L.; Writing—original draft, S.L.; Writing—review & editing, C.Z. and S.W.; Formal analysis, S.G. and Z.L.

Funding

This research was funded by [National Natural Science Foundation of China] grant number [41601151], [National Social Science Foundation of China] grant number [17BRK010], [Natural Science Foundation of Guangdong Province] grant number [2016A030310149], and [Pearl River S&T Nova Program of Guangzhou] grant number [201806010187].

Conflicts of Interest

The authors declare no conflict of interest.

References

  1. Tsai, Y.-H. Quantifying Urban Form: Compactness versus ‘Sprawl’. Urban Stud. 2005, 42, 141–161. [Google Scholar] [CrossRef]
  2. Clifton, K.; Ewing, R.; Knaap, G.J.; Song, Y. Quantitative analysis of urban form: A multidisciplinary review. J. Urban. Int. Res. Placemak. Urban Sustain. 2008, 1, 17–45. [Google Scholar] [CrossRef]
  3. Lowry, J.H.; Lowry, M.B. Comparing spatial metrics that quantify urban form. Comput. Environ. Urban Syst. 2014, 44, 59–67. [Google Scholar] [CrossRef]
  4. Churchman, A. Disentangling the Concept of Density. J. Plan. Lit. 1999, 13, 389–411. [Google Scholar] [CrossRef]
  5. Galster, G.; Hanson, R.; Ratcliffe, M.R.; Wolman, H.; Coleman, S.; Freihage, J. Wrestling Sprawl to the Ground: Defining and measuring an elusive concept. Hous. Policy Debate 2001, 12, 681–717. [Google Scholar] [CrossRef]
  6. Song, Y.; Knaap, G.-J. Measuring Urban Form: Is Portland Winning the War on Sprawl? J. Am. Plan. Assoc. 2004, 70, 210–225. [Google Scholar] [CrossRef]
  7. Mou, Y.; Song, Y.; Xu, Q.; He, Q.; Hu, A. Influence of Urban-Growth Pattern on Air Quality in China: A Study of 338 Cities. Int. J. Environ. Res. Public Health 2018, 15, 1805. [Google Scholar] [CrossRef] [PubMed]
  8. Holden, E. Ecological footprints and sustainable urban form. J. Hous. Built Environ. 2004, 19, 91–109. [Google Scholar] [CrossRef]
  9. Wang, S.; Liu, X.; Zhou, C.; Hu, J.; Ou, J. Examining the impacts of socioeconomic factors, urban form, and transportation networks on CO2 emissions in China’s megacities. Appl. Energy 2017, 185, 189–200. [Google Scholar] [CrossRef]
  10. Yuan, M.; Song, Y.; Hong, S.J.; Huang, Y.P. Evaluating the effects of compact growth on air quality in already-high-density cities with an integrated land use-transport-emission model: A case study of Xiamen, China. Habitat Int. 2017, 69, 37–47. [Google Scholar] [CrossRef]
  11. Yuan, M.; Song, Y.; Huang, Y.P.; Hong, S.J.; Huang, L.J. Exploring the Association between Urban form and Air Quality in China. J. Plan. Educ. Res. 2018, 38, 413–426. [Google Scholar] [CrossRef]
  12. Zhou, C.; Li, S.; Wang, S. Examining the Impacts of Urban Form on Air Pollution in Developing Countries: A Case Study of China’s Megacities. Int. J. Environ. Res. Public Health 2018, 15, 1565. [Google Scholar] [CrossRef] [PubMed]
  13. Zeng, C.; Song, Y.; He, Q.S.; Liu, Y. Urban-rural income change: Influences of landscape pattern and administrative spatial spillover effect. Appl. Geogr. 2018, 97, 248–262. [Google Scholar] [CrossRef]
  14. Brueckner, J.K. Urban Sprawl: Diagnosis and Remedies. Int. Reg. Sci. Rev. 2000, 23, 160–171. [Google Scholar] [CrossRef]
  15. Song, Y.; Zenou, Y. Property tax and urban sprawl: Theory and implications for US cities. J. Urban Econ. 2006, 60, 519–534. [Google Scholar] [CrossRef] [Green Version]
  16. Ke, S.Z.; Song, Y.; He, M. Determinants of Urban Spatial Scale: Chinese Cities in Transition. Urban Stud. 2009, 46, 2795–2813. [Google Scholar] [CrossRef]
  17. De la Luz Hernández-Flores, M.; Otazo-Sánchez, E.M.; Galeana-Pizaña, M.; Roldán-Cruz, E.I.; Razo-Zárate, R.; González-Ramírez, C.A.; Galindo-Castillo, E.; Gordillo-Martínez, A.J. Urban driving forces and megacity expansion threats. Study case in the Mexico City periphery. Habitat Int. 2017, 64, 109–122. [Google Scholar] [CrossRef]
  18. Silva, P.; Li, L. Mapping Urban Expansion and Exploring Its Driving Forces in the City of Praia, Cape Verde, from 1969 to 2015. Sustainability 2017, 9, 1434. [Google Scholar] [CrossRef]
  19. Xu, Q.; Zheng, X.; Zhang, C. Quantitative Analysis of the Determinants Influencing Urban Expansion: A Case Study in Beijing, China. Sustainability 2018, 10, 1630. [Google Scholar] [CrossRef]
  20. Chen, J.; Gao, J.; Yuan, F.; Wei, Y. Spatial Determinants of Urban Land Expansion in Globalizing Nanjing, China. Sustainability 2016, 8, 868. [Google Scholar] [CrossRef]
  21. Shu, B.; Zhang, H.; Li, Y.; Qu, Y.; Chen, L. Spatiotemporal variation analysis of driving forces of urban land spatial expansion using logistic regression: A case study of port towns in Taicang City, China. Habitat Int. 2014, 43, 181–190. [Google Scholar] [CrossRef]
  22. Ma, Y.; Xu, R. Remote sensing monitoring and driving force analysis of urban expansion in Guangzhou City, China. Habitat Int. 2010, 34, 228–235. [Google Scholar] [CrossRef]
  23. Tian, L.; Chen, J.; Yu, S.X. Coupled dynamics of urban landscape pattern and socioeconomic drivers in Shenzhen, China. Landsc. Ecol. 2014, 29, 715–727. [Google Scholar] [CrossRef]
  24. Liao, F.H.F.; Wei, Y.H.D. Modeling determinants of urban growth in Dongguan, China: A spatial logistic approach. Stoch. Environ. Res. Risk Assess. 2012, 28, 801–816. [Google Scholar] [CrossRef]
  25. Yuan, M.; Song, Y.; Guo, L. Exploring Determinants of Urban Form in China through an Empirical Study among 115 Cities. Sustainability 2018, 10, 3648. [Google Scholar] [CrossRef]
  26. Feng, Y.; Liu, Y.; Tong, X. Spatiotemporal variation of landscape patterns and their spatial determinants in Shanghai, China. Ecol. Indic. 2018, 87, 22–32. [Google Scholar] [CrossRef]
  27. Zhang, Z.H.; Su, S.L.; Xiao, R.; Jiang, D.W.; Wu, J.P. Identifying determinants of urban growth from a multi-scale perspective: A case study of the urban agglomeration around Hangzhou Bay, China. Appl. Geogr. 2013, 45, 193–202. [Google Scholar] [CrossRef]
  28. Gao, J.; Li, S. Detecting spatially non-stationary and scale-dependent relationships between urban landscape fragmentation and related factors using Geographically Weighted Regression. Appl. Geogr. 2011, 31, 292–302. [Google Scholar] [CrossRef]
  29. Zhang, L.; Wei, Y.; Meng, R. Spatiotemporal Dynamics and Spatial Determinants of Urban Growth in Suzhou, China. Sustainability 2017, 9, 393. [Google Scholar] [CrossRef]
  30. Tan, R.; Liu, Y.; Liu, Y.; He, Q.; Ming, L.; Tang, S. Urban growth and its determinants across the Wuhan urban agglomeration, central China. Habitat Int. 2014, 44, 268–281. [Google Scholar] [CrossRef]
  31. Yu, X.; Ng, C. An integrated evaluation of landscape change using remote sensing and landscape metrics: A case study of Panyu, Guangzhou. Int. J. Remote Sens. 2008, 27, 1075–1092. [Google Scholar] [CrossRef]
  32. Fang, C.; Wang, S.; Li, G. Changing urban forms and carbon dioxide emissions in China: A case study of 30 provincial capital cities. Appl. Energy 2015, 158, 519–531. [Google Scholar] [CrossRef] [Green Version]
  33. Forman, R.; Godron, M. Landscape Ecology; Wiley: New York, NY, USA, 1986. [Google Scholar]
  34. Bereitschaft, B.; Debbage, K. Urban form, air pollution, and CO2 emissions in large U.S. metropolitan areas. Prof. Geogr. 2013, 65, 612–635. [Google Scholar] [CrossRef]
  35. Li, S.; Zhou, C.; Wang, S.; Hu, J. Dose urban landscape pattern affect CO2 emission efficiency? Empirical evidence from megacities in China. J. Clean. Prod. 2018, 203, 164–178. [Google Scholar] [CrossRef]
  36. Hastie, T.; Tibshirani, R. Varying-coefficient models. J. R. Stat. Soc. Ser. B Methodol. 1993, 55, 757–796. [Google Scholar] [CrossRef]
  37. Tenerelli, P.; Demšar, U.; Luque, S. Crowdsourcing indicators for cultural ecosystem services: A geographically weighted approach for mountain landscapes. Ecol. Indic. 2016, 64, 237–248. [Google Scholar] [CrossRef] [Green Version]
  38. Tobler, W.R. A computer movie simulation urban growth in the Detroit region. Econ. Geogr. 1970, 46, 234–240. [Google Scholar] [CrossRef]
  39. Gilbert, A.; Chakraborty, J. Using geographically weighted regression for environmental justice analysis: Cumulative cancer risks from air toxics in Florida. Soc. Sci. Res. 2011, 40, 273–286. [Google Scholar] [CrossRef]
  40. Brunsdon, C.; Fotheringham, A.S.; Charlton, M. Spatial nonstationarity and autoregressive models. Environ. Plan. A 1998, 30, 957–973. [Google Scholar] [CrossRef]
  41. Malykhin, N.; Ushchev, P. How market interactions shape the city structure. Reg. Sci. Urban Econ. 2018, 71, 122–136. [Google Scholar] [CrossRef]
  42. Li, S.; Zhou, C. What are the impacts of demographic structure on CO2 emissions? A regional analysis in China via heterogeneous panel estimates. Sci. Total Environ. 2019, 650 (Pt 2), 2021–2031. [Google Scholar] [CrossRef]
  43. Wang, S.; Fang, C.; Wang, Y.; Huang, Y.; Ma, H. Quantifying the relationship between urban development intensity and carbon dioxide emissions using a panel data analysis. Ecol. Indic. 2015, 49, 121–131. [Google Scholar] [CrossRef]
  44. Lambin, E.F.; Meyfroidt, P. Land use transitions: Socio-ecological feedback versus socio-economic change. Land Use Policy 2010, 27, 108–118. [Google Scholar] [CrossRef]
  45. Deal, B.; Pan, H.; Timm, S.; Pallathucheril, V. The role of multidirectional temporal analysis in scenario planning exercises and Planning Support Systems. Comput. Environ. Urban Syst. 2017, 64, 91–102. [Google Scholar] [CrossRef]
  46. Pan, H.; Deal, B.; Chen, Y.; Hewings, G. A Reassessment of urban structure and land-use patterns: Distance to CBD or network-based?—Evidence from Chicago. Reg. Sci. Urban Econ. 2018, 70, 215–228. [Google Scholar] [CrossRef]
  47. Wang, S.; Li, Q.; Fang, C.; Zhou, C. The relationship between economic growth, energy consumption, and CO2 emissions: Empirical evidence from China. Sci. Total Environ. 2016, 542 (Pt A), 360–371. [Google Scholar] [CrossRef] [PubMed]
  48. Wang, S.; Fang, C.; Wang, Y. Spatiotemporal variations of energy-related CO2 emissions in China and its influencing factors: An empirical analysis based on provincial panel data. Renew. Sustain. Energy Rev. 2016, 55, 505–515. [Google Scholar] [CrossRef]
  49. Al-mulali, U. Factors affecting CO2 emission in the Middle East: A panel data analysis. Energy 2012, 44, 564–569. [Google Scholar] [CrossRef]
  50. Du, L.; Wei, C.; Cai, S. Economic development and carbon dioxide emissions in China: Provincial panel data analysis. China Econ. Rev. 2012, 23, 371–384. [Google Scholar] [CrossRef]
  51. Ahn, S.C.; Schmidt, P. Efficient estimation of models for dynamic panel data. J. Econom. 1995, 68, 5–27. [Google Scholar] [CrossRef]
  52. Chen, Y.; Li, X.; Zheng, Y.; Guan, Y.; Liu, X. Estimating the relationship between urban forms and energy consumption: A case study in the Pearl River Delta, 2005–2008. Landsc. Urban Plan. 2011, 102, 33–42. [Google Scholar] [CrossRef]
  53. Waddell, P. UrbanSim: Modeling Urban Development for Land Use, Transportation, and Environmental Planning. J. Am. Plan. Assoc. 2007, 68, 297–314. [Google Scholar] [CrossRef]
Figure 1. Land use pattern of China in 2015.
Sustainability 11 00479 g001
Figure 2. Box charts of the nine influencing factors with scatter plot and distribution overlay.
Sustainability 11 00479 g002
Figure 3. Spatial distribution of the three urban form variables in China (2015).
Sustainability 11 00479 g003
Figure 4. Local R2 derived from the geographically weighted regression (GWR) models with different dependent variables: (a) TA; (b) LSI; (c) DIVISION.
Sustainability 11 00479 g004
Figure 5. Spatial distribution of the regression coefficients for the nine influencing factors (TA model): (a) POP; (b) AREA; (c) GDP; (d) IND; (e) FIN; (f) INV; (g) ROAD; (h) BUS; (i) GREEN.
Sustainability 11 00479 g005
Figure 6. Spatial distribution of the regression coefficients for the nine influencing factors (LSI model): (a) POP; (b) AREA; (c) GDP; (d) IND; (e) FIN; (f) INV; (g) ROAD; (h) BUS; (i) GREEN.
Sustainability 11 00479 g006
Figure 7. Spatial distribution of the regression coefficients for the nine influencing factors (DIVISION model): (a) POP; (b) AREA; (c) GDP; (d) IND; (e) FIN; (f) INV; (g) ROAD; (h) BUS; (i) GREEN.
Sustainability 11 00479 g007
Table 1. Detailed description of the three landscape metrics.
Landscape MetricsEquationDescription
Total landscape area
(TA)
TA = j = 1 n a j aj represents the area of patch j, n refers to the number of patches.
Landscape shape index
(LSI)
LSI = 0.25 E * TA E* represents total length of edge in landscape, TA refers to the total area of urban land.
Landscape division index
(DIVISION)
DIVISION = 1 i = 1 m j = 1 n ( a i j TA ) 2 aij represents the area of patch ij, TA refers to the total area of urban land.
Table 2. Descriptive statistics of the variables analyzed in this study.
Variable NameAbbreviationUnitMeanMedianMaximumMinimumStd. Dev.
Total areaTAha22,76713,391175,075139124,835
Landscape shape indexLSI-12.7011.8533.803.594.83
Landscape division indexDIVISION-0.770.820.960.090.17
PopulationPOP104 persons446.71378.753371.8420.25318.75
Administrative areaAREAkm216,56312,236252,7771,20121,735
Per capita gross domestic product GDPyuan51,04943,853207,16310,98729,487
Industrialization levelIND%46.6448.0371.4515.179.56
Per capita local financial revenueFINyuan5270309776,8157417006
Per capita fixed investmentINVyuan42,79536,527173,987679926,634
Per capita urban road areaROADm213.2711.70105.021.249.49
Number of public transport vehicles per 10,000 personsBUSunit8.856.9489.341.047.78
Green coverage ratioGREEN%38.8240.3261.582.717.24
Table 3. Collinearity inspection of the nine explanatory variables.
VIFTolerance
POP1.1670.857
AREA1.3840.722
GDP6.0340.166
IND1.4570.686
FIN6.1580.162
INV3.9770.251
ROAD1.9450.514
BUS2.0450.489
GREEN1.2810.781
Table 4. Summary of the significant1 correlations between the nine influencing factors and the three urban form indicators derived from the geographically weighted regression (GWR) models.
Explanatory VariableTALSIDIVISION
POP99.3%294.8%41.9%
(+)(+)(+)
AREA55.7%43.9%99.3%
-(+)(+)
GDP44.6%26.0%0
(+: 88.4%, −: 11.6%)--
IND48.1%1.7%46.0%
-(+)(+)
FIN49.1%61.9%2.1%
(+)(+)-
INV30.8%8.3%3.5%
(+: 92.1%, −: 7.9%)(+)-
ROAD68.2%51.9%23.2%
(+)(+)(+)
BUS11.4%21.5%26.6%
(+:54.5%, −: 45.5%)-(+:1.3%, −: 98.7%)
GREEN38.4%1.7%1.0%
(+)(+)(+)
1 Sig. (P < 0.05). 2 The percentage of cities where the correlation between the determinants and urban form is significant.

