Study on Urban Efficiency Measurement and Spatiotemporal Evolution of Cities in Northwest China Based on the DEA–Malmquist Model

Abstract
:1. Introduction
2. Materials and Methods
2.1. Methods
2.1.1. DEA Model
2.1.2. Malmquist Model
2.2. Data Collection and Processing
3. Results
3.1. Urban Efficiency Values of Cities in Northwest China
3.2. Urban Efficiency Evaluation of Cities in Northwest China
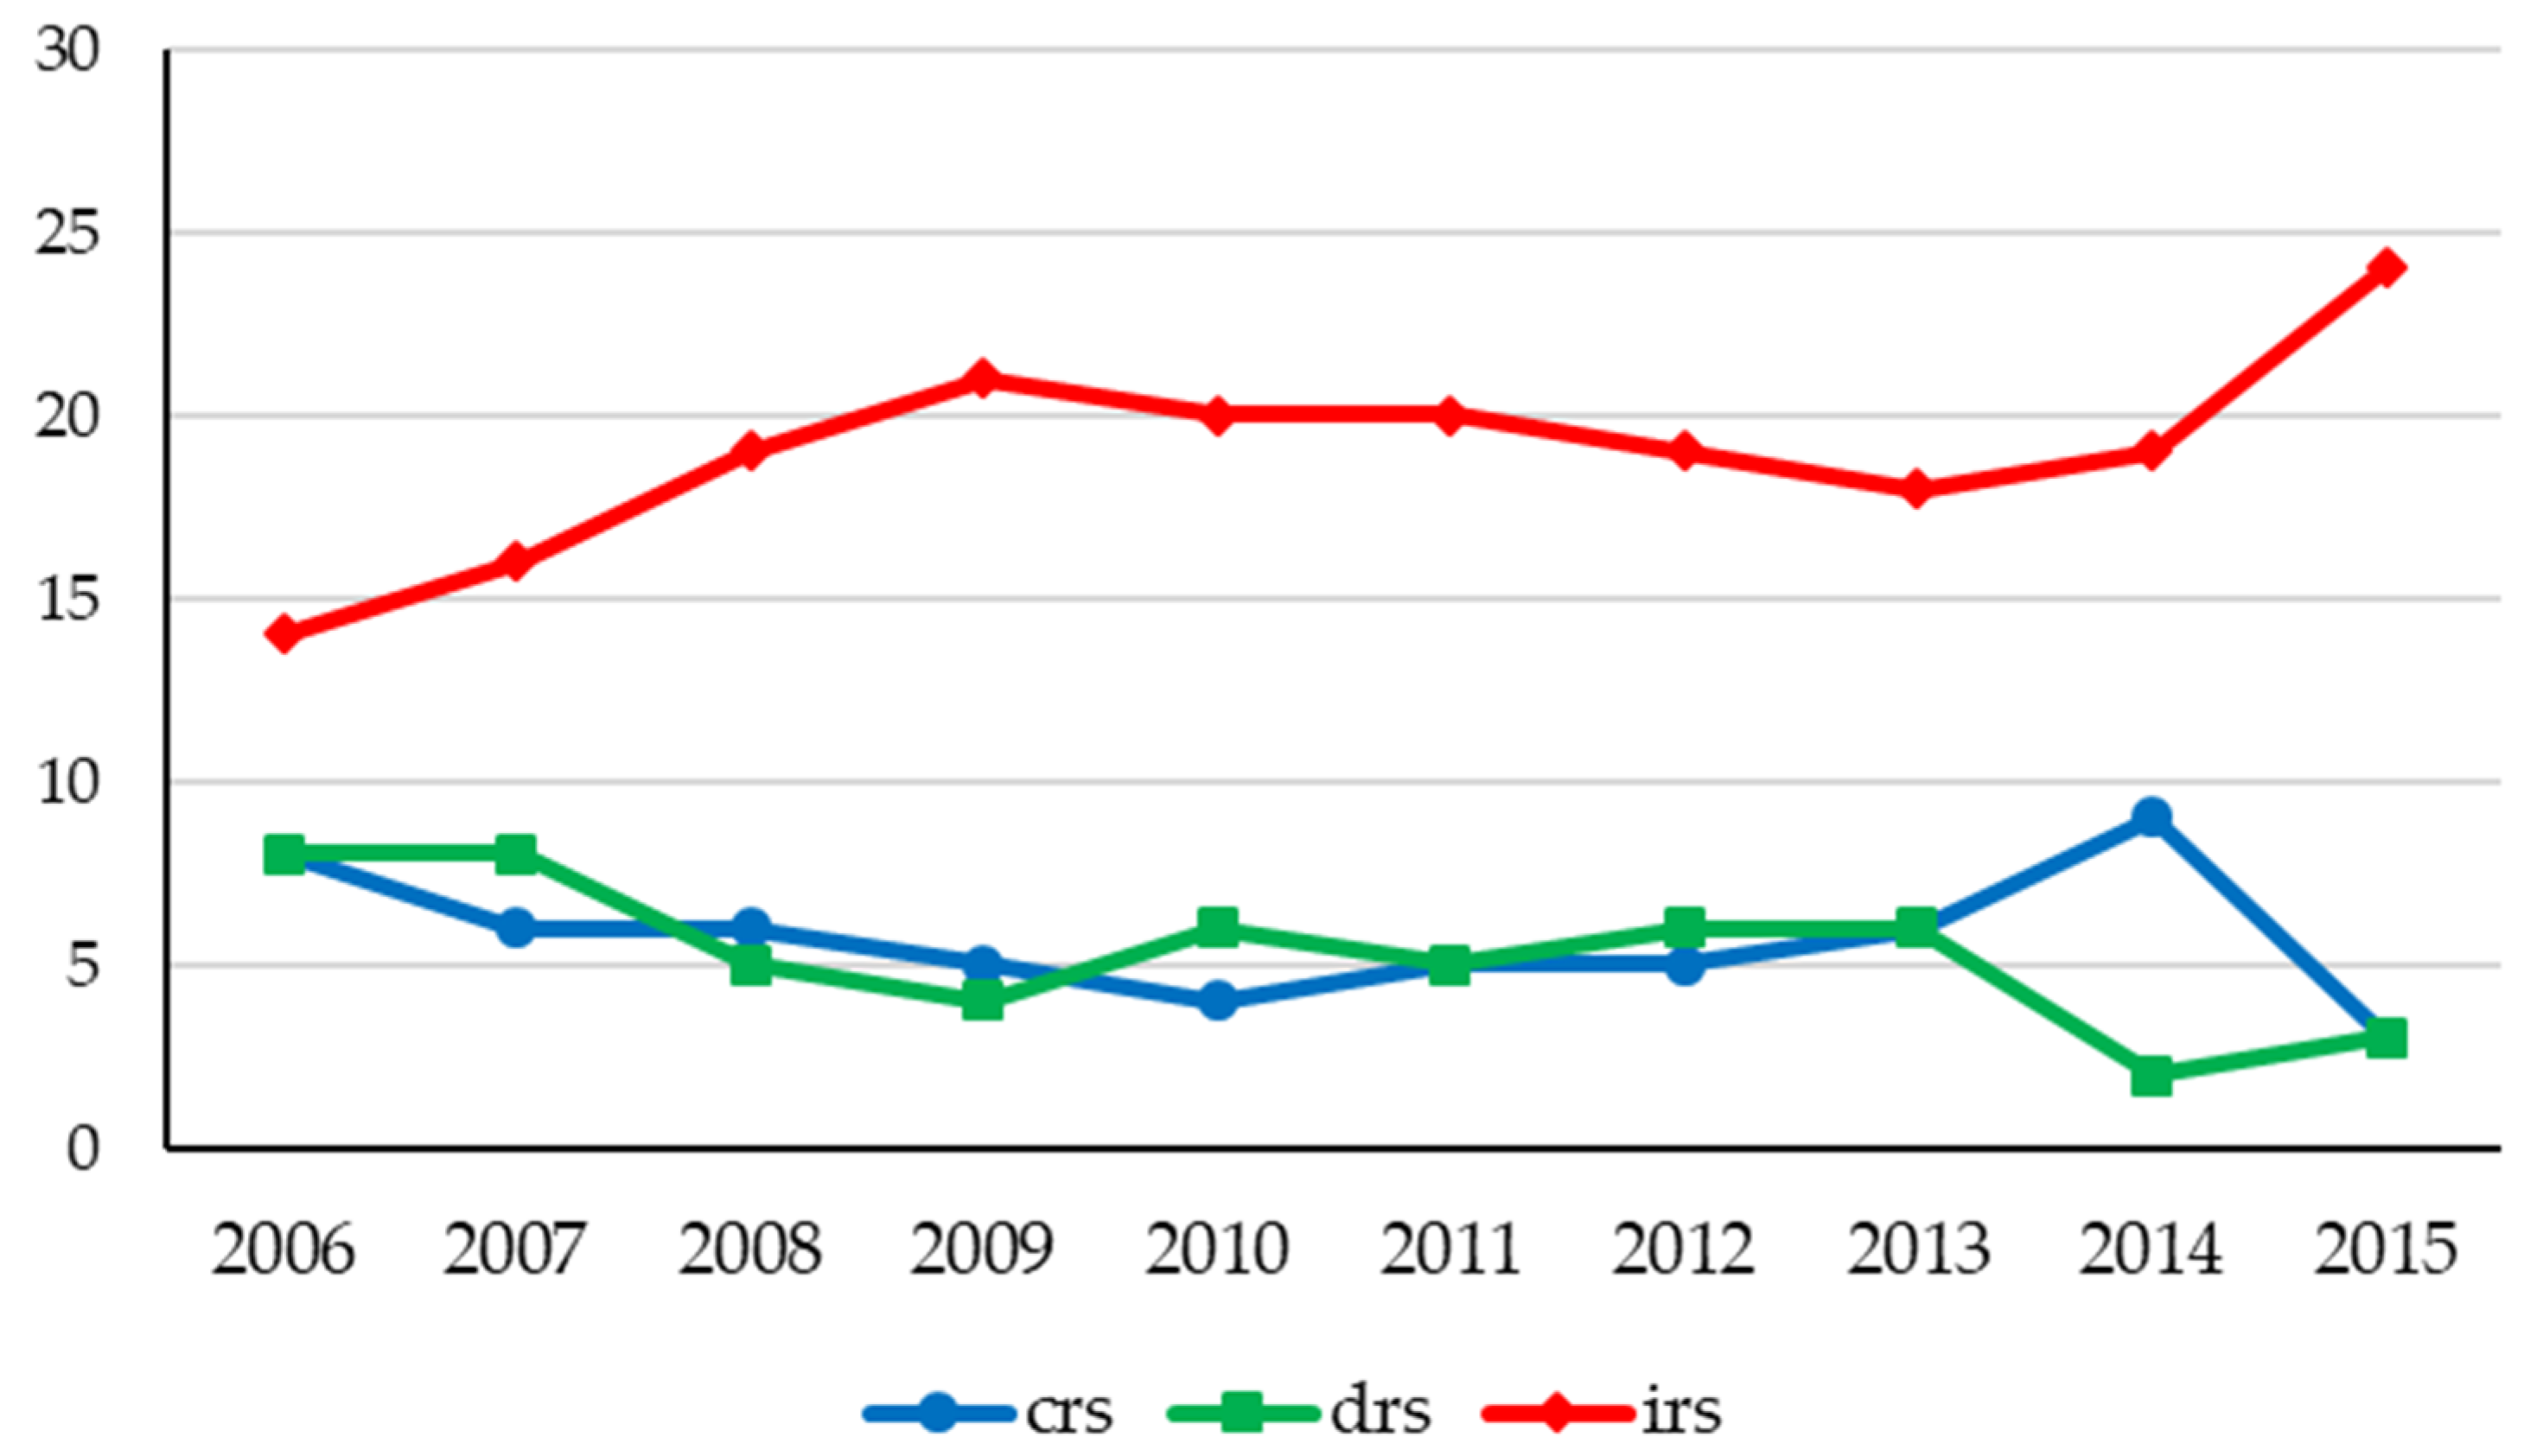
3.3. Returns to Scale of Cities in Northwest China
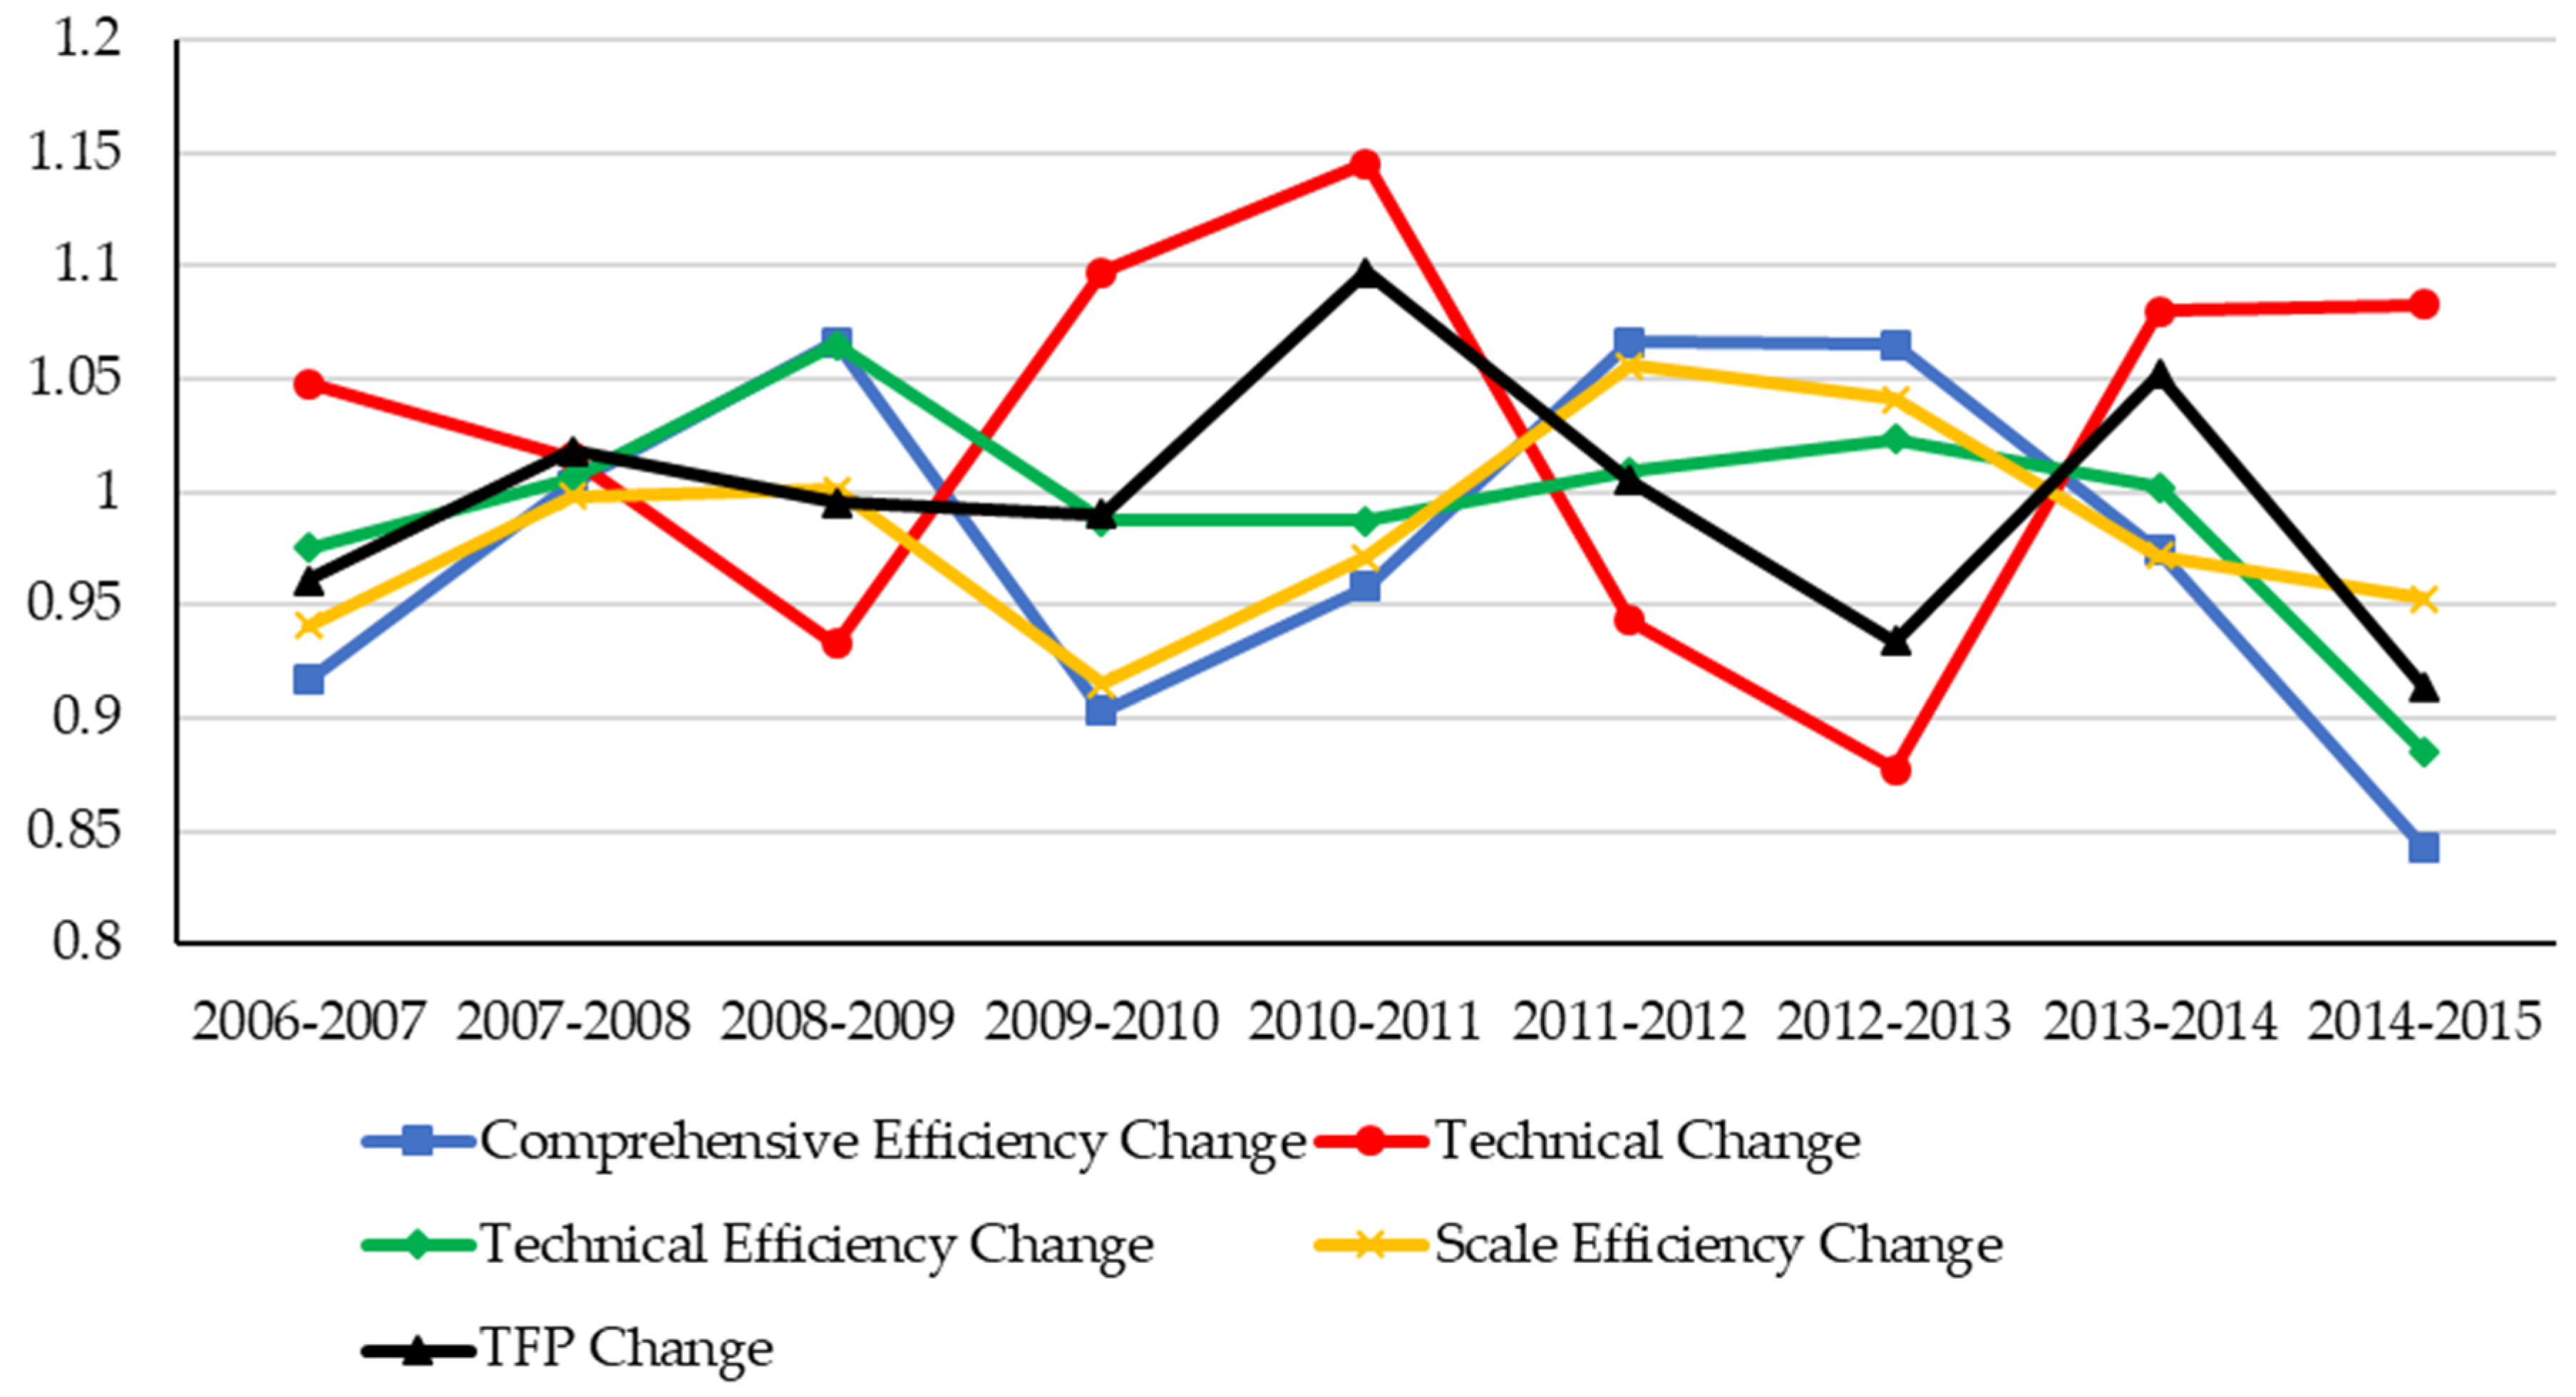
3.4. Spatiotemporal Evolution of Cities in Northwest China
4. Conclusions and Discussion
Author Contributions
Funding
Conflicts of Interest
References
- Xu, X.; Chen, X.; Cui, L. The efficiencies and their changes of cities in Gansu Province based on DEA and Malmquist index models. J. Arid Land Resour. Environ. 2013, 9, 12–17. [Google Scholar]
- Chen, X.; Li, J.; Chu, J. Urban efficiency evaluation of Wanjiang City Belt based on DEA-ESDA. J. East China Econ. Manag. 2015, 12, 51–56. [Google Scholar]
- Guo, T.; Xu, Y.; Wang, Z. The analyses of metropolitan efficiencies and their changes in China based on DEA and Malmquist index models. J. Acta Geogr. Sin. 2009, 4, 408–416. [Google Scholar]
- Deng, C. Spatial-temporal evolution analysis on interactive coupling among tourism, urbanization and ecological environment in Shanxi Province. J. Areal Res. Dev. 2018, 3, 85–89. [Google Scholar]
- Yan, Y.; Li, H.; Liu, Z. Study on the spatial and temporal differentiation urban economic efficiency and its influencing factors in China. J. Urban Stud. 2017, 9, 42–48. [Google Scholar]
- Gao, X. Researches on the characteristics of urban comprehensive efficiency’s difference of Henan Province. J. Areal Res. Dev. 2010, 2, 76–80. [Google Scholar]
- Solow, R.M. Technical change and the aggregate production function. J. Rev. Econ. Stat. 1957, 3, 554–562. [Google Scholar] [CrossRef]
- Alonso, W. The economics of urban size. J. Pap. Reg. Sci. 1971, 1, 67–83. [Google Scholar]
- Prudhomme, R.; Lee, C.W. Size, sprawl, speed and the efficiency of cities. J. Urban Stud. 2014, 11, 1849–1858. [Google Scholar] [CrossRef]
- Pan, J.; Yin, J. Analysis on urban development efficiency of provincial capital or above in China based on DEA-ESDA. J. Northwest Norm. Univ. (Natl. Sci.) 2012, 6, 99–104. [Google Scholar]
- Di, Q.; Meng, X. Spatial and temporal disparities of urban development efficiency of coastal cities in China based on undesirable outputs. Sci. Geogr. Sin. 2017, 6, 807–816. [Google Scholar]
- Luo, X.; Jin, Y.; Wang, C. Research on the green development efficiency of resource-based cities in central China in terms of transformation and upgrading. J. Southwest Jiaotong Univ. (Soc. Sci.) 2017, 6, 77–83. [Google Scholar]
- Li, L.; Liu, B.; Liu, W.; Chiu, Y. Efficiency evaluation of the regional high-tech industry in China: A new framework based on meta-frontier dynamic DEA analysis. J. Socio-Econ. Plan. Sci. 2017, 60, 24–33. [Google Scholar] [CrossRef]
- Wang, S.; Zhang, J.; Fan, F.; Lu, F.; Yang, L. The symbiosis of scientific and technological innovation efficiency and economic efficiency in China-An analysis based on data envelopment analysis and logistic model. Technol. Anal. Strateg. Manag. 2019, 1, 67–80. [Google Scholar] [CrossRef]
- Ren, Y.; Li, H.; Shen, L.; Zhang, Y.; Chen, Y.; Wang, J. What is the efficiency of fast urbanization? A China study. Sustainability 2018, 9, 3180. [Google Scholar] [CrossRef]
- Charnes, A.; Cooper, W.W.; Rhodes, E. Measuring the efficiency of decision making units. Eur. J. Oper. Res. 1978, 2, 429–444. [Google Scholar] [CrossRef]
- Piao, S.; Li, J. Spatial-temporal differences of regional environmental efficiency in China based on super efficiency DEA model. J. Arid Land Res. Environ. 2018, 4, 1–6. [Google Scholar]
- Macmilan, W.D. The estimation and application of multi-regional economic planning models using data envelopment analysis. J. Pap. Reg. Sci. 1986, 1, 41–57. [Google Scholar] [CrossRef]
- Charnes, A.; Cooper, W.W.; Li, S. Using data envelopment analysis to evaluate efficiency in the economic performance of Chinese cities. J. Socio-Econ. Plan. Sci. 1989, 6, 325–344. [Google Scholar] [CrossRef]
- Wei, Q. Data envelopment analysis (DEA). J. Chin. Sci. Bull. 2000, 17, 1793–1808. [Google Scholar]
- Pan, J.; Yin, J. Evaluation of coordinative development efficiency of urban and rural areas and analysis of its spatial difference in Gansu based on DEA-ESDA. J. Econ. Geogr. 2011, 9, 1439–1444. [Google Scholar]
- Yin, J.; Tan, Q.; Wu, X. Efficiency of urban-rural integration and its spatial spillover effect in Jiangsu Province. J. China Agric. Res. Reg. Plan. 2018, 1, 176–182. [Google Scholar]
- Liu, X.; Jie, X. Evaluation of China’s regional inclusive innovation efficiency based on factor analysis and Malmquist index. J. Macroecon. 2018, 2, 140–148. [Google Scholar]
- Lu, T.; Zhou, J. Decomposition method of Malmquist index based on production efficiency change of input factors. J. Stat. Decis. 2010, 17, 18–20. [Google Scholar]
- Wu, B. The change of urban production efficiency and its influencing factors in China. J. Soc. Sci. Xinjiang 2017, 6, 38–49. [Google Scholar]
- Li, J.; Li, P. Analysis of urban productivity and influencing factors in three northeast provinces: A study based on the three-element input SFA model. J. Econ. Surv. 2018, 1, 14–21. [Google Scholar]
- Zhang, J.; Liu, J. Urban efficiency and its spillover effects: Based on the analysis of 34 cities in Northeast China. J. Econ. Geogr. 2011, 4, 578–590. [Google Scholar]
- Li, X.; Xu, X.; Chen, H. Temporal and spatial changes of urban efficiency in the 1990s. J. Acta Geogr. Sin. 2005, 4, 615–624. [Google Scholar]
- Li, Q.; Sun, Y.; Cui, Y. Evaluation on the infrastructure investment efficiency of Beijing-Tianjin-Hebei based on the DEA method. J. Arid Land Res. Environ. 2016, 2, 26–30. [Google Scholar]
- Pan, J.; Yin, J. Analysis on the urban development efficiency of cities at prefecture level or above in China based on DEA-ESDA. J. Econ. Geogr. 2012, 12, 53–60. [Google Scholar]

| Indicator Attribute | Variable | Indicator Meaning | Evaluation Purpose |
|---|---|---|---|
| Input | X1 | Urban built-up area | Land |
| X2 | Fixed assets investment | Capital | |
| X3 | Total number of employees | Labor | |
| X4 | Investment in R&D and education | Science and education | |
| X5 | Postal service volume | Information | |
| Output | Y1 | Regional GDP | Economic aggregate |
| Decision-Making Unit (DMU) | 2006 | 2007 | 2008 | 2009 | 2010 | 2011 | 2012 | 2013 | 2014 | 2015 | Average Value |
|---|---|---|---|---|---|---|---|---|---|---|---|
| Xi’an | 0.804 | 0.905 | 0.879 | 1.000 | 0.953 | 0.909 | 0.833 | 0.901 | 1.000 | 0.493 | 0.8677 |
| Tongchuan | 0.666 | 0.564 | 0.726 | 0.633 | 0.904 | 0.798 | 0.775 | 0.861 | 0.798 | 1.000 | 0.7725 |
| Baoji | 0.848 | 0.860 | 0.626 | 0.791 | 0.716 | 0.694 | 0.728 | 0.803 | 0.898 | 0.694 | 0.7658 |
| Xianyang | 0.755 | 0.789 | 0.802 | 0.831 | 0.740 | 0.750 | 0.756 | 0.921 | 1.000 | 0.716 | 0.8060 |
| Weinan | 1.000 | 0.890 | 0.693 | 0.804 | 0.653 | 0.640 | 0.582 | 0.661 | 0.688 | 0.503 | 0.7114 |
| Yan’an | 1.000 | 1.000 | 1.000 | 1.000 | 1.000 | 1.000 | 1.000 | 1.000 | 1.000 | 0.813 | 0.9813 |
| Hanzhong | 0.985 | 1.000 | 0.890 | 0.950 | 0.775 | 0.772 | 0.783 | 0.823 | 0.668 | 0.619 | 0.8265 |
| Yulin | 0.681 | 1.000 | 1.000 | 1.000 | 1.000 | 1.000 | 1.000 | 1.000 | 1.000 | 1.000 | 0.9681 |
| Ankang | 0.783 | 0.550 | 0.510 | 0.582 | 0.476 | 0.541 | 0.664 | 0.750 | 0.577 | 0.680 | 0.6113 |
| Shangluo | 0.584 | 0.430 | 0.459 | 0.586 | 0.523 | 0.639 | 0.618 | 0.649 | 0.567 | 0.585 | 0.5640 |
| Lanzhou | 0.729 | 0.563 | 0.692 | 0.669 | 0.578 | 0.666 | 0.725 | 0.836 | 0.872 | 0.503 | 0.6833 |
| Jiayuguan | 1.000 | 1.000 | 1.000 | 1.000 | 1.000 | 1.000 | 1.000 | 1.000 | 1.000 | 0.570 | 0.9570 |
| Jinchang | 1.000 | 1.000 | 1.000 | 0.916 | 0.919 | 0.799 | 0.762 | 0.884 | 0.916 | 0.391 | 0.8587 |
| Baiyin | 0.778 | 0.574 | 0.775 | 0.654 | 0.536 | 0.488 | 0.568 | 0.650 | 0.531 | 0.396 | 0.5950 |
| Tianshui | 0.708 | 0.525 | 0.564 | 0.591 | 0.487 | 0.435 | 1.000 | 0.558 | 0.418 | 0.397 | 0.5683 |
| Wuwei | 0.804 | 0.748 | 0.687 | 0.669 | 0.569 | 0.422 | 0.503 | 0.535 | 0.569 | 0.514 | 0.6020 |
| Zhangye | 0.711 | 0.644 | 0.768 | 0.788 | 0.572 | 0.477 | 0.554 | 0.717 | 0.531 | 0.516 | 0.6278 |
| Pingliang | 0.646 | 0.427 | 0.479 | 0.439 | 0.535 | 0.420 | 0.336 | 0.410 | 0.371 | 0.304 | 0.4367 |
| Jiuquan | 0.750 | 0.774 | 0.624 | 0.917 | 0.867 | 0.908 | 0.997 | 0.902 | 1.000 | 1.000 | 0.8739 |
| Qingyang | 0.774 | 0.747 | 0.672 | 0.847 | 0.562 | 0.565 | 0.858 | 0.770 | 0.764 | 0.740 | 0.7299 |
| Dingxi | 0.651 | 0.535 | 0.468 | 0.507 | 0.366 | 0.293 | 0.295 | 0.297 | 0.304 | 0.312 | 0.4028 |
| Longnan | 1.000 | 0.986 | 0.568 | 0.635 | 0.421 | 0.346 | 0.443 | 0.464 | 0.449 | 0.550 | 0.5862 |
| Xining | 0.715 | 0.620 | 0.680 | 0.881 | 0.591 | 0.644 | 0.585 | 0.756 | 0.784 | 0.527 | 0.6783 |
| Yinchuan | 0.582 | 0.552 | 0.699 | 0.766 | 0.941 | 0.833 | 0.960 | 0.968 | 1.000 | 0.424 | 0.7725 |
| Shizuishan | 0.602 | 0.697 | 0.727 | 0.822 | 0.674 | 0.743 | 0.740 | 0.891 | 1.000 | 0.840 | 0.7736 |
| Wuzhong | 0.787 | 0.633 | 0.509 | 0.736 | 0.702 | 0.495 | 0.525 | 0.556 | 0.591 | 0.667 | 0.6201 |
| Guyuan | 0.433 | 0.372 | 0.501 | 0.447 | 0.576 | 0.497 | 0.617 | 0.654 | 0.675 | 0.770 | 0.5542 |
| Zhongwei | 0.497 | 0.586 | 0.598 | 0.689 | 0.604 | 0.576 | 0.559 | 0.658 | 0.674 | 0.769 | 0.6210 |
| Urumqi | 1.000 | 0.735 | 1.000 | 0.757 | 0.688 | 1.000 | 0.740 | 0.835 | 0.777 | 0.666 | 0.8198 |
| Karamay | 1.000 | 1.000 | 1.000 | 1.000 | 1.000 | 1.000 | 1.000 | 1.000 | 1.000 | 0.996 | 0.9996 |
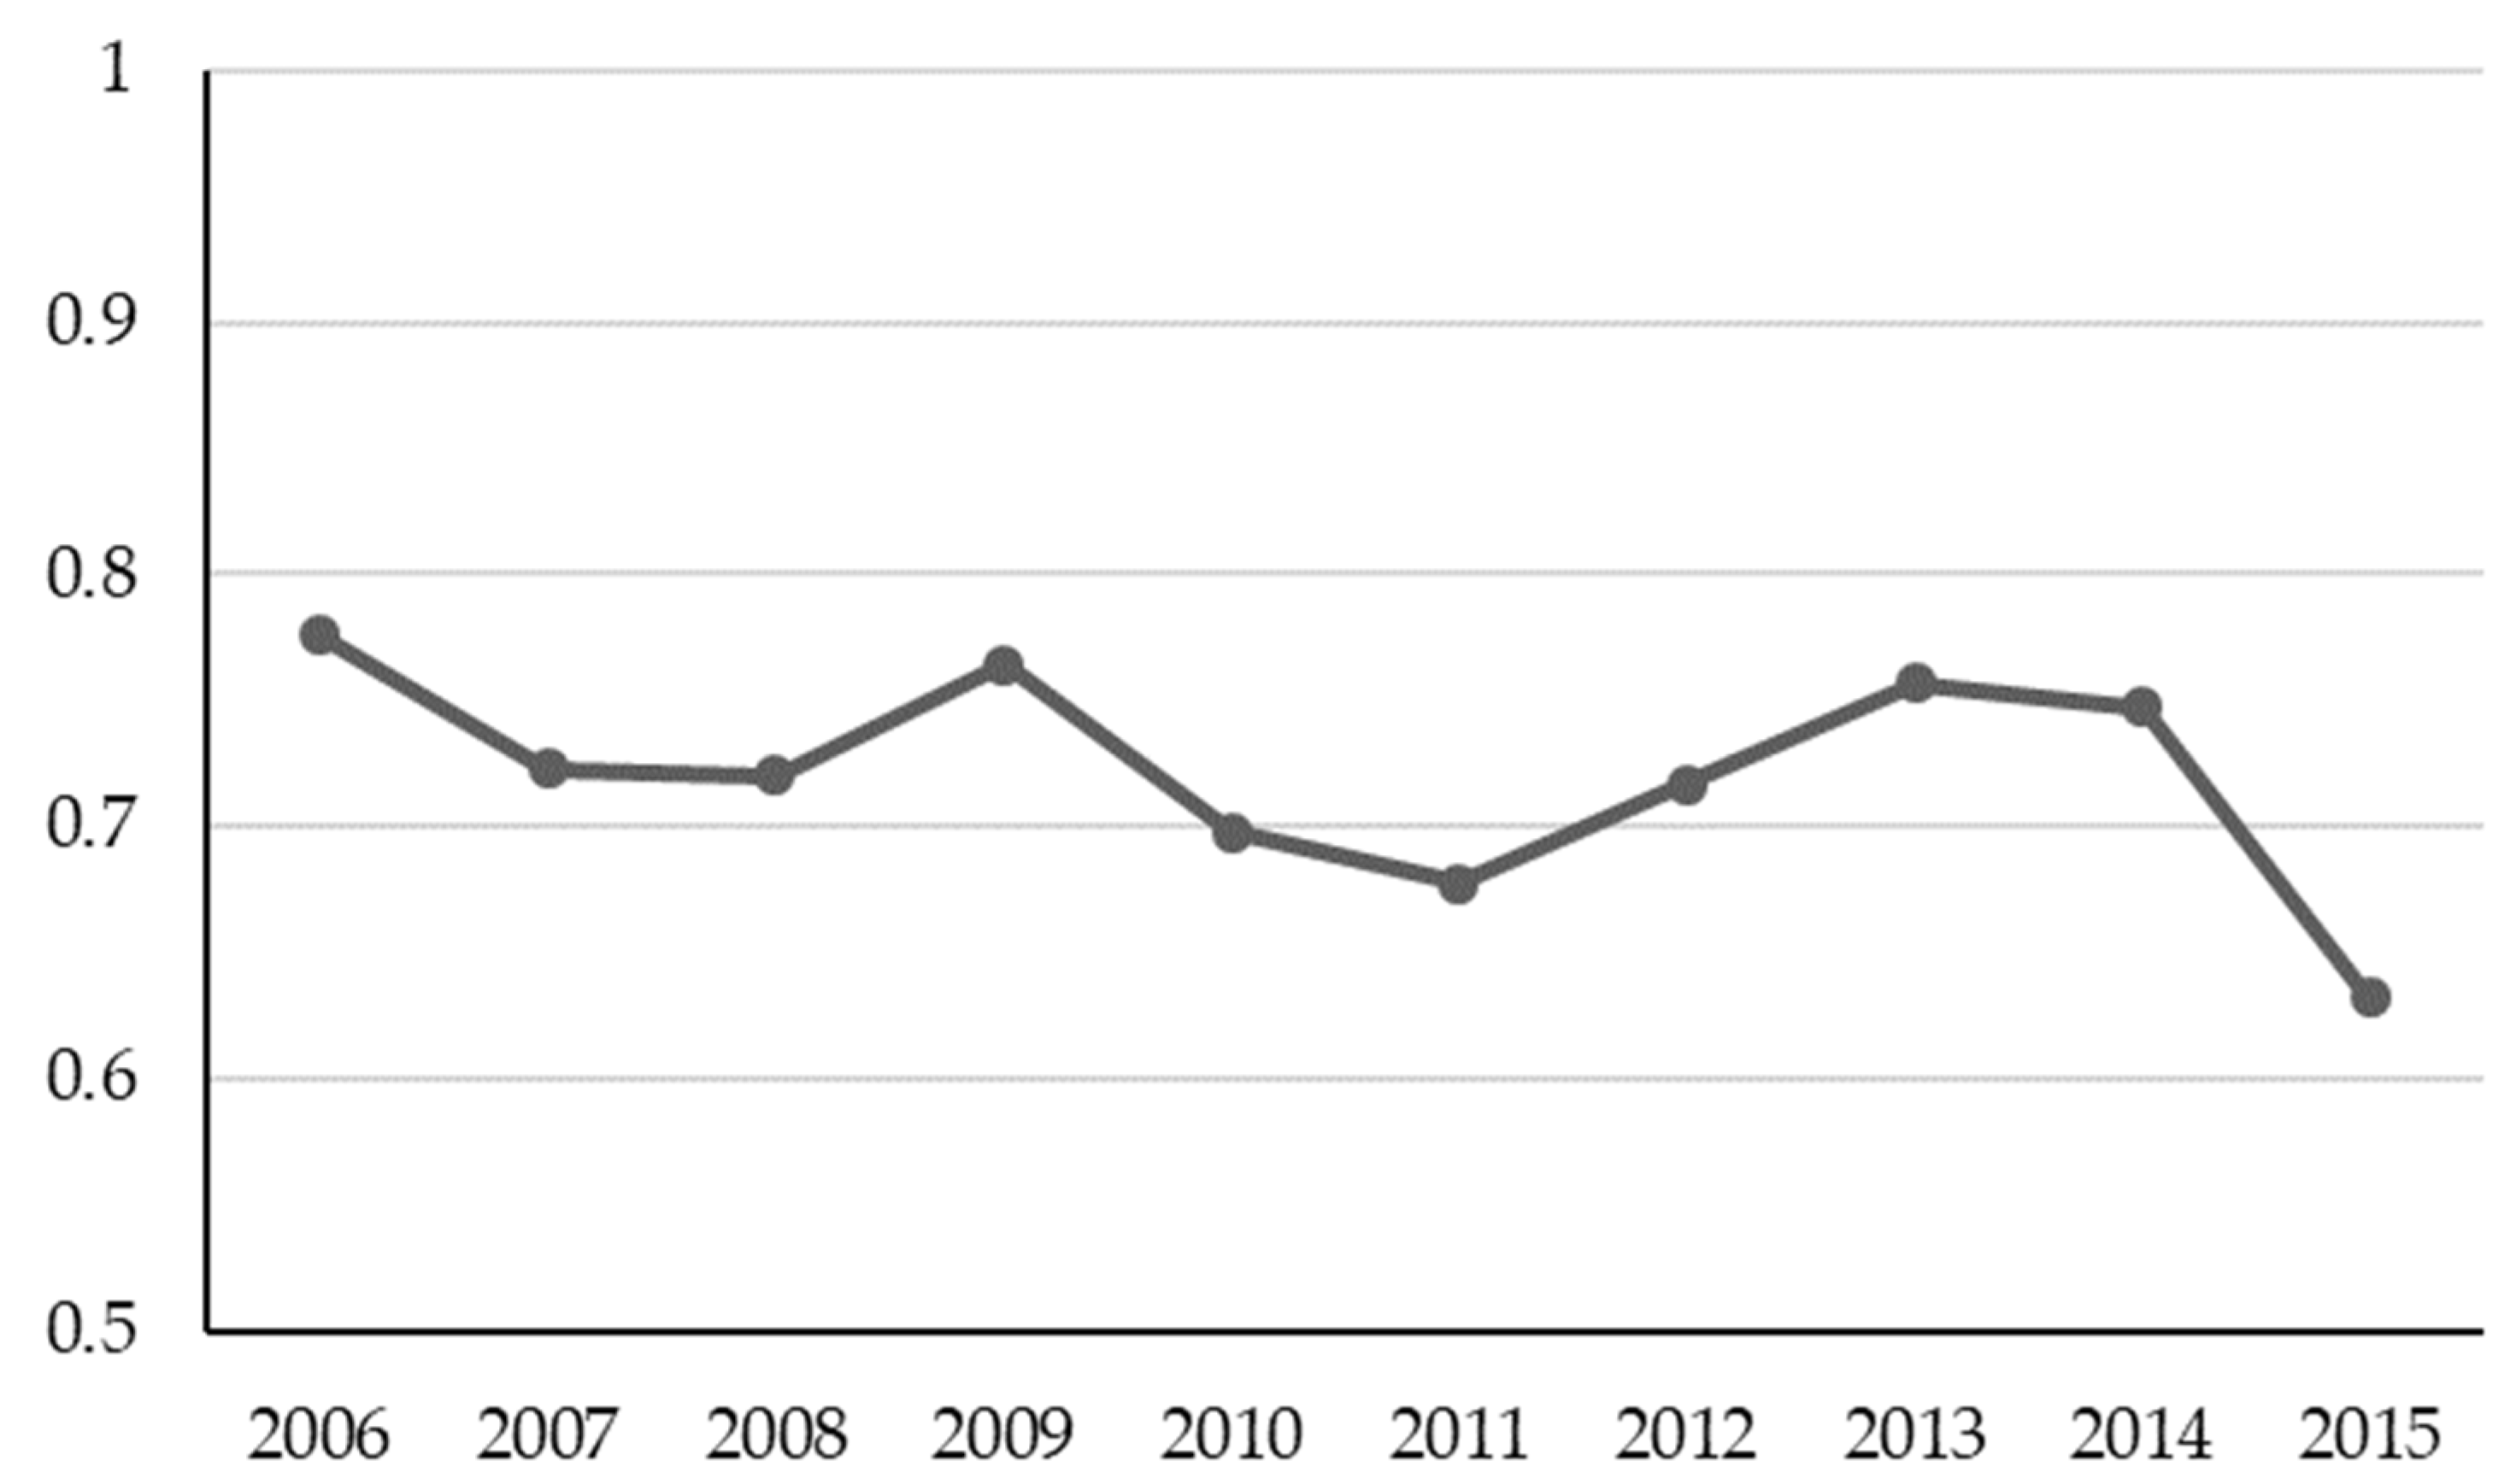
| Average value | 0.776 | 0.723 | 0.720 | 0.764 | 0.698 | 0.678 | 0.717 | 0.757 | 0.747 | 0.632 | 0.7212 |
| Urban Efficiency | Meaning | DMU | Number |
|---|---|---|---|
| [0,0.6) | inefficient | Dingxi, Pingliang, Guyuan, Shangluo, Tianshui, Longnan, Baiyin | 7 |
| [0.6,0.8) | low | Wuwei, Ankang, Wuzhong, Zhongwei, Zhangye, Xining, Lanzhou, Weinan, Qingyang, Baoji, Yinchuan, Tongchuan, Shizuishan | 13 |
| [0.8,0.9) | medium | Xianyang, Urumqi, Hanzhong, Jinchang, Xi’an, Jiuquan | 6 |
| [0.9,1) | high | Jiayuguan, Yulin, Yan’an, Karamay | 4 |
| 1 | efficient | 0 |
| DMU | 2006 | 2007 | 2008 | 2009 | 2010 | 2011 | 2012 | 2013 | 2014 | 2015 |
|---|---|---|---|---|---|---|---|---|---|---|
| Xi’an | drs | drs | drs | crs | drs | drs | drs | drs | crs | drs |
| Tongchuan | irs | irs | irs | irs | irs | irs | irs | irs | irs | crs |
| Baoji | drs | drs | drs | drs | drs | drs | drs | drs | irs | irs |
| Xianyang | drs | drs | drs | irs | drs | drs | drs | drs | crs | drs |
| Weinan | crs | drs | irs | irs | irs | irs | irs | irs | irs | irs |
| Yan’an | crs | crs | crs | crs | crs | crs | crs | crs | crs | irs |
| Hanzhong | drs | crs | irs | irs | irs | irs | irs | irs | irs | irs |
| Yulin | irs | crs | crs | crs | crs | crs | crs | crs | crs | crs |
| Ankang | irs | irs | irs | irs | irs | irs | irs | irs | irs | irs |
| Shangluo | irs | irs | irs | irs | irs | irs | irs | irs | irs | irs |
| Lanzhou | drs | drs | drs | drs | drs | drs | drs | drs | drs | irs |
| Jiayuguan | crs | crs | crs | crs | crs | crs | crs | crs | crs | irs |
| Jinchang | crs | crs | crs | irs | irs | irs | irs | irs | irs | irs |
| Baiyin | crs | irs | irs | irs | irs | irs | irs | irs | irs | irs |
| Tianshui | drs | irs | irs | irs | irs | irs | crs | crs | irs | irs |
| Wuwei | irs | irs | irs | irs | irs | irs | irs | irs | irs | irs |
| Zhangye | irs | irs | irs | irs | irs | irs | irs | irs | irs | irs |
| Pingliang | irs | irs | irs | irs | irs | irs | irs | irs | irs | irs |
| Jiuquan | irs | irs | irs | irs | irs | irs | irs | irs | crs | crs |
| Qingyang | irs | irs | irs | irs | irs | irs | irs | irs | irs | irs |
| Dingxi | irs | irs | irs | irs | irs | irs | irs | irs | irs | irs |
| Longnan | crs | irs | irs | irs | irs | irs | irs | irs | irs | irs |
| Xining | drs | drs | irs | irs | irs | irs | irs | crs | irs | irs |
| Yinchuan | drs | drs | drs | drs | drs | drs | drs | drs | crs | irs |
| Shizuishan | irs | irs | irs | irs | irs | irs | irs | irs | crs | irs |
| Wuzhong | irs | irs | irs | irs | irs | irs | irs | irs | irs | irs |
| Guyuan | irs | irs | irs | irs | irs | irs | irs | irs | irs | irs |
| Zhongwei | irs | irs | irs | irs | irs | irs | irs | irs | irs | irs |
| Urumqi | crs | drs | crs | drs | drs | crs | drs | drs | drs | drs |
| Karamay | crs | crs | crs | crs | crs | crs | crs | crs | crs | irs |
| Period | Comprehensive Efficiency Change | Technical Change | Technical Efficiency Change | Scale Efficiency Change | TFP Change |
|---|---|---|---|---|---|
| 2006–2007 | 0.917 | 1.048 | 0.975 | 0.941 | 0.961 |
| 2007–2008 | 1.003 | 1.015 | 1.006 | 0.998 | 1.018 |
| 2008–2009 | 1.066 | 0.933 | 1.065 | 1.001 | 0.995 |
| 2009–2010 | 0.903 | 1.097 | 0.987 | 0.915 | 0.990 |
| 2010–2011 | 0.958 | 1.145 | 0.987 | 0.971 | 1.097 |
| 2011–2012 | 1.066 | 0.943 | 1.009 | 1.056 | 1.005 |
| 2012–2013 | 1.065 | 0.877 | 1.023 | 1.041 | 0.934 |
| 2013–2014 | 0.974 | 1.080 | 1.002 | 0.972 | 1.052 |
| 2014–2015 | 0.843 | 1.083 | 0.885 | 0.953 | 0.914 |
| Average value | 0.974 | 1.021 | 0.992 | 0.982 | 0.995 |
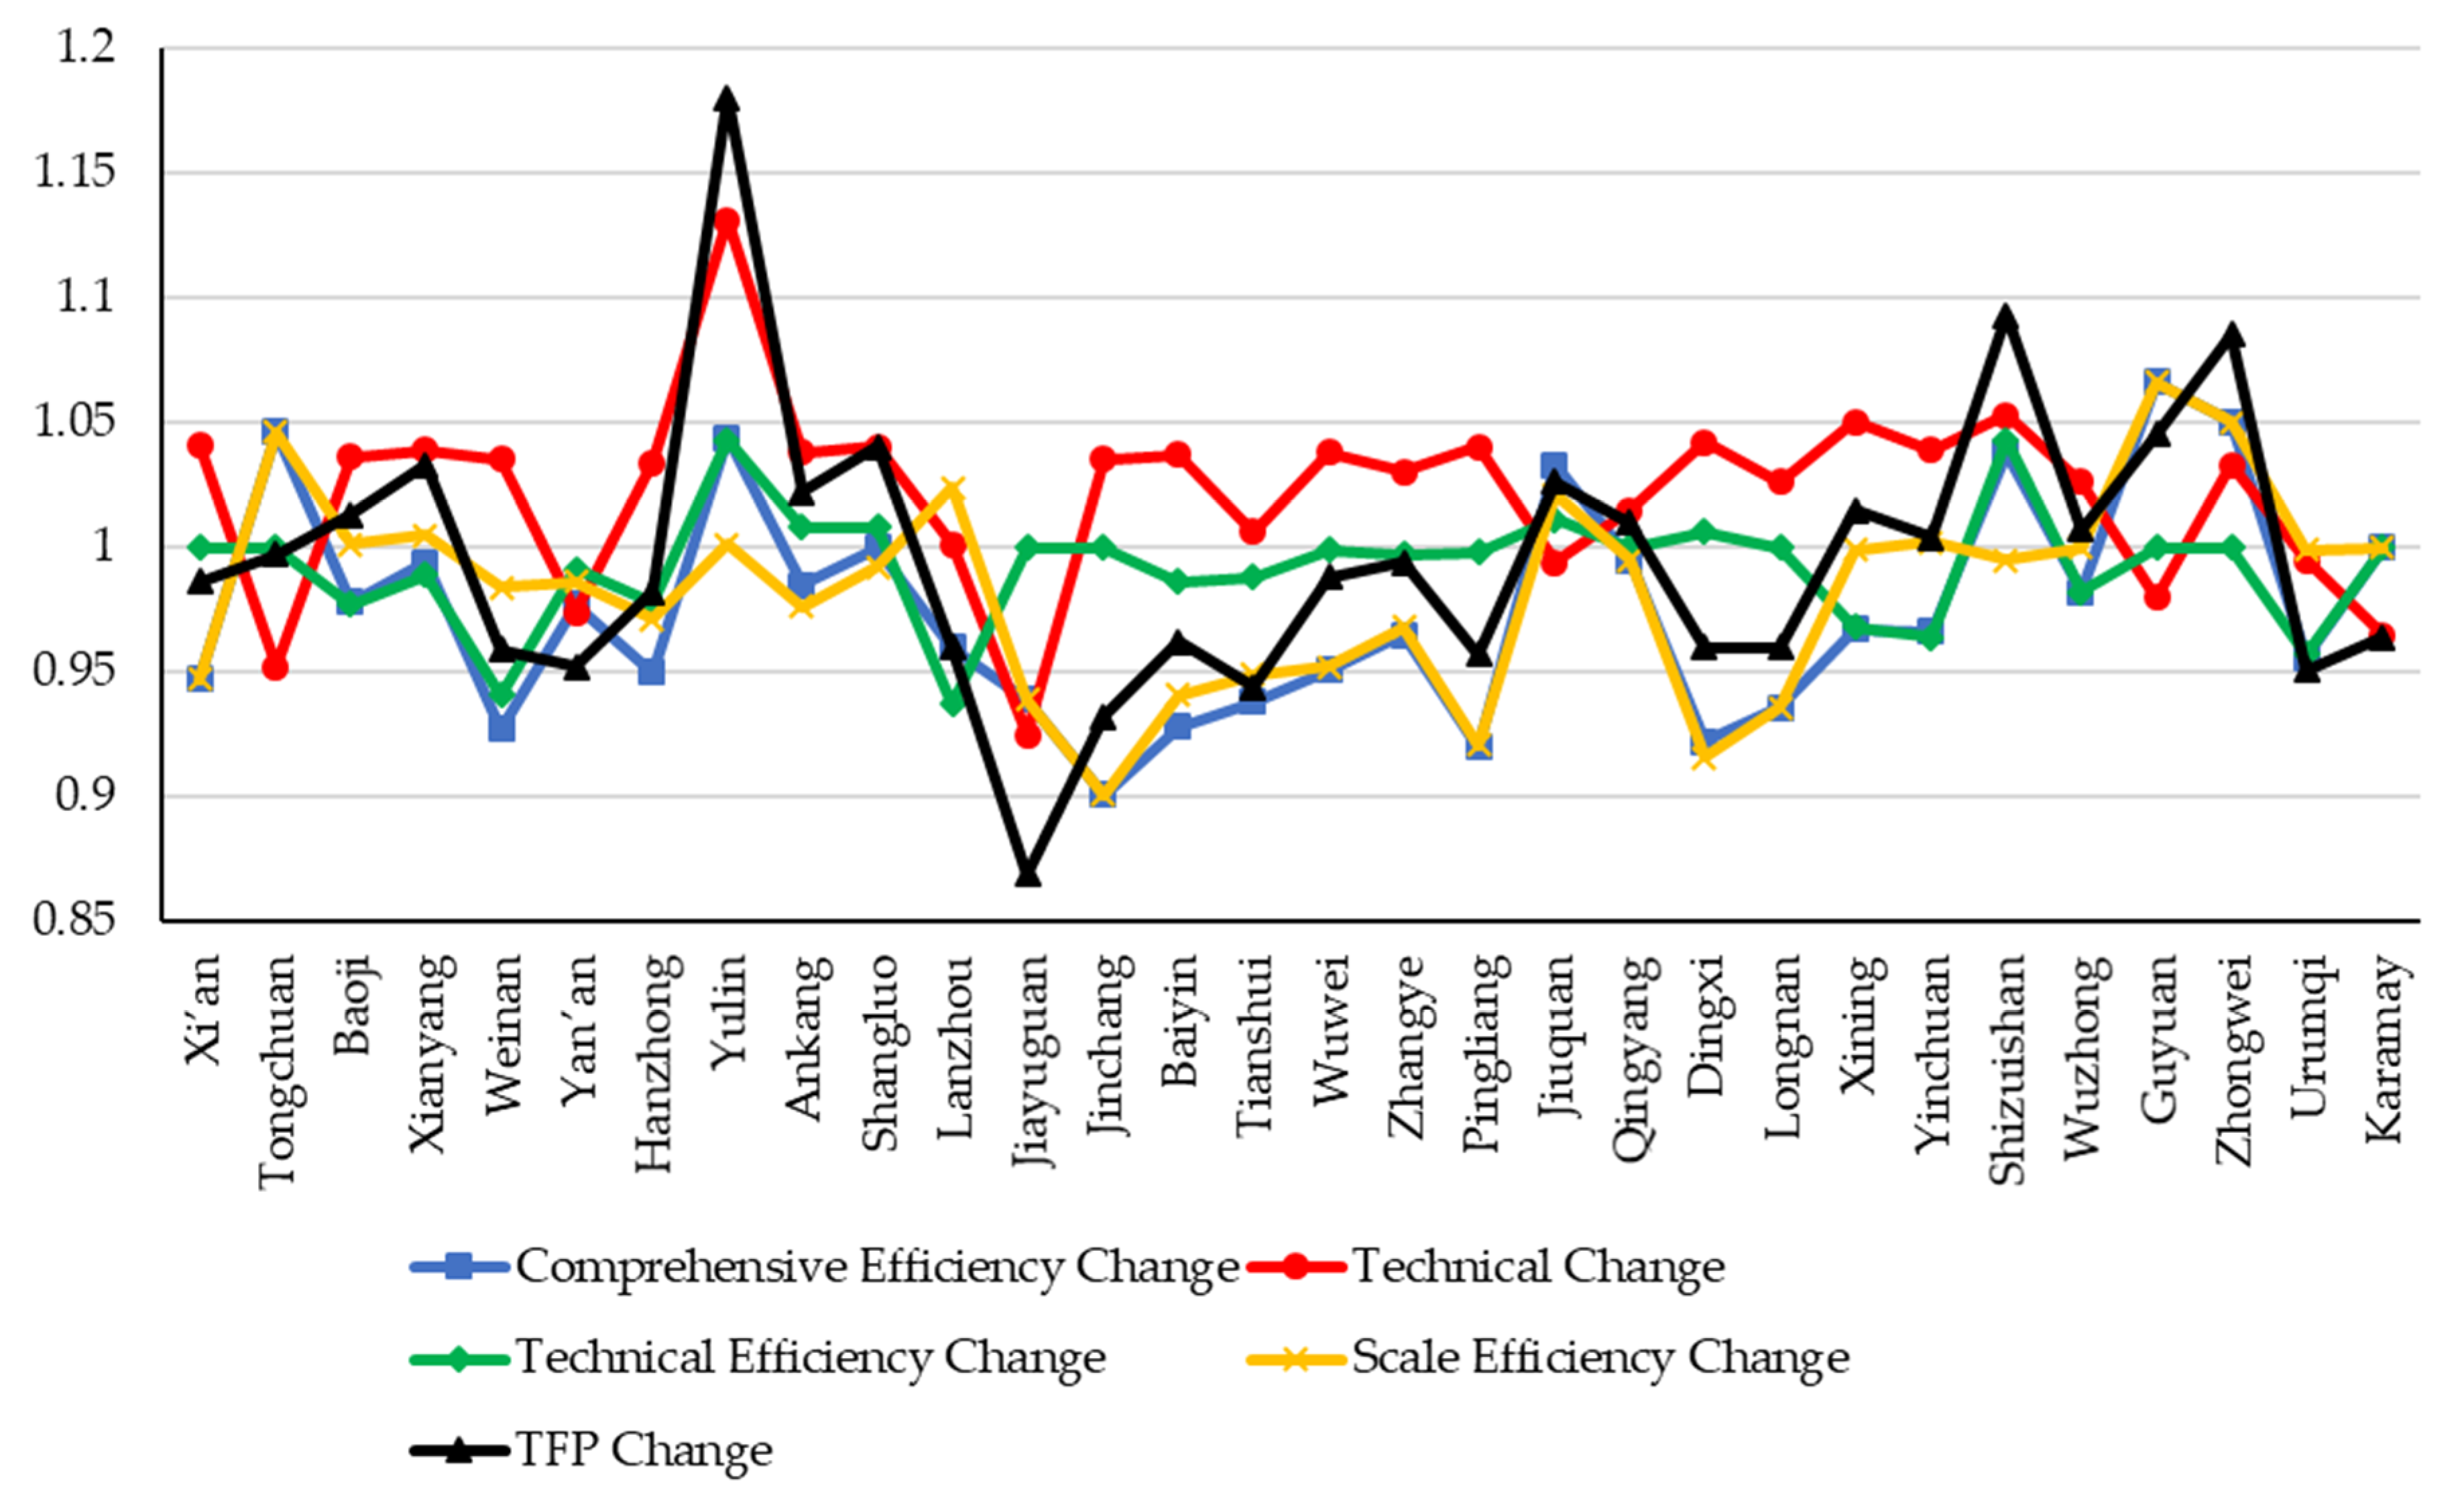
| DMU | Comprehensive Efficiency Change | Technical Change | Technical Efficiency Change | Scale Efficiency Change | TFP Change |
|---|---|---|---|---|---|
| Xi’an | 0.947 | 1.041 | 1.000 | 0.947 | 0.986 |
| Tongchuan | 1.046 | 0.952 | 1.000 | 1.046 | 0.997 |
| Baoji | 0.978 | 1.036 | 0.977 | 1.001 | 1.013 |
| Xianyang | 0.994 | 1.039 | 0.989 | 1.005 | 1.033 |
| Weinan | 0.927 | 1.035 | 0.941 | 0.984 | 0.959 |
| Yan’an | 0.977 | 0.974 | 0.991 | 0.986 | 0.952 |
| Hanzhong | 0.950 | 1.034 | 0.978 | 0.971 | 0.982 |
| Yulin | 1.044 | 1.131 | 1.043 | 1.001 | 1.180 |
| Ankang | 0.985 | 1.038 | 1.008 | 0.976 | 1.022 |
| Shangluo | 1.000 | 1.040 | 1.008 | 0.992 | 1.040 |
| Lanzhou | 0.960 | 1.001 | 0.937 | 1.024 | 0.960 |
| Jiayuguan | 0.939 | 0.925 | 1.000 | 0.939 | 0.869 |
| Jinchang | 0.901 | 1.035 | 1.000 | 0.901 | 0.932 |
| Baiyin | 0.928 | 1.037 | 0.986 | 0.941 | 0.962 |
| Tianshui | 0.938 | 1.006 | 0.988 | 0.949 | 0.944 |
| Wuwei | 0.951 | 1.038 | 0.999 | 0.952 | 0.988 |
| Zhangye | 0.965 | 1.030 | 0.997 | 0.968 | 0.994 |
| Pingliang | 0.920 | 1.040 | 0.998 | 0.921 | 0.957 |
| Jiuquan | 1.033 | 0.994 | 1.011 | 1.021 | 1.026 |
| Qingyang | 0.995 | 1.015 | 1.000 | 0.995 | 1.010 |
| Dingxi | 0.922 | 1.042 | 1.006 | 0.916 | 0.960 |
| Longnan | 0.936 | 1.026 | 1.000 | 0.936 | 0.960 |
| Xining | 0.967 | 1.050 | 0.968 | 0.999 | 1.015 |
| Yinchuan | 0.966 | 1.039 | 0.964 | 1.002 | 1.004 |
| Shizuishan | 1.038 | 1.053 | 1.043 | 0.995 | 1.093 |
| Wuzhong | 0.982 | 1.026 | 0.982 | 1.000 | 1.007 |
| Guyuan | 1.066 | 0.980 | 1.000 | 1.066 | 1.045 |
| Zhongwei | 1.050 | 1.033 | 1.000 | 1.050 | 1.085 |
| Urumqi | 0.956 | 0.995 | 0.957 | 0.999 | 0.951 |
| Karamay | 1.000 | 0.965 | 1.000 | 1.000 | 0.964 |
| Average value | 0.974 | 1.021 | 0.992 | 0.982 | 0.995 |
© 2019 by the authors. Licensee MDPI, Basel, Switzerland. This article is an open access article distributed under the terms and conditions of the Creative Commons Attribution (CC BY) license (http://creativecommons.org/licenses/by/4.0/).
Share and Cite
Yin, J.; Tan, Q. Study on Urban Efficiency Measurement and Spatiotemporal Evolution of Cities in Northwest China Based on the DEA–Malmquist Model. Sustainability 2019, 11, 434. https://doi.org/10.3390/su11020434
Yin J, Tan Q. Study on Urban Efficiency Measurement and Spatiotemporal Evolution of Cities in Northwest China Based on the DEA–Malmquist Model. Sustainability. 2019; 11(2):434. https://doi.org/10.3390/su11020434
Chicago/Turabian StyleYin, Jun, and Qingmei Tan. 2019. "Study on Urban Efficiency Measurement and Spatiotemporal Evolution of Cities in Northwest China Based on the DEA–Malmquist Model" Sustainability 11, no. 2: 434. https://doi.org/10.3390/su11020434
APA StyleYin, J., & Tan, Q. (2019). Study on Urban Efficiency Measurement and Spatiotemporal Evolution of Cities in Northwest China Based on the DEA–Malmquist Model. Sustainability, 11(2), 434. https://doi.org/10.3390/su11020434