Abstract
Weather conditions are one of the main threats that can lead to diseases in crops. Unfavourable conditions, such as rain or high humidity, can produce a risk of fungal diseases. Meteorological monitoring is vital to have some indication of a possible infection. The literature contains a wide variety of models for warning for this type of disease.These are capable of warning when an infection may be present. Devices (weather stations) able to measure weather conditions in real-time are needed to know precisely when an infection occurs in a smallholding. Besides, such models cannot be executed at the same time in which the observations are collected; in fact, these models are usually executed in batches at a rate of one per day. Therefore, these models need to be adapted to run at the same frequency as that at which observations are collected so that a possible disease can be dealt with as early as possible. The primary aim of this work is to adapt disease warning models to run in (near) real-time over meteorological variables generated by Internet of Things (IoT) devices, in order to inform farmers as quickly as possible if their crop is in danger of being infected by diseases, and to enable them to tackle the infection with the appropriate treatments. The work is centered on vineyards and has been tested in four different smallholdings in the province of Castellón (Spain).
1. Introduction
Despite the use of millions of tons of insecticides and the application of non-chemical methods, such as crop rotation, more than 45% of agri-food production is destroyed by pests such as fungus, weeds or pathogens [1]. Lowering this 45% loss rate could reduce poverty in many developing countries. Pathogens, insects, mites, weeds and fungi are all pests that diminish the productivity and profitability of crops. G. Olatinwo et al. [2] and A. K. Tripathy et al. [3] noted the interrelation of climate, crops and pests. Without going into details of the relationship among these three objects, it is quite apparent that the climate makes the environment a variable factor between pests and crops. Many diseases are triggered by adverse weather conditions that can lead to the germination and progression of diseases. Phytosanitary products are applied to treat these diseases. The use of this type of products is not only expensive for farmers but also causes environmental pollution [4,5,6]. Therefore, these products should be used in moderation and only applied when there are clear indications that the disease to be treated is present and not as a preventive measure.
The use of technologies and models capable of detecting diseases or pests in order to reduce loss of food crops is necessary. Food and Agriculture Organization (FAO) recommends that all agricultural sectors should be equipped with new tools and techniques based on the Information and Communication Technologies (ICT). During the last decade, a new movement was born to implement digital technology in agriculture, called precision agriculture [7]. Its objective is to optimise the yield per unit of cropland through the use of ICT tools and technologies and to achieve the best products in terms of quality, quantity and economic conditions.
Thanks to the use of ICT tools, detection systems have been developed to inform farmers about the sudden appearance of diseases and pests. For example, diseases can spread more easily in highly humid climates and, in this line, several scholars have analysed climatic factors such as temperature, precipitation and humidity [8]. Traditionally, crop models usually work at daily or monthly rates [9], which means that the results of possible threats are not received until the models are run, and that moment could be too late to apply treatments and heavy crop losses can occur. Thus, there is a need for models capable of being run at the same rate as the observations are coming in. In the last few years, new devices from the Internet of Things (IoT) have been used to obtain real-time in situ observations (mainly meteorological) [10]. Therefore, to be aware of disease infections as soon as possible, it is necessary to adapt the models mentioned above to these IoT devices and have them both working at the same rate in order to obtain the detections as quickly as possible to allow the required treatment to be applied.
In this context, the primary objective of the present work is to adapt a set of disease warning models in the field of viticulture. To achieve this, four different models have been selected to warn about fungal diseases, all of which have been adapted to work in (near) real-time over IoT meteorological nodes and launch alerts when a disease is detected. More specifically, the contributions of this work are: (a) adaptation to the (near) real-time follow-up of the disease models Downy mildew, Powdery mildew, Black rot and Botrytis applied to vineyards; (b) generation of gradual alerts, depending on the level of evolution and type of disease, sent directly to farmers; and (c) application of the models on observations from IoT nodes deployed directly in vineyard smallholdings.
The rest of the paper is organised as follows. Section 2 presents the materials and methods underlying all the disease models adapted to vineyards. Section 3 shows the results of following up the defined disease models in a vineyard smallholding. Section 4 discusses the results obtained. The paper finishes with Section 5, which discusses the conclusions and offers recommendations for future work.
2. Material and Methods
This section presents the different elements used throughout the work. The first section (Section 2.1) describes the smallholdings where the IoT nodes are located. Section 2.2 describes each adapted model. The last subsection (Section 2.3) describes the platform on which the models were developed.
2.1. Study Sites and Data Sources
Data were collected at four different vineyard smallholdings located in the province of Castelló (Spain) (Figure 1). These data were then used to evaluate the selected models (see Section 2.2). All these models use meteorological data generated by low-cost meteorological stations. To achieve this, the IoT nodes described in [11] (SEnviro) were used. These nodes contain low-cost sensors to monitor meteorological phenomena such as temperature, air/soil humidity, wind speed, wind direction and rainfall.
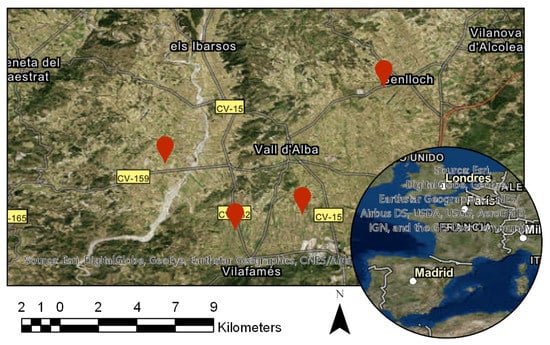
Figure 1.
Map showing each of the SEnviro node locations.
Four units of the SEnviro node were deployed in localities close to Castelló de la Plana (Spain) with a tradition of viticulture, such as Vilafamés, Les Useres or Benlloch (Figure 2). These IoT nodes worked continuously and uninterrupted for 130 days. Each node sent an observation every ten minutes during the 2018 wine season. The SEnviro node includes a 3G connection and a solar panel to offer an autonomous solution so that it does not need any kind of installation, provided that there is 3G coverage.
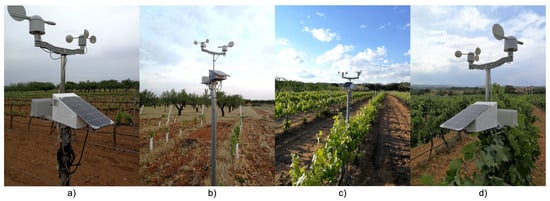
Figure 2.
Pictures of the SEnviro node deployments in vineyards. In Table 1 (a) Sensor No 1, (b) Sensor No. 3, (c) Sensor No. 2, (d) Sensor No. 4.
Table 1 summarises some information about the location of each node and some of features of the smallholding where it is located, such as the cultivation area or grape varieties.

Table 1.
Information about the smallholdings where the sensors are located.
2.2. Vineyard Disease Models
Based on some previous work on different models or indications to warn for vineyard diseases [12,13,14,15], we have adapted these models to work in (near) real-time from data provided by the IoT devices described above.
More specifically, four different diseases were selected. All of them are heavily influenced by meteorological conditions, such as temperature, humidity or rainfall (included in the SEnviro node). These diseases are Downy mildew, Powdery mildew, Black rot and Botrytis. The subsections that follow offer an in-depth description of each disease and of how each disease model has been adapted to work in (near) real-time on meteorological time-series. The aim is to know about possible infections at the same time as they are indicated by the meteorological variables provided by the IoT nodes and to issue just one alert (critical) or three different ones (information, warning and critical), depending on the model and the evolution of the disease.
In this work, we are considering the concept of (near) real-time as execution in batches at a rate of one per hour, much lower than the daily rate offered by current models. In this way, a farmer could treat a disease as quickly as possible. All models follow linear regressions, and for that reason, we can extrapolate the models’ values between 24 units (24 h) and apply hourly average values.
2.2.1. Downy Mildew
Downy mildew is a fungal disease caused by the oomycete plasmopara viticola. It is one of the worst diseases to occur in vine cultivation under specific weather conditions [16]. Downy mildew is the most studied disease, as it produces critical economic losses in vineyards and, consequently, in wineries [17]. This disease is the result of the presence of a fungus in the green elements of the vines, and its life cycle is well established [17]. Following, we define the main features of this disease when it is activated:
On leaves. It can be distinguished by oily stains on the upper side of the leaf (Figure 3), and a whitish fuzz on the underside if the weather is wet. At the end of their development, these spots take on the form of a reddish-brown mosaic. A severe attack produces partial or total desiccation of the leaves and even premature defoliation, which affects the quantity and quality of the crop as well as the good ageing of the branches.
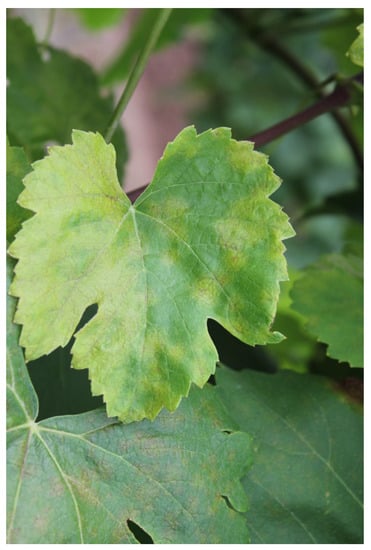
Figure 3.
Example of Downy mildew infection.
Sprouts and shoots. The tender shoots are curved and covered by a whitish fuzz formed by spores of the fungus, which also infects petioles and tendrils that can dry out and fall off if the attack is severe.
Grapes. These can be attacked precociously, with the appearance of a typical S-shaped curvature, as well as a darkening of the grapes that can later be coated with a whitish fuzz. The grains can be attacked initially or at a later stage through the peduncles. In late attacks, the bunches are not covered with a white fuzz but they take on a brown colour.
Plasmopara viticola causes lesions when the following conditions are present: (1) shoot length of at least 10 cm; (2) minimum rainfall of at least 10 mm; and (3) temperature higher than 10 C. Under these conditions, the first infection occurs, which will give rise to oily stains and white mould at the end of the incubation period. Its biological cycle takes place in four phases: contamination, incubation, sporulation and propagation. Each of them is described below:
- Contamination. In spring, the oospores reach maturity and germinate as zoospores. These may be transported by rain and wind, thus reaching the green parts of the vine and colonising them. The conditions needed for contamination are: an air temperature of around 10 C, a young plant with a height of at least 10 cm and a rainfall of at least 10 mm/day.
- Incubation. This takes from 4 to 21 days, depending on the temperatures and relative humidity.
- Sporulation. During this step, the fungus is propagated along the vine.
- Propagation. Dissemination to nearby plants with the help of rebounding raindrops and wind. The optimal condition for ambient temperature is between 20 and 25 C, with the help of rain during the night.
The Goidanich model is used to follow the evolution of the Downy mildew fungus [12]. It takes into account three different phenomena: relative humidity, temperature and rainfall. The model starts when a traditional method, namely the “rule of the three tens”, is fulfilled. This method predicts that primary infections will occur once the average temperature has exceeded 10 C, the sprout exceeds 10 cm and on a day when there is at least 10 mm of rainfall. This rule, though simple, gives a rough idea of when to start looking for these primary infections.
The original Goidanich model uses daily average temperature (Tm), average relative humidity (Hm) and rainfall to follow the evolution of the fungus. We have adapted the original Goidanich model using hourly observations. Table 2 shows the values to be accumulated depending on hourly temperature and humidity. The table (Table 2) defines two different columns for each Tm, one when the Hm is lower than 75% and the other when it is higher than 75%, and depending on each Tm and Hm, a value has to be accumulated hourly to follow the model.

Table 2.
Hourly cumulative percentage of Downy mildew incubation. Average temperature (Tm), and average relative humidity (Hm).
Although the IoT nodes are configured to take a new observation every 10 min, the model has been adapted to be calculated every hour. This is due to the fact that the computational cost required to follow the model with a low frequency of less than one hour does not justify a clear improvement in obtaining an alert with a difference of less than one hour. Moreover, the six observations taken during one hour are used to calculate an average and, thus, any incorrect measurement during the sensor capture step reduces its impact on the model when an average is applied.
Figure 4 defines the work-flow used to follow the adapted Goidanich model. When a new observation is generated, the first step is to check whether the accumulated (aggregate of 72 h) rainfall exceeds 10 mm. If the aggregate rainfall does not exceed this value, the model waits until a new observation; if it is reached, the risk alert is activated. Once the risk alert has been activated, temperature and humidity are calculated hourly following Table 2 to calculate the accumulated value. Depending on this value, the model will launch different types of alerts. If the value is higher than 50%, an Info alert is generated; if the value is higher than 75%, a Warning alert is issued; and if it is equal to or greater than 100%, a Critical alert is produced. After a critical alert, the model will restart. The development of the fungus restarts and remains in suspension until the product has been washed away by rain. If the model has not reached a value of 100 after 10 days, the algorithm is restarted.
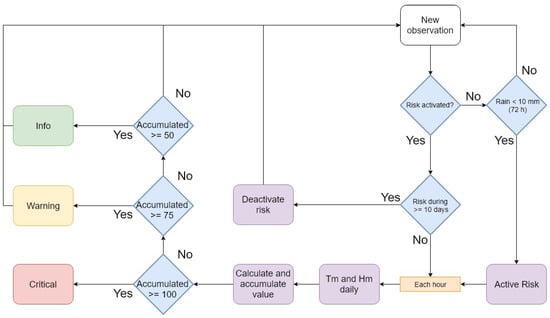
Figure 4.
Flow chart to follow the adapted Goidanich model in (near) real-time.
2.2.2. Powdery Mildew
Like Downy mildew, Powdery mildew is another type of fungus that affects grapevines, among other crops. The causative fungus is Uncinula necator Burr., originally from North America, but widespread throughout Spain. This fungus causes significant damage to the strain that becomes infected, and can produce total or partial loss of foliage and fruit [18]. This disease resides in the strain all year round. The fungus of Powdery mildew is found inside the shoots and the vines during the winter and then goes to the outside during the beginning of sprouting. In the following, we define the main symptoms when it is activated:
- On leaves. An ashy white dust is observed on both the upper and lower leaf surfaces (Figure 5). Under the dust, there are some necrotic dots. Sometimes the beginnings of the attack manifest themselves as oily stains on the upper side of the leaf, along with some brown areas. When the attacks are intense, the leaves appear tense or parachute-shaped and are covered with dust on both the upper and the lower sides.
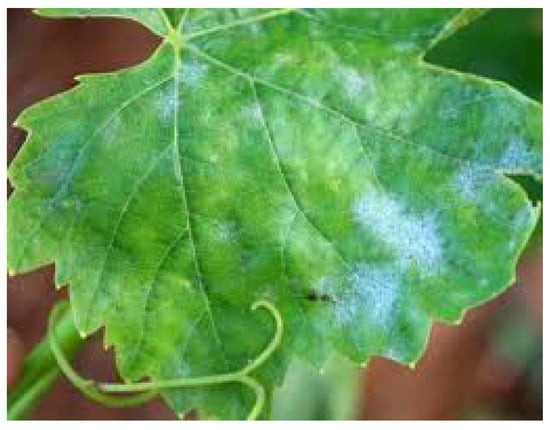 Figure 5. Example of infection by Powdery mildew.
 - Sprouts and shoots. Symptoms appear as diffuse dark green patches, the colour turning to chocolaty-brown tones as the evolution progresses and then a blackish colour until outbreak.
- Grapes. At first the grains appear with a certain leaden-grey colour, becoming covered in a short time by an ashy dust. The most important damage is located in the grape clusters because strong attacks cause the growth of the skin to stop and so the fruit splits open.
Powdery mildew, unlike Downy mildew, requires high temperatures, a dry atmosphere free of moisture and cool nights. The original model defines two phases and uses temperature and humidity to follow a possible infection [19].
Figure 6 defines the workflow for following the adapted Powdery mildew model. In the first phase, depending on the season of the year (spring or summer), the plant would be infected under different conditions. At least 12 h of continuous leaf wetness (85% humidity) are required when average temperatures are between 10–15 C during spring to be able to consider an infection. An infection during summer requires three consecutive days with at least 6 h at a temperature of 20–21 C with the same humidity (>85%).
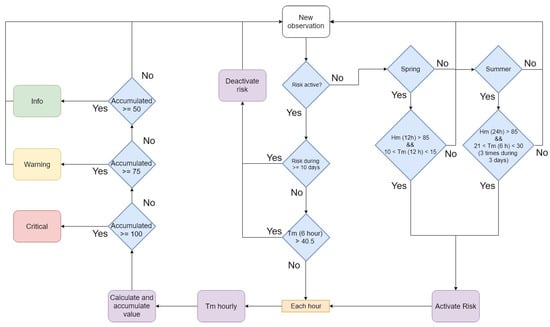
Figure 6.
Flow chart to follow the adapted powdery model in (near) real-time.
Once a primary infection has occurred, the disease switches to its second phase. Humidity is not needed for secondary infection and temperature is the most critical environmental factor (Table 3). The original table uses daily averages and, like Downy mildew, the model has been adapted to follow hourly observations. An average temperature is used to calculate the accumulated value. In this model we also defined three different alerts, using the same thresholds. If, after 10 days in the second stage, the accumulated value does not exceed 100%, the model is restarted.

Table 3.
Hourly cumulative percentage of Powdery mildew incubation.
2.2.3. Black Rot
The Black rot is a fungal disease that attacks grapevines during hot and humid weather. It causes complete crop loss in warm or humid climates, but is unseen in regions with arid summers. This disease also attacks the shoots, leaf and fruit stems, tendrils and fruit (Figure 7). Black rot is a disease caused by Guinardia bidwellii and is one of the most serious diseases affecting grapevines [20]. The most important symptoms are:
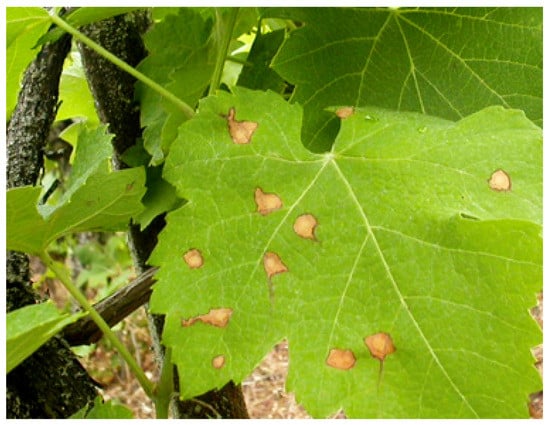
Figure 7.
Example of infection by Black rot.
- On leaves. This is where the invasion begins and it is characterised by pustular splashes with a dark brown colour, which enlarge and increase, eventually drying out the affected parts of the leaflet.
- In sprouts and shoots. The invasion only takes place in the herbaceous parts that are not yet lignified.
- In grapes. This is where the parasite causes more damage. The symptoms manifest as reddish spots that decompose the pulp. The skin is wrinkled and covered with small black pustules, and the grain dries out and usually falls off. If the invasion occurs in full bloom it can drain the cluster completely.
Figure 8 defines the workflow for following the adapted Black rot model. The original model defined in [20] is based on humidity and temperature phenomena.
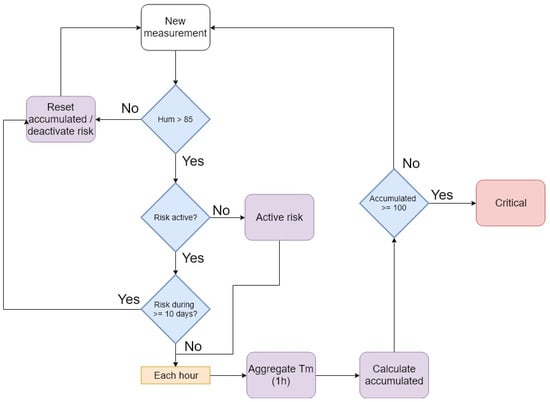
Figure 8.
Flow chart to follow the adapted Black rot model in (near) real-time.
This model has only one stage and starts to accumulate while the humidity is higher than 85%. Like both the previous models, this one has been adapted to run with hourly observations. The accumulated value is calculated each hour (see Table 4). Only one type of alert (Critical) is defined for this model, so when the accumulated value is above 100%, a critical alert is launched.

Table 4.
Hourly cumulative percentage of Black rot infection.
2.2.4. Botrytis
Finally, the last disease is Botrytis. This can occur at any time during the growing season, but is most common near harvest time. Botrytis usually infects ripe berries (Figure 9). This disease manifests in the herbaceous parts (leaves, buds and inflorescences), in the stakes and mainly on the grape clusters.
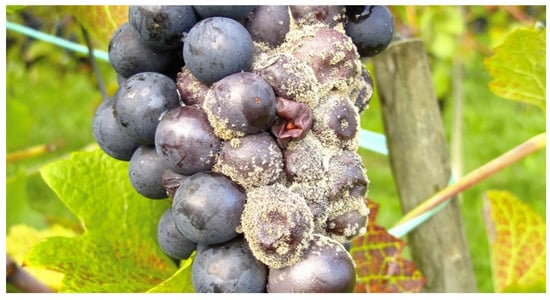
Figure 9.
Example of infection by Botrytis.
The most important symptoms are:
- On leaves. Extensive necrosis that looks like burns appears on the edge of the leaves and in wet conditions can take the form of a grey dust. Leaf attacks are not usually economically important.
- In sprouts and shoots. The first symptoms manifest as the presence of elongated brown spots, which are covered with a greyish fuzz if the weather is humid. At the ends of the plant, elongated blackish spots on a whitish background appear along the branch and mainly at the end, which smells bad and has little consistency. The attacks can lead to the loss of some young shoots, with the consequent decrease in harvest, and later affect some buds at the base of the shoots, which do not sprout the following year.
- In grapes. Symptoms during flowering and fruit set manifest on the inflorescences and with a dark brown colour in the bunch. During infection they present a rotten appearance and a characteristic greyish mould develops on their surface. It also causes a decrease in the quality of future wines.
Figure 10 defines the workflow for following the adapted Botrytis model. Temperature and humidity are the two critical factors influencing the development of Botrytis. During the infection phase, this involves a temperature of 20–25 C and a relative humidity of 90% for a maximum of 15 h. This model is the only one that does not have to be adapted to work in (near) real-time. The original model is described in [15].
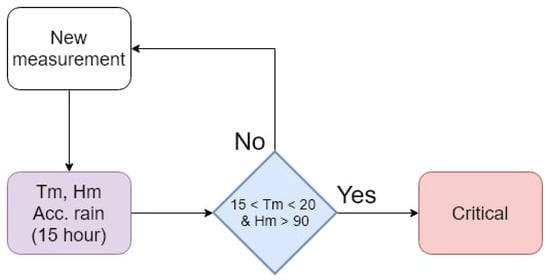
Figure 10.
Flow chart to follow the adapted Botrytis model in (near) real-time.
2.3. SEnviro Connect
The models detailed above were developed within the SEnviro Connect platform described in [21]. In general, this platform is responsible for collecting the observations from the IoT nodes. In addition, it stores and processes the data to be analysed as time series in real-time. To do so, a time series database called Influx is used [22], which allows the models to be defined and followed through its Kapacitor complement [23], and when a real-time observation comes from the sensors, it is analysed by following the models. If a possible alert is detected, Kapacitor is capable of propagating this alert, and this capability was used to develop a (mobile responsive) web application in Figure 11. The farmers, in addition to seeing the weather conditions in real-time, are also able to receive the alerts generated by the IoT nodes located on their smallholdings.
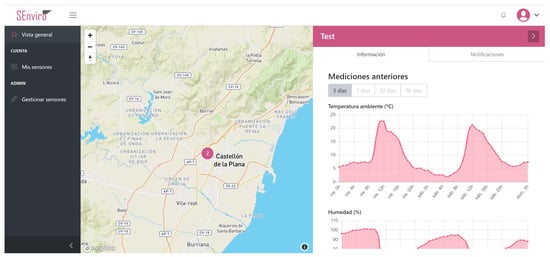
Figure 11.
Web application to view meteorological data and the alerts issued.
3. Results
Each proposed model has been evaluated with the data provided in real-time by the IoT nodes listed in Section 2.1. This section shows the evolution of each model at sensor number 1 (see Table 1), during the 2018 grape season (from 13 May 2018 to 20 September 2018). The follow-up of each of them is shown below:
3.1. Downy Mildew
The model used to warn for Downy mildew disease, as detailed in Section 2.2, was the Goldanich. This model needs three different meteorological variables (temperature, humidity and rain) as inputs to run. Figure 12 shows the evolution of these three meteorological variables during the defined period. The Goldanich model is activated when 10 mm of continuous rain (over 72 h) is reached. According to the chart (Figure 10), this value was exceeded three times (21 May 2018, 22 August 2018 and 13 September 2018). The model was activated on these three dates.
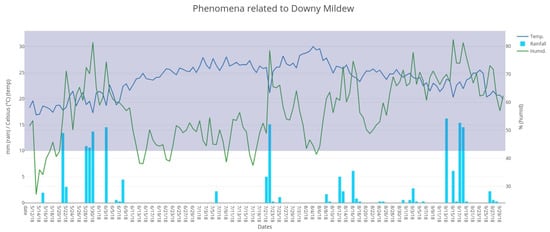
Figure 12.
Evolution of temperature, humidity and rainfall during the 2018 grape season provided by IoT node 1.
Figure 13 shows the evolution of the model on the three dates when the model was activated. Although the model could work at the same frequency as that at which the IoT nodes generate data, it was decided (as shown in the previous section) that the model calculations should be performed every hour (the original model has daily rates) due to the computational cost that could result from calculating the model every time a new observation arrives; and to simplify the adaptation of the model, given that by having (smaller) fixed intervals the transform from a daily basis to an hourly basis becomes linear.
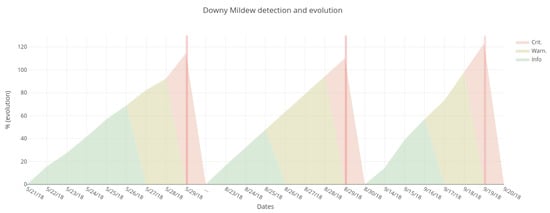
Figure 13.
Evolution of the Goldanich model for the three infections detected.
Depending on the values of the average temperature and humidity, the model accumulates values and when the values reach the defined thresholds the alerts are generated (different colours in the evolution of the graph). In the three cases detected, the evolution of the model reached a value of 100% before day 10, and so it would be disabled. In the first case, 100% was reached during the ninth day, only one day before disabling the risk. In the detection of 23 August, the model reached 100% on day 8. Finally, the last detection was made on the seventh day, although the grape production had already been harvested.
3.2. Powdery Mildew
The next disease is Powdery mildew, which, depending on the season (spring or summer), has different characteristics to start the model. The model works mainly with temperature and humidity phenomena. Figure 14 and Figure 15 show the evolution of these variables for the period 21 May to 20 June (spring) and from 21 June to 20 September (summer), respectively. The green line indicates the value that the humidity must take (85%) to activate the infection and the purple and red lines indicate the thresholds of the temperature needed to produce the infection. Both thresholds and the hour of aggregation vary depending on the season of the year.
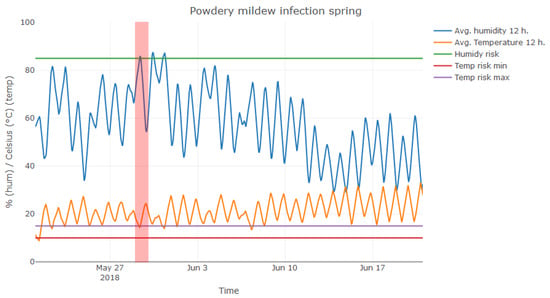
Figure 14.
Evolution of the Powdery model (spring).
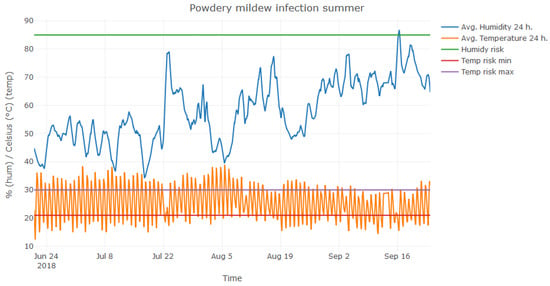
Figure 15.
Evolution of the Powdery model (summer).
Figure 14 shows a possible infection on 29th May (in red in the graph) during the spring period. During the summer period no infection was detected (Figure 15), and the average humidity only exceeded 85% on one day.
Figure 16 follows the model once the first infection is detected. The figure shows the evolution of the accumulated value. The evaluation was never stopped because the hourly average temperatures did not exceed the value of 33 C. The infection after 9 days of follow-up reached the threshold of 100%, so it can be considered that the infection is present in the field. It should be noted that the farmer has received different alerts depending on the accumulated value (information alert at 50%, warning at 75% and critical at 100%).
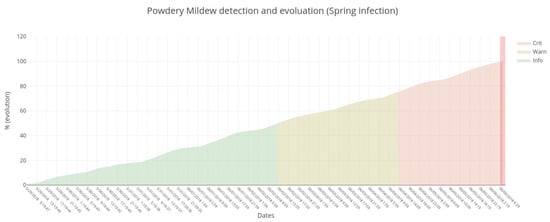
Figure 16.
Powdery mildew evolution during spring season.
3.3. Black Rot
Figure 17 shows all the different detections of Black rot. Altogether, the model started 30 times and calculated accumulated values until the model itself stopped the evolution because the average humidity decreased below 85% and the model resets the accumulated value. The model obtained a possible infection and accumulated a value up of 100% only twice. These infections were reported on 17 August 2018 and 18 September 2018; this latter date was after the harvest had been collected. In this model, only one type of alert is defined since the model indicates that there is a possible infection, not a reproduction as in the previous models.
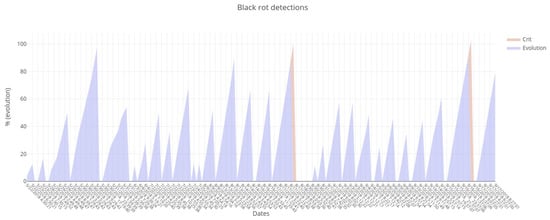
Figure 17.
Black rot detections.
3.4. Botrytis
The last follow-up of a disease is Botrytis. For this disease, two phenomena are involved: temperature and humidity. When a new observation arrives, an aggregation of the last 15 h is calculated. Figure 18 shows the evolution of both these phenomena. The different thresholds fixed by the model are shown in the chart (Figure 18). Only one detection was reported, and it occurred on 17 August 2018 and 18 September 2018; during this period the harvest had already been collected.
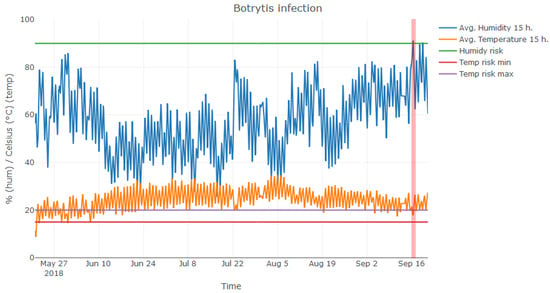
Figure 18.
Botrytis detection.
4. Discussion
All the disease models were adapted from their original configuration to allow (near) real-time analyses and results to be obtained at the same time as the observations from IoT nodes are received. Offering models capable of working in (near) real-time is vital to treat possible diseases in the smallest possible amount of time in order to reduce potential losses as soon as possible. As already mentioned, this work does not intend to validate the models, since their validation was already carried out in the different bibliographic works listed above.
Traditionally, the models presented have been used to follow the observations of stations that are not located in vineyards. Until now, official meteorological stations (often manual) have been used to provide information to a large number of vineyard smallholdings in the same province or region. This can be a problem because phenomena such as humidity or rain can vary considerably in a few kilometres [24]. Therefore, being able to follow the models with real observations from in-field stations can offer more accurate detections, which, at the same time, provides (or will provide) farmers with better tools to combat possible diseases.
Although this study only shows the alerts generated for one IoT node, the execution of the models was different in some of them. For example, Downy mildew disease was not activated equally, because certain precipitations that activated the model did not occur equally in all the smallholdings where sensors were deployed.
The first two models (mildews) differ from the others because they both define a two-stages model. Mildew models have an initial stage for the detection of a possible infection and another stage to follow up the evolution of the infection until the symptoms are recognised. The other two models only contemplate a stage that carries out the follow-up until infection. This difference is the reason why only one alert level was defined for the last two models, and three different levels for the mildews.
Although the work does not aim to validate whether the alerts generated corresponded to a real disease, the farmers were asked about this matter and said that they did carry out some actions to treat diseases during this period. Specifically, they applied products to fight infections at the end of May in order to deal with the powdery and downy mildew diseases. Some smallholdings are cultivated in an ecological way, and in these cases they applied sulphur to mitigate infections. The alerts generated in August (Downy mildew and Black rot) did not undergo any type of treatment due to the state of maturity of the grape clusters. Finally, in the cases of all the alerts generated in September no treatment was applied because all the production had already been harvested.
5. Conclusions
This work presents a set of fungal disease models within viticulture. More specifically, the diseases that can be controlled are: Downy mildew, Powdery mildew, Black rot and Botrytis. All the models described here work by tracking meteorological variables. These detection models have been adapted to be run in (near) real-time, and they can work with IoT nodes, which are capable of generating observations at adaptive refresh levels close to real-time.
In order to know what weather conditions are occurring in the fields, some SEnviro nodes have been used [11]. These nodes can be adapted to capture observations at different rates. Four units of IoT nodes were deployed in vineyard smallholdings in the province of Castelló (Spain). Altogether, around 100,000 square metres of vineyards are covered. Different varieties of grapevine are tracked, such as Merlot, Monanstrell, Bonicaire and Cabernet, among others. The IoT nodes collected data for 130 days (from 13 May 2018 to 20 September 2018).
The observations captured were transferred to a central server where, through an analysis platform [21], the main component, called Influx, is able to analyse the time-series of the observations following the defined models in (near) real-time. More specifically, the Kapacitor component is the one that is able to follow the models and issue the possible alerts. A web application is provided to notify detected alerts.
The defined models are adaptations of previous works to warn fungal diseases, but in our study they have been adapted to work on the data coming from the IoT nodes in real-time, that is, the models will launch alerts at the same time as the weather conditions indicate it is necessary to do so. This feature is one of the improvements provided by the adaptations of the models, since the models were traditionally processed a posteriori. Therefore, it may be the case that the crop is already infected well before the alert is generated. As a result, the chemical product would be applied with a delay that may be too late, and thus a greater amount of the harvest would be lost.
This work shows the results of the models obtained by following the observations from one of the IoT nodes. During the monitoring period, different alerts were issued to inform and to ensure the appropriate treatments were performed to fight and eliminate the possible threat. Although the result presented here may seem to be verifying whether those infections have actually occurred, this is beyond the scope of the current work, since the models used are already based on previous scientific contributions, where their validation was carried out.
The main improvements from the farmer’s point of view are the reduction in the amount of phytosanitary products needed. By applying these models, farmers should only apply chemical products when an alert has been generated. In this way, they will make economic savings and reduce the possible impact on the environmental footprint. Another improvement is that farmers do not need to go to their smallholdings (again resulting in economic savings) to know their status. By using the above-mentioned web application, farmers will know the status of their fields in terms of weather conditions and possible threats of fungal diseases.
As future work, new disease models in the field of viticulture, such as phomopsis viticola [25] or antibiosis [26], could be adapted. Another possible extension would be the validation of the alerts by the farmers, that is, confirmation as to whether the alerts that they receive actually correspond to real infections on their smallholdings. To do so, by using the web application, the farmers would report whether the indicated disease has developed in their smallholding or not. This feedback would be enriched with the particular characteristics of each vine variety and could also be used to adapt the models presented to each vine variety using machine learning [27]. Another possible follow-up action is to perform a calibration of the low-cost stations used in this work with other official stations. Finally, we are considering the idea of applying and adapting the work to other types of crops with a strong dependence on meteorological variables, such as rice [28] or potatoes [29].
Author Contributions
Conceptualization, S.T.; Data curation, A.G.-P.; Funding acquisition, J.H.; Investigation, S.T.; Methodology, S.T.; Software, S.T. and A.G.-P.; Writing—original draft, S.T.; Writing—review & editing, A.G.-P. and J.H.
Funding
This research received no external funding.
Acknowledgments
Sergio Trilles has been funded by the postdoctoral programme Vali+d (GVA) (grant number APOSTD/2016/058) and GVA doctoral stays programme (grant number BEST/2018/053). The project is funded by the Universitat Jaume I-PINV 2017 (UJI-A2017-14).
Conflicts of Interest
The authors declare no conflict of interest in this article.
References
- Pimentel, D. Pest control in world agriculture. Agric. Sci. 2009, 2, 272–293. [Google Scholar]
- Abrol, D.P. Integrated Pest Management: Current Concepts and Ecological Perspective; Academic Press: Cambridge, MA, USA, 2013. [Google Scholar]
- Tripathy, A.; Adinarayana, J.; Sudharsan, D.; Merchant, S.; Desai, U.; Vijayalakshmi, K.; Reddy, D.R.; Sreenivas, G.; Ninomiya, S.; Hirafuji, M.; et al. Data mining and wireless sensor network for agriculture pest/disease predictions. In Proceedings of the 2011 World Congress on Information and Communication Technologies, Mumbai, India, 11–14 December 2011; pp. 1229–1234. [Google Scholar]
- Weissteiner, C.J.; Pistocchi, A.; Marinov, D.; Bouraoui, F.; Sala, S. An indicator to map diffuse chemical river pollution considering buffer capacity of riparian vegetation—A pan-European case study on pesticides. Sci. Total Environ. 2014, 484, 64–73. [Google Scholar] [CrossRef] [PubMed]
- Zhang, W.; Jiang, F.; Ou, J. Global pesticide consumption and pollution: With China as a focus. Proc. Int. Acad. Ecol. Environ. Sci. 2011, 1, 125. [Google Scholar]
- Zhao, Y.; Pei, Y. Risk evaluation of groundwater pollution by pesticides in China: A short review. Procedia Environ. Sci. 2012, 13, 1739–1747. [Google Scholar] [CrossRef]
- McBratney, A.; Whelan, B.; Ancev, T.; Bouma, J. Future directions of precision agriculture. Precis. Agric. 2005, 6, 7–23. [Google Scholar] [CrossRef]
- Gautam, H.; Bhardwaj, M.; Kumar, R. Climate change and its impact on plant diseases. Curr. Sci. 2013, 105, 1685–1691. [Google Scholar]
- Eitzinger, J.; Thaler, S.; Schmid, E.; Strauss, F.; Ferrise, R.; Moriondo, M.; Bindi, M.; Palosuo, T.; Rötter, R.; Kersebaum, K.; et al. Sensitivities of crop models to extreme weather conditions during flowering period demonstrated for maize and winter wheat in Austria. J. Agric. Sci. 2013, 151, 813–835. [Google Scholar] [CrossRef]
- Pesonen, L.A.; Teye, F.K.W.; Ronkainen, A.K.; Koistinen, M.O.; Kaivosoja, J.J.; Suomi, P.F.; Linkolehto, R.O. Cropinfra—An Internet-based service infrastructure to support crop production in future farms. Biosyst. Eng. 2014, 120, 92–101. [Google Scholar] [CrossRef]
- Trilles, S.; González-Pérez, A.; Huerta, J. A Comprehensive IoT Node Proposal Using Open Hardware. A Smart Farming Use Case to Monitor Vineyards. Electronics 2018, 7, 419. [Google Scholar]
- Goidànich, G. Manuale di Patologia Vegetale; Edagricole: Bologna, Italy, 1964; Volume 2. [Google Scholar]
- Carroll, J.; Wilcox, W. Effects of humidity on the development of grapevine powdery mildew. Phytopathology 2003, 93, 1137–1144. [Google Scholar] [CrossRef]
- Molitor, D.; Berkelmann-Loehnertz, B. Simulating the susceptibility of clusters to grape black rot infections depending on their phenological development. Crop Prot. 2011, 30, 1649–1654. [Google Scholar] [CrossRef]
- Broome, J.; English, J.; Marois, J.; Latorre, B.; Aviles, J. Development of an infection model for Botrytis bunch rot of grapes based on wetness duration and temperature. Phytopathology 1995, 85, 97–102. [Google Scholar] [CrossRef]
- Francesca, S.; Simona, G.; Francesco Nicola, T.; Andrea, R.; Vittorio, R.; Federico, S.; Cynthia, R.; Maria Lodovica, G. Downy mildew (Plasmopara viticola) epidemics on grapevine under climate change. Glob. Chang. Biol. 2006, 12, 1299–1307. [Google Scholar] [CrossRef]
- Barrios, G.; Reyes, J. Modelización del Mildiu de la Vid. Phytoma 2004, 164. [Google Scholar]
- Delp, C.J. Effect of temperature and humidity on the grape powdery mildew fungus. Phytopathology 1954, 44, 615–626. [Google Scholar]
- Columbia, M.B. Grape Powdery Mildew. Technical Report; 2015. Available online: https://www2.gov.bc.ca/assets/gov/farming-natural-resources-and-industry/agriculture-and-seafood/animal-and-crops/plant-health/grape_powdery_mildew.pdf (accessed on 14 January 2019).
- Spotts, R.A. Effect of leaf wetness duration and temperature on the infectivity of Guignardia bidwellii on grape leaves. Phytopathology 1977, 67, 1378–1381. [Google Scholar] [CrossRef]
- Trilles, S.; Gonzalez, A.; Huerta, J. An IoT middleware based on microservices and serverless paradigms. A smart farming use case to detect diseases in vineyard fields. Electronics 2018, submitted. [Google Scholar]
- Influx Data. Available online: https://www.influxdata.com/ (accessed on 11 December 2018).
- Kapacitor. Available online: https://www.influxdata.com/time-series-platform/kapacitor/ (accessed on 11 December 2018).
- McCutchan, M.H.; Fox, D.G. Effect of elevation and aspect on wind, temperature and humidity. J. Clim. Appl. Meteorol. 1986, 25, 1996–2013. [Google Scholar] [CrossRef]
- Erincik, O.; Madden, L.; Ferree, D.; Ellis, M. Temperature and wetness-duration requirements for grape leaf and cane infection by Phomopsis viticola. Plant Dis. 2003, 87, 832–840. [Google Scholar] [CrossRef]
- Cueva, C.; Moreno-Arribas, M.V.; Bartolomé, B.; Salazar, Ó.; Vicente, M.F.; Bills, G.F. Antibiosis of vineyard ecosystem fungi against food-borne microorganisms. Res. Microbiol. 2011, 162, 1043–1051. [Google Scholar] [CrossRef]
- Behmann, J.; Mahlein, A.K.; Rumpf, T.; Römer, C.; Plümer, L. A review of advanced machine learning methods for the detection of biotic stress in precision crop protection. Precis. Agric. 2015, 16, 239–260. [Google Scholar] [CrossRef]
- Huber, L.; Gillespie, T. Modeling leaf wetness in relation to plant disease epidemiology. Annu. Rev. Phytopathol. 1992, 30, 553–577. [Google Scholar] [CrossRef]
- Hijmans, R.; Forbes, G.; Walker, T. Estimating the global severity of potato late blight with GIS-linked disease forecast models. Plant Pathol. 2000, 49, 697–705. [Google Scholar] [CrossRef]
© 2019 by the authors. Licensee MDPI, Basel, Switzerland. This article is an open access article distributed under the terms and conditions of the Creative Commons Attribution (CC BY) license (http://creativecommons.org/licenses/by/4.0/).