1. Introduction
For environmental and energy dependency reasons, improving energy efficiency in buildings is a major priority in the public agenda of industrialized countries [
1]. In the European Union, the Energy Performance of Buildings Directive (2002/91/EC), also known as EPBD, is the main policy instrument aimed to promote energy efficiency in the real estate market [
2]. The EPBD introduced Energy Performance Certificates (EPCs) to provide tenants and buyers with synthetic and third-party information regarding the efficiency of real estate to eliminate market asymmetries. Such a strategy is relevant since market failures, in the form of imperfect information and asymmetries, are suggested to be barriers in the diffusion of efficient buildings [
3], producing an “energy gap” (i.e., a rate of adoption well below the social optimum) [
4]. Therefore, the recast of the Directive in 2010 (2010/31/EU) made it mandatory to include EPC labels in the marketing of almost all new and existing buildings in order to inform prospective users.
As efficient buildings can save money in energy bills and reduce environmental impacts it is expected that informed tenants and buyers were willing to pay more for efficient real estate. Eventually, such willingness to pay for efficient buildings may capitalize into “market premiums”, generating incentives for developers and owners to invest in energy efficiency [
5]. In sum, the European Commission saw the EPC scheme as “a power tool to create a demand-driven market for energy efficient buildings (p. 5) [
6].
Among all the real estate markets, the residential one is a special case since, due to the size of its stock, it consumes much more energy than commercial properties [
7]. In the literature, there is extensive, yet in some case inconclusive, evidence regarding the existence of market premiums for efficient homes. According to the studies reviewed in the next section, home selling prices can vary up to 30.5% (for rating A, the most efficient one, in relation to rating G as the most inefficient) in the Danish case [
8] or as little as 5% (A/G) in the case of the Irish renting market [
9]. However, there is evidence suggesting that EPC labels do not play any role in price discrimination in the Oslo market [
1]. Differences in climate and energy costs in relation to home prices and, perhaps, environmental concerns may be behind such divergences. As such, there are no reasons to believe that the impact of EPC labels is stationary across housing segments within the same city, where household budgets, personal tastes, and priorities, as well as home attributes and prices also vary in a significant manner. As a matter of fact, in the office market, there is evidence suggesting that “green labels” are contingent to characteristics of buildings in the determination of prices [
10].
The aim of this paper is to test whether the impact of EPC ratings on housing prices is the same in different market segments within a city. This analysis is relevant since the identification of divergent impacts may help to orientate specific energy and housing public policies, while simultaneously signaling opportunities for private developers. With this objective, this study uses data of listed apartments in metropolitan Barcelona. This case is worth studying due to the late and overnight transposition of the 2010 EPBD in Spain: only 47 days separated the date of the publication of the RD 235/2013 (that transposed the Directive) and the 1st of June of 2013 when it was mandatory to include the EPC labels in real estate marketing. At the same time, due to the financial crisis, the public campaigns were almost nonexistent, making it impossible to make the households aware of the meaning and utility of the EPC scheme. Broadly, the methodology consists of: (1) Acquire, geoprocess and depurate the data, (2) Calibrate a hedonic model for the entire depurated sample of 3479 apartments, (3) split the sample into housing segments using a multivariate approach, (4) calibrate specific models for each of the segments, and (5) identify whether the hedonic agenda for each of the segments is statistically different. The main novelty of this approach, in relation to the previous studies that have analyzed market segments [
9,
11,
12,
13], lies precisely in the segmentation of the market based on the multiple urban and architectural attributes that effectively affect the formation of real estate prices.
The results suggest that, in general, there is a modest impact of EPC ratings, being quite lower than that reported in other countries. In fact, the relationship between this surcharge and the energy rantings is not linear, but tends to be exponential, so there is a psychological effect that especially rewards the select club that makes up the “A” rated apartments (the most efficient ones). However, this premium is not homogeneous throughout the different residential segments. In fact, in the newer homes that largely featured active air conditioning systems and boasted architectural layout advantages (e.g., more bathrooms or being equipped with a condominium pool) or of being higher quality, energy rating plays no role whatsoever in the formation of real estate prices. On the contrary, in the case of dwellings built during the post-war period, which usually located in low-income areas, characterized by low prices and few architectural features, energy rating emerges as an important driver in listing price formation. Finally, for the segment of older dwellings, usually located in the 19th Century Expansion areas and wealthy neighborhoods, there is also a market premium, although it is lower than in the case of the worst dwellings. These findings have repercussions that lie at the very heart of energy policy and, also, in the strategies of private developers as discussed in the concluding section.
The remainder of this paper is organized as follows: first, a review of the studies identifying the marginal price of EPC rating; next, a description of the scope of the study, materials and methods; followed by the discussion of the results; and, as a conclusion, the presentation of the findings in the framework of energy policy and private markets.
2. The Impact of Energy Ratings on Prices
The positive relationship between the green labels introduced before the EPC scheme (e.g., BREEAM-Building Research Establishment Environmental Assessment Method, HQE-High Quality Environmental standard, LEED-Leadership in Energy and Environmental Design, Green Mark, Energy Star and Minergie) and both rental and sales prices is well studied in the literature and stands in contrast with the relatively reduced number of studies focused on the EPC scheme. These papers share a common methodology (based on the hedonic analyzes of marginal prices) and the same information sources (in the absence of transaction prices, they refer mainly listing data).
The reform of the EPBD (2010/31/EU) and Directive 2012/27/31 set the current framework for the transposition of energy certification into the Member States. Within this context, the pioneering study by Brounen & Kok [
14] analyzed the impact of these new “green labels” on residential prices in the Netherlands; although the data used comes from the period in which the buyer could exempt the seller from providing the EPC. The results of this study found a positive correlation between the best rated dwellings and sales prices verified in real estate transactions. Such authors, like almost all others whose work has been summarised in
Table 1, assume that energy ratings constitute a categorical measure of energy efficiency. Therefore, considering the intermediate rate “D” as the basis for comparison, they found that the marginal price moves from +10% for rate “A” to −5% for rate “G”, i.e., “market premiums” are formed above the reference situation, while below such threshold market penalties or “brown discounts” (i.e., price reductions) emerge. The study conducted by Hyland et al. [
9], in different Irish cities, was the first to simultaneously compare the impact of EPCs on the rental and sale listing prices. In general, they found that the impact of the energy labelling is higher in the sale market than in the rental market. For example, a dwelling for sale ranked as “A” (in relation to “D”) has a market premium of +9.30%, and only a premium of +1.80% if it is in the rental market, holding everything else equal. Similarly, the “brown discount” for a home rated as class “F” or “G” (in relation to “D”) is significantly larger (−10.60%) than another one on the rental market (−3.20%). The larger impact of green labels on sales prices in relation to rental prices is a finding that had already been reported by previous work based on other certification schemes. Examples of such research are the work regarding LEED offices in the US (+31.40% for sale and only +9.20% for rent) [
15]; LEED offices (+11.10% for sale and only +5.80% for rent) and Energy Star (+13.00% for sale and only + 2.10% for rent) [
16]. The unequal impact of energy labels on rental and sale prices has an impact on yields, for example, Fuerst & McAllister [
15] demonstrated the inverse relationship between yields and energy ratings of the BREEAM scheme for the English office market. It seems, therefore, that investors do value efficient buildings as a result of a better marketability, lower vacancy rates, and lower depreciation [
17,
18]; in relation to office tenants for whom the savings in energy bills are marginal in relation to operating expenses (e.g., salaries).
From
Table 1, the work of the Biointelligence Service [
5] stands out. This organization was commissioned directly by the European Commission as part of the studies aimed at assessing the effectiveness of the EPBD. It shows the impact of EPC in several countries, with the novelty that the energy rating has been taken as continuous and not categorical. Yet again, the impact of EPC is sharper in selling prices than in rental prices. From this study, it should be noted that EPC ratings seem to have a larger impact on hinterlands (e.g., Belgium and Ireland, with Austria as an exception) than in capital cities. According to the authors, this differential impact is explained by the fact that savings in energy bills are more important, in relation to the base price, in dwellings in smaller urban areas (where housing is cheaper) than in capital cities. Moreover, a higher energy rating does not always imply a market premium. In the Oxford rental market apparently there is a penalty for the best-rated dwellings (−4.00% per EPC class). However, the authors acknowledge the enormous deficiencies of their analysis since in this city, the older, better located and high-priced mansions do rank low in the efficiency ladder. In general, the very poor control of urban characteristics (e.g., accessibility, quality of urbanization and neighborhood effect affecting residential values as studied since Roca [
19]) is a deficiency of such work and can bias the coefficients of their models.
Finally, from
Table 1, it is also worth mentioning the work by Jensen et al. [
8] has found that a clear increase of the energy rating premium in Denmark as the inclusion of the EPC label became mandatory in 2010. Denmark was the first country to introduce, in 1997, an “A”–“G” energy label for buildings, well before the first EPBD came into force; nonetheless, according to such authors, only in 2011 did Danish real estate agents begin to claim that properties with higher EPC rating were the easiest properties to sell.
However, the positive impact on prices reviewed before contrasts with the outcomes of opinion-based research. Murphy [
20] conducted a survey in the Netherlands in order to identify the impact of EPC information on price negotiation in the context of home purchasing. Her results suggest that “a higher EPC fails to have a direct influence during negotiation and decision making” (p. 666). In the same line, Parkinson et al. [
21] have found no correlation between EPC ratings and rental values while surveying commercial office occupants in the UK. Their findings suggest that facilities’ aesthetics are the main driver of rents. Compatible evidence can be found in the study of Pascual et al. [
22] based on surveys applied to real estate agents in eight countries. According to their results, EPC ratings exert a negligible impact on housing prices, this conclusion is especially valid in the case of Spain where only 15% of the surveyed agents confirmed the existence of a premium for efficient flats. Departing from such contradictory evidence, that is: on the one hand a positive market premium for efficient properties suggested by hedonic models; and on the other hand, no strong evidence on EPC impact on prices and rents coming from demand and agents’ surveys, Olaussen et al. [
1] have carried out an interesting quasi-natural experiment in order to identify whether omitted variables in model specifications can lead to spurious results. Their study, based on Oslo’s residential market, consists of analyzing the price of homes sold before and after July 2010 when it became mandatory to include the EPC labels in advertisements, so as to identify whether such labels did actually produce a price increase in the case of efficient homes. In doing so, they assigned the EPC class to each home in the pre-2010 sample according to the class the same home had in the post-2010 sample. Their hedonic results show similar market premiums and penalties on EPC ratings for the pre and post 2010 samples, allowing them to conclude that “price premium of the energy labels clearly captures something else rather than an effect caused by the labels themselves” (p. 251). Nonetheless, such authors warn that even though EPC rating does not matter in Norway, they could matter in other countries, possibly where trust and honesty in the building industry are lacking. All in all, it is necessary to carefully incorporate control variables, as is done in this paper, in order to reduce the risk of omitting relevant attributes.
So far, there is a great divergence, yet inconclusive evidence, regarding the impact of EPCs on residential values across Europe, perhaps explained by the important differences in terms of income, energy costs, construction regulations/traditions, climate, and environmental concerns. Furthermore, the way the EPBD has been transposed across the countries has resulted in divergent calculation methods, often supported by previous national regulations, making it difficult to assess cross-border comparisons [
23]. In this context in Spain there are two pioneering works in the study of the hedonic agenda of the EPC ratings. De Ayala et al. [
24] base their study on opinion-values declared by a sample of non-specialist respondents from 5 cities (Madrid, Bilbao, Seville, Vitoria and Malaga). In their study energy rating is produced by their own estimation. They determine that dwellings rated as A, B or C have a value (in the opinion of their owners) +9.80% higher than those rated as D, E, F or G. On the other hand, Marmolejo [
25] uses listing selling prices in Barcelona, finding a marked premium of +5.11% from the G to A rates, or of +9.62% if it is accepted that buyers perceive the rating scale to be nominal. Both studies need revisiting, the former not only because it analyzes opinion values but also because it makes little control of micro-locational and structural factors that have a paramount influence on values, and their omission can bias the coefficients; and the latter, because precisely these micro-locational factors make the variable "EPC rating" become statistically significant in the models, and therefore suggests a heterogeneous impact of this factor along the real estate market. Further EPC research in Spain includes: the work by Bian & Fabra [
26] regarding the incentives that owners have to deliver EPC information; the work by González [
27] on the shortcomings in the EPC scheme based on in-depth interviews to energy certifiers; and Taltavull et al. [
28] on the hedonic agenda of EPCs in Alicante. Therefore, this paper aims to explore this aspect in greater detail.
2.1. The Impact of the EPC Rating may Differ between Market Segments
The studies researching the impact of EPC ratings among segments depart from univariate segmentations using variables such as area, age or typology of homes. In Sweden, Pontus et al. [
11] have made a particular study in which the sale price of housing has been correlated directly with the energy consumption stated in the very EP certificate. The coefficient of energy consumption in their hedonic model, built on the entire housing sample, appears with a contradictory sign (Bx = 0.06, p = 0.000, where “x” is the log of consumption in kWh/year/sq. m. and “Y” the log of the price per sq. m.): that is, the higher the consumption in kWh/year/sq. m., the higher the price of housing, with everything else being equal. However, they conclude exactly the opposite when the sample is segmented, that is, the higher the energy consumption the lower the price. This conclusion is especially valid for the quartile of cheaper housing, which indicates that households with tight budgets that can only access the cheaper housing seem to value energy-bill savings from efficient dwellings. In contrast, those who can afford the purchase of dwellings with unit prices in the upper quartile seem to attribute zero importance to the EPC rating. Likewise, these authors find a market premium for dwellings built before 1960, since in general these houses have less quality and therefore those rehabilitated (with a better rating) are distinguished among houses of equal age. In the same sense, in Ireland, the impact of an EPC step on a 2-room apartment equals an increase of 2.3%, whereas in the 3-room and 4–5-room apartments this increase is lower and stands at 1.70% and 1.60% respectively [
9]. Fuerst et al. [
12] have found that the greatest impact of the EPC on the English residential market occurs in townhouses and that the impact on apartments is larger than that on detached houses. This situation might imply several things, among others that the potential consumption savings are more important for the cheaper houses occupied by people of lower income levels, conclusions that are convergent, with the results of Pontus et al. [
11]. However, the previous results are contradictory to the results of Salvi et al. [
13] who studied the impact of the Minergie certification in Switzerland and found a larger impact in the single-family dwellings in relation to apartments. They argue that this finding is compatible with larger energy savings produced by larger energy demand in single-family dwellings.
So far, the studies reviewed performed univariate segmentation, neglecting the fact that market segments are made of the combination of multiple attributes regarding architectural and locative features and therefore it is necessary to take them into consideration simultaneously as is done in this paper.
3. Methods and Materials
This chapter describes the methods and materials used in two different subsections. It is worth stating that the hedonic procedure followed in this paper requires using housing prices in order to identify marginal prices of energy ratings. In Spain transaction data, at an individual level, portraying all the structural and architectonic features of homes is not available. In absence of such data, we use listing prices as discussed in
Section 3.2. Also, the hedonic procedure requires the introduction of control variables in order to isolate the effect of energy ratings.
Section 3.2 contains the control attributes used.
3.1. Methods
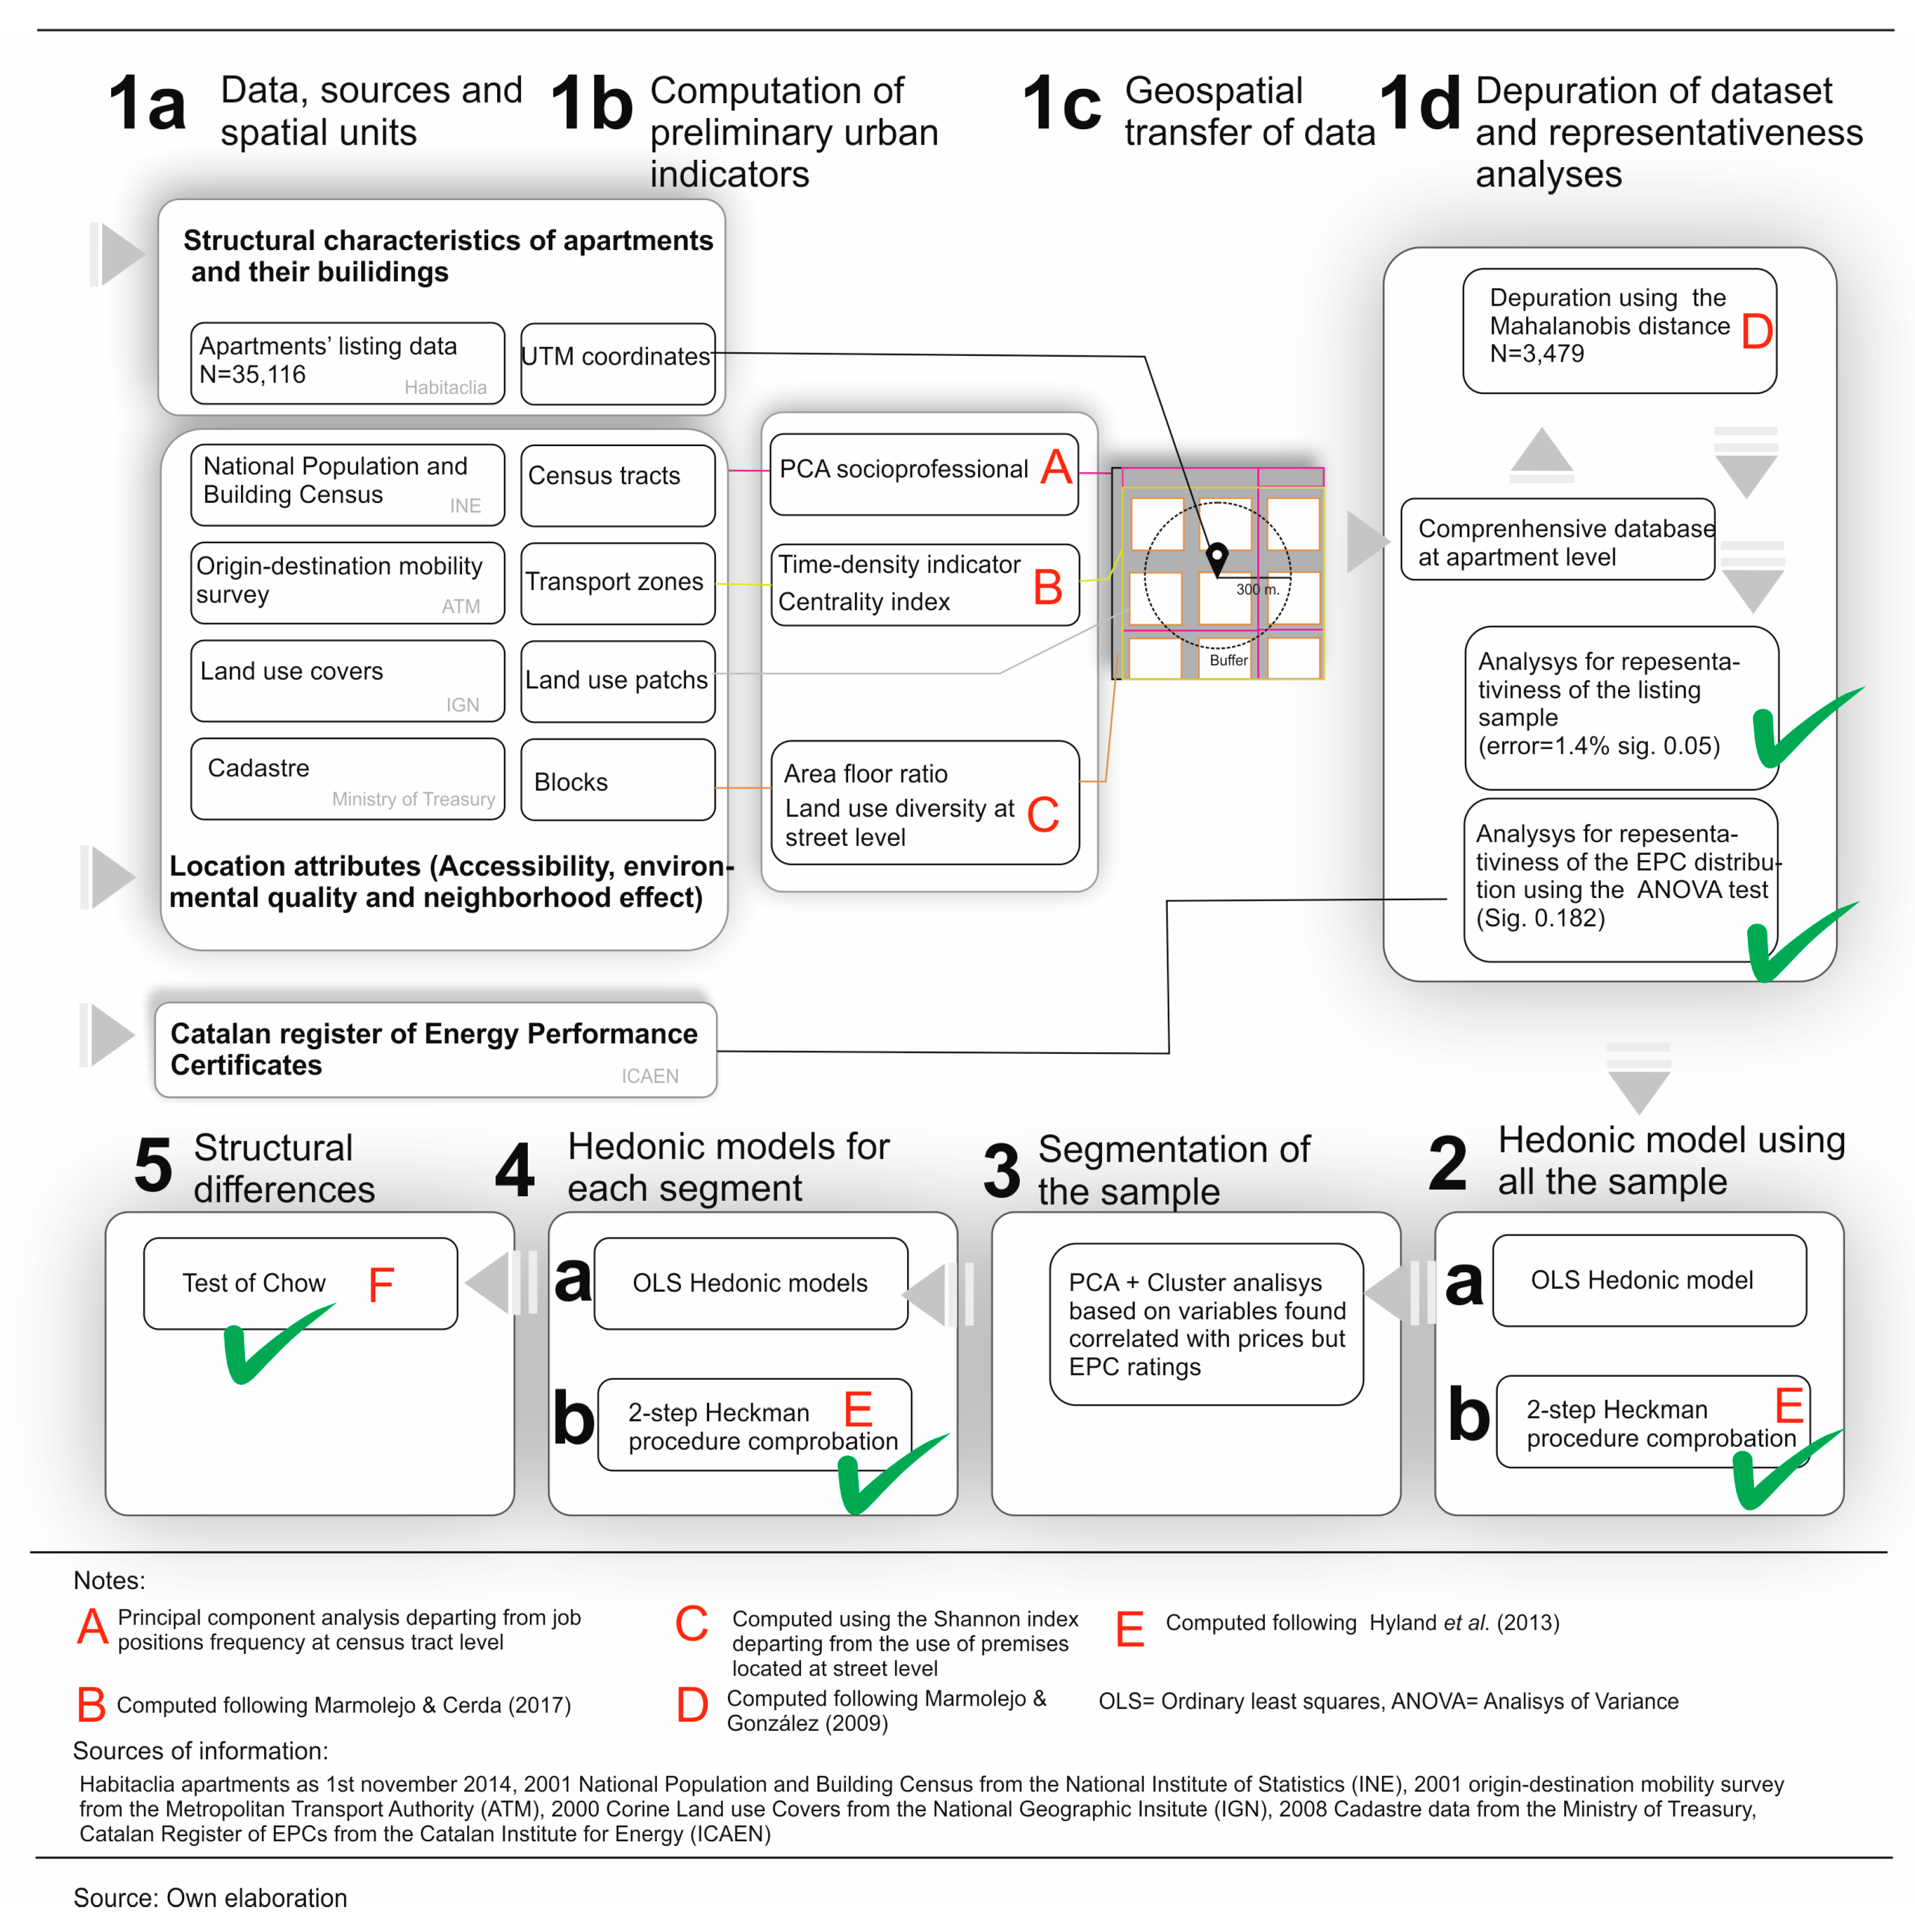
The methodology was established in five stages (see details, data sources and flow procedure in
Figure 1):
(1). Data acquisition, preliminary indexes computation, geoprocessing, depuration and representativeness analyses. This stage consists of:
- (a)
Data gathering from different sources of information regarding listing apartment data and urban and territorial features. Each of the data sources has a specific geographic unit.
- (b)
Computation of preliminary urban indicators. Using job positions data from census information, a principal component analysis (PCA) has been performed in order to eliminate concomitant information. Thus, the larger the value of “CP-high-socioeconomic-level” index, the larger the proportion residents holding managerial, officers and intellectual job positions. Utilizing trip-chain information and following the example of reference [
29], two indicators for centrality have been computed: time-density stands for the number of hours per urbanized km
2 that people spend in a given transport zone; the centrality index accounts for the time-density, diversity of activities performed by people and nodality in transport zones. The floor area ratio is calculated from the built area and the urbanized surface from the cadastral dataset. Finally, the land use diversity is computed using the Shannon index and data from the utilization of built premises at street level.
- (c)
Transferring of territorial and urban data to an apartments database. By means of a geoprocess the original data and the preliminary urban indicators have been transferred to each of the apartments in the dataset. This specific process consists of using a buffer analysis where data is transferred according to the intersected area. In order to determine the radius of the buffer, a cross-validation procedure has been implemented. Such procedure consists of calibrating preliminary hedonic models and identifying the radius that leads to the largest covariance. After testing a 300, 600 and 900 m. radius, the first was selected.
- (d)
Depuration of the dataset and representativeness analyses. Following reference [
30], the Mahalanobis distance has been used so as to eliminate outliers on a multi-attribute basis. Also, apartments with no EPC information have been discarded. In order to test whether the depurated sample is representative of the original non-depurated sample and representative of the EPC rating distribution contained in the EPC Catalan Official Register, two tests have been implemented. The first accounts for the statistical representativeness of the
number of apartments, the second, using the ANOVA (Analysis of Variance) accounts for the representativeness of the
distribution of EPC ratings.
(2). Specification and calibrationof a hedonic modelfor all thedepurated sample.
- (a)
Departing from the depurated sample, a hedonic model has been implemented as being further detailed.
- (b)
In order to assure the robustness of the results regarding a possible selection bias, the 2-step Heckman procedure has been implemented, see below.
(3). Segmentation of the depurated sample.
First, a principal component analysis has been implemented so as to eliminate redundant information, such analysis has departed from the variables found to be correlated with prices in the model specified in (2) except for the EPC ratings in order to avoid endogeneity issues. Next, the apartments have been classified using a 2-step cluster analysis, considering the principal components previously calculated as segmentation variables.
(4). Specification and calibration of hedonic models for each of the segments.
The same procedure described in (2) has been repeated for each of the housing segments.
(5). Finally, structural differences in the hedonic agenda for each of the segments have been identified using the Test of Chow.
The hedonic analysis assumes that the value of a dwelling can be broken down into the implicit value of each of the residential attributes [
12]. Therefore, it is based on the hypothesis that households make their residential choices by matching the marginal utility of housing attributes with their marginal price. Through a multivariate statistical procedure, the implicit price of each of these factors can be delineated [
31]. In the literature, it is usual for this marginal value to be calculated through a regression model using, in the absence of a clear theoretical posture, a log-linear specification [
32]. This procedure has several virtues, on one hand, it facilitates that the distribution of the dependent variable (the price) approaches normality, thus enabling calibration using OLS (Ordinary Least Squares) while also reducing the statistical problem of heteroscedasticity [
33] and on the other, it allows for interpreting the coefficients as semi-elasticities: the percent change in price produced by a unitary increment of the independent variable.
In this paper the functional expression being used is:
In Equation (1),
ln(P) is the natural logarithm of the listing price of the depurated sample;
A is a vector that includes the architectural characteristics of each of the studied dwellings (including energy rating);
E is the same but referred to the building, while studied dwellings are multi-family type, so that there are common services (e.g., lift or swimming pool) that can influence the price of these;
L is a vector that internalizes the spatial factors of urban and socioeconomic nature that impact on the formation of residential prices through land rent; finally
B are the coefficients representing semi-elasticities and
e is the error term.
As will be explained in the next subsection, a large proportion of apartments does not contain an EPC rating. This fact reflects sellers not adhering to the obligation to exhibit the EPC label in the advertising as the Royal Decree 235/2013 mandates. This issue may introduce a sample selection bias if the sellers exhibiting the EPC label are not randomly distributed among the non-depurated sample. So, in order to fully assure the robustness of the analysis, as suggested in reference [
9], the 2-step Heckman model has been implemented. Such a model has been built as follows:
First, a logistic model has been specified with the variables correlated with the presence of an EPC energy rating. The variables found to influence the probability of the presence of such information are: area, swimming pool, lift, air conditioner, heating, and socioeconomic indicators of the location of the apartments. In general, the poorer apartments exhibit a larger probability of including the EPC information in its advertisement.
Second, using the above-stated variables as “selection variables” the 2-steps Heckman procedure has been implemented.
3.2. Case Study and Materials
The area of study comprises the 178 municipalities of the Metropolitan Transport Authority of Barcelona (3760 sq. km; 5.2 million residents in 2015) containing multifamily-dwelling listing data. Listing data was retrieved from Habitaclia, one of the largest real estate advertising websites in Catalonia, and refers to the first quarter of 2015. It is worth stating that multifamily housing is the predominant dwelling typology in the case study.
Data on urban and socioeconomic characterization come from: Cadastre (2008), Census (2001), (the use of the 2011 Census has been discarded due to its poor representativeness at census tract scale), Origin-Destination Daily Mobility Survey (2001); and land use data from the CORINE Land Cover 2000 project. Data from the Official EPC Register of the Catalan Institute of Energy (2014) has been retrieved to test whether our sample fits the general EPC rating distribution.
The non-depurated universe is made up of 35,116 apartments. After discarding the cases with no EPC information and eliminating outliers on a multivariate basis, the depurated sample is made up of 3,479 apartments. Yet it is still representative of the universe of listed apartments (error = 1.4% sig. = 0.05). Also, according to the ANOVA test (sig. = 0.182) it is representative of the EPC rating distribution contained in the Official EPC Register. All in all, the depurated sample represents both the listed apartments and the energy efficiency performance of the certified housing stock.
Table 2 contains the descriptive statistics of the depurated sample. The average apartment is sold for 160 thousand Euro and has 84 sq. m, with 1.29 bathrooms and 2.9 bedrooms. In general, 29% of the sample have air conditioning, 42% have heating and 45% have elevators, while only 4% have a communal swimming pool. The people with a university degree living in the housing environment range from 2.34% to 66.10%. Finally, on an ordinal scale (A = 7, G = 1), the average EPC rating is 2.7. The dichotomous indicator “quality/retrofit” is constructed upon a semantic analysis of the description included in the advertisements, highlighting the high quality of the finishing, outstanding design or the fact that properties have been retrofitted. Only 10% of the depurated sample can be considered as “qualified/retrofitted”. Finally, the important dispersion of variables stresses the large differences in housing and locative attributes across the city.
4. The Energy Performance of Housing in the Case Study
This chapter portrays the distribution of energy ratings in the case study as a preliminary stage before explaining the results coming from hedonic analyses.
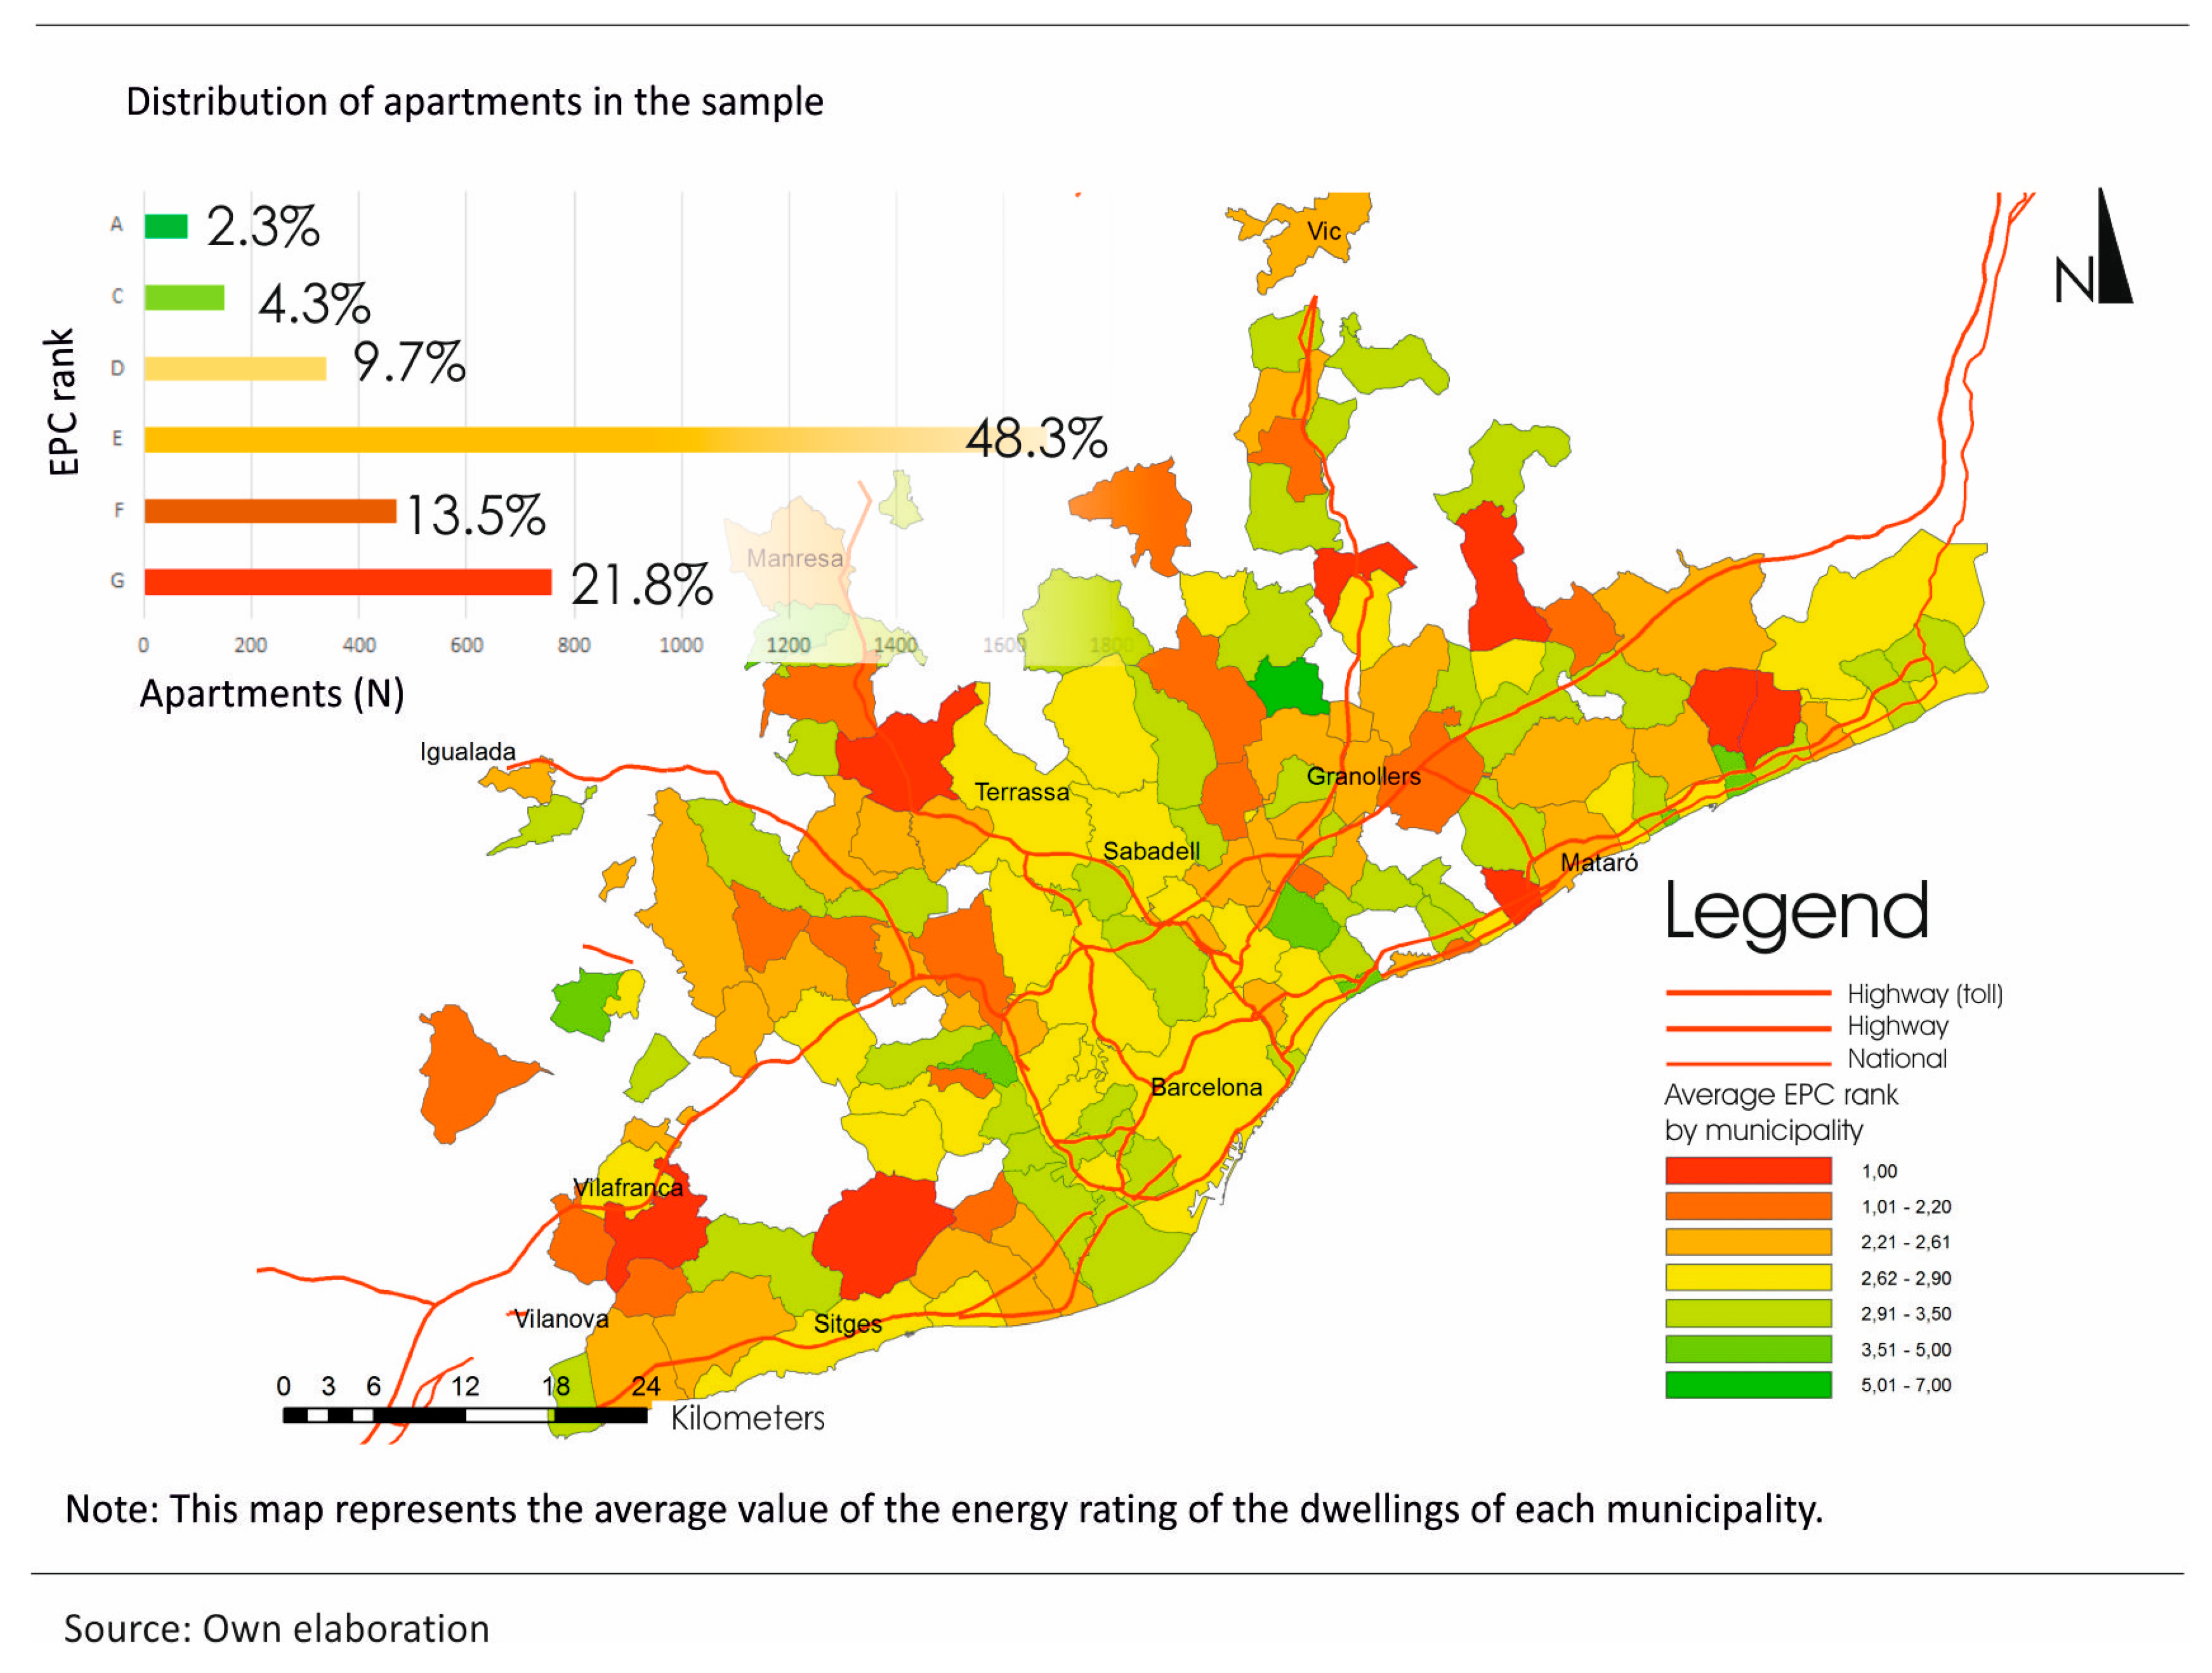
Figure 2 depicts the distribution of EPC ratings, the vast majority of dwellings are rated “E” (48.30%), followed in this order by letters "G" (21.80%), “F” (13.50%), “D” (9.70%) and “C” (4.30%), while the best “A” is reserved only for a select club of properties that represent 2.30% of the sample. It is worth saying that the depurated sample does not contain “B” rated homes, as in general there are very few cases holding such a rating. The reason for this is that developers willing to invest in efficient homes do prefer to pay for the small marginal cost that enables upgrading the performance of the homes up to rating “A”.
Figure 2 also shows the spatial distribution of the analyzed sample according to its energy efficiency. Urban centres (labelled on the map) such as Barcelona and sub-centres exhibit medium and low-medium efficient dwellings. In contrast, the peripheral municipalities, especially those located in the suburbs of the previous sub-centres, have better-qualified stock. Rural municipalities (functionally integrated to Barcelona) depict the least efficient housing. In these ultra-peripheral municipalities, during the 1960s and 1970s a large number of low-quality dwellings were built, often in suburbs of illegal origin. Thus, paradoxically, peripheral areas with low-density layouts (i.e., urban sprawled) which are energy-intensive in terms of transportation due to their car dependency have many energy efficient dwellings.
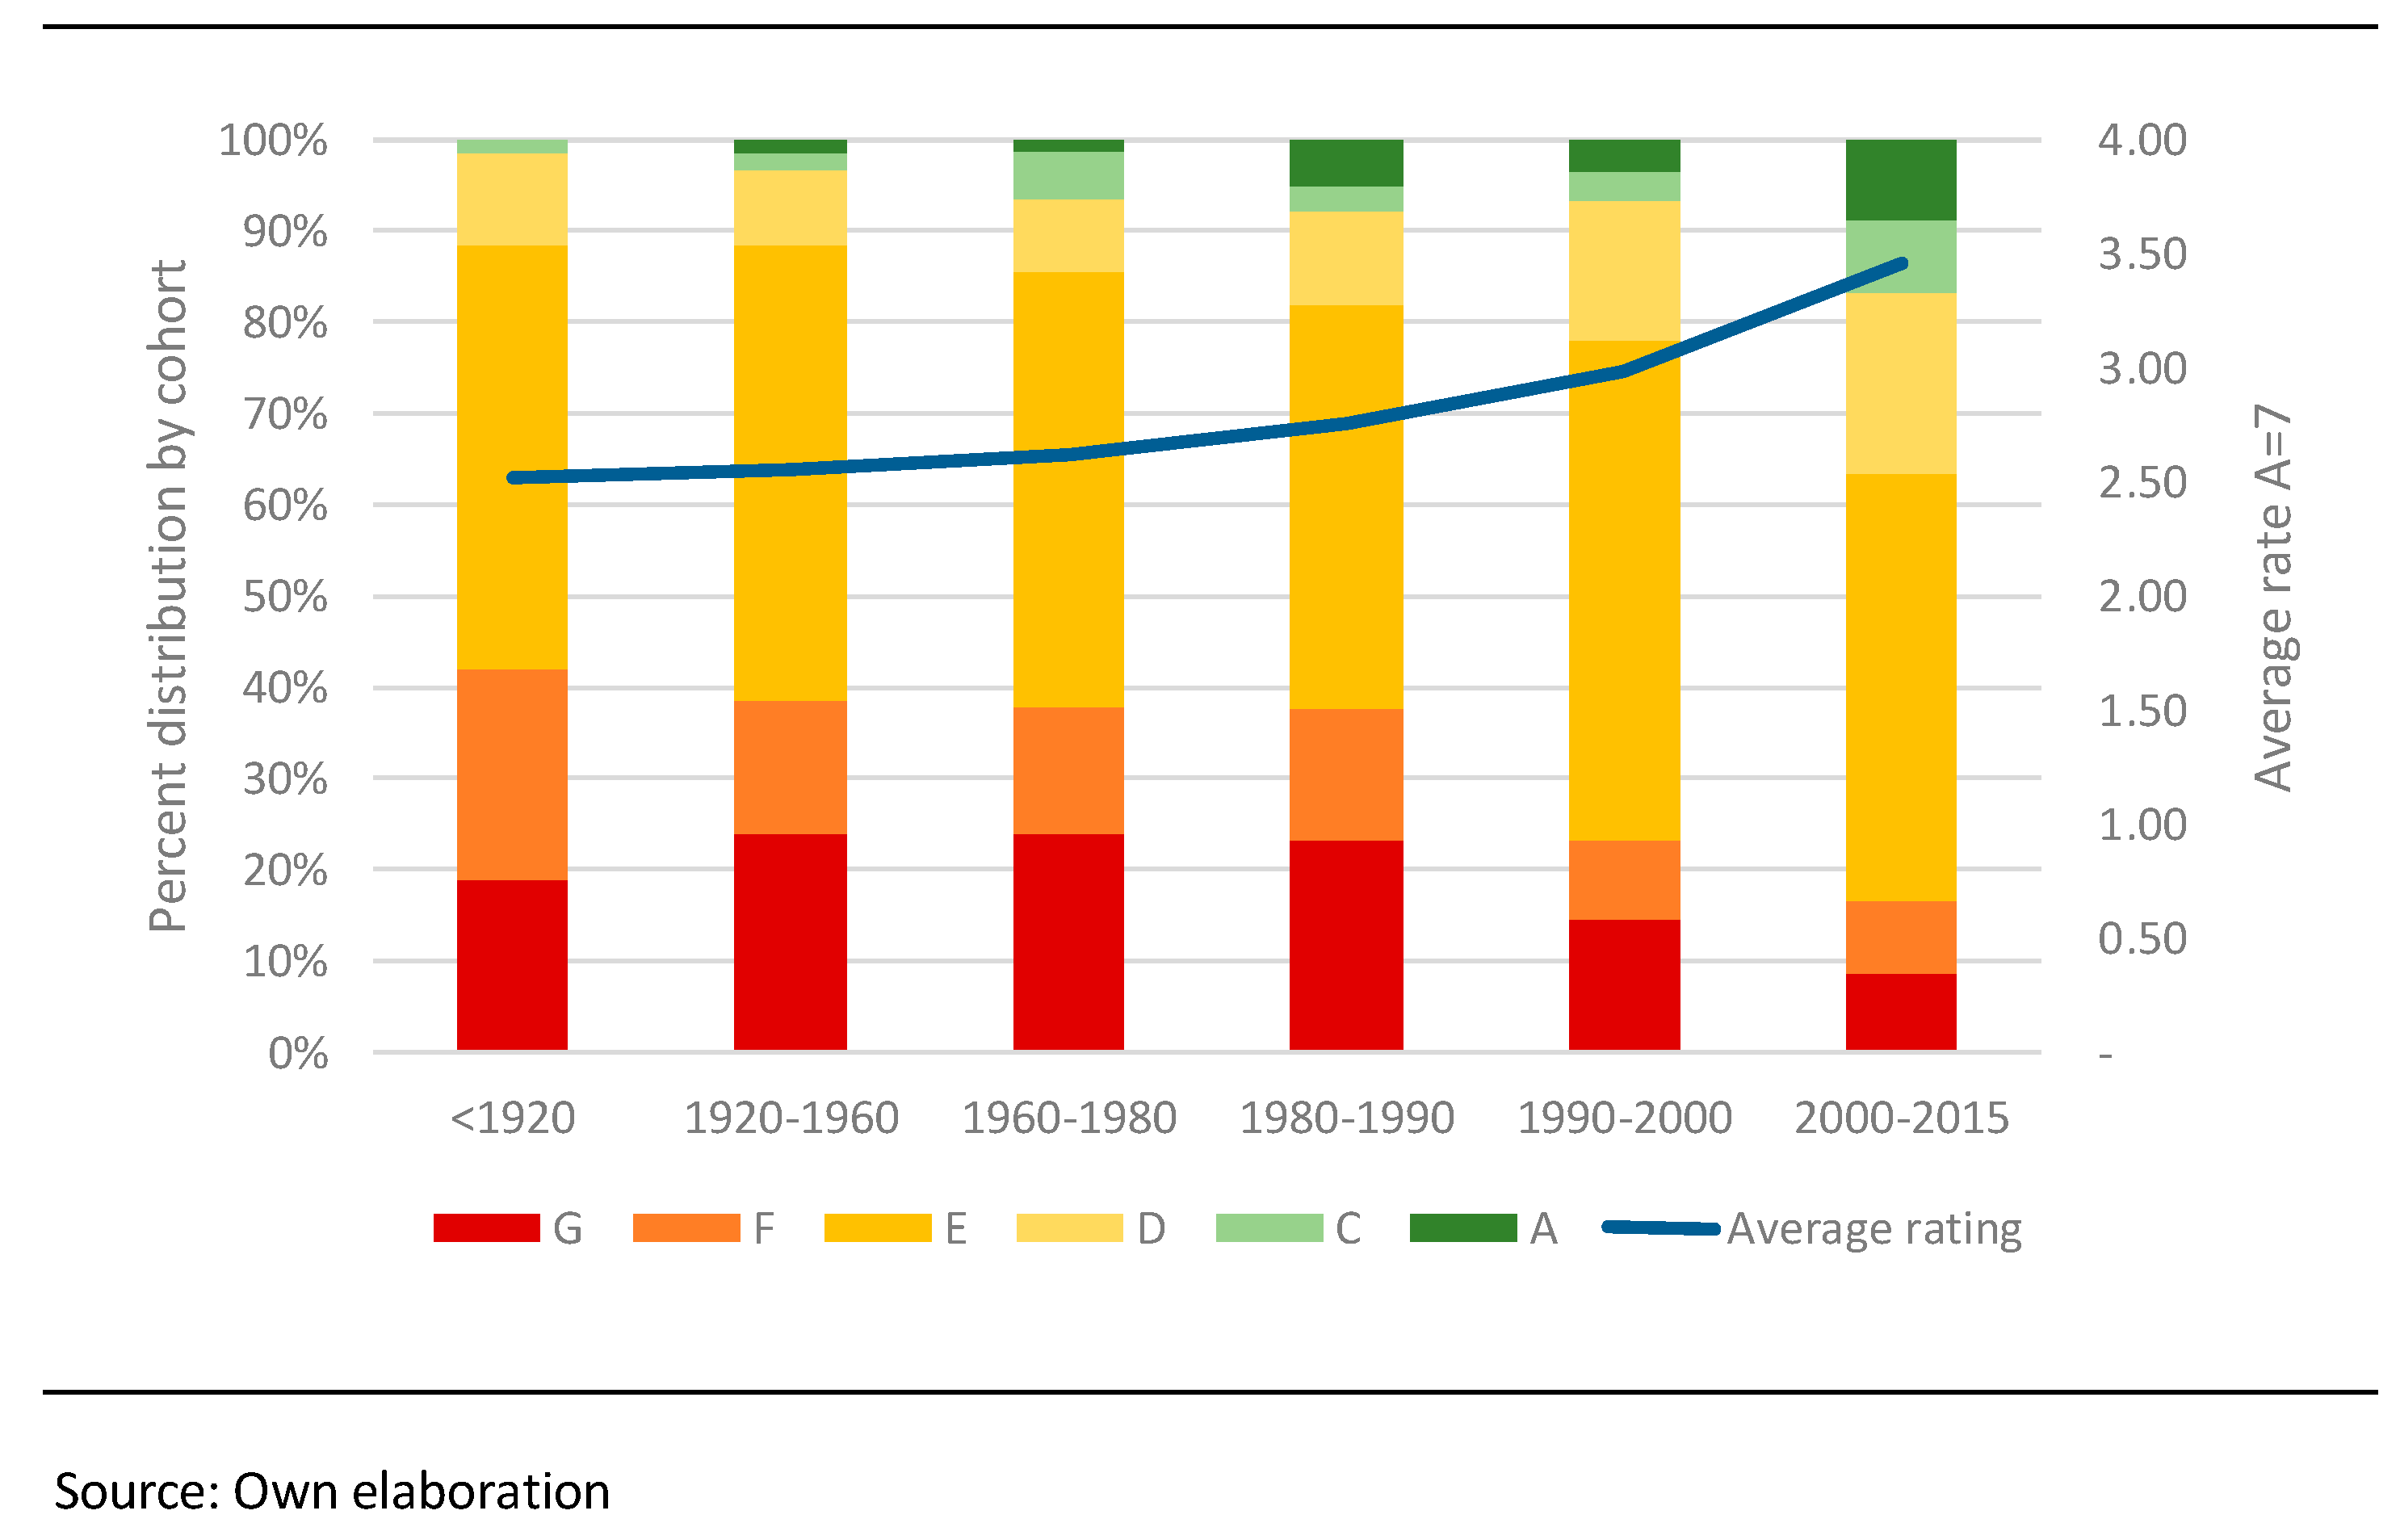
Behind the aforementioned spatial distribution, the construction year does play a role, since the first thermal isolation legislation in Spain dates back only to 1978 (becoming effective in 1981).
Figure 3 shows the declining proportion of buildings ranked with “G”+”F”+”E”, especially after the “Oil Crisis” and the end of the post-war period where there is a proportional increase of the best-ranked dwellings. Thus, the average score (A = 7, G = 1) increases from 2.52 for dwellings built before 1920 to 3.46 for those built after the year 2000. In this last cohort, the minimum energy efficiency requirements DB-HE of the Spanish Technical Construction Code (RD 314/2006, RD 1371/2007, OM FOM 1635/2013) have had little impact due to a large reduction of new dwellings after the crisis of the construction industry started in 2007.
In short, the residential stock listed in the Metropolitan Area of Barcelona is characterized by a very poor energy efficiency. Although this situation is not significantly worse than that reported by Fuerst et al. [
12] for the English residential market, their study based on sales data shows that 48% of the apartments are ranked “D”, while only one of the 85,007 apartments analyzed is rated as “A”. In this study, the average ordinal score is 2.7, better than the rating of the houses located in the cities of the south of Spain that were studied by De Ayala et al. [
24].
5. Results and Discussion
Regarding the possible selection bias discussed in
Section 3.1, it seems to be minimal just as expected (due the similar distribution of EPC ratings in the depurated dataset and in the official register). Despite the fact that the inverse of the Mill’s ratio appears to be significant (B = 0.47; sig. = 0.02) in the second stage of the 2-step Heckman procedure, the coefficients of the remaining variables are practically the same than those obtained in the OLS model. For the sake of simplicity, the results are focused in the OLS models, nonetheless, at the bottom of each table, the coefficients for EPC classes coming from the Heckman procedure are detailed.
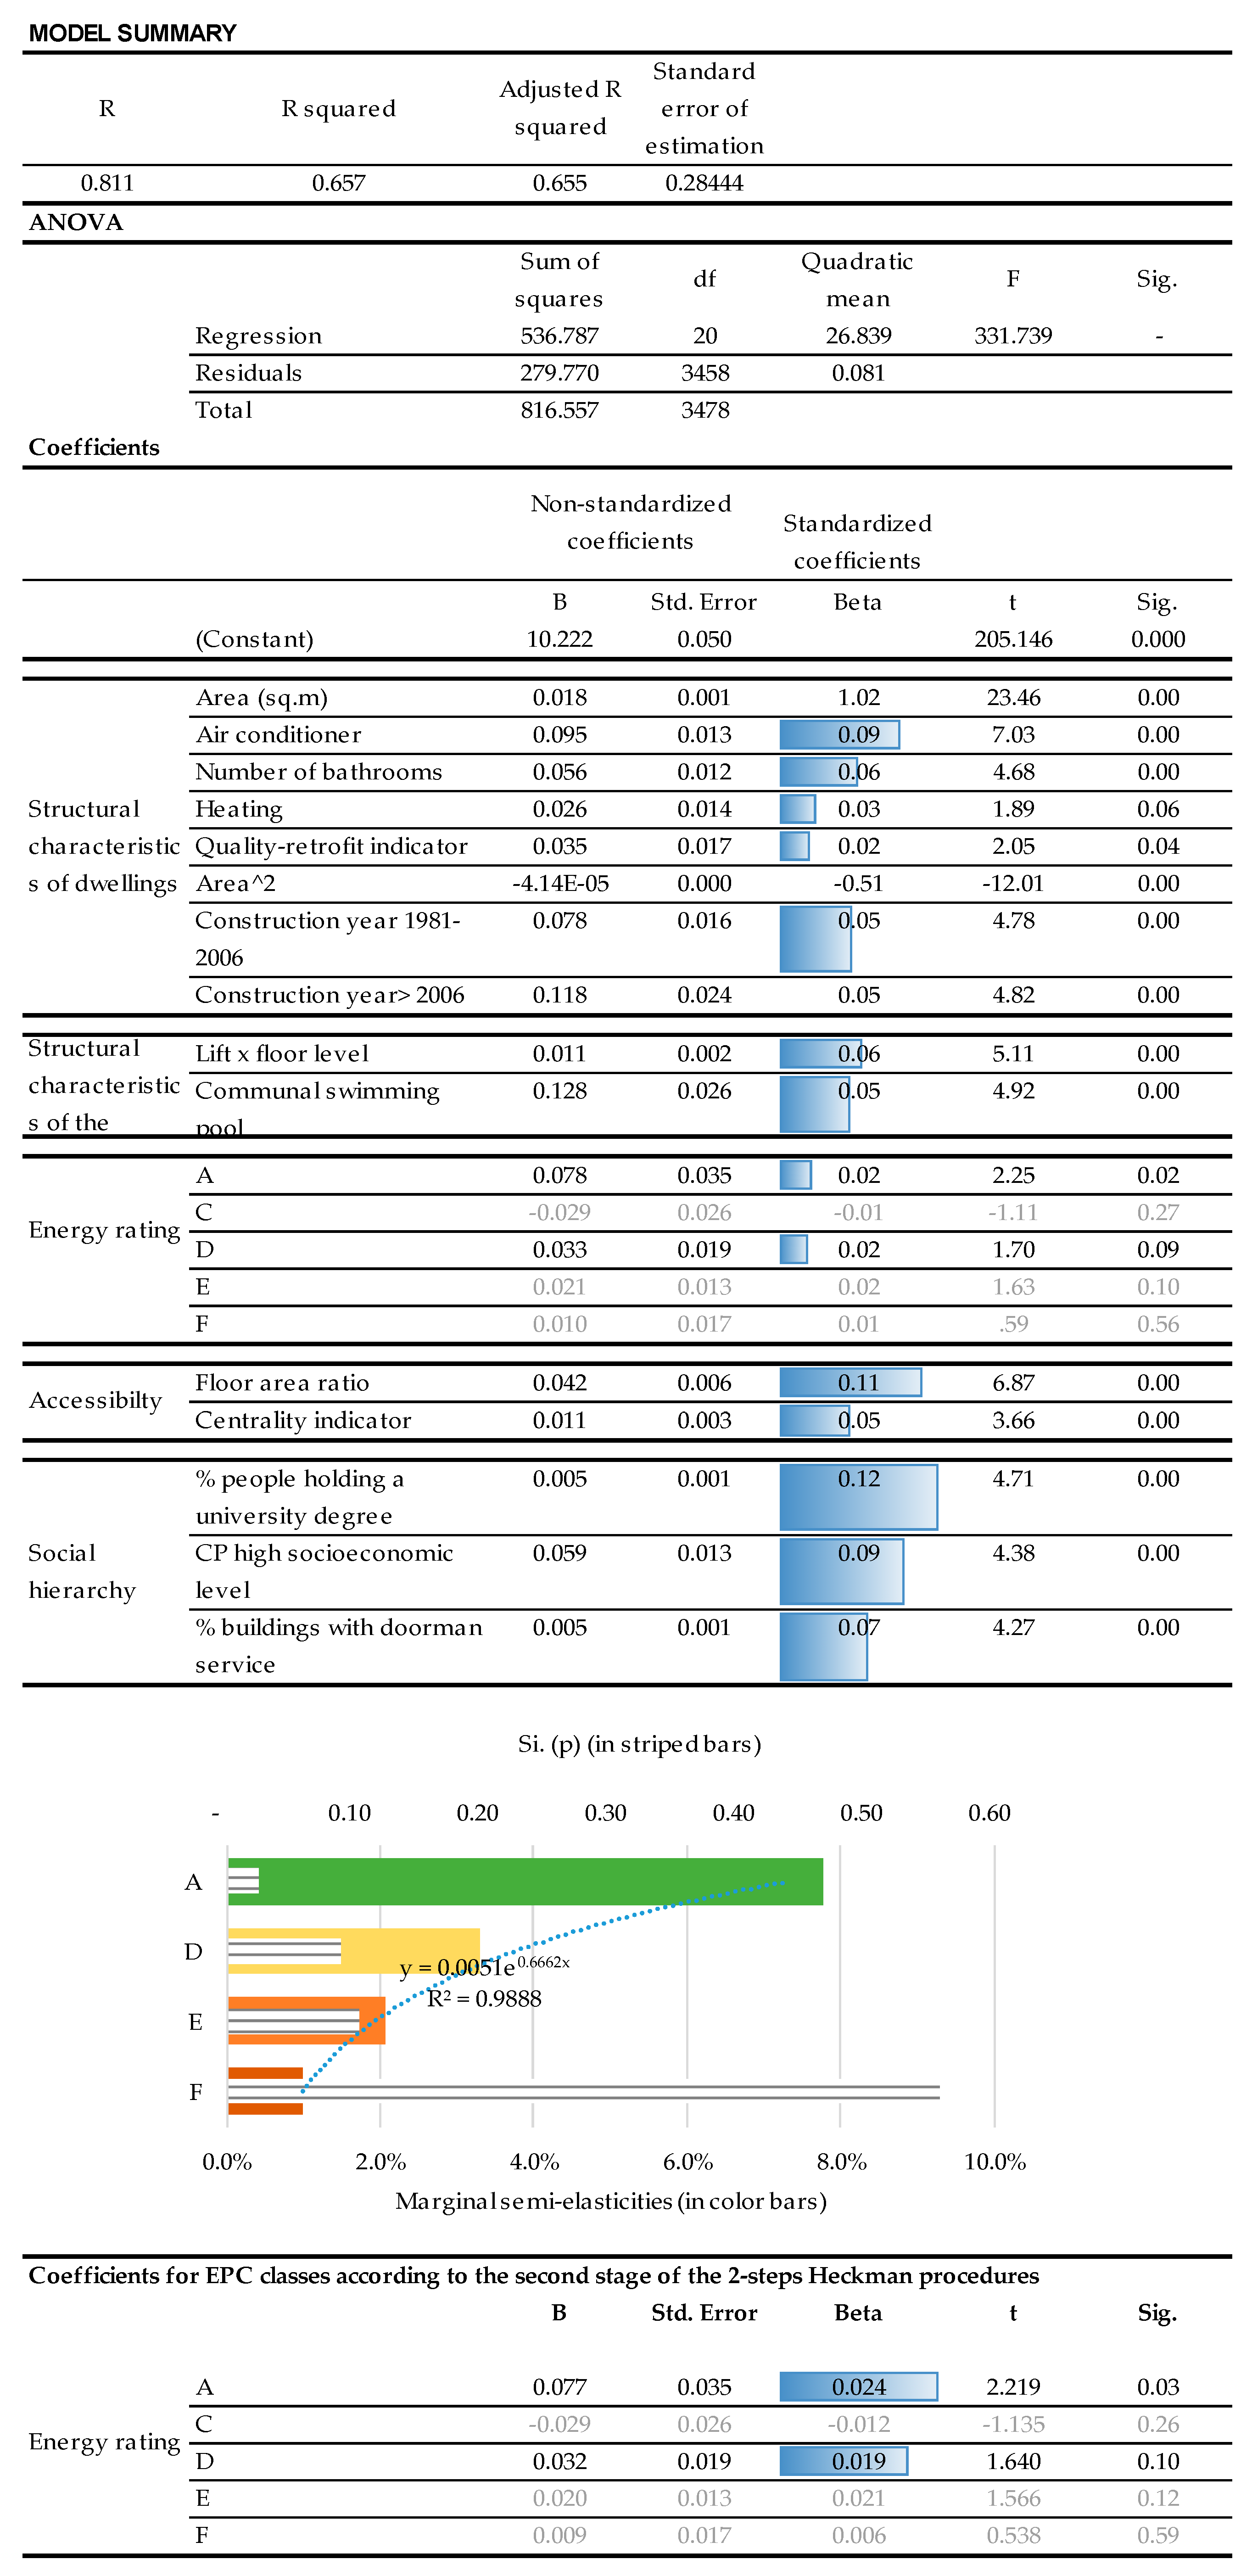
Figure 4 shows the best of the models able to explain upon 65.5% of the variance, the significant variables (sig. < 0.1) are organized by conceptual dimensions.
In the dimension of structural features:
The area is introduced with the expected positive sign, in fact, the introduction of its square (with the negative sign) is indicative of the existence of decreasing returns in the formation of prices.
Three quality indicators are utilized, such as the presence of air conditioning, heating and the qualitative indicator of quality/retrofit.
The number of bathrooms is not a factor. It seems reasonable that the number of rooms does not enter in the model, since the area, which is highly correlated with this indicator, has been taken into account.
The age of the home also has an expected impact on prices. The age has been introduced as a dummy variable for construction periods. The limits of each of the period is related to the introduction and upgrading of the energy performance legal requirements, which in turns are also associated with improvements in other building aspects.
In the dimension of the common services present in the buildings where apartments are located:
In the energy efficiency dimension:
Of the 5 possible EPC ratings (the control rating is “G”), only “A” and “D” are significant. Thus, for the best ratings, there is a market premium of 7.8% (in relation to the worst “G” situation), while for the “D” rating the premium is 3.3% and 2.1% for “E” (although it is almost significant at 90% of confidence). Therefore, the appreciation of the best rated dwellings is not linear; as the rank increases the marginal price increases progressively, following an exponential pattern. This finding has enormous potential for the promotion of efficient dwellings,
since the larger premium for these dwellings might counterbalance the excess of construction costs. The remaining of the ratings are not significant; however, with the exception of "C", these would have logical sing/value depending on the above mentioned pattern. Energy-efficiency ratings do not always have the expected impact. Addae-Dapaah & Chieh [
32] report in their pioneering study on the impact of the Green Mark on sale residential prices in Singapore a higher positive impact for the lowest ratings compared to the most efficient ones. These authors argue a confusion of the Singapore market exists, perhaps because the scheme raises nominal ratings (“certificate”, “gold”, “superior gold” & “platinum”) and not ordinal (“A” –> “G “) as the EPC scheme does.
In the locational dimension:
Two indicators are related to urban centres accessibility: the floor-area-ratio and the centrality indicator, both with the expected positive sign which is indicative of the trade-off between sale prices and transport costs.
Three indicators related to the socio-economic stratification of the city appear, so the higher the apartment’s price: (1) the larger the proportion of people holding a university degree, (2) the larger the proportion of residents in qualified job positions, and (3) the larger the proportion of buildings with doorman service. It is worth noting that this latter service is commonly present in wealthy areas of the city. According to the coefficient of the typified variables, social hierarchy indicators are the main explanatory variables of real estate prices. This is both because the population has a higher purchasing power, and because it seems they are willing to pay a market premium for locations dominated by similar socio-economic groups (i.e., neighborhood effect).
In short, the EPC energy rating, despite its very late universalization in Spain, seems to matter at least to owners willing to be compensated for the sale of their equity. In Spain, given the predominance of housing ownership, the behavior of sellers tends to be the same as buyers. Nevertheless, the asking market premium for the most efficient apartments (+7.8% or +12,409 Euros for the average dwelling in the sample) is surprisingly lower than the marginal value of comfort attributes such as air conditioning (9.5%), which in the light of the results obtained seems to play a more important role in price formation than the possible energy savings and environmental preservation that are implicit in efficient buildings.
5.1. Is the Energy Premium the Same Across Real Estate Segments?
As has been explained in
Section 3.1, the depurated sample has been split in hosing segments. The housing attributes found to be correlated with prices, in the model contained in
Figure 4, but with energy ratings.
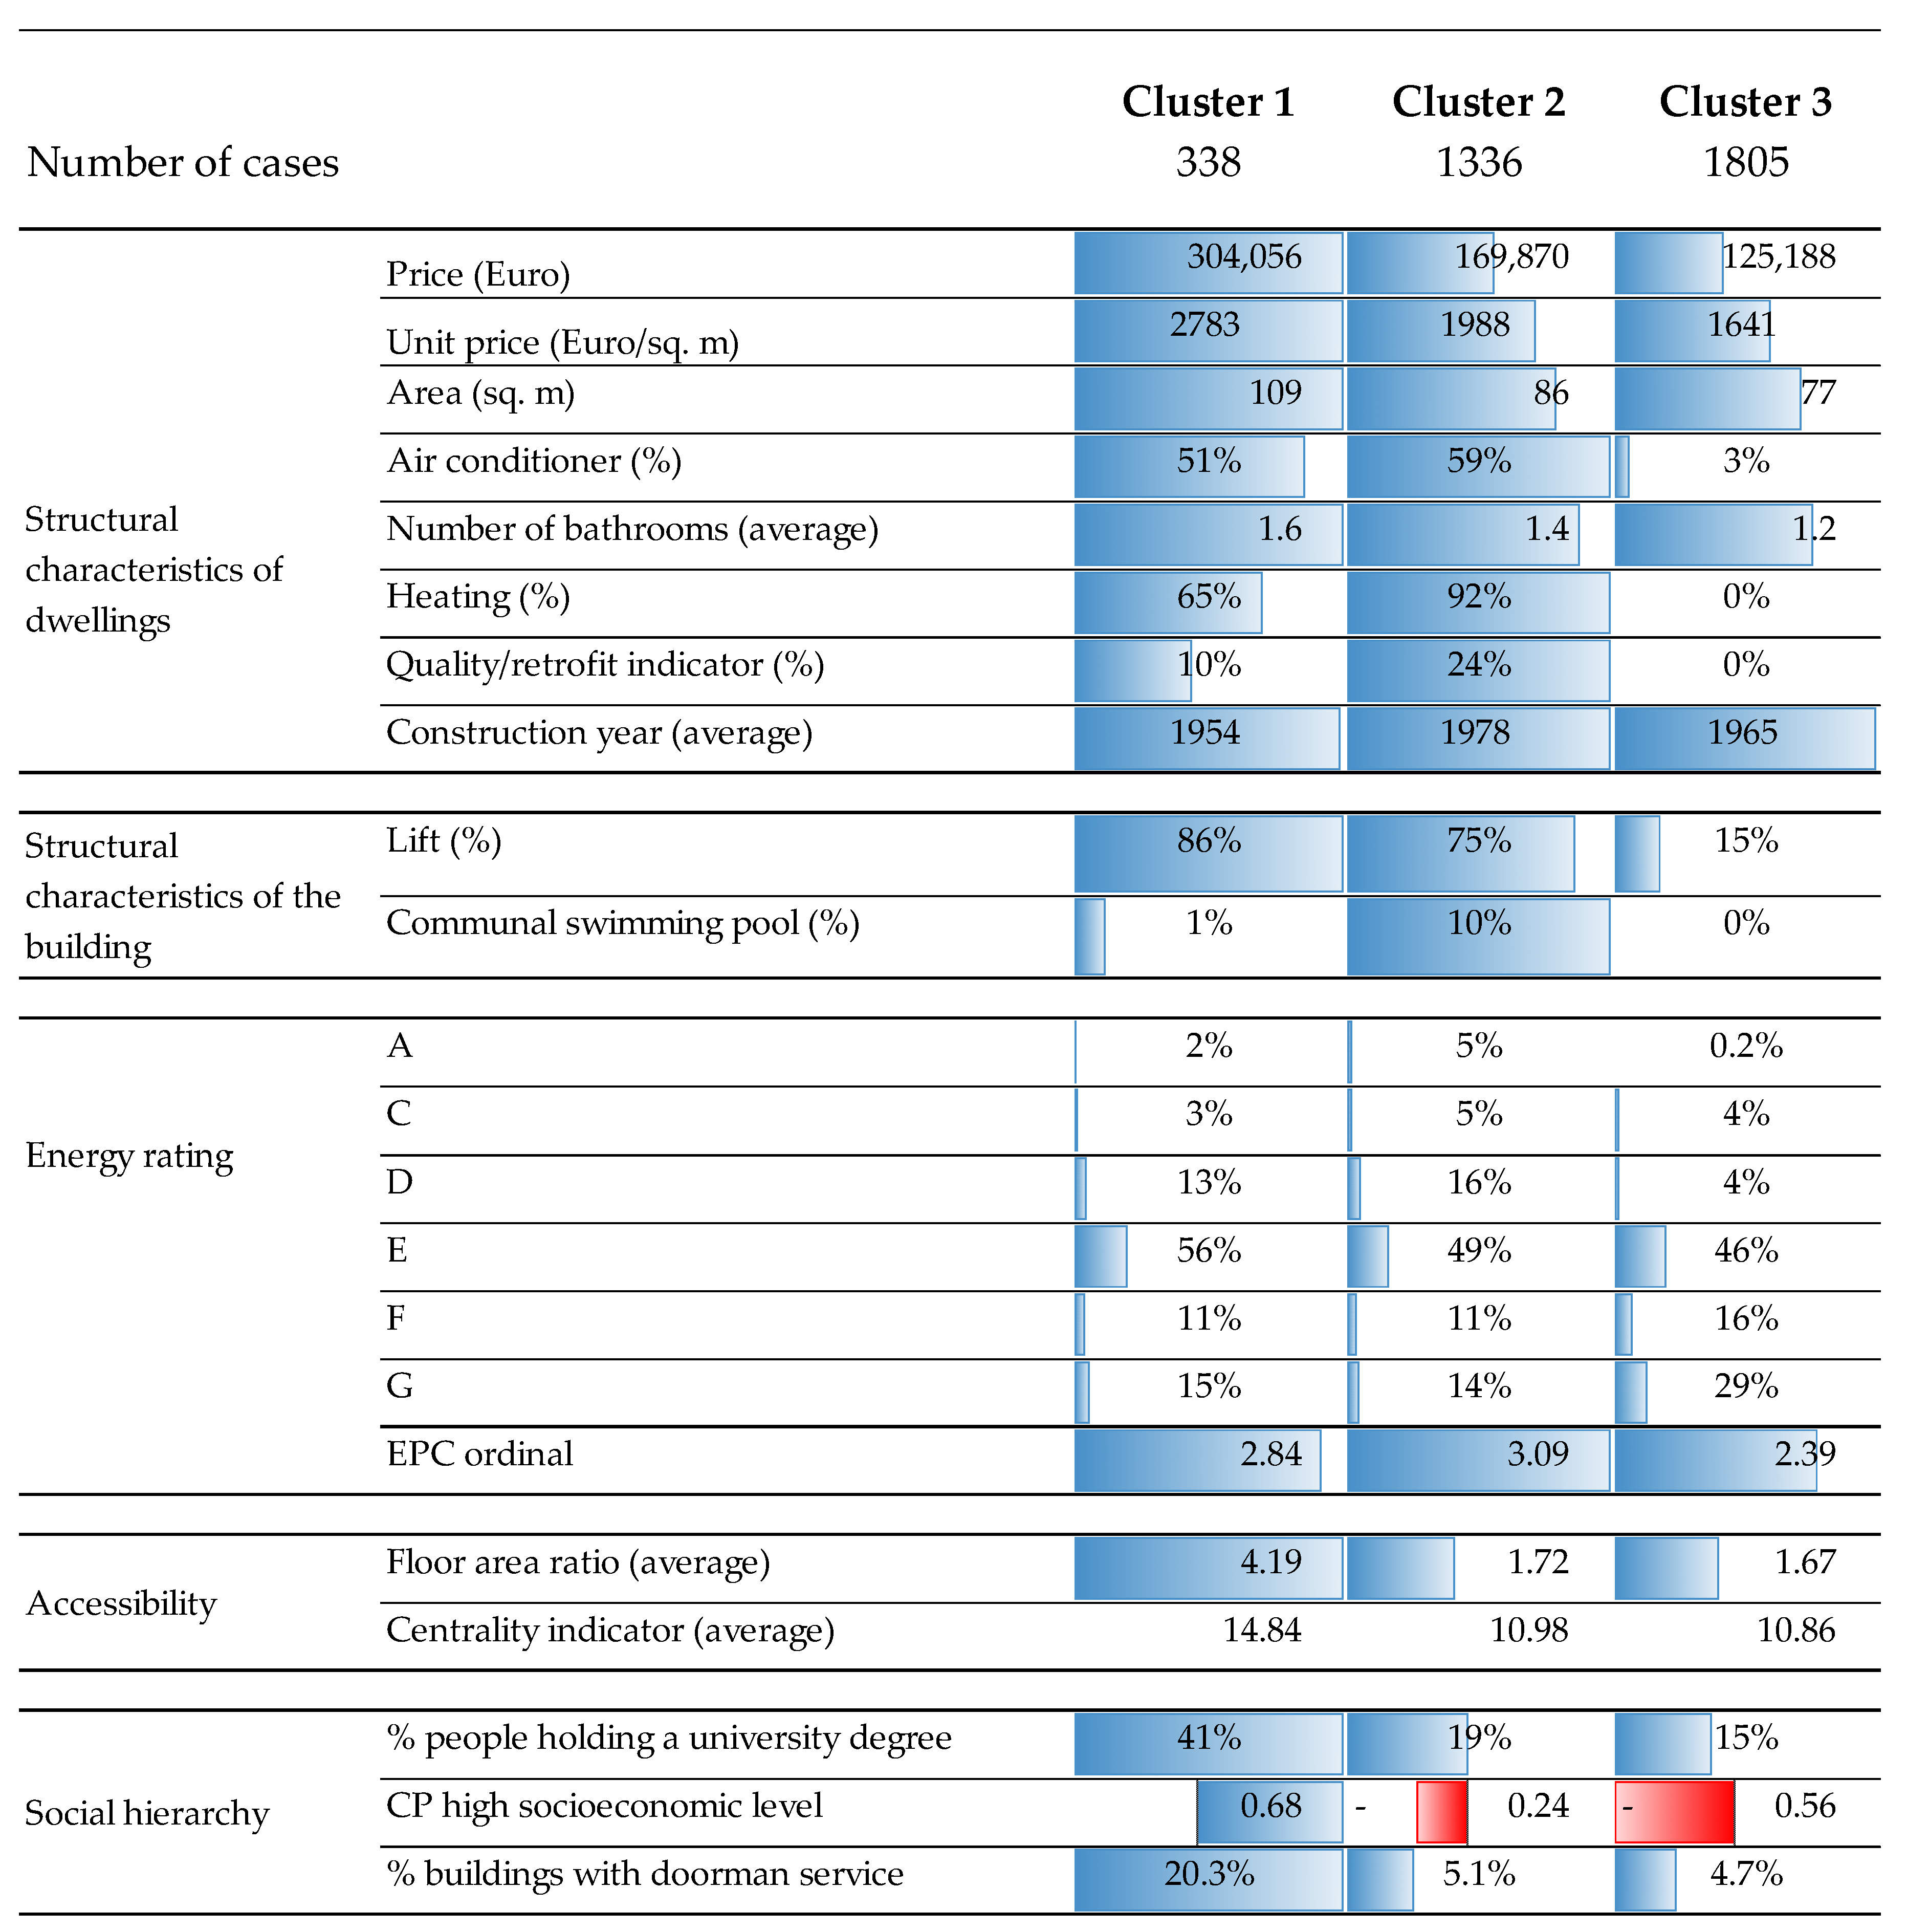
Figure 5 shows the main features of each of the identified housing segments:
Cluster 1 (the smallest) is characterized by expensive dwellings (in absolute and unitary terms), with the largest area located in central zones, where the population with higher education levels employed in qualified positions live. However, the dwellings contained in this cluster do not exhibit the larger proportion of services such as heating, air conditioner or swimming pool due to their age and central location.
Cluster 2 consists of dwellings characterized by a medium price in absolute and unitary terms, as well as its area also being intermediate. Among the three groups, these are the most recent dwellings, and for that reason, these have a larger proportion of active-comfort systems: 92% are equipped with heating and 59% air conditioning systems, while in 24% of cases their advertisements highlight exceptional quality and/or design. The location of this second cluster is mesocentral, and the proportion of people with a university degree is intermediate (in relation to the three groups). It is noted that 10% of them have a communal swimming pool, which suggests that they are oriented towards the middle-upper class and respond to most recent residential trends.
Cluster 3 is the largest, and the apartments contained in this cluster were built in the post-war period characterized by a low-quality urban growth fed by rural immigration. Housing in this group is small in size, cheap in price, with no amenities and services (only 3% are air conditioned and none of the apartments are heated). None have a swimming pool and an elevator is only present in 15%, although they are multi-family buildings located in multi floors zones (average floor area ratio is 1.67). Socioeconomic indicators suggest that this cluster is located in areas where the less educated population lives, occupying less qualified positions (e.g., salesmen/women, unskilled jobs, etc.).
The energy rating of the three clusters is consistent with the age and architectural performance of housing, so on an ordinal scale (A = 7, G = 1) the average rating is: 2.84, 3.09 and 2.39 respectively; that is, the newest dwellings, with better active-comfort conditioning, are the most efficient, while post-war dwellings are the most inefficient. The dwellings of the centres are located in an intermediate energy-efficiency situation.
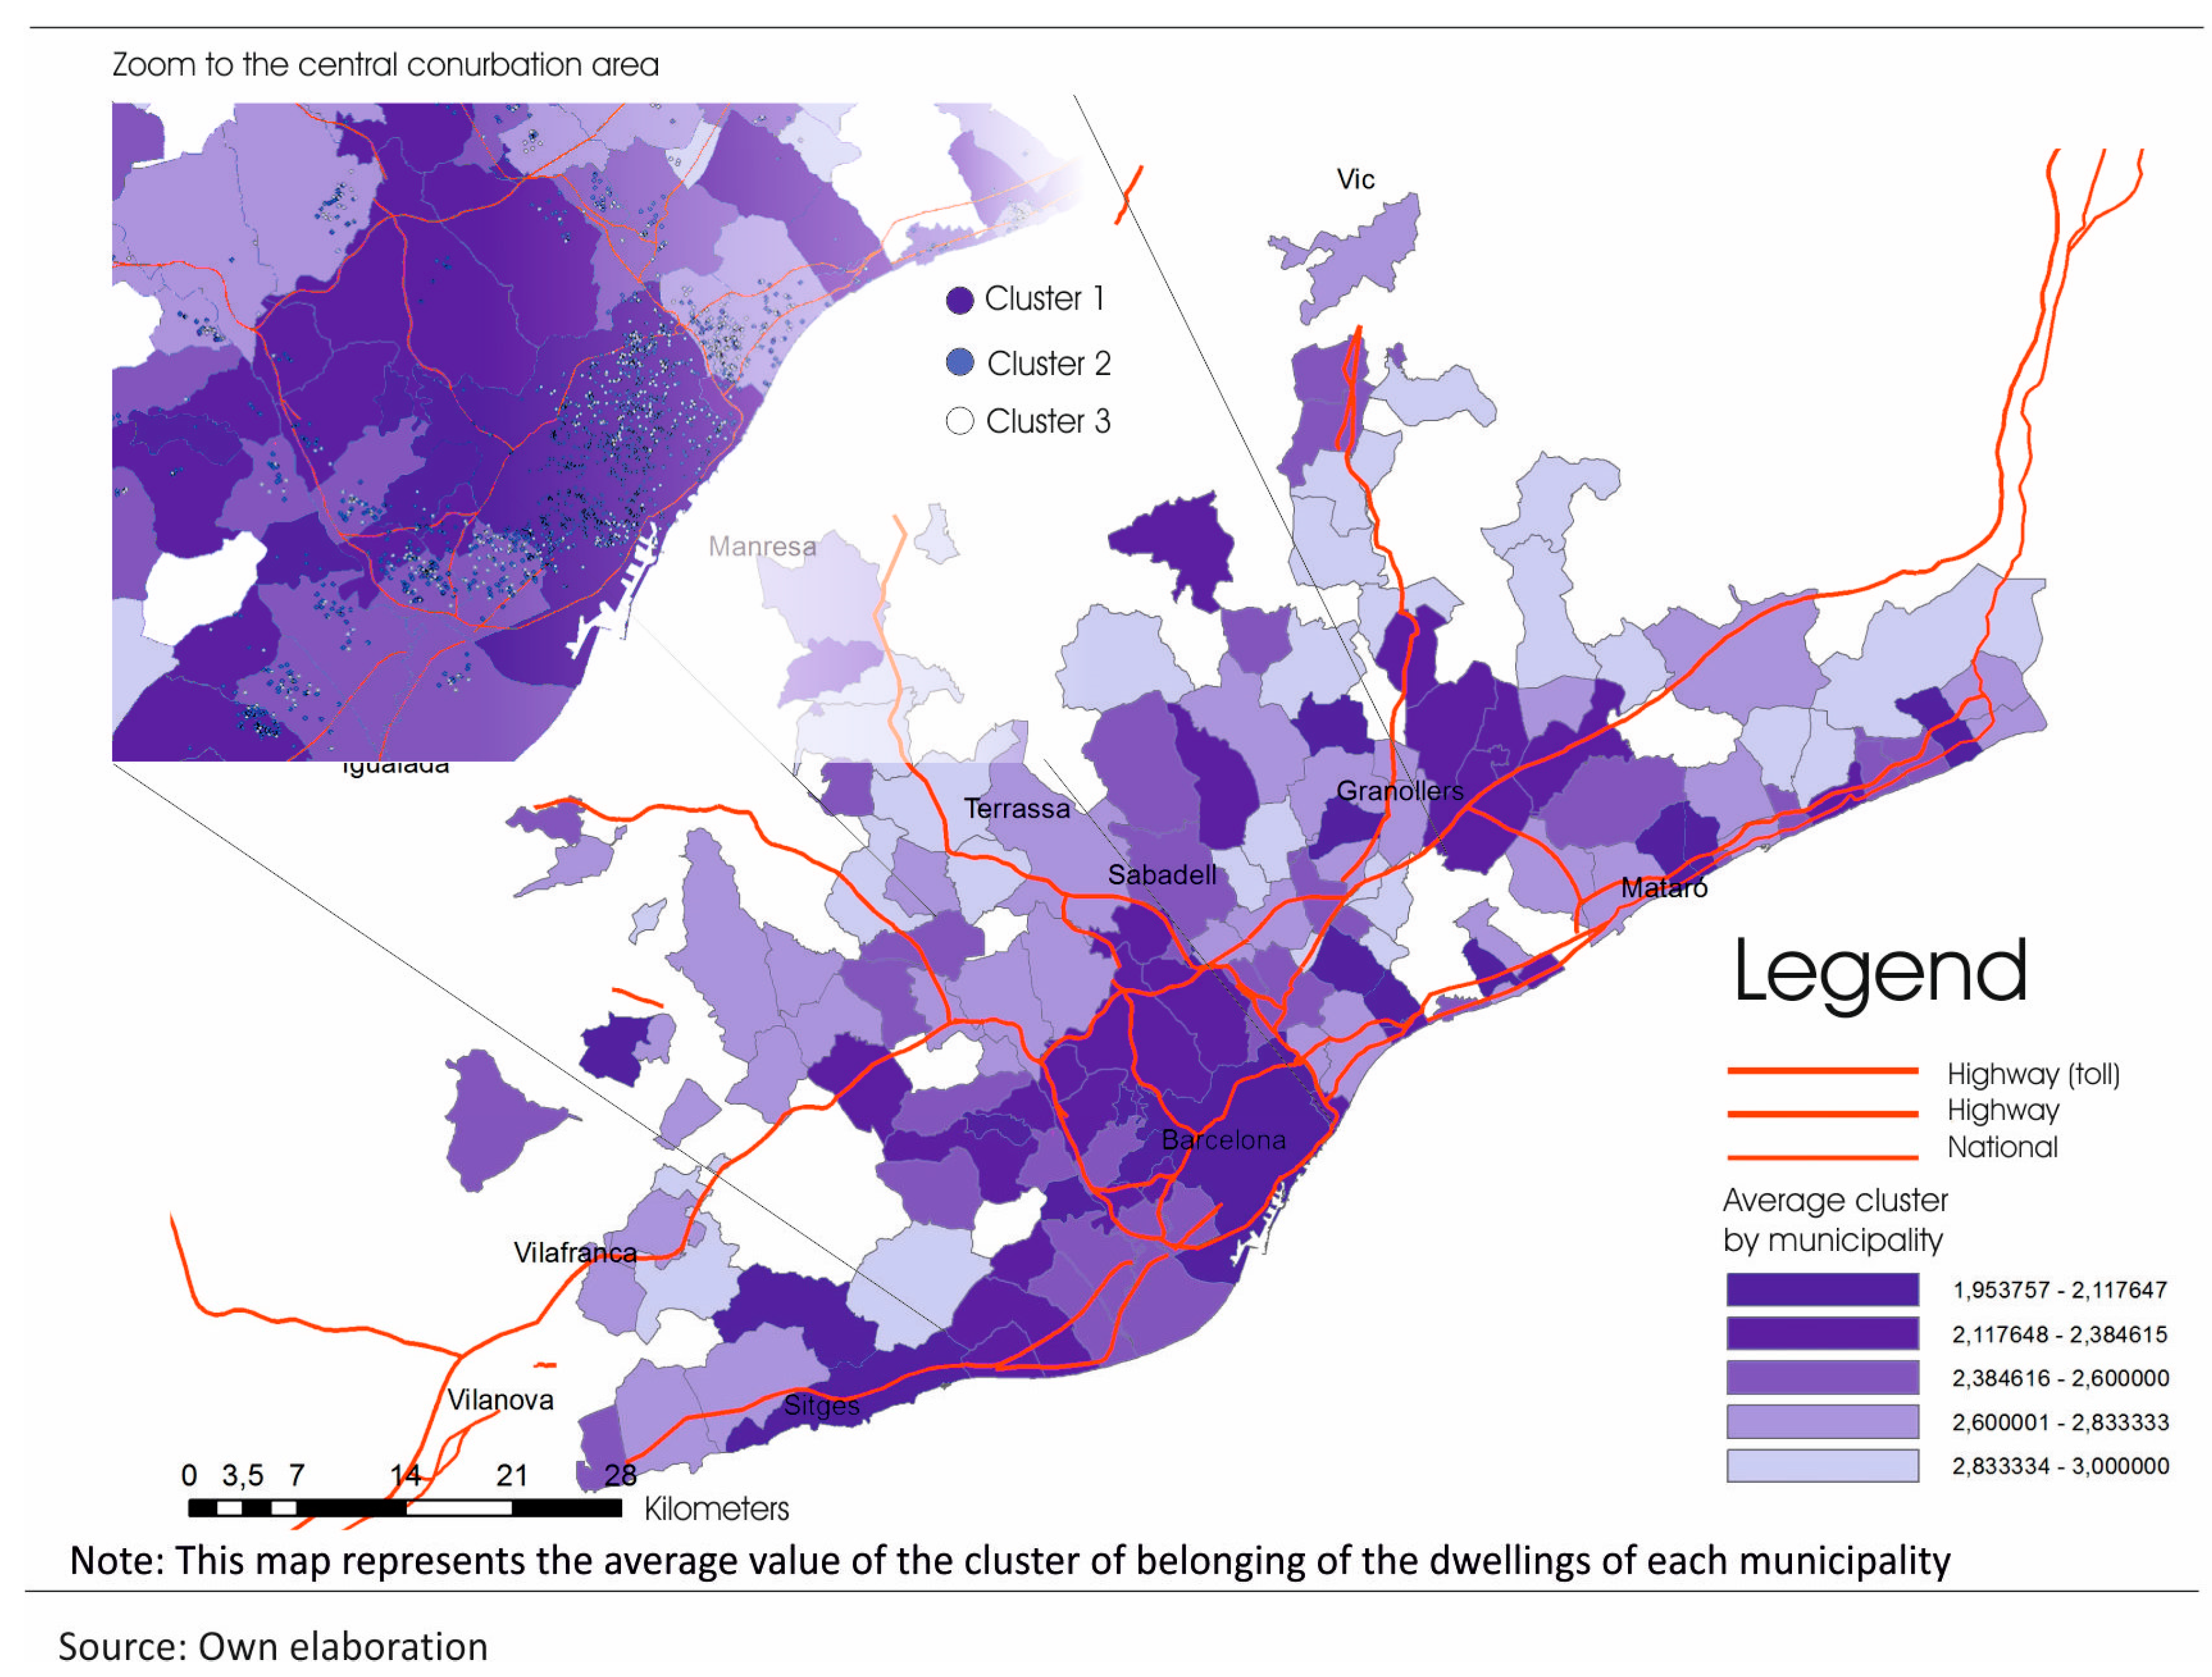
Figure 6 shows the spatial distribution of the sample: the darker the colour, the greater the ascription of the sample to cluster 1, standing out especially in the municipality of Barcelona. The central urbanized zone highlights the predominance of dwellings typified as Cluster 3 in the low-income neighborhoods, whereas in the 19th-century Enlargement zones the dwellings typified as Cluster 1 are predominant.
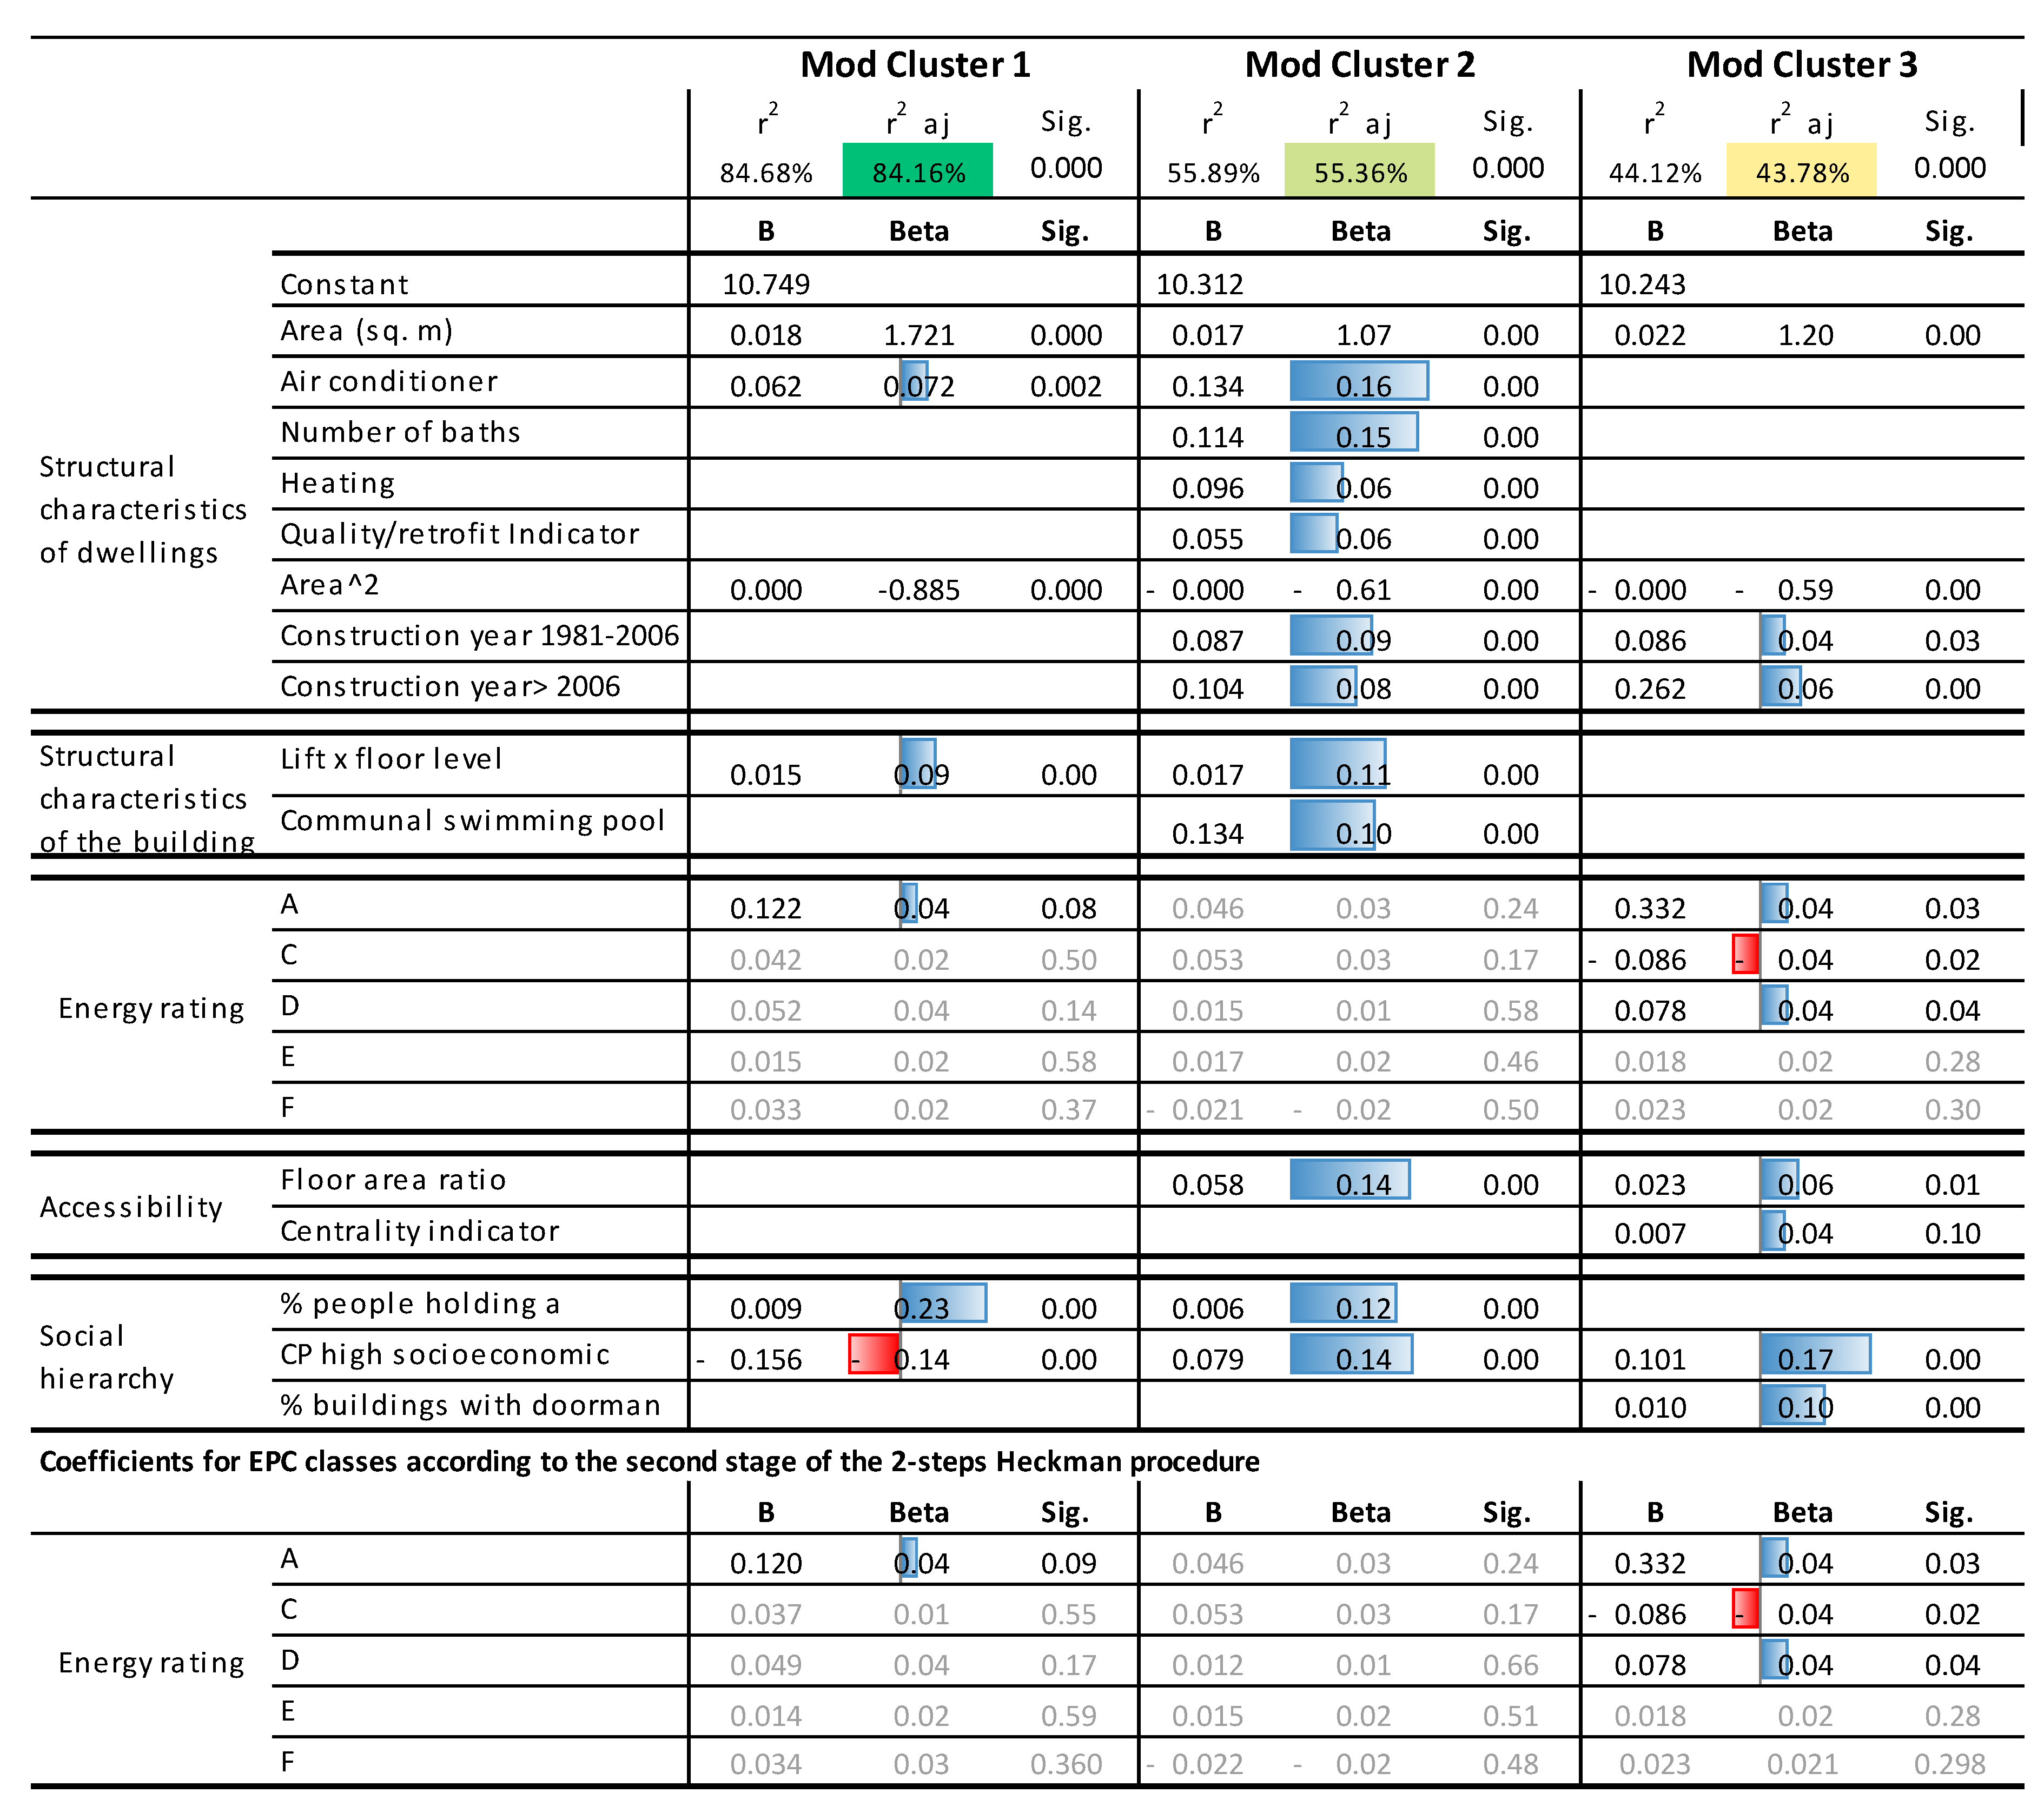
Finally, regarding the main objective of this paper,
Figure 7 contains the results of the calibrated models for each one housing segments. It is important to note that according to the Chow Test (F = 8.20 > F crit. 1.16 to 99% of confidence), structural differences do exist in the explanation of the prices of the different segments and therefore indicate divergent hedonic agendas. In this figure only the statistically significant (sig. < 0.05) variables are reported, except for those related to the different energy ratings, where again the letter “G” is the comparison situation. In all cases, the sign of the coefficients is as expected and match that of the complete sample explained in the last section, with the exception of Cluster 1 where, paradoxically, the sign of the high socioeconomic indicator is reversed, even after having verified the absence of multi-collinearity issues. This issue likely occurs because the sample (the smallest of the three) is very homogeneous in locative terms due to the segmentation procedure used.
Focusing on the interest of this study, three interesting conclusions emerge:
The energy rating seems to affect the older dwellings, both those located in the centers/19th-Century Enlargement zones, and those located in poor neighborhoods that emerged from the expansion of the metropolis during the post-war. Conversely, in the case of the state-of-the-art dwellings depicting amenities and active-comfort systems, energy efficiency seems to play a null role from the perspective of price formation.
However, the impact of the rating is not equal in the two segments in which it appears as significant. Thus, the “A” rating has an impact of +12.2% (but with a level of significance on the edge of the limit demanded in our analysis) in the most expensive, central and well-endowed housing segment. On the other hand, the impact of the "A" rating is almost three times larger +33.2% (with a higher statistical significance) in the cheaper segment, located in working-class neighborhoods and with worse active air conditioning services and in general with the poorest architectural quality. In this last cluster, the “D” rank also appears with an impact of +7.8% and in a reversed sense, the “C” rank with an impact located at −8.6%.
All in all, these findings suggest that real estate differentiation in the segment of the newest dwellings does not respond to the rationale behind the EPC scheme. On the contrary, in the case of the (very abundant) dwellings located in the lower tier, in the absence of attributes of architectural quality and amenities, the EPC produces a distinctive effect strongly influencing price differentiation.
These findings are consistent with the discussion of Encinas et al. [
34], since sustainability attributes seem to play different roles across residential segments. In short, the impact of energy ratings, in the light of the aforementioned results, does not seem to equally affect the segments of the multi-family market. Real estate differentiation, from the perspective of the supply price formation mechanism, and in relation to the energy ranking seems to occur in the lower segment. Thus, in the dwellings with less architectural attributes related to residential quality, this ranking has a significant impact on prices. Such “brown discounts” may have enormous social repercussions on the conformation of energy submarkets, as discussed in the conclusions.
6. Conclusions, Policy Implications and Limitations
15 years ago, the Energy Performance of Buildings Directive (EPBD) joined the mainstream of green labels through its Energy Performance Certificates (EPC). Through this policy the European Union opted to fade out informational asymmetries in energy efficiency in real estate transactions. The aim of such policy has been to foster the acquisition and lease of efficient buildings by means of energy-informed transactions.
Nonetheless, in Spain the universalization of EPC is quite recent (it is mandatory only as of the 1st of June 2013), the research reported here determined for the first time, conjointly with those works [
24,
25] if EPC ratings imply “market premiums” and “brown discounts”. The main contribution of this research is to explore whether such impact on prices, if any, is homogenous across multivariate housing segments. With this objective, in the absence of transaction prices, a sample of 3479 multi-family dwellings listed in metropolitan Barcelona is analyzed. This analysis, as is usual in international studies, has been based on the hedonic price method, which assumes that households equalize the marginal utility of the urban and architectural attributes of dwellings, to the marginal price they pay for benefit of them. Likewise, in order to identify market segments, a multivariate analysis is carried out departing from variables correlated with selling prices.
In general, the residential listed stock in Barcelona exhibits a poor energy performance, with an average EPC rating of 2.70 (“G” = 1, “A” = 7), with rating “E” being the most abundant (48.30%). Data showed a positive correlation between the year of construction of the dwellings and EPC ratings, with a sharp increase after the year of 1980 (when the first national energy efficiency legislation came into force). From a spatial perspective, the best-rated dwellings are located in the immediate suburbs of the metropolitan centralities, while the worst rated are in the more distant suburban areas, some of a rural character, and others in urbanizations of illegal origin, with constructions of very poor architectural quality.
The results of the hedonic models suggest that there is a market premium for efficient rated dwellings. Thus, sellers of the best-rated dwellings are willing to be compensated for a higher amount, everything else equal, when selling their assets. As such, results suggest a market premium of +7.8%, +3.3% for “A”, “D” ratings respectively in relation to the most inefficient rating “G”. For the average apartment, these impacts can be translated into approximately 12 thousand and 5 thousand Euros, respectively. In addition, it is observed that such overpricing tends to increase exponentially as the energy efficiency increases.
This finding has a special interest in the private development of “green” dwellings, since the prize for the most efficient apartments “A” increases exponentially regarding lower ratings. Nevertheless, it is still necessary to verify whether such a market premium can offset the over costs produced by new and most efficient building techniques, as has been studied by García-Navarro et al. [
35].
In any case, the impact of the energy ranking in Spain on residential prices is lower than the 15.00% (“A”/”G”) reported by Brounen & Kok [
14] for the Netherlands case, as well as below the 19.90% (“A”/”G”) detected by Hyland et al. [
9] for the Irish market and the 12.00% for “A” dwellings compared to “G” in the English case according to Fuerst et al. [
12]. It is possible that behind these divergences are the differences in real estate prices, cost of energy, income level (in relation to the previous two), climatic differences and environmental concerns. These comparisons should be made with caution, because although the European legal framework is the same, there are differences in the national transposition of the regulations and more specifically in the way of calculating energy EPC ratings [
23].
Interestingly, the EPC asking market premium is not uniform across the residential segments:
In the segment of more recent apartments, the EPC rating does not seem to play any role in the differentiation of real estate prices, which obscures the pursued objectives of the EPBD. In this market, with multiple architectural features and active technologies for environmental comfort, energy rating does not represent a differential element.
In the case of the deficient housing, the enormous price discrimination that appears, the energy rating, in the absence of other attributes of differentiation, does produce a significant “brown discount”. Specifically in this segment, the worst rating “G” reduces the price of the dwellings by −33.20% in relation to “A” rated apartments.
In the case of older dwellings, located in middle/middle-high class areas, the results suggest that a moderated premium market is also formed that is equivalent to +12.2% (“A”/“G”) which opens room for energy retrofitting since most of such apartments are located in Enlargement zones which started to be built at the end of the 19th century.
In short, despite the recentness of the EPC policy in Spain, it seems to affect listing prices, although as has been seen, with uneven intensity throughout the residential segments. Thus,
in the segment of recent homes with higher benefits, the rating plays a null role in the formation of prices. In this segment, private developers have to make an extra effort to communicate the economic and environmental benefits of efficient homes. Whereas, in the segment of lower price and quality dwellings, the energy rating institutionalized by the EPBD and its transposition is a true element of residential differentiation, in the absence of other architectural attributes. This finding is compatible with the conclusion of Olaussen et al. [
1] since EPC labels might be capturing omitted variables. In our case, it may be wrongly interpreted as quality in the case of the homes boasting the lowest attributes. In the Netherlands as the first country to transpose the EPBD, in the time when EPC was optional, the certification rate was higher in neighborhoods with more deficient residential stock according to the study by Brounen & Kok [
14]. That is, getting an EPC in low-quality areas was seen as a positive attribute in the marketing process of homes irrespective of the EPC rating they obtain. The same seems to occur in Spain: as has been said, in
Section 4, the probability that a listed apartment includes EPC information is directly correlated with its low-quality.
Our findings are also in line with other studies analyzing the impact of EPC ratings on residential univariate-segments [
9,
12,
13]. In most of those cases, their authors argue that the larger impact found in the low-tier segment is explained by the fact that these dwellings are targeted towards households with tighter budgets, for whom the possible energy savings are relevant. Nonetheless, such a rationale is not verified in Spain. Marmolejo et al. [
36] have been conducted, in Barcelona, a survey aimed to explore whether people do understand the EPC scheme. Their findings indicate that low income and poorly educated people, as residents of the deficient homes segment, have little knowledge on such a scheme, which in turns translates into an unwillingness to pay for efficient homes. As a matter of fact, such authors have found that, in general, people misunderstand the objective of the EPC rating, since they consider it an indicator of the global quality of homes. Such conclusions are not surprising due to the overnight implementation of the EPC scheme in Spain pointed out in the introductory section. Furthermore, their results are in line with preconditions Backhaus et al. [
37] indicated are required before expecting any impact of EPC scheme on home prices: homeowners should be aware of its existence; find the information about energy ratings useful and trust the information on EPCs. The practical absence, in Spain, of informative campaigns on the implementation of the scheme, on the one hand, and a generalized perception of EPCs as a bureaucratic formality and even a distrust of the technical procedure, on the other, make such preconditions difficult to meet.
In any case, from a social perspective, a larger “brown discount” for the less efficient dwellings implies a devaluation of the main equity of the poor population in countries, such as Spain, where ownership is the main tenure regime (over 71% according to INE). Such population living in inefficient homes are at risk of fuel poverty, and at the same time, for cognitive and financial reasons (aggravated by the energy efficiency “brow discount”) have little opportunity to perform a retrofit in their dwellings. Therefore, a well-intentioned environmental policy might have unexpected pernicious effects from a social perspective, if relevant corrective measures are not introduced (e.g., retrofit subsidies). Fortunately, in Spain legislative initiatives crystallized in Law 8/2013 of Urban Rehabilitation, Regeneration and Renewal (now recast in the main corpus of land legislation), which, together with the autonomous legislations in matters of urban planning and housing, provide the necessary instruments to carry out actions in the most degraded areas. An example of this is the area of conservation and retrofitting of the “Carrer Pirineus” located in the working-class municipality of Santa Coloma de Gramenet (province of Barcelona), where, on the basis of the aforementioned legislation, a rehabilitation of the private residential stock with energetic implications has been developed using municipal treasury as a “local bank” [
38]. These actions, however, require the political will, technical capacity, and a multidisciplinary approach.
6.1. Limitations and Further Research
This research uses listing prices since, as it has been disclosed, transaction prices containing enough information on sold prices are not available in our case. Therefore, it is necessary to further explore whether the concussions drawn here are held when closing prices are used to identify the hedonic agenda of EPC ratings. However, it is expected to have few divergences, especially for the results coming from the segmented model, since negotiation ratios (i.e., closing/listing price) are contingent to the quality and location of homes. Also, it is necessary to advance towards the incorporation of energy efficiency aspects in the valuation of real estate as has been done by De Ruggeiro et al. [
39] (see
supplementary materials). Finally, despite the large efforts to control quality attributes of homes and locations, there is still the possibility that omitted variables, such as decorations or specific finishing, possibly spuriously concomitant to EPC ratings, do play a role in price formation. Using expert assessed homes in the context of valuation reports may also contribute to solving this latter issue.


