Article

The Common Good Provision Scale (CGP): A Tool for Assessing People’s Orientation towards Economic and Social Sustainability

Department of Psychology, Università Cattolica del Sacro Cuore di Milano, L.go Gemelli 1, 20123 Milano MI, Italy
*
Author to whom correspondence should be addressed.
Sustainability 2019, 11(2), 370; https://doi.org/10.3390/su11020370
Submission received: 21 December 2018 / Revised: 6 January 2019 / Accepted: 8 January 2019 / Published: 12 January 2019
(This article belongs to the Special Issue Psychology of Sustainability and Sustainable Development)

Abstract

:
Many governments and institutions are currently challenged with insecurity, economic instability, and ongoing turbulence which may undermine the quality of life of each human being and the sustainable development of civil society. As this kind of sustainable development is strictly related to the promotion of the ‘common good’, it is of paramount importance to understand the different motives that lead people to give their contribution to the common good, in order to sustainably align individual needs with the needs of the society. By adopting a psychological perspective for the promotion of the sustainable development, the aim of this study is to develop and validate a new metric, the Common Good Provision scale (CGP), to assess people’s orientation towards economic and social sustainability. Items were generated from a preliminary qualitative study investigating meaning and representations on the common good and its provision. Both exploratory and confirmatory factor analyses were undertaken to validate and improve the scale. The final scale, which consists of seven items, contains two dimensions: Accessibility (i.e., making the common good accessible to anyone and fulfilling people’s basic needs) and Personal Gain (i.e., getting a return and personal advantage in exchange for one’s contribution). In addition, we tested a model in relation to a specific form of contribution: Paying taxes and making charitable donations, that are two complementary ways to financially provide for the common good. It was found that when the Accessibility motive prevails, people are more willing to pay taxes and make donations, whereas when the Personal Gain motive prevails, people are more likely to commit tax evasion and less willing to make monetary donations. The study is novel in that it represents the first attempt to develop a metric to assess people’s motives towards the common good provision. Potentialities and further applications of the CGP scale to other contexts are discussed in relation to the promotion of people’s wellbeing and sustainable development.

1. Introduction

In light of the complexity of the postmodern era, characterized by insecurity, economic instability, and ongoing turbulence, the sustainable development of civil society is at stake. The most recent financial crisis has brought up many questions concerning the provision of the common good, especially from a financial point of view (e.g., national debt increase, public spending reduction, etc.). The individual contribution to the common good appears to be a major issue in this regard, as the lack of resources available to be reallocated and redistributed among citizens could hamper the sustainable development of society as a whole.
Since individuals’ decisions to provide for the common good can lead to a new kind of sustainable development, the present paper aims to develop and validate a new metric, the Common Good Provision scale (CGP). This scale aims to assess people’s orientation and motives towards the common good and its provision, which appears to be a basic prerequisite for economic and social sustainability. This study is novel in that—to the best of our knowledge—it is the first attempt to operationalize this construct and provide a tool for both scholars and practitioners to assess people’s orientations towards the common good.
Before moving forward, two important key concepts need to be defined: ‘Sustainable development’ and ‘common good’.
When referring to ‘sustainable development’, a broader definition of sustainability should be taken into account, not only in terms of the ecological and economic environment [1], but also in terms of improving the quality of life of every human being. To take into account the complexity and multi-dimensionality of sustainability issues, we adopted the approach of the psychology of sustainability and sustainable development. Whereas the traditional perspective on ‘sustainable development’ has focused on avoiding exploitation, depletion and irreparable alteration, a positive psychology approach to well-being is based on the enhancement of individual, organizational, and societal resources [2,3,4]. In other words, the psychology of sustainability and sustainable development is focused on the well-being of the person and of the well-being of the environment (including natural, personal, social, organizational, community, global and cross-cultural environments) [5].
As for the ‘common good’, it is not simple to define what it entails. The construct of the common good has a long and contested history. Philosophers, theologians, lawyers, politicians, and economists have all arrived at distinct understandings about what the common good entails [6,7]. The common good is generally understood as being the opposite of private interests. Conceptions of the common good go back at least to Aristotle, for whom the common good consisted of just institutions that contribute to the happiness of the citizens in securing their rights and duties. Thus, the common good included political justice on the one hand and general utility or happiness on the other. In political philosophy of the modern period, contractualism, natural law and utilitarianism gave different interpretations for what is meant by the common good. Contractualism understood the common good as the demand that equity is prior to utility, while in natural law the common good is what the people strive for socially, and in utilitarianism the common good is seen as public demand that secures for everyone the pursuit of his or her private interests [8]. In the economic literature, the common good has generally been distinguished from the public good in terms of the former being rival (i.e., a person’s consumption reduce the benefits of someone else’s consumption of the good) and non-excludable (i.e., a person’s consumption cannot practically be excluded) [9,10,11]. In psychological research, instead, despite the pivotal role that the construct of the common good plays (e.g., in social dilemmas and prosocial behavior research), the construct itself and what it entails remains a relatively unexplored area. One exception is a qualitative study [12] investigating lay people’s representations on the common good and its common linguistic usage. According to this study, the common good is a broad concept that includes the idea of active participation, as opposed to merely passive consumption of public goods. Contrary to economic definitions, which classify objects according to their characteristics of (non)rivalry and (non)excludability, the subjective representation of the common good is more easily organized by purposes (i.e., what it is for rather than what it is). On the one hand, the common good provides basic needs and requirements people are entitled to and, for this reason, should be free and accessible to anyone. On the other hand, it goes beyond mere survival by presenting comfortable options and increasing general wellbeing. According to Castiglioni et al. [12], another important aspect related to the common good is the sense of reciprocity it involves, as it is something from which one takes and to which one gives at the same time. This implies that all citizens have the duty to contribute to, protect and safeguard it, in order to prevent a potential loss; nevertheless, citizens expect to receive a direct benefit and something in return for doing so. Since this study operates within a psychological framework, we adopted this definition of common good based on lay people’s representations and its common linguistic usage.
In order to promote sustainable development—in the broader sense that was above defined—the goal of promoting the common good should be pursued too. In fact, a contemporary approach that has been suggested as a possible solution to the problems associated with the most recent financial crisis is the Economy for the Common Good (ECG) [13] approach, which aims to steer economic activity from profit toward the common good. Within this framework, the common good refers to the promotion of human values, such as dignity, solidarity, social justice, and sustainability. According to this approach, companies and other organizations should cooperate for the common good rather than compete to maximize profits. This model, however, takes into account the perspective of companies and organizations, but not the perspective of private citizens. To achieve the goal of promoting an inclusive and sustainable society, instead, all parties involved should play a role. At the individual level, this means that a balance between individual aspirations and societal needs is required to achieve both personal well-being and collective welfare. That is why many believe that—especially in the aftermath of the most recent global financial crisis—personal greed should take a back seat and individual needs should be aligned with the needs of the society, the environment, and more generally the common good [14]. This, for example, includes the reallocation of monetary resources to financially provide for the common good through paying taxes and making charitable donations.
On this basis, this study will present the development and validation of a metric aimed at assessing different motives for providing for the common good (i.e., the Common Good Provision scale, or CGP). By adopting a psychological perspective, it aims to gain an understanding of the sustainable development of civil society by investigating the motives behind the private contributions to the common good. Exploring the construct of the common good is of paramount importance, as an orientation towards the common good entails feelings of responsibility for the community and compliance with social rules and order. People’s sense of responsibility for the common good has been identified as one of the core dimensions of social cohesion [15], as social cohesion requires at least a minimum degree of commitment to the community and the willingness to subordinate personal needs to the welfare of the social environment. Social cohesion, which is currently deteriorating, is also seen as a desirable feature for the sustainable development of societies [16,17,18]. This study is novel in that, despite the importance of the topic, the extant literature lacks a metric to measure the orientation towards the common good and the motives for contributing to the well-being and sustainable development of society as a whole. In particular, given that the most recent financial crisis has brought up many questions concerning the provision of the common good especially from a financial point of view (e.g., national debt increase, public spending reduction, etc.), the present study will focus on two specific forms of contribution: Paying taxes and making charitable donations. Even though people pursue different goals when paying taxes and when making donations [19], both represent different ways people can financially contribute to the common good, by reallocating personal resources to increase human well-being.
To summarize, the main research objectives of this study are to develop a metric that is (i) reliable and with strong psychometric properties; (ii) discriminant (i.e., different from other constructs); and (iii) capable of predicting the individual contribution to the common good. To test the psychometric properties of the CGP scale, we performed an exploratory factor analysis to assess its structure, followed by confirmatory factor analysis to assess its adequacy. Then, we examined the interconnections between the CGP and other hypothetically related constructs to determine its construct validity. Finally, we tested a model combining different constructs to investigate its relationship with two specific forms of financial contribution: Tax behavior and charitable giving.

2. Materials and Methods

2.1. Participants and Design

We developed a questionnaire based on the insights from a qualitative study [12] and the questionnaire was administered through the online survey platform Qualtrics. The questionnaire was made accessible from mid-February 2017 to mid-March 2017. A combination of convenience and targeted sampling was used. This method included emails to personal contacts, as well as an invitation to take part in the study through social media websites (Facebook and LinkedIn). An electronic consent form preceded the questionnaire and contained an adequate disclosure regarding the purpose of the study and researcher contact details. Moreover, participants were promised anonymity and were given the option of withdrawing at any time. No incentives were offered for participation. The study received approval from the University’s ethics committee.
We collected 469 valid questionnaires. Participants were Italian (61.4% female) aging between 18 and 79 years (M = 35.5, SD = 13.5, Md = 30). Italy represents a good testing ground as the most recent Global Financial Crisis had a noteworthy impact on the society [20,21] and, despite the huge public debt, Italian people show high levels of proclivity towards tax evasion [22,23,24], which undermines the financial sustainability of the societal system. A high percentage (68.2%) of participants held a university degree (either bachelor’s or master’s), whereas they varied in terms of employment condition (44.6% employees, 16.6% self-employed, and 29.2% students, with the remaining 9.6%, including unemployed, homemakers, and retired people). The sample was equally divided in terms of region (51.6% from the northern regions of Italy, 48.4% from the southern). Regarding annual income, 51.2% reported a yearly gross income lower than €20,000, 21.4% reported between €20,000 and €29,999, and 27.3% reported €30,000 or more (according to the most recent IRPEF estimates, the average Italian income declared to fiscal authorities in 2015 is €20,690 (http://www1.finanze.gov.it/finanze2/analisi_stat/index.php?tree=2016). Although not representative of the Italian population, the sample provided a good level of heterogeneity.

2.2. Measures

The items of the metric under investigation were formulated based on the results of Castiglioni et al. [18] and were discussed within a group of economic psychologists. The resulting final set, used in the survey, comprised 14 items (see Table 1). A larger set of items was previously tested, and items which were skewed, were heavy- or light-tailed, or showed floor or ceiling effects (medians ≤ 2.00 or medians ≥ 8.00) were excluded from following analyses. Participants responded to each item on a nine-point scale ranging from one (strongly disagree) to nine (strongly agree).
Given the lack of a well-developed measurement of people’s proclivity to provide for the common good, it was not possible to include in the questionnaire other similar measurements to demonstrate construct validity. Instead, the interconnections between the construct and other hypothetically related constructs have been examined, focusing on the so-called nomological network, which refers to the network of ‘meaning’ surrounding a construct [25]. The following measures were used:
Civic Engagement Scale (CES). Developed by Doolittle and Faul [26], the CES consists of two dimensions, attitudes (eight items, e.g., “I believe that all citizens have a responsibility to their community”) and behaviors (six items, e.g., “I help members of my community”). Civic attitudes have been defined as the personal beliefs and feelings that individuals have about their own involvement in their community and their perceived ability to make a difference in that community, while civic behaviors have been defined as the actions that individuals take in an attempt to actively engage and make a difference in their community. Hence, both dimensions are expected to have a positive relationship with the construct under investigation. The answering formats range from completely disagree (1) to completely agree (7) for attitudes and from never (1) to always (7) for behaviors. Both dimensions showed very good reliability, with a Cronbach’s α equal to 0.87 and 0.85, respectively.
Collectivism (CO). Collectivism is part of Hofstede’s [27] five-dimensional measure of cultural values, which is the overwhelmingly dominant metric of culture. However, this metric has been generally used to assign individuals with Hofstede’s national culture indices according to their national identity, rather than to accurately measure differences between individuals. This is very acceptable when the unit of analysis is a country (or when culture is used as a contextual variable), but it is not appropriate when a study examines the effect of an individual’s orientation. For this reason, the present study adopts the Collectivism dimension of the CVSCALE [28], which measures Hofstede’s dimensions of culture at the individual level. The construct is expected to have a positive relationship with the CGP scale. The Collectivism dimension (CO) is composed of six items (e.g., “Group welfare is more important than individual rewards”) and was evaluated using 5-point Likert-type scales anchored by 1 = “strongly disagree” and 5 = “strongly agree”. The scale showed very good reliability (α=0.85).
As for criterion validity of the construct, we decided to examine its explanatory power in relation with two specific forms of contribution to the common good: Paying taxes and making charitable donations. The following measures were adopted:
Tax evasion (TE). Five items from the TAX-I inventory [29], representing fictitious case scenarios, were used as examples of concrete ways of evading taxes. This kind of behavior is expected to have a negative relationship with the provision for the common good, since tax evaders are withholding resources that could be used to increase the common good. Participants were asked how likely they would be to engage in the behavior (e.g., “A customer paid in cash and did not require an invoice. You could intentionally omit this income on your income tax return. How likely is it that you would omit this income?”). The Italian validation of the scale was adopted [30] and showed good reliability, with a Cronbach’s α equal to 0.85.
Donation (DO). Given the lack of validated scales using fictitious case scenarios to assess how likely people are to donate money, an ad-hoc scale was created in a way that resembled the TE (tax evasion) scale. In this case, a positive relationship with the provision for the common good is expected. Five items were used as examples of concrete ways of donating money to charity (e.g., “You could see on TV a campaign from a big organization that is committed to improving the life conditions of African children. How likely it is that you would make a donation to this organization?”). The scale, which was developed in Italian (see Appendix A), showed good reliability, with a Cronbach’s α equal to 0.79 and inter-item correlations ranging from 0.27 to 0.51, all significant at the level of p < 0.001. All items showed a normal distribution and no ceiling effects.

2.3. Statistical Analysis

Descriptive statistics were computed for each item (asymmetry, kurtosis, mean, median, and standard deviation), and normality of distribution was checked.
To evaluate the structure and psychometric properties of the CGP scale, the sample of N = 469 participants were randomly divided into two subsamples. No significant differences were found between the two subsamples with regard to sex, age, education, region, employment and yearly income, indicating that randomization was successful. Factor analysis was performed on a subsample (n = 276, 60% of total sample) to estimate the factor loadings, to allow for greater accuracy of variable clustering, and to minimize the covariance between elements on factors [31,32].
Next, to check the adequacy of the items to the identified dimensions, a confirmatory factor analysis was run using AMOS [33] on the second sub-sample of n = 193 (40% of total sample). The model was estimated using Maximum Likelihood with robust standard errors and evaluated using the chi-square (i.e., non-significant values associated with p indicate a good mode) and approximate fit statistics, based on Hu and Bentler [34]. These included: Root Mean Square Error of Approximation (RMSEA) < 0.08; Confirmatory Fit Index (CFI) ≥ 0.95; and Tucker-Lewis Index (TLI) ≥ 0.95.
The nomological network of the CGP questionnaire was assessed by analyzing the correlations with CES attitude, CES behavior and Collectivism scales. The total sample was used to perform the analysis.
Finally, structural equation modelling (SEM) was used to analyze the relationships between the construct under investigation and two ways to contribute to the common good: Paying taxes and making charitable donations. The goodness of fit test was carried out on the basis of the above-mentioned indices.

3. Results

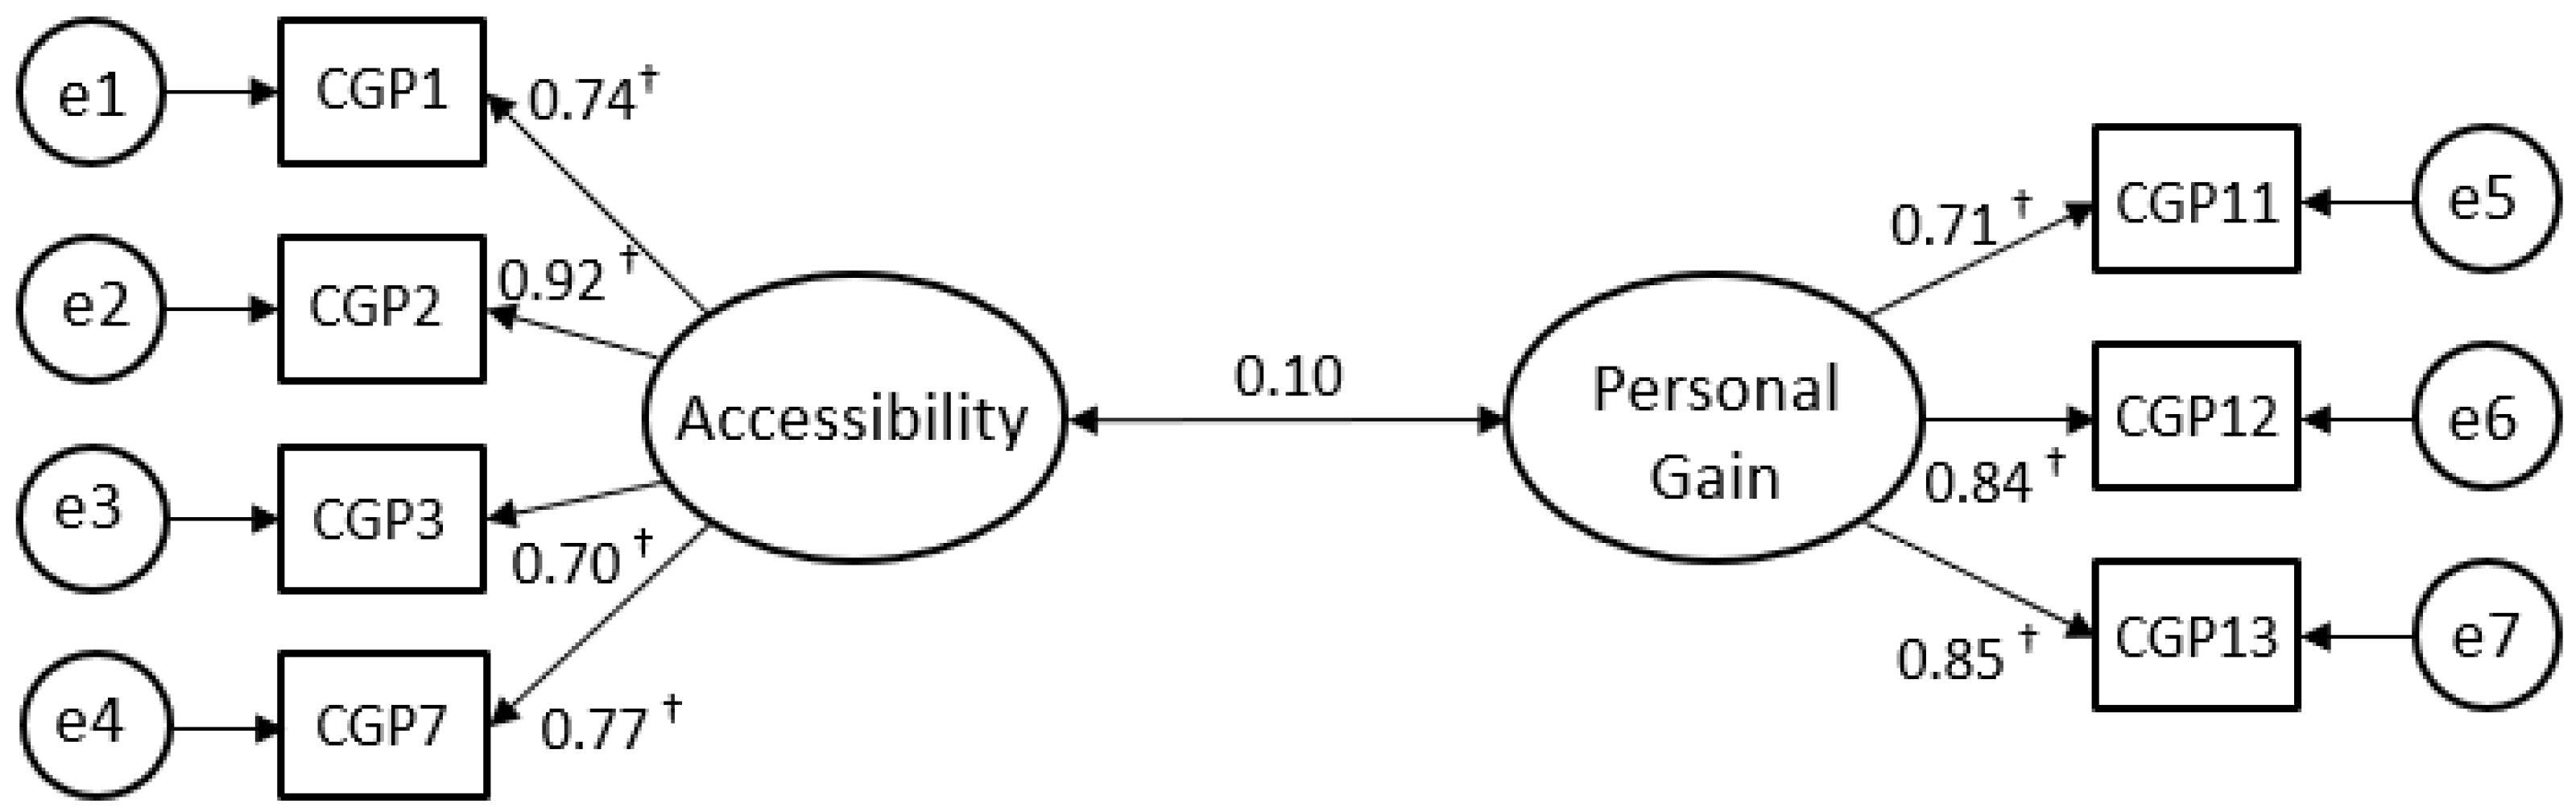
3.1. Scale Structure and Psychometric Properties

Table 2 shows the means, standard deviations, medians, asymmetry and kurtosis of CGP items under analysis, and Table 3 shows their inter-item correlations. Items distribution appears to be normal.
An exploratory factor analysis with oblimin rotation was performed on the first subsample to examine the factor structure. The analysis with an unconstrained number of factors yielded eigenvalues of 5.52, 2.10, and 0.59, with 58.6% of variance explained. Based on an eigenvalue criterion of > 1.0 and scree plot analysis, a second factor analysis with oblimin rotation was conducted constraining for two factors. The new analysis yielded eigenvalues of 5.48 and 2.05, with 53.8% of variance explained. By analyzing the pattern matrix and item loadings, the decision was made to exclude items CGP4 and CGP6, because they saturated with both factors; in addition, items CGP5, CGP8, CGP9 and CGP10 were excluded because of their low loadings with Factor 1, and item GP14 was excluded because of its low loading with Factor 2. A third factor analysis with the remaining seven items was performed with oblimin rotation and an unconstrained number of factors. The analysis yielded eigenvalues of 2.81 and 1.70, with 64.4% of variance explained.
Factor 1 contains CGP1, CGP2, CGP3 and CGP7 items, all loading above 0.70 (α = 0.89). This factor represents the idea that one’s motive to provide for the common good is to make it accessible to anyone and to fulfill everyone’s basic needs (Accessibility). Factor 2 contains CGP11, CGP12, and CGP13 items, all loading above 0.68 (α = 0.81). This factor represents the idea that one’s primary motive for contributing to the common good is to get a personal benefit and return (Personal Gain). Table 4 shows the selected items and factors.
The next step was to examine the relationships between the factors. Scale scores on each factor were calculated for each person by summing ratings for each factor and then dividing by the number of items used to measure it. To assess whether factors are relatively independent of each other and therefore supportive of the co-existence assumption, the scale scores were intercorrelated. Table 5 shows means, standard deviations, medians, and Cronbach’s alphas of both factors, as well as inter-scale correlations. Accessibility and Personal Gain share a weak, positive, statistically significant relationship (r = 0.12, p = 0.05). Due to the low correlation, it is possible to accept the co-existence assumption and to distinguish the factors into two separate dimensions. The analysis also shows that people, being multifaceted, can simultaneously hold different motives for providing for the common good. In other words, having one motivation does not rule out the possibility of having another, as co-existence remains plausible.
Finally, a confirmatory factor analysis was run on the second subsample. Results showed that the proposed model (Figure 1) provided a very good fit to the data, χ2(13) = 19.249, p = n.s., CFI = 0.99, TLI = 0.98, RMSEA = 0.05 (LO90 = 0.000, HI90 = 0.094) and strong factor loadings ranging from 0.70 to 0.92, with median standardized loading = 0.77 (factor loadings < 0.40 are weak and factor loadings ≥ 0.60 can be considered strong [35]).

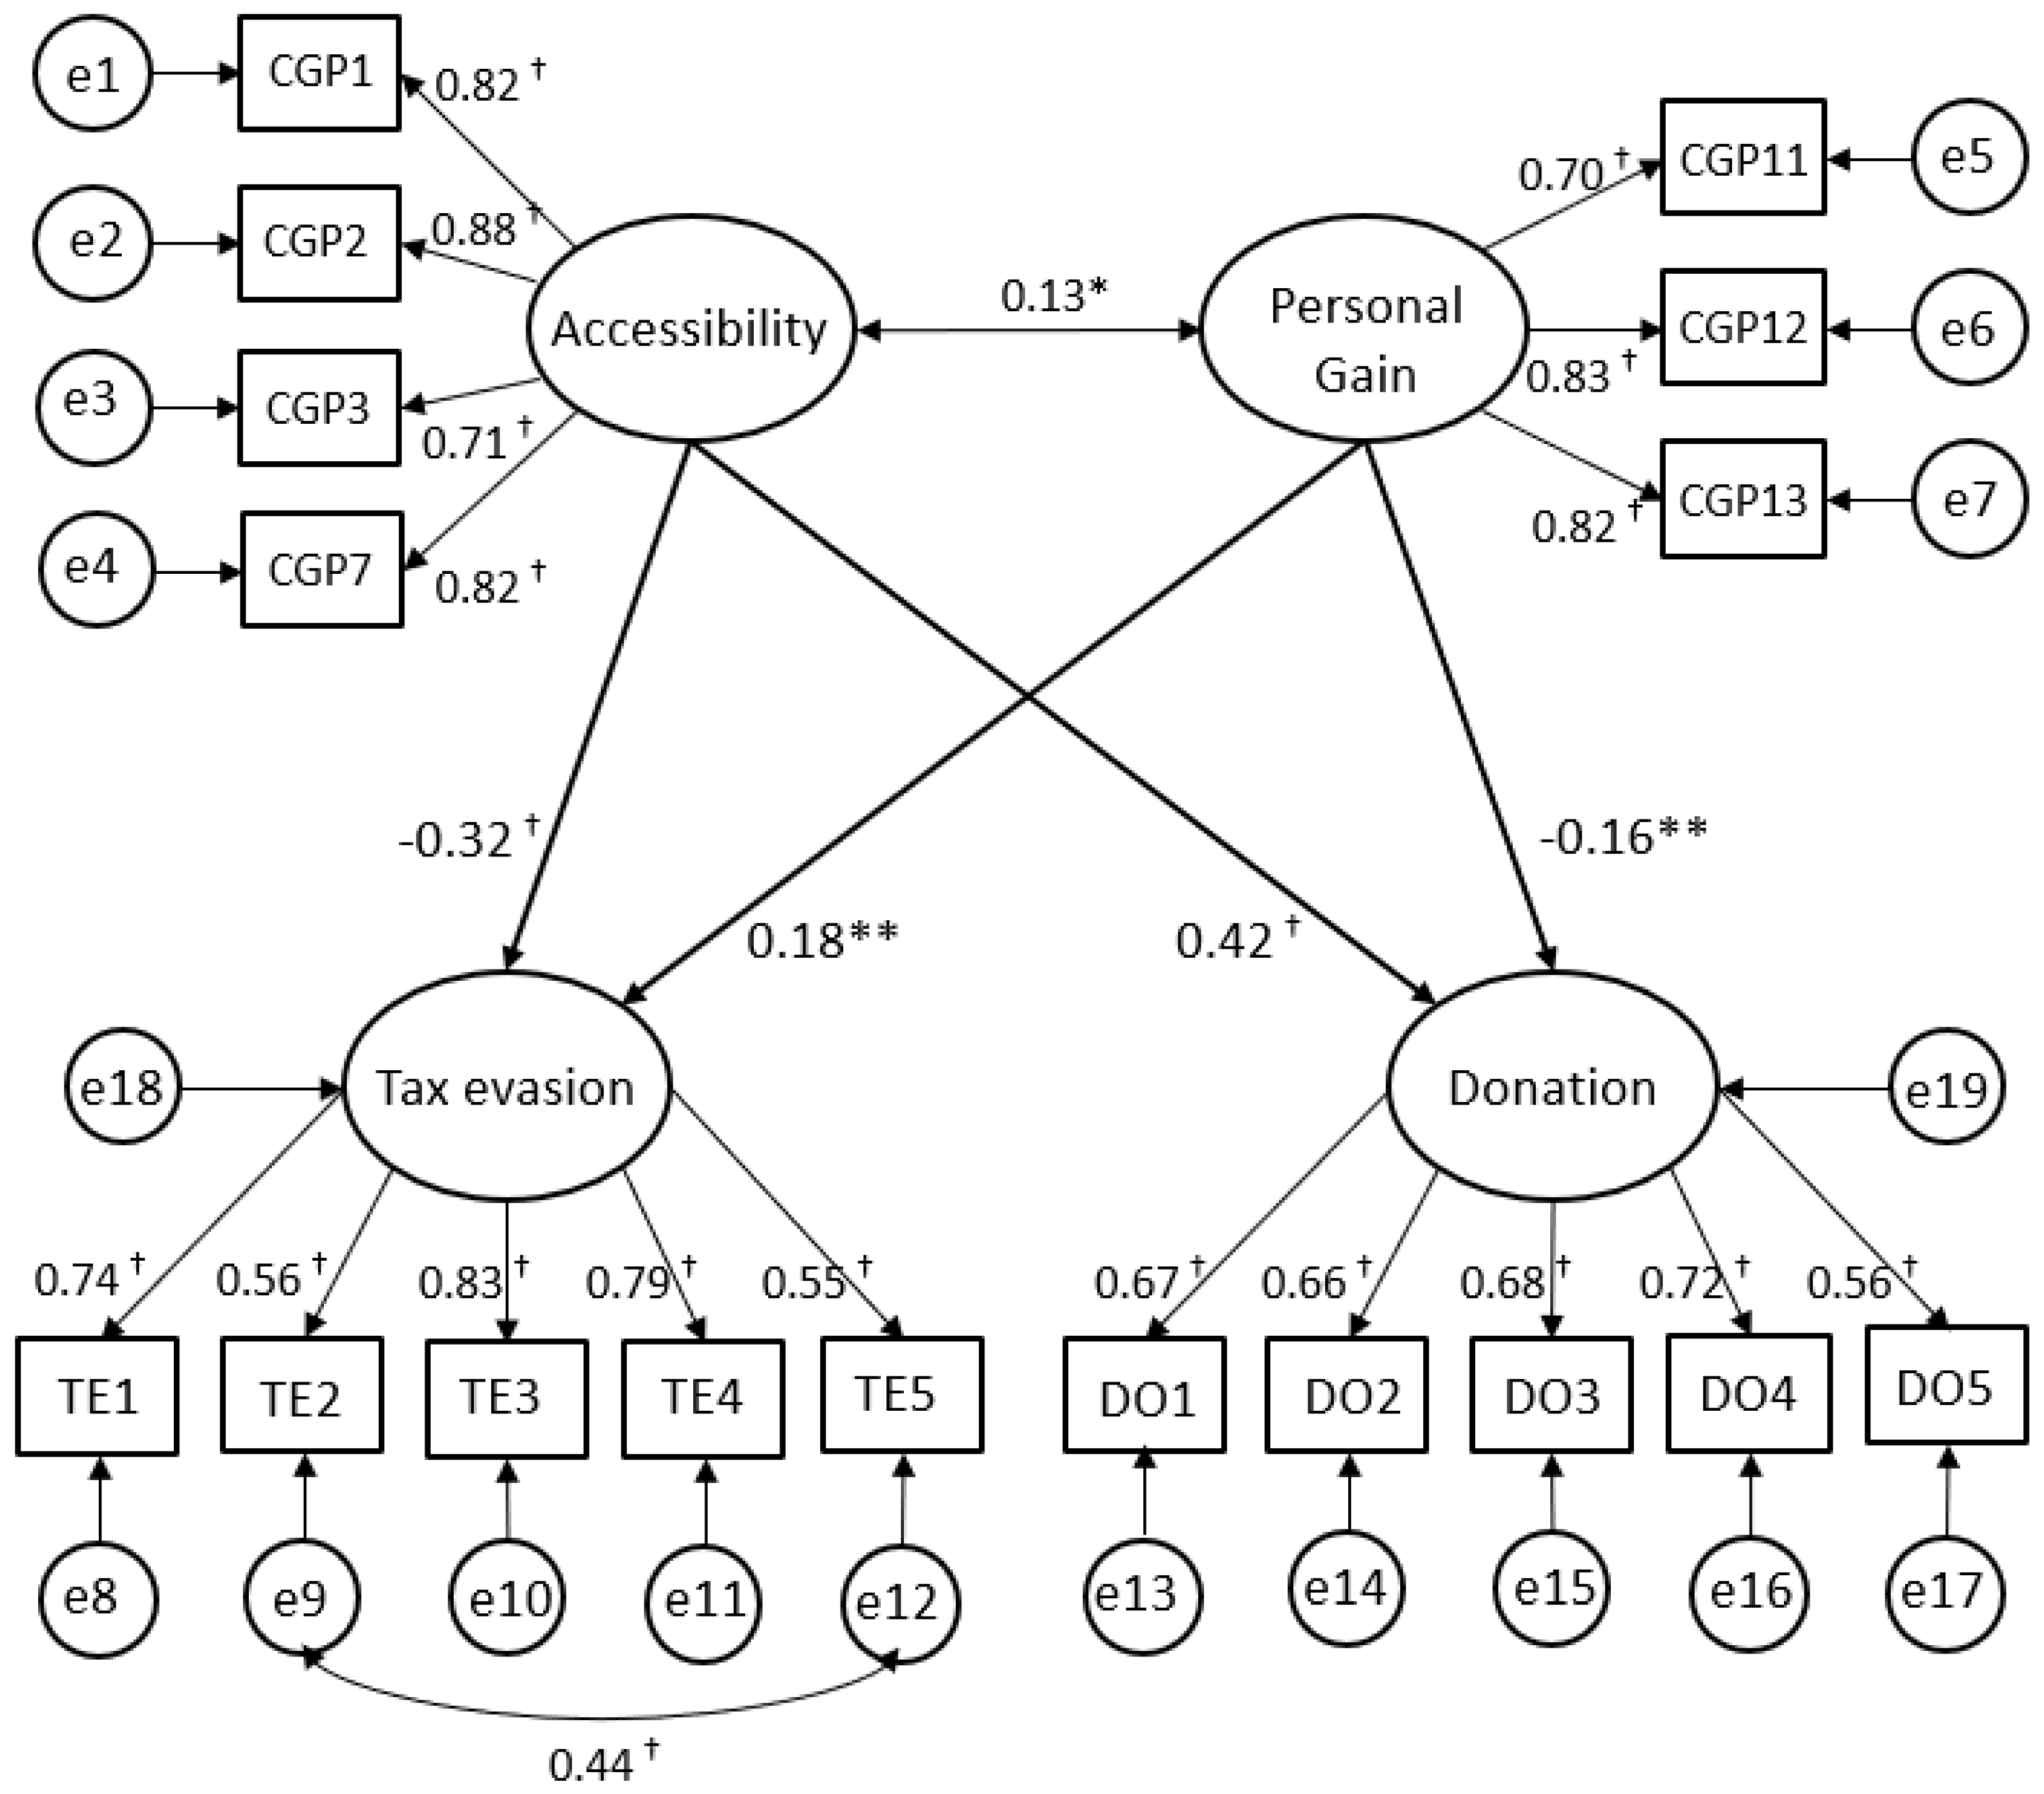
3.2. Nomological Network Analysis and Criterion Validity

Table 6 shows correlations between CGP scale and related measures (CES attitude, CES behavior, and Collectivism). CES attitude, CES behavior, and Collectivism share a positive and significant relation with Accessibility, whereas they have nonsignificant relationships with the factor Personal Gain. This can be explained by the idea that the underlying motive to provide for the common good for Personal Gain stems from a desire to get a personal return and direct benefit, rather than from a genuine desire to help the community. Overall, the relationships between the CGP factors and other constructs range from r = −0.04 to r = 0.57. This range of values addresses both convergent and discriminant validity, since the CGP scale appears to be to some extent related to them, but at the same time is different and non-redundant. In other words, the CGP scale is not simply another way to measure civic engagement or collectivism, but rather entails a new different construct.
Finally, a structural equation model was run in AMOS on the total sample to assess the explanatory power of CGP scale on willingness to donate/evade money. A good fit of the model to empirical data was observed (Figure 2): χ2(113) = 218.497, p < 0.001, CFI = 0.97, TLI = 0.96, RMSEA = 0.045 (LO90 = 0.036, HI90 = 0.054). In accordance with the assumptions, tax evasion was negatively influenced by Accessibility (β = −0.32, p < 0.001) and positively influenced by Personal Gain (β = 0.19, p < 0.01). Donation, on the other hand, was positively influenced by Accessibility (β = 0.42, p < 0.001) and negatively influenced by Personal Gain (β = −0.15, p < 0.01).

4. Discussion

The purpose of this study was to develop and validate an easy-to-use metric for assessing individual motivations to provide for the common good (Common Good Provision, or CGP) and examine its structure and psychometric properties. Since the final scale consists of only seven items (see Table 3) and both factors show good reliability, the metric is parsimonious and timesaving.
The structure and psychometric properties of the CGP scale were examined through an exploratory factor analysis, which identified the presence of two clearly interpretable factors, corresponding to different motives for providing for the common good: Accessibility (i.e., making the common good accessible to anyone and fulfilling people’s basic needs) and Personal Gain (i.e., getting a return and personal advantage in exchange for one’s contribution). Confirmatory factor analysis also yielded a good model fit (see Figure 1), and its results loaded consistently on two factors suggesting the presence of two stable dimensions. The Accessibility factor could be related to the need to see the world as fair and just (just-world hypothesis) [36] and the need for equity [37]. Accordingly, people are motivated to help others who have been treated unfairly, and they are motivated to restore equity when they perceive an imbalance. Thus, they may be more willing to financially provide for the common good (either by paying taxes or by making donations) if they perceive the world as unfair and if they believe they can restore equity and promote the well-being of society by making goods and resources equally accessible to everyone. The Personal Gain factor, on the other hand, seems to be related to an assessment of the costs and rewards for contributing. Providing for the common good seems to be fair if costs and benefits are balanced (equity theory) [38]. Accordingly, the ultimate motive for providing for the common good is when personal advantages are easily identified (quid pro quo).
In the nomological network analysis, results suggest both convergent and discriminant validity of the construct. The Accessibility factor is related to both civic engagement and collectivism, but it is altogether a different construct from them. Personal Gain, on the other hand, is not related to either civic engagement or collectivism, as it is a self-oriented motive to provide for the common good (i.e., gaining a direct and personal advantage). This result suggests that the CGP scale is non-redundant and entails a different construct from collectivism and civic engagement.
Finally, the structural equation model demonstrated that Accessibility and Personal Gain can be common antecedents of both tax behavior and charitable giving, which are two different ways to financially provide for the common good. When the Accessibility motive prevails, people are more willing to pay taxes and make donations, whereas when the Personal Gain motive prevails, people are more likely to commit tax evasion and less willing to make monetary donations. Although further studies are needed to better understand these relationships, it seems that, for people who score high on the Personal Gain motive, if the personal benefit that comes from providing for the common good is not clear, they may be discouraged from making a donation and being tax compliant. Hence, people’s provision for the common good could be promoted by making potential returns clear and easily identifiable [19]. On the other hand, for people who score high on the Accessibility motive, it seems that charitable giving and tax compliance could be promoted by highlighting inequalities and unfairness. However, since these two motives (i.e., Accessibility and Personal Gain) are not mutually exclusive, for some people both kinds of evidence might be necessary to increase their orientation towards the common good and the sustainable development of civil society.
The present study specifically tested a model in which the financial contribution to the common good (i.e., paying taxes and making charitable donations) was investigated. Further research exploring this construct in relation to other forms of contribution and cooperative behavior is needed, as the promotion of people’s wellbeing and sustainable development has many different forms. For instance, at the societal level, sustainable development may involve environmental responsibility (i.e., recycling) [39] and ethical consumption and market choices (i.e., second-hand clothing; sustainable tourism) [40,41]; at the social level, it may involve voluntary work [42]; and, finally, at the organizational level, it may be related to the promotion of organizational citizenship behavior (OCB) [43], corporate social responsibility (CSR) [44], work inclusion [45], and managing complex organizations [46]. In this study, when focusing on the financial provision for the common good, we predominantly refer to the threat of financial crisis. However, it should be noted that the concept of common good also accounts for democracy and for the quality of the political system, which was not examined in this study. Further research should investigate how the CGP scale, which in its current version is value-free, could be committed to the promotion of dignity as a human right in a just political system.
Naturally, some limitations of the study should be acknowledged. First, given the difficulty of finding a well-developed measurement of ‘common good orientation’ or ‘common good provision’, convergent validity could not be assessed. Thus, other related measures have been considered instead. Second, all items are self-report measures and therefore may be subject to social desirability effects, especially if we consider the sensitive topic under investigation. Finally, the CGP scale was validated on a non-representative sample of the Italian population. Using a representative sample of Italian citizens could aid in understanding what proportion of the population displays different motives in relation to the common good provision. Also, it would be necessary to extend the study of the psychometric properties of the scale to other countries. In fact, such results may not reflect other countries’ perspectives, especially in the case of countries with different cultural and socio-economic backgrounds. To conduct comparable cross-national or cross-cultural studies, all items need to be translated. This task, however, should be rather uncomplicated, since all items address the provision for the common good in an abstract, a-specific, and a-contextual way. Finally, by adopting a psychological perspective and focusing on the motives to provide for the common good, this study fails to analyze the systemic effects–either intended or unintended—of cooperative behavior, which are an integral part of sustainable development.
To conclude, this study offers several contributions to the literature. First, it fills a significant gap in the literature by providing a tool to assess people’s proclivity towards the provision for the common good. To the best of our knowledge, it is the first attempt in psychology to operationalize this construct based on lay people’s representations. Second, it explores the relationship between different motives for providing for the common good and two different outcomes: The willingness to pay taxes and the willingness to donate money to charities. Thus, it also enhances the existing knowledge on tax behavior and charitable giving by identifying two common antecedents. Third, it tackles an important issue that has been a major philosophical concern since ancient times, that it the tension between egoism and concern for the common good. In recent decades, this issue has been central to the challenge by communitarians to neoliberalists, who strongly emphasized and defended egoism. People’s concern for accessibility as opposed to personal gain can offer important clarification to this debate, by providing a different way to think about the common good. All this can be very important for achieving sustainability since contemporary hostility to the notion of the common good has been a major factor in crippling efforts to achieve sustainability in society.
One final consideration concerns the use of a transdisciplinary research approach, which is advocated when dealing with sustainability issues [47]. Promoting sustainable development addresses complex societal concerns that necessitate overcoming compartmentalized knowledge and transgressing disciplinary boundaries. A transdisciplinary approach tries to integrate and synthesize different disciplinary perspectives by focusing more directly on the problem, rather than the particular intellectual tools and models used to solve them [48]. By adopting a positive psychological approach to sustainability and by taking into account the knowledge of people involved, we aimed to pursue a transdisciplinary research approach. In fact, we developed a tool based on lay people’s representation on the issue, as their interests and needs are at stake too. Finally, we hope that a psychological approach to sustainability may dialogue with other disciplines that have traditionally dealt with sustainability issues (e.g., ecological economics) and other parties involves (e.g., civil society, public agencies, etc.).

5. Conclusions

In light of the complexity of the postmodern era, in which the quality of life of each human being and the sustainable development of civil society is in danger, the psychology of sustainability and sustainable development can help to deal with such issues. To be sustainable, a society needs a minimum degree of commitment to the community and the willingness to subordinate personal needs to the welfare of the social environment. Contributing to the common good and to the well-being of society as a whole is necessary for the sustainable development of civil society. To support the development of policies and interventions aimed at promoting the citizens’ contribution to the common good, it is of paramount importance for scholars, practitioners, and policy-makers to have assessment instruments with strong psychometric properties to empirically monitor individual differences in providing for the common good and identify weak spots in a society. The present study was a first attempt to deliver such an instrument, the Common Good Provision scale (CGP), whose psychometric properties appear to be promising. While further research is still needed to demonstrate its reliability and validity, especially in contexts other than tax behavior and charitable giving and in countries other than Italy, the CGP questionnaire fills an important literature gap in psychology literature.

Author Contributions

C.C. and E.L. formulated the goals of the research and developed the methodology. C.C. collected the data and performed the statistical analyses. A.B. supervised the statistical analysis. All of the authors contributed to the preparation and writing of the paper.

Funding

Università Cattolica del Sacro Cuore contributed to the funding of this research project and its publication. The funding number is R1074500139.

Acknowledgments

We kindly thank the anonymous reviewers for their insightful comments and suggestions.

Conflicts of Interest

The authors declare no conflict of interest.

Appendix A

Table A1. Donation scale (DO). The scale was originally developed in Italian (α= 0.79).
Donation Scale (DO)
Si immagini le seguenti situazioni che descrivono come Lei potrebbe effettuare delle donazioni in beneficenza. Per favore, indichi quanto sia probabile la scelta delle seguenti possibilità su una scala da 1 a 9 (1 = per nulla probabile, 9 = estremamente probabile)
[Imagine the following situations that describe how you could make a charitable donation. On a scale from 1 to 9 (1 = not at all likely, 9= extremely likely), please indicate how likely it is that you would make a donation]
DO1Potrebbe vedere in televisione lo spot di una grande associazione che si impegna a migliorare le condizioni di vita dei bambini in Africa. Quanto è probabile che decida di effettuare una donazione a favore di questa associazione?
[You could see on TV a campaign from a big organization that is committed to improving the life conditions of African children. How likely it is that you would make a donation to this organization?]
DO2Potrebbe sentir parlare di un’importante associazione ambientalista che si occupa della salvaguardia e tutela dell’ambiente a livello internazionale. Quanto è probabile che decida di effettuare una donazione a favore di questa associazione?
[You could hear about an important environmental organization that is committed to safeguarding the environment at international level. How likely it is that you would make a donation to this organization?]
DO3Potrebbe vedere nella piazza della sua città un banchetto che promuove una prestigiosa associazione impegnata nella ricerca e nella lotta contro il cancro. Quanto è probabile che decida di effettuare una donazione a favore di questa associazione?
[You could see in your town square a stand that promotes a well-known organization that is committed to fighting against cancer. How likely it is that you would make a donation to this organization?]
DO4Recentemente alcune città italiane sono state colpite da una scossa di terremoto. Un’associazione che opera sul territorio nazionale si sta impegnando nel dare supporto ai terremotati. Quanto è probabile che decida di effettuare una donazione a favore di questa associazione?
[An earthquake recently struck some Italian cities. A national association is committed to supporting the victims. How likely it is that you would make a donation to this organization?]
DO5Potrebbe venire a conoscenza di un’associazione locale che opera a favore della sua comunità di appartenenza. Quanto è probabile che decida di effettuare una donazione a favore di questa associazione?
[You could become aware of a local association that works to support your local community. How likely it is that you would make a donation to this organization?]

References

  1. Keeble, B.R. The Brundtland report: Our common future. Med. War 1988, 4, 17–25. [Google Scholar] [CrossRef]
  2. Di Fabio, A. Intrapreneurial Self-Capital: A New Construct for the 21st Century. J. Employ. Couns. 2014, 51, 98–111. [Google Scholar] [CrossRef]
  3. Di Fabio, A.; Kenny, M.E. From Decent Work to Decent Lives: Positive Self and Relational Management (PS&RM) in the Twenty-First Century. Front. Psychol. 2016, 7. [Google Scholar] [CrossRef]
  4. Di Fabio, A.; Rosen, M.A. Opening the Black Box of Psychological Processes in the Science of Sustainable Development: A New Frontier. Eur. J. Sustain. Dev. Res. 2018, 2, 47. [Google Scholar] [CrossRef]
  5. Di Fabio, A. The psychology of sustainability and sustainable development for well-being in organizations. Front. Psychol. 2017, 8, 1534. [Google Scholar] [CrossRef] [PubMed]
  6. Etzioni, A. Common Good. The Encyclopedia of Political Thought; John Wiley & Sons Ltd.: Hoboken, NJ, USA, 2014; pp. 603–610. [Google Scholar]
  7. Mastromatteo, G.; Solari, S. The Idea of “Common Good” and the Role of the State in Present Day Social Economics. Riv. Int. Sci. Soc. 2014, 1, 85–102. [Google Scholar]
  8. Plant, R. Modern Political Thought; Blackwell: Oxford, UK, 1991. [Google Scholar]
  9. Musgrave, R.A. Cost-Benefit Analysis and the Theory of Public Finance. J. Econ. Lit. 1969, 7, 797–806. [Google Scholar]
  10. Samuelson, P.A. Contrast between Welfare Conditions for Joint Supply and for Public Goods. Rev. Econ. Stat. 1969, 51, 26–30. [Google Scholar] [CrossRef]
  11. Murphy, T.; Parkey, J. An economic analysis of the philosophical common good. Int. J. Soc. Econ. 2016, 43, 823–840. [Google Scholar] [CrossRef]
  12. Castiglioni, C.; Lozza, E.; Bosio, A.C. Lay People Representations on the Common Good and Its Financial Provision. Sage Open 2018, 8. [Google Scholar] [CrossRef]
  13. Felber, C. Change Everything: Creating an Economy for the Common Good; Zed Books Ltd.: London, UK, 2015. [Google Scholar]
  14. Barham, L.; Eagleson, M. Sustainability agendas in education and employment: Approaches and dilemmas. Presented at Green Guidance: A Time for Action. In Proceedings of the Green Guidance: A Time for Action, Symposium Conducted at the IAEVG International Conference, Montpellier, France, 24–27 September 2013. [Google Scholar]
  15. Schiefer, D.; van der Noll, J. The Essentials of Social Cohesion: A Literature Review. Soc. Indic. Res. 2017, 132, 579–603. [Google Scholar] [CrossRef]
  16. Council of Europe. Concerted Development of Social Cohesion Indicators. Method Guide; Council of Europe Publishing: Strasbourg, France, 2005. [Google Scholar]
  17. Jenson, J. Mapping Social Cohesion: The State of Canadian Research; Canadian Policy Research Networks: Ottawa, CA, USA, 1998. [Google Scholar]
  18. Schmeets, H.; Te Riele, S. Declining Social Cohesion in The Netherlands? Soc. Indic. Res. 2014, 115, 791–812. [Google Scholar] [CrossRef]
  19. Castiglioni, C.; Lozza, E.; van Dijk, E.; van Dijk, W.W. Two sides of the same coin? An investigation on the effects of frames on tax compliance and charitable giving. Palgr. Commun. 2019. under review. [Google Scholar]
  20. Lozza, E.; Bonanomi, A.; Castiglioni, C.; Bosio, A.C. Consumer sentiment after the global financial crisis. J. Mark. Res. Soc. 2016, 58, 671–691. [Google Scholar] [CrossRef]
  21. Lozza, E.; Castiglioni, C.; Bonanomi, A. The effects of changes in job insecurity on daily consumption and major life decisions. Econ. Ind. Dem. 2017. Available online: https://journals.sagepub.com/doi/full/10.1177/0143831X17731611 (accessed on 6 January 2019). [CrossRef]
  22. Castiglioni, C.; Lozza, E.; Cullis, J.; Jones, P.; Lewis, A. Is benefit fraud more or less wrong than tax evasion? An exploratory study in the perspective of fiscal psychology. Psic. Soc. 2014, 9, 291–308. [Google Scholar]
  23. Cullis, J.; Jones, P.; Lewis, A.; Castiglioni, C.; Lozza, E. Do poachers make harsh gamekeepers? Attitudes to tax evasion and to benefit fraud. J. Behav. Exp. Econ. 2015, 58, 124–131. [Google Scholar] [CrossRef] [Green Version]
  24. Lozza, E.; Castiglioni, C. Tax climate in the national press: A new tool in tax behaviour research. J. Soc. Pol. Psychol. 2018, 6, 401–419. [Google Scholar] [CrossRef]
  25. Cronbach, L.J.; Meehl, P.E. Construct validity in psychological tests. Psychol. Bull. 1955, 52, 281–302. [Google Scholar] [CrossRef] [PubMed]
  26. Doolittle, A.; Faul, A.C. Civic Engagement Scale: A Validation Study. Sage Open 2013, 3. [Google Scholar] [CrossRef]
  27. Hofstede, G. Culture’s Consequences: Comparing Values, Behaviors, Institutions and Organizations Across Nations; Sage publications: Thousand Oaks, CA, USA, 2001. [Google Scholar]
  28. Yoo, B.; Donthu, N.; Lenartowicz, T. Measuring Hofstede’s five dimensions of cultural values at the individual level: Development and validation of CVSCALE. J. Int. Consum. Mark. 2011, 23, 193–210. [Google Scholar]
  29. Kirchler, E.; Wahl, I. Tax compliance inventory TAX-I: Designing an inventory for surveys of tax compliance. J. Econ. Psychol. 2010, 31, 331–346. [Google Scholar] [CrossRef] [PubMed] [Green Version]
  30. Berti, C.; Kastlunger, B.; Kirchler, E. The slippery slope of the tax behavior: Italian validation of a compliance inventory. Giornale Italiano di Psicologia 2013, 40, 377–408. [Google Scholar]
  31. Conway, J.M.; Huffcutt, A.I. A review and evaluation of exploratory factor analysis practices in organizational research. Organ. Res. Methods 2003, 6, 147–168. [Google Scholar] [CrossRef]
  32. Hair, J.F.; Anderson, R.E.; Tatham, R.L.; Black, W.C. Multivariate Data Analysis, 7th ed.; Pearson Prentice Hall: Upper Saddle River, NJ, USA, 1998. [Google Scholar]
  33. Arbuckle, J.L. Amos 5.0; Amos Development Corporation: Chicago, IL, USA, 2003. [Google Scholar]
  34. Hu, L.; Bentler, P.M. Cutoff criteria for fit indexes in covariance structure analysis: Conventional criteria versus new alternatives. Struct. Equ. Model. Mulidscip. J. 1999, 6, 1–55. [Google Scholar] [CrossRef]
  35. Beavers, A.S.; Lounsbury, J.W.; Richards, J.K.; Huck, S.W.; Skolits, G.J.; Esquivel, S.L. Practical Considerations for Using Exploratory Factor Analysis in Educational Research. Pract. Assess. Res. Eval. 2013, 18. [Google Scholar]
  36. Lerner, M.J. The Belief in a Just World: A Fundamental Delusion; Lerner, M.J., Ed.; Springer US: Boston, MA, USA, 1980; pp. 247–269. [Google Scholar]
  37. Adams, J.S. Towards an understanding of inequity. J. Abnorm. Soc. Psychol. 1963, 67, 422–436. [Google Scholar] [CrossRef]
  38. Walster, E.; Walster, G.W.; Berscheid, E. Equity: Theory and Research; Allyn & Bacon: Boston, MA, USA, 1978. [Google Scholar]
  39. Ramayah, T.; Rahbar, E. Greening the Environment through Recycling: An Empirical Study. Manag. Environ. Qual. Int. J. 2013, 24, 782–801. [Google Scholar] [CrossRef]
  40. Lozza, E.; Cornaggia, C.; Castiglioni, C. Il recupero di antichi habiti: un’indagine storica e psicologica sul consumo di abbigliamento usato. Psic. Soc. 2018, in press. [Google Scholar]
  41. Castiglioni, C.; Lozza, E.; Libreri, C.; Anselmi, P. Increasing employability in the emerging tourism sector in Mozambique: Results of a qualitative study. Dev. S. Afr. 2017, 34, 245–259. [Google Scholar] [CrossRef]
  42. Niebuur, J.; van Lente, L.; Liefbroer, A.C.; Steverink, N.; Smidt, N. Determinants of Participation in Voluntary Work: A Systematic Review and Meta-analysis of Longitudinal Cohort Studies. BMC Public Health 2018, 18, 1213. [Google Scholar] [CrossRef] [PubMed]
  43. Organ, D.W. Organizational Citizenship Behavior: It’s Construct Clean-Up Time. Hum. Perform. 1997, 10, 85–97. [Google Scholar] [CrossRef]
  44. Ali, W.; Frynas, J.G.; Mahmood, Z. Determinants of Corporate Social Responsibility (CSR) Disclosure in Developed and Developing Countries: A Literature Review. Corp. Soc. Responsib. Environ. Manag. 2017, 24, 273–294. [Google Scholar] [CrossRef]
  45. Scaratti, G.; Ivaldi, S.; Frassy, J. Networking and Knotworking Practices: Work Integration as Situated Social Process. J. Workplace Learn. 2017, 29, 2–23. [Google Scholar] [CrossRef]
  46. Scaratti, G.; Ivaldi, S. Manager on the Ground. A Practice Based Approach for Developing Management Education: Lessons from Complex and Innovative Organizations. Bollettino di Psicologia Applicata 2015, 272, 42–57. [Google Scholar]
  47. Hadorn, G.H.; Bradley, D.; Pohl, C.; Rist, S.; Wiesmann, U. Implications of transdisciplinarity for sustainability research. Ecol. Econ. 2006, 60, 119–128. [Google Scholar] [CrossRef]
  48. Costanza, R.; Daly, H.E.; Bartholomew, J.W. Goals, agenda, and policy recommendations for ecological economics. In Ecological Economics: The Science and Management of Sustainability; Costanza, R., Ed.; Columbia University Press: New York, NY, USA, 1991; pp. 1–20. [Google Scholar]
Figure 1. Factor structure of the CGP scale (Accessibility and Personal Gain). Standardized parameter estimates for the final model. Note: † p < 0.001.
Sustainability 11 00370 g001
Figure 2. Explanatory power of CGP scale on tax evasion and donation intentions. Standardized parameter estimates for the final model. Note: † p < 0.001; ** p < 0.01; * p < 0.05.
Sustainability 11 00370 g002
Table 1. Common Good Provision (CGP) scale (initial list of items). The questionnaire was originally developed in Italian. An English translation is provided in brackets.
Common Good Provision (CGP)
Se contribuisco al bene comune lo faccio soprattutto per…
[If I provide for the common good, I do so…]
CGP1…per contribuire a soddisfare le necessità di tutti
[…to provide for everyone’s needs]
CGP2…per garantire la sua accessibilità a tutti
[…to make it accessible to everyone]
CGP3…per non avere cittadini di serie A e di serie B
[…not to have first and second-class citizens]
CGP4…per aumentare i servizi e i comfort a disposizione
[…to increase services and amenities available]
CGP5…per aumentare sempre di più il benessere
[…to increase general wellbeing]
CGP6… per avere una serie di servizi che semplificano la vita
[…to have a number of services that make life easier]
CGP7…per garantire il suo accesso gratuito a tutti
[…to make it free for anyone to access]
CGP8… per garantire l’uguaglianza nella nostra società
[…to have an equal and just society]
CGP9…perchè altrimenti rischieremmo di perderlo
[…because we may otherwise risk losing it]
CGP10…per salvaguardare i beni che ci circondano
[…to safeguard the goods that surround us]
CGP11…anche per avere un ritorno personale
[…to get a personal return]
CGP12…perchè so che ne trarrò beneficio anche a livello personale
[…because I know I will also benefit on personal level]
CGP13…perchè so che ne trarrò vantaggio anch'io
[…because I know it will be advantageous to me]
CGP14… perché significa contribuire anche al mio benessere personale
[…because it will also provide for my personal wellbeing]
Table 2. Descriptive statistics for CGP items on total sample (N = 469).
ItemMSDMdAK
CGP16.381.806−0.700.63
CGP26.461.787−0.740.52
CGP36.242.066−0.59−0.05
CGP46.501.697−0.680.59
CGP56.361.706−0.570.66
CGP66.531.817−0.880.83
CGP76.001.926−0.46−0.09
CGP86.381.897−0.670.49
CGP96.461.827−0.730.49
CGP106.641.537−0.540.71
CGP114.732.245−0.11−0.89
CGP125.462.186−0.40−0.58
CGP135.582.126−0.51−0.25
CGP146.071.946−0.750.40
Answering scale from 1 = ‘strongly disagree’ to 9 = ‘strongly agree’.
Table 3. Inter-item correlations among CGP items (N = 469).
CGP1CGP2CGP3CGP4CGP5CGP6CGP7CGP8CGP9CGP10CGP11CGP12CGP13
CGP11.00
CGP20.76 1.00
CGP30.61 0.62 1.00
CGP40.39 0.41 0.36 1.00
CGP50.44 0.40 0.31 0.55 1.00
CGP60.40 0.40 0.36 0.62 0.49 1.00
CGP70.70 0.70 0.62 0.44 0.49 0.40 1.00
CGP80.64 0.67 0.70 0.32 0.40 0.38 0.63 1.00
CGP90.53 0.49 0.37 0.39 0.41 0.42 0.46 0.34 1.00
CGP100.47 0.44 0.28 0.42 0.45 0.34 0.36 0.36 0.54 1.00
CGP11−0.050.060.050.22 0.21 0.28 −0.02−0.010.070.051.00
CGP120.15 *0.13 *0.090.35 0.30 0.36 0.13 *0.100.20 **0.16 **0.57 1.00
CGP130.100.18 **0.080.38 0.26 0.38 0.17 **0.080.21 0.22 0.55 0.66 1.00
CGP140.31 0.30 0.26 0.54 0.44 0.47 0.32 0.29 0.46 0.41 0.35 0.57 0.53
Note: * p < 0.05; ** p < 0.01; † p < 0.001.
Table 4. Common Good Provision (CGP) scale (selected items and factors).
Common Good Provision (CGP)
Se contribuisco al bene comune lo faccio soprattutto per…
[If I provide for the common good, I do so…]
AccessibilityCGP1…per contribuire a soddisfare le necessità di tutti
[…to provide for everyone’s needs]
CGP2…per garantire la sua accessibilità a tutti
[…to make it accessible to everyone]
CGP3…per non avere cittadini di serie A e di serie B
[…not to have first and second-class citizens]
CGP7…per garantire il suo accesso gratuito a tutti
[…to make it free for anyone to access]
Personal GainCGP11…anche per avere un ritorno personale
[…to get a personal return]
CGP12…perchè so che ne trarrò beneficio anche a livello personale
[…because I know I will also benefit on personal level]
CGP13…perchè so che ne trarrò vantaggio anch'io
[…because I know it will be advantageous to me]
Table 5. Subsample I (n = 276): Descriptives, Cronbach’s alphas, and inter-scale correlation of CGP scale (Accessibility and Personal gain).
ScaleMSDMdSkewnessKurtosisAlphaAccessibility
Accessibility6.271.646.25−0.570.690.891.00
Personal Gain5.261.865.33−0.32−0.330.810.12 *
Note: * p = 0.05.
Table 6. CGP scale (Accessibility and Personal Gain) and related measures.
CGPCES attCES behCO
Accessibility0.57 0.33 0.40
Personal Gain0.010.00−0.04
Note: † p < 0.001.

