1. Introduction
With China’s amazing economic growth and social development, environmental problems, especially air pollution, have been increasing, creating greater concerns for the Chinese people and raising anxiety about the dangers to public health. According to China’s Ministry of Environmental Protection (MEP), only 20% of 338 cities in China reached the national air quality standard enacted in 2016 (Ministry of Environmental Protection of China, 2017) [
1]. Against this background, more and more countermeasures and requirements to deal with air pollution have been proposed in meetings of the National People’s Congress of China (NPC) and Chinese People’s Political Consultative Conference (CPPCC) in recent years. For example, the new 13th Five-Year Plan sets ambitious targets for air quality progress, requiring hundreds of cities to meet the standard of “good” air quality 80% of the time [
2]. The plan also steps up the reduction targets for the two major air pollutants specified in previous plans: Sulfur dioxide and nitrogen oxides (SO
2 and NO
x) (Communist Party of China, 2016; State Council of China, 2016) [
3,
4].
The formation and evolution of haze is very complicated, involving seasonal and geographical factors, growing energy consumption, and imbalanced industrial structure, etc. (Chen et al., 2003; Du et al., 2011; Kang et al., 2012; Wu et al., 2006) [
5,
6,
7,
8,
9]. For instance, regional haze forms frequently during cold winters and in the spring because of increased use of heat, traffic, and industrial emissions with the stable synoptic conditions (Wang et al., 2006; Wang et al., 2016) [
9,
10]. Because controlling seasonal and geographical factors is difficult, governments must adopt air pollution prevention policies, measures, and regulations to reduce the other factors contributing to haze. A 10-year observation study in Xi’an found that the PM
2.5-bound nickel (Ni) concentration increased from 2004 to 2008, but then decreased due to reduced coal consumption, energy structure reconstruction, tighter emission rules, and improvements to industrial and motor vehicle waste control techniques. This provides scientific support for the government’s strict strategies and guidelines to reduce the incidence of regional haze in China (Xu et al., 2017) [
11]. In addition, some other researches on chemical components (including organic carbon, elemental carbon, and heavy metals) in PM
2.5 (Xu, et al., 2012, 2017) [
12,
13] also examined that PM
2.5 concentrations in Xi’an decreased in recent years, as well as Pb, As, and other more elements, which also reflects the results of policy implementation and the efficient control from the local government.
Over the past decade, an impressive array of laws and regulations meant to prevent and control air pollution has been adopted by governments from the central to the local level in China. However, a “policy implementation gap”—the divergence between the central government’s national environmental policies and the actual outcomes at the local levels (Kostka and Hobbs, 2013) [
14]—is common in many national environmental policy systems (Knill and Lenschow, 2000; Scheberle, 2004) [
15,
16]. As local government in China often plays the decisive role in policy implementation, it is essential to understand how policy enforcement translates air quality targets into actual outcomes at the local level; how the general policy set by the upper level government is decomposed into specific tasks and enforced by street-level bureaucrats; and how the dynamics amongst the local government agencies involved with their different degrees of authority are managed.
In this article, we examine an enforcement network and address three research questions. What are the characteristics of the campaign-style enforcement network? How do these characteristics influence the network actors’ roles and behavior? Additionally, what is the relationship between the campaign-style enforcement network and the regular bureaucratic system? The rest of the article is organized as follows: We first review the development of China’s air quality control policy and administrative system of environment protection. Using the existing literature, we then compare the environmental regulatory enforcement and campaign-style enforcement to develop the proposition of this study. After introducing the methodology and data, we present the study’s evidence. The paper concludes with a discussion of the research and practical implications.
3. Materials and Methods
In this study, we chose Xi’an as the case city because it has suffered from severe haze and was designated one of the heaviest-haze areas by the Chinese government (Ministry of Environmental Protection of China, 2016) [
41]. Xi’an is the biggest city in Northwest China and has a population of over 8 million. It is located at the central part of the Guanzhong Basin, and its northern and southern areas are the Loess Plateau and the Qinling Mountains, respectively. As the city is surrounded by mountains, frequent temperature inversions, which mean that warmer air is held above cooler air, and suppressed convection prevents pollutants from migrating, which leads to an adverse influence on the local environment. It is also representative of the other Chinese urban cities facing a similar haze pollution threat and subject to central government policies to reduce PM
2.5 pollution. More importantly, Xi’an’s anti-air pollution policy implementation was a typical campaign-style enforcement case, the characteristics of which include a high degree of urgency, a temporary initiative, a tightly coordinated operation, and a clearly defined goal. In 2014, the Xi’an Environment Protection Bureau issued an instructive policy “Anti-Pollution and Anti-Haze Work Scheme of Xi’an (2014)” (Xi’an Environment Protection Bureau, 2014) [
42] and required all the related government departments in city, district, and county levels to follow the Scheme and take measures to fight air pollution. The first version of the Scheme was introduced in 2014 and was revised annually, reflecting changes to the measures taken in response to the results achieved each year. In the Scheme, the key anti-air pollution tasks and their corresponding departments are listed. There are three parts to the 2014 Scheme: Objective, Tasks and Measures, and Supporting Measures. For each task, one responsible or leading department and several related departments were listed, which provided sufficient information for further social network analysis. Because the Scheme became an annual action plan to instruct local government departments’ air pollution prevention work from 2014, it was revised annually according to the new situation and released in April 2015 and 2016 continuously. Compared with the 2014 Scheme, the Scheme in 2015 and 2016 contained more details and were composed of four parts. The second part of Tasks and Measures was split into two sections, Major Tasks as well as Implementation and Supervision. Because the main annual regional environmental protection performance indicators were decomposed into more specific task indicators at lower levels and announced in the Scheme, it became a useful tool for performance evaluation to guide the policy implementers’ behavior. Therefore, the Scheme reflects the practical government departments’ policy implementing behaviors on anti-air pollution to some extent.
To examine the details of the air pollution prevention actions enacted by the local government and the trend, a content analysis was performed of the government policies focusing on the “Anti-pollution and Anti-haze Work Scheme of Xi’an (2014, 2015)” (Xi’an Environment Protection Bureau, 2014; 2015) [
42,
43]. The main goal of content analysis in this study is to compare the tasks and the roles of government departments in 2014 and 2015. This also allows for an interpretation of the direction in which policy makers and implementers are taking the policy as it reflects the evolution of their priorities over time. As there are no significant differences between the 2015 and 2016 Schemes, we selected the 2014 and 2015 Schemes as the main documents for content analysis. In the coding process, we first developed a list of major themes of research, which included the task, performance indicators, time limit, responsible leading departments, and involved departments. Therefore, an initial list of major keywords was sorted iteratively and regrouped into coherent categories. To ensure that all information was properly allocated, each document was examined by two coders and a two-step procedure was used. First, the Schemes were allocated independently by both coders into themes based on a detailed examination of the documents. If there was any disagreement, the two coders would resolve it through discussion. Independent policy study experts at the academic institutions then reviewed this initial list. After several rounds of discussion with these experts, a final list of major tasks and departments was obtained.
Yet, as is commonly suggested, a limited content analysis of an observed trend may not be an accurate reflection of reality. To obtain a comprehensive picture of the enforcement regime, we conducted follow-up, in-depth interviews with frontline enforcement officials in 2015. Altogether, 22 enforcement official interviewees from three District level EPBs of Xi’an accepted the semi-structured interviews and each interview lasted 45–60 min. The interviewees were asked to describe their practical work compared with the Scheme and identify the factors that facilitated or impeded the Scheme enforcement. Their description helped us to gain a deeper insight into the policy implementing process and check if the findings from the content analysis were compatible with the actual behavior.
In the anti-air pollution campaign enforcement in Xi’an, there were quite a lot of government departments participating in the Scheme implementation and each task was appointed a leading department and involving departments. Because all of the involving departments were in the enforcement network, we regarded them as homogenous; they all served one common goal, which was to improve the air quality, regardless of their official duty and scope.
The network contains a complex structure, a set of actors, sets of dynamic ties, and other social interactions between actors. To understand this network, it is vital to make successful implementation and reach the policy goals. Therefore, Social Network Analysis (SNA) was performed to assess the relationships among the departments that responded to the anti-air pollution works. UCINET 6.2 is a comprehensive software program for the analysis of social networks. The program contains several network analytic routines (e.g., centrality measures, dyadic cohesion measures), and general statistical and multivariate analysis tools, such as multidimensional scaling, correspondence analysis, factor analysis, cluster analysis, and multiple regression (Borgatti et al., 2007) [
44]. For data processing convenience, we recorded the relationship of tasks and corresponding departments in the matrix. The relationship was marked “0” if the department was not involved in the task, or marked “1” if they were involved in the tasks. The leading department of one or more tasks was marked “2”. The matrix data was imported into Ucinet6.2 software and the 2-mode figures were drawn. To distinguish the different roles of the government units in the whole network, we conducted a centrality analysis, which identifies those actors that are the most important in influencing the performance of the entire network, as they have the most ties with other tasks and sectors (Comfort and Haase, 2006; Wasserman and Faust, 1994) [
45,
46]. Centrality measures reveal interesting characteristics about a network: Degree centrality, closeness centrality, and betweenness centrality (Comfort and Haase, 2006; Kapucu, 2005) [
45,
47]. The detailed calculation methods and formulas have been described well in previous research (Wasserman et al., 1994; pp. 179–192) [
46], which have been widely used in research of social network analysis. Degree centrality measures the number of connections each agency has with others. Closeness centrality measures how close an actor is to others in terms of its shortest paths to others. It is useful for analyzing the flow of communication, on the premise that the shorter the paths between an actor and other actors, the quicker the communication will be (Comfort and Haase, 2006) [
45]. Betweenness centrality, by contrast, reveals the positional power of actors. An actor has betweenness power if it provides a communication linkage between two other actors or two subgroups in such a manner that its nonexistence might cause a serious communication breakdown for those two actors or subgroups (Comfort and Haase, 2006; Kapucu, 2006) [
45,
48]. The data was processed by the 2-mode centrality function in Ucinet 6.2 software.
4. Results
4.1. Anti-Air Pollution Tasks Analysis
The Scheme listed the anti-air pollution key tasks and each task was decomposed into several sub-tasks, which were to be implemented with clear requirements by each responsible department. We processed manually the two policy documents to count the number of tasks and sub-tasks, as well as the number of sub-tasks containing quantitative targets and time limitations. In the process of counting, we made a judgement by the following criterion. If terms appear in the description, such as “decreased/increased by” or “at least N times every day”, it means that the sub-task contains quantitative targets. If terms appear in the description, such as “be finished within this year/certain month” or “during certain month”, it means that the sub-task contains time limitations. During coding, we finished the record of the relationship between sectors and sub-tasks in the way shown above. As listed in
Table 1, there were six common key tasks in 2014 and 2015, which includes both long-term measures, such as industrial structure adjustment and scientific research, etc., and short-term measures, such as pollutant control. In the 2014 Scheme, 15 key tasks were split into 69 sub-tasks with coal pollutant control, vehicle exhaust control, and dust pollution control as the first three key tasks with the most sub-tasks. Most of these sub-tasks were also given quantitative targets and time deadlines. Although the first three key tasks in 2015 were the same as in 2014, the number of sub-tasks and quantitative targets was greater in 2015.
Meanwhile, among the 71 subtasks in 2015, 70 had set time deadlines, which emphasized the efficiency and effectiveness of the policy implementation. Comparing the different tasks in the two years, the 2015 tasks were more pragmatic and specific. For example, ‘ecological improvement’ was a key task with three sub-tasks in the 2014 Scheme, the definition of ‘ecological improvement’ being broad and general. Consequently, there were few indicators to determine if this task was enforced effectively. However, the tasks in 2015, such as “Rural air pollution prevention”, “Biomass burning control”, “Catering oil smoke control”, and “Fireworks and crackers pollutant control”, were all specific tasks easily measured. In addition, despite the many stakeholders involved in anti-air pollution activity, only enterprise responsibility was emphasized in the key tasks in 2014. By contrast, in 2015, ‘crisis response and coordination’ was set as one of the key tasks strengthening the importance of mutual understanding and connectivity among different agencies responding to the air crisis.
4.2. Centrality Analysis
A total of 15 key tasks and 45 organizations were identified in the content analysis of the 2014 Scheme, while 13 key tasks and 40 organizations were included in the 2015 Scheme. Each organization referred to one government department, which could be responsible for many different tasks.
Table A1 in the (
Appendix A) section presents the measures of degree centrality, closeness centrality, and betweenness centrality in the 2014 and 2015 Anti-air Pollution Scheme Enforcement networks. The main departments involved in the Scheme enforcement can be categorized into three types according to the change of centrality.
The strengthened departments refer to those who have improved on centrality from 2014 to 2015, which include the Developing Zone Administrative Commission (DZAC), District and County Governments (DCG), and the Construction Commission (CC). Among these departments, the closeness centrality is generally high, but the betweenness centrality is low. This result suggests that these departments usually have higher authority to control resources, but they play a lesser role in the overall network. Particular examples are the county and district governments who have enhanced centrality and are located in the center of the network. They had more direct ties with other actors in 2015, which suggests more effective communication. The increased betweenness centrality in 2015 also demonstrates the more mediating role played by the street-level government in task enforcement.
A second group of departments experienced decreased centrality from 2014 to 2015, including the Environment Protection Bureau (EPB), Industrial Information Commission (IIC), Commercial Bureau (CB), and Bureau of Parks and Woods (BPW). The decline of degree centrality indicates these departments moved from the center of the network to a border position. Although these departments’ centrality decreased, the closeness centrality of most departments was still high. This means these departments still have considerable influence over the entire network’s resources. For example, the closeness centrality of both EPB and BPW is more than 0.7. The closeness centrality of the Weather Bureau also improved, which indicates that scientific weather information collection and prediction was given more emphasis in dealing with the air pollution problem. On the other hand, the EPB lost its core position and its coordination function was weakened as its betweenness centrality dropped from 0.216 to 0.065 in 2015. The EPB focused on coordinating some key departments, but not all the departments as before; its betweenness centrality, however, still stands in third place overall. The clear trend shows enforcement power was shifted down to the lower level government departments who had more resources to mobilize and coordinate the stakeholders at the street level. The centrality of a third group of organizations, stabilized departments, did not change dramatically over those two years. The Development and Reform Commission (DRC), Public Security Bureau (PSB), and Financial Bureau (FB) had a degree centrality of more than 0.2, but less than 0.5, which indicates these departments were located in the middle region of the network. The core function of DRC and FB are related to economic development, while the PSB is mainly in charge of the stability of society. Their positioning between the center and border region of the network indicates these departments are the pillars to guarantee sufficient financial resources and a stable society environment for the current policy implementation. The Office of Pollution Control and Haze Reduction (OPCHR) has increased the degree and closeness centrality, which means they play more roles in the Scheme enforcement. However, given the original purpose of setting up this organization, their coordinative function should be improved.
4.3. Organizational Network Analysis
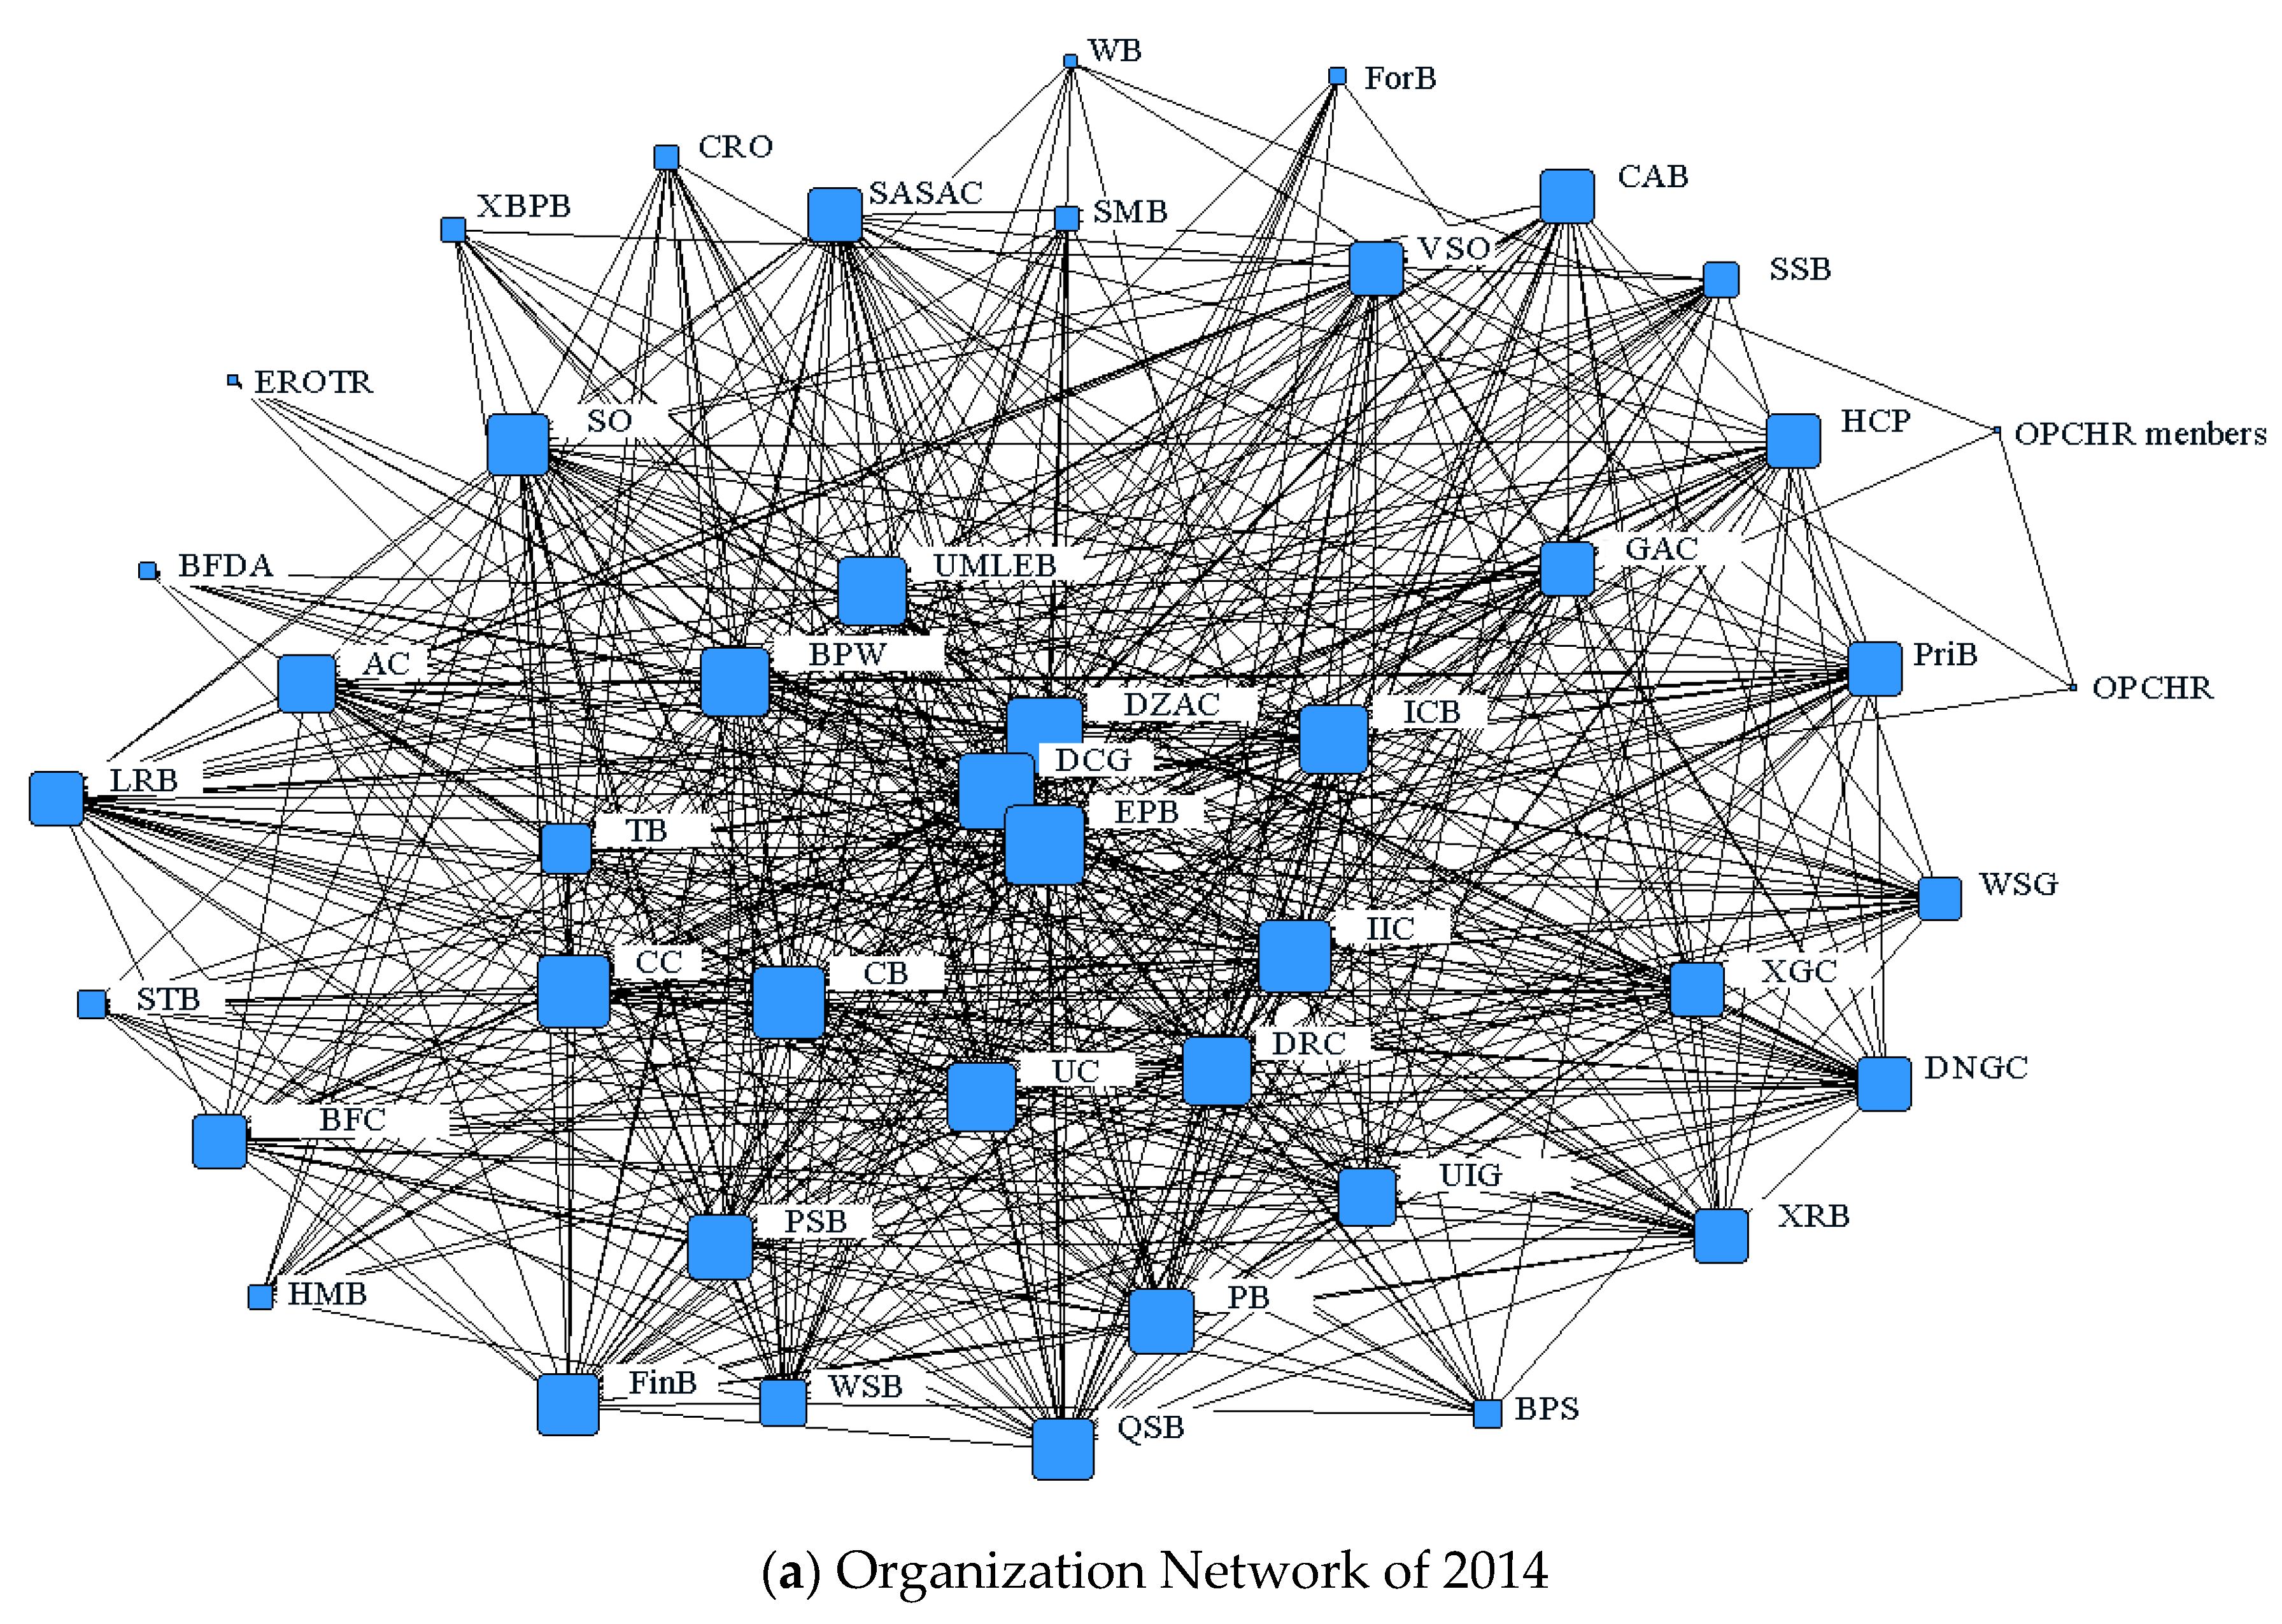
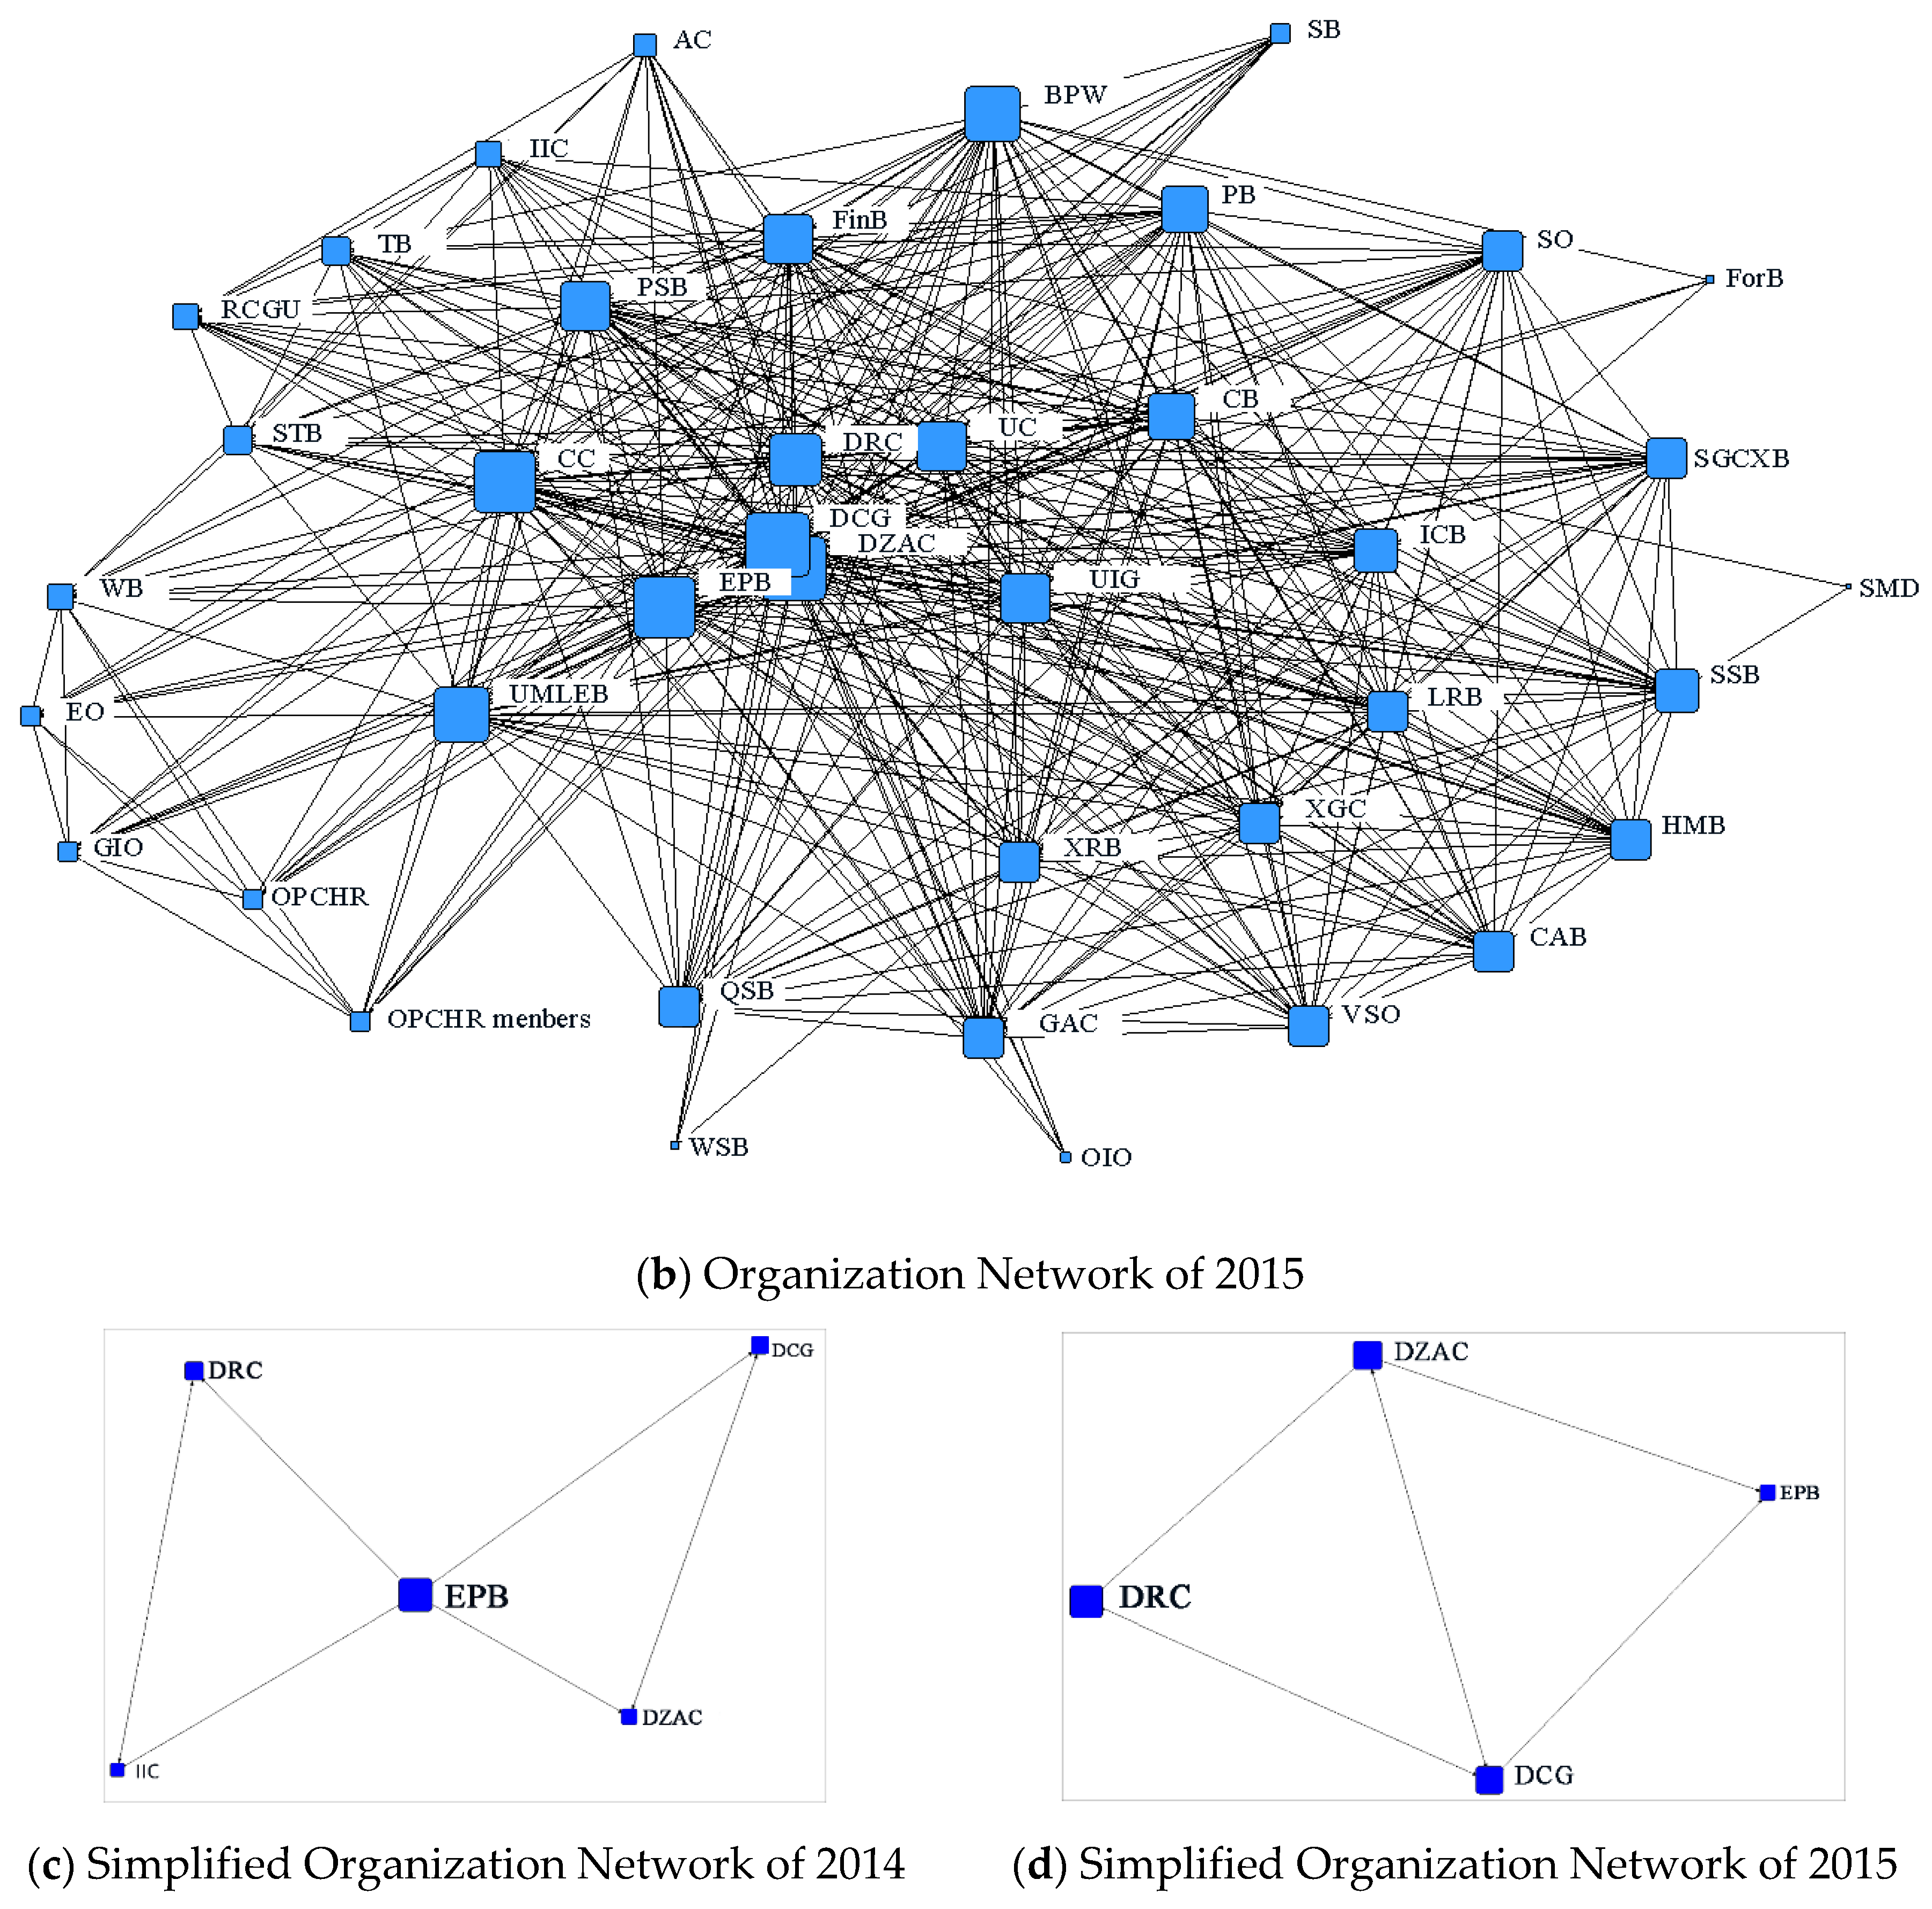
The organizational networks consist of sectors in the formation of 1-mode networks, which are transformed from the sector-task networks by the Bipartite function of the Ucinet6.2 software. The overall organizational networks in 2014 and 2015 were drawn by Ucinet6.2 Netdraw, which are displayed in
Figure 1a,b, respectively, identifying actors with reference to their location and interaction with each other. The size of the node indicates an actor’s betweenness centrality. The result is very clear: The network in 2014 involved more actors and the relationships among them were more complicated than in 2015. The density of the network suggests too much red tape, high transaction costs, and task pressures, which might prevent the useful flow of information and orderly implementation. In the 2015 network, the simpler, but clearer relationships could be helpful, allocating more specific and achievable objectives to the various actors.
Figure 1c,d simplify the two networks for 2014 and 2015 by keeping nodes with more than 13 ties and cutting off the more trivial nodes.
Figure 1c shows a butterfly shape in 2014 composed of five departments. EPB is located in the center, undertaking abundant roles and exercising authorities beyond its core function, including over-riding the economic departments. In 2015,
Figure 1d presents a rectangular model, which reflects the roles of four key departments in the anti-air pollution policy implementation. EPB and DRC follow their own core functions and help to balance the duel objects of economic development and environmental protection.
Table A2 in the (
Appendix A) section also shows the organization network attributes in these two years. Comparing the two years’ networks, the scope and the density of the 2015 network were less than those of the 2014 network. The decrease indicates that fewer organizations in 2015 were engaged in policy implementation. Another reason for the scope decline is that more documents were provided in 2015 in addition to the main policy directions, providing more detailed guidelines and procedures for action. The degree and closeness centralities in the 2015 network are 0.4413 and 0.552, which are higher than in 2014. It indicates the relationships among the departments were tightened and more concentrated around a few authoritative departments, which had more power to mobilize resources. The lower betweenness centrality and node distance in the 2015 network also demonstrates that communications among departments in 2015 were more direct, shorter, and less mediated. The increased cohesion index of 0.722 in 2015 reflects the greater emphasis on coordination amongst key sectors. All the above information suggests the core actors in the network structure for the Anti-air Pollution Scheme implementation became those with more authority and resources, which further facilitated cooperation among other actors.
5. Discussion
Facing a considerable workload with demanding specifications from the upper government as well as complaints from the public, local governments often take immediate measures, such as an enforcement campaign, to meet the various requirements. However, an enforcement network structure is not as static as a traditional bureaucratic system; it will change constantly to pursue more enforcement efficiency and effectiveness. A substantial body of literature shows that the implementation process of a campaign is characterized by external factors, such as integration of political interventions, administrative reform, economic incentives, and cultural norms to improve environmental compliance within a short period of time. Relatively little scholarly attention has been paid to the internal factors of the campaign-style enforcement itself. Our study makes an initial effort to explore the enforcement process from the network perspective, revealing how goal-setting and enforcement members’ attributes influence the actors’ roles to achieve the policy targets.
5.1. Goal-Setting in Campaign-Style Enforcement
The first finding of the study is that clear goal-setting is critical for the policy enforcement. It helps eliminate the invalid communications and behaviors of network actors. If officials perceive insufficient goal clarity, they could undermine collaboration, promote isolation, increase nonconstructive political behavior, or encourage refuge in bureaucratic rules and guidance from colleagues or other referent groups (Durant, 1984; Hawkins, 1984; Tang, et al., 2003) [
49,
50,
51]. As campaigns are usually driven by a need to cope with urgent situations rather than a need to figure out a systematic solution, the selected goals are usually the ones receiving the highest attention in a certain period and are not as systematic as the routine ones (Liu, 2014) [
28]. To accomplish the goals and subtasks more efficiently, the communication among actors must be more direct and simpler than the hierarchy system. From the content analysis of the two year’s Anti-air Pollution Schemes of Xi’an, the organizations involved in the network simplified their arrangements and ensured the tasks were more focused and straightforward. Many departments had fewer, but more specific tasks in 2015, which were closer to their core functions. Therefore, further clarification and separation of responsibilities and goals, from the national to the local level and among agencies at the same level, could yield more impressive results.
5.2. Authority and Capability to Mobilize the Resources
Our second finding has been to elucidate the practice that an effective policy enforcement network must have an authoritative actor to mobilize resources from various administrative agencies in a more coordinated and concerted manner. Although some scholars assume network members are equal because network research treats authority as a shared commodity (Brass et al., 2004) [
52], it can simply mean that authority is dispersed enough so that multiple actors have enough autonomy to disrupt coordination if they wish to (Moynihan, 2009) [
35]. Compared with regulatory policy implementation, the advantage of campaign-style enforcement is the ability to resolve the problem of “fragmented authoritarianism” and the weak enforcement power of environmental agencies caused by the dual command authority structure (Lieberthal and Oksenberg 1988; Marquis, et al., 2011) [
53,
54].
In this study, the roles of different departments were either strengthened or weakened mainly according to their authority. The follow-up interviews from the frontline EPB employees at different levels were particularly eye-opening on this point. One interviewee, a city level EPB employee, described how their tasks and responsibilities changed over those two years. He complained about the burdensome tasks set out in 2014. He explained that this may have been because it was the first year’s attempt in making the Scheme and the upper level government had heavy expectations. Although the city EPB was set up as the core of the overall anti-air pollution actions, it lacked sufficient administrative authority to mobilize the other government departments. It still needed help from the other powerful department, such as Development and Reform Commission (DRC), who managed the planning of local economic development and modified the local industrial structure. Thus, the role of DRC was raised so it was the same level as EPB in 2015.
Street-level governments are usually direct and responsive to policy implementation. This study indicates that when delegating power to the lower governments, specifically the district and county governments, an air quality target could be approached by reducing pollutant emissions and monitoring the clean energy usage more accurately. According to interviews with district EPB employees, they admitted that as the street bureaucracy, DCG and DZAC are dealing with all the routine tasks of policy implementation. The key departments at the district and township level play important roles not only in instruction and distributing resources, but also in assessing and levying fines on polluting organizations. As evidenced by the network analysis results, the organization network became flatter between 2014 and 2015, which suggests that direct communication and coordination among departments saves transaction costs and contributes to effective implementation. The degree and closeness centralization of the 2015 organization network were greater than in 2014. Therefore, efforts to improve communications and strengthening cooperation among street level agencies should be continued. With the comprehensive environmental network developed to improve cross-sector coordination, more financial and personnel support, as well as skills training for field regulators, should be enhanced.
5.3. The Relationship between Campaign-Style Enforcement and Regulatory Enforcement
Comparing the simplified organization network in these two years, we can partially recognize the transforming trend of the campaign-style enforcement network. Campaign-style enforcement is an essential complement to regulatory implementation in China and many effective campaign-style practices have been institutionalized as routine administrative measures to improve policy implementation (Liu, et al., 2015). In this case, although the role of EPB was promoted as the core of the whole network in 2014, it was changed after one year’s practice and gave way to other more authoritative members, such as DRC, who also had a higher position in the traditional hierarchy system. Across the country, due to the double administration from “horizontal” and “vertical” leaders, the local EPB has fragmented authority and lacks the capacity and tools to coordinate with other departments. The coordination among departments in the 2015 network, with dual central roles in the network for the EPB and DRC, had a better effect than the 2014 network with EPB as the single core. Over the past decade, economic growth has been constantly reinforced by leaders of both the central and local government, which made a large proportion of the field regulators believe economic growth had priority over environmental protection (Chan et al., 1995) [
37]. As the key department to manage micro-economic development, DRC has more authority than EPB to mobilize the other departments at the same level. In the areas related to environmental protection, DRC is responsible for coordinating the policies of land use, exploitation, and protection; participating in the development of plans for balanced use of water resources and environmental protection, etc.
Previous literature has pointed out that institutional improvement is usually based on cumulative campaign efforts over time (Biddulph, et al., 2012; Zhou, 2012; Ni, et al., 2014; Van Rooij, 2006) [
30,
34,
40,
55]. Based on the practical circumstances, it is essential to steadily facilitate the reform of the vertical management of environmental monitoring, inspection, and enforcement by environmental protection branches below the provincial level. Only with this reform can the coordinating function of EPB be enhanced. EPBs’ institutional capacity, including staffing levels, should be significantly increased to bring it more into line with comparably powerful agencies (Chen, 2016) [
55]. As an environmental official said, after these two years of practice, the anti-air pollution policy would contain more strict and specific measures in the following years, which undoubtedly improved their policy implementing capability and powers.
Only through innovations in the institutional, legislative, and development models can China overcome current problems and achieve sustainability into the future. In this regard, implementation of vertical management in the future depends on three considerations. First, a “Top Design” strategy is the most important way to set clear goals first before integrating environmental protection reform, and a robust evaluation system and regional development model must be carefully designed. Second, centralizing the data management system can be an important entry point for refining the function and responsibility of environmental protection organizations at different levels—from cities and districts to counties and townships. Third, a comprehensive environmental governance network, combined with more powerful motivation for public participation, should also be established. Greater policy and financial support can help to encourage engagement from government units, industry, Non-Governmental Organizations (NGOs), as well as other volunteers to contribute more to environmental protection. Following from this, publicly-accessible information platforms should be created to provide information, in order to promote public participation in policy enforcement. Governance should, therefore, be pushed to be more standardized, normalized, and legalized
6. Conclusions
This article focused on how a local government used campaign-style enforcement actions to follow central government directives and adjust its enforcement network in air pollution governance. Our interest is in how the different departments involved in the policy enforcement network interacted and their roles changed over time. Within the context of serious air pollution in China, and specifically based on the two years’ Anti-Air Pollution Scheme in Xi’an city, this paper compared and explained the tasks, structure, centrality, and interdependent network relationships of the policy enforcement departments in 2014 and 2015. The main contribution of this study is the identification of the key factors that influenced the campaign-style enforcement network and the relationship between the campaign enforcement network and the existing regulatory hierarchy system. As explained in this paper, social network analysis tools can be utilized in the measurement of the collaboration as a factor for reaching the goal of the network and its performance (Kapucu, N. and Demiroz, F., 2011) [
56]. This analysis could be used by government officials to identify successful network players and reshape future plans in accordance with the network capabilities of local government departments. The factors that could fill the implementation gap also include clearer and specific tasks, simplified and flattened network structures, decentralizing authority and responsibility to the lowest level departments, and harmonious coordination among departments with the most powerful leading actors. We believe that this case study serves as a good starting point for understanding the process of local government policy implementation and the ongoing reform of China’s environmental management system. However, it is unclear whether this positive trend can be sustained. Looking forward, the city faces new challenges to meeting its excellent air quality target for the 13th FYP period. New policy measures may be required to accommodate changes in its demands.
This study has several limitations, the most important of which is the probable bias in terms of data, because we only studied one city and only for a two year period. Future research could adopt a longitudinal method to focus more precisely on the interplay between campaign-style enforcement and routine enforcement. Second, the study’s results were mainly drawn from content analysis and interviews, which should be further verified by large-scale practical evidence. Therefore, future research could be carried out to provide insight on deeper transformation in terms of the perception of stakeholders’ roles. This might provide a more comprehensive understanding of the meaning and goals of environmental governance.


