Article

Impact of Land Use and Runoff on Stream Quality

1
VCS Denmark, DK-5000 Odense, Denmark
2
Department of Biology, University of Southern Denmark, DK-5230 Odense, Denmark
3
Niras, Aarhus C, DK-8000 Aarhus, Denmark
4
Envidan, DK-8210 Aarhus, Denmark
*
Author to whom correspondence should be addressed.
Sustainability 2019, 11(19), 5479; https://doi.org/10.3390/su11195479
Submission received: 28 August 2019 / Revised: 30 September 2019 / Accepted: 1 October 2019 / Published: 3 October 2019
(This article belongs to the Special Issue Climate Adaptation from an Environmental Perspective)

Abstract

:
Climate changes, intensive agricultural production, and expanding urban areas make the study of runoff and its possible impact on stream quality increasingly important. In this study, we examined large datasets concerning catchment type, stream quality, and invertebrate composition in a comprehensive geographic information system study. The aim was to examine correlations between land use type and quality of the receiving waters to detect possible differences in anthropogenic impacts. The studied area covered 937 km2, and the dataset included 1672 stretches of streams and data from 468 fauna sampling stations. Runoff from agricultural areas more negatively influenced the stream quality than runoff from urban areas. Considering urban catchments, the areas with separate sewer systems generally influenced the stream quality less than catchments with combined sewer systems. In conclusion, the catchment of any specific stream must contain an area with a minimum of 20–30% without agriculture or urban areas to obtain good ecological status; when focusing only on the riparian zone (10 m on each side of the stream), a minimum of 40–55% is needed to create a good ecological status. Therefore, management focus on the entire catchment is important and separate sewers should be preferred rather than combined sewers.

1. Introduction

Nutrient enrichment of streams and other watercourses is a major environmental challenge. Nutrients of primary environmental concern are nitrogen and phosphorus, which are derived from either point sources or diffuse sources like stormwater and agricultural runoff [1].
Several studies have demonstrated that stormwater containing particles, organic matter, hazardous substances, nutrients, salts, and heavy metals [2] may affect receiving streams. These impacts are (1) physical [3,4], due to higher hydraulic pressure, sediment erosion, and withdrawal of animals and plants; (2) chemical [5,6], due to higher concentrations of nutrients and xenobiotics; and (3) biological [7,8], e.g., due to domination by pollution-tolerant species. Impacts from stormwater and other factors affecting the streams in an urbanized watershed are referred to as the urban stream syndrome [9,10,11].
Several studies have documented water quality problems due to diffuse agricultural runoff. This runoff contains nutrients, pesticides, soil particles, and microbes [12,13]. The use of nutrients in agriculture results in increased crop yields but creates a risk of nutrient leakage to the surrounding environment, which can cause environmental problems. The processes of diffuse pollution include surface runoff and erosion, spray-drift, leaching, from sources such as atmospheric deposition and atmospheric transport of wind eroded soil.
The water quality is poor in European streams [14], even though the average nitrate and phosphorus concentrations have decreased from 2.8 to 2.1 mg N/L and from 0.133 to 0.055 mg P/L from 1992 to 2012. These decreases reflect both improvements in wastewater treatment and the introduction of measures to reduce nutrient runoff by national and European legislation [15]. In Denmark, point source discharge of nitrogen, phosphorus, and organic matter have been reduced by 75%, 85%, and 87%, respectively, since 1989 [16].
Stream quality is monitored using different methods around the world. In Canada, the watershed land use is studied using spatial scales and the Index of Biotic Integrity (IBI) [17]. In the U.S., the United States Geological Survey (USGS) method has been used since 1995. The annual mass flux is estimated, and source and sink areas for constituents are identified and used to estimate the loadings to receiving waters. Regression models are used to interpolate between observations [18]. In China, stream quality is monitored by analyzing water samples for physico-chemical variables. Statistical methods are used to determine water quality [19]. A method for routine monitoring of water quality has also been developed in Europe with respect to European Union legislation [20].
In Denmark, a national stream fauna index (Danish water fauna index (DFVI), based on invertebrates) is used to describe ecological quality [21,22]. The index ranges from one to seven, where seven represents the best ecological quality. The environmental requirement for good ecological condition is met at DVFI 5 or higher, according to the requirements of the European Water Framework Directive. A natural meandering stream will usually fall within these categories. Low DVFI values (1–4) are often found in streams with poor oxygen conditions and in straightened, dredged streams or those exposed to rough weed cutting. The Danish Physical Index (DFI) consolidates the biological results, by describing the physical quality of the watercourse. The index is based on parameters describing the physical condition in and around the stream [22]. Approximately 22,000 km of Danish streams have environmental objectives to obtain good ecological status and only 28% meet the requirement currently according to the Danish Water Management Plans 2015-2021.
Since nutrient discharge to surface water is driven by different types of land use, there is a need to determine the relationship between land use and chemical and ecological water quality. According to Kronvang et al. [23], a comparison of the annual median loss of total nitrogen and phosphorus to streams from agricultural and undisturbed catchments in Denmark showed a loss of nitrogen and phosphorus (weight ratio = 14:1 for total nitrogen and 4:1 for total phosphorus). Paul and Meyer [24] found that runoff from urbanized surfaces and industrial and municipal discharges result in increased loadings of nutrients, pesticides, metals, and other contaminants to streams, which can lead to declined invertebrates and fish richness in urban streams.
In this study, a large dataset of catchments and streams of varying ecological quality was examined using a geographic information system (GIS) to establish correlations between land use type and the quality of the receiving waters. The goal was to identify possible relationships between stream quality and land use in the catchment to improve tools for stream management. The examined catchment areas are representative for large parts of Europe. The parameters considered include topography, land use, water quality, and type of sewer outlet/overflow.

2. Materials and Methods

The study was conducted across the total area of the Municipality Aabenraa in the Southeastern part of Denmark (Figure 1A). The municipality is the ninth largest in Denmark (937 km2, 59,000 inhabitants). The area is characterized by varying soil composition. In west, soil is very sandy and in the east, it is moraine clay due to the Weichsel glaciation. Therefore, the studied streams were divided into east-flowing and west-flowing (Figure 1B). The east-flowing streams have steeper watercourses (0–25‰) than the west-flowing streams (0–2‰).
All available data regarding catchment types, streams quality, and stormwater handling in the studied area were collected [25,26]. The local utility company Arwos (Aabenraa, Denmark) provided all technical data and maps concerning urban stormwater outlets. Monitoring data from continuously measured stream stations included in the national monitoring program and regional data were also used. The following data were included in the GIS study: 1672 stream stretches, each with data from a specific stream station. Of these, 468 stations had fauna class measurements (DVFI). In total, 1387 DVFI measurements were included. Physical state (DFI) was available from 499 stations. The stream stations are evenly distributed in the area, represented as black dots in Figure 1B. GIS themes with information about stormwater outlet locations in the streams were divided into wastewater overflows from combined sewers (77) and outlets from separate sewers (319), and location of stormwater ponds (110) and water quality parameters were included [25,26]. GIS themes with information about catchment areas and land use (divided into “nature”, which covers moors, meadows, coastal meadows, commons, heaths, lakes, and streams; “forest”, which covers conifer trees and deciduous trees; “urban areas”; “freshwater”; and “agriculture”) as well as location of stormwater outlets and sewage catchment areas (622 stations) were constructed. Finally, scattered houses in the studied area (3837 properties) were also included in a theme.
All data were handled in the GIS program MapInfo 11.5 (Pitney Bowes, Stamford, CT, USA), and were tested for gaps and overlays. Buffer polygons were constructed, which enabled Structured Query Language (SQL) searches to find polygons in other GIS themes inside the buffer, after splitting the GIS theme of interest with the buffer polygons to include all the objects in the SQL search. The buffers enabled the identification and analysis of selected parts of the data and to compare the DVFI in the entire catchment (total) with the DVFI in the lowland area (50 m buffer on each side of the stream) and DVFI in the riparian zone (10 m buffer).
The catchment theme was divided into sub-catchments that contained at least one fauna class station. Smaller catchments close to the sea were not included due to lack of fauna class stations. This adjustment resulted in 192 catchments containing fauna class measurements. Next, SQL searches concerning correlations between two or more parameters were performed. The output was transferred to Sigmaplot 13.0 (Systat Software, San Jose, CA, USA) for statistical analyses. P < 0.05 was chosen as the level of significance and linear regressions were performed after testing for normal distribution.

3. Results

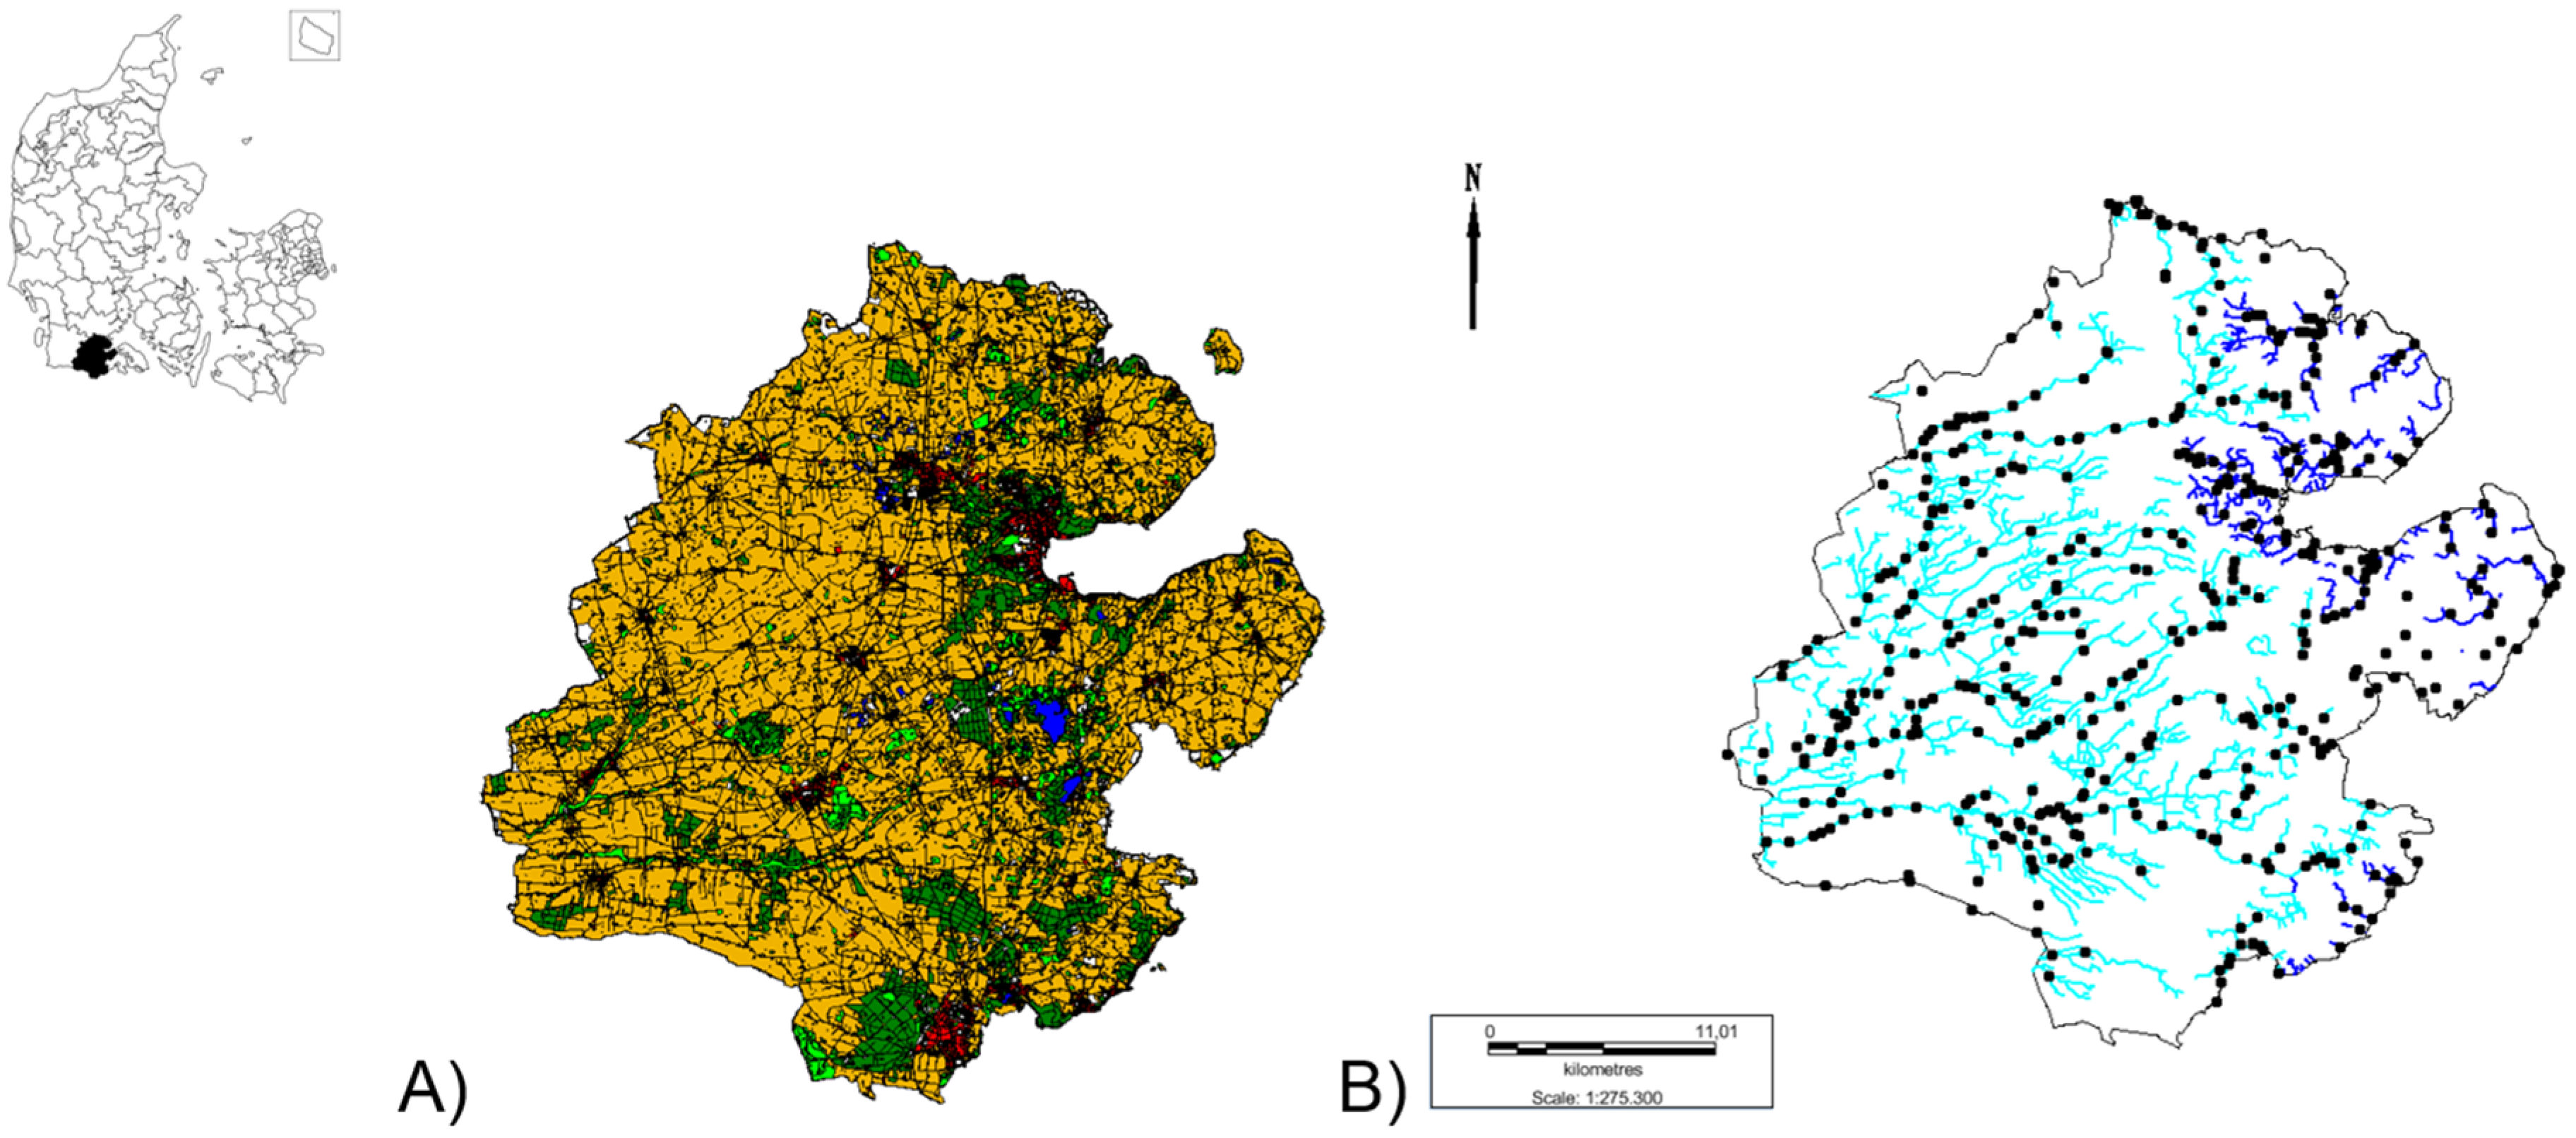
3.1. Land Use and Stream Characteristics

Stream quality depends on land use, quantity and quality of runoff, shape of the stream, topographical conditions, and soil composition in the catchments. The examined area consisted of 5% cities and 6% roads, whereas areas without agriculture and urban areas like lakes, forests, and nature areas covered 17%. Agriculture was the dominating land use, covering 72% of the total area (Figure 1A). This land use distribution is representative of Denmark (urban areas 14%, natural areas 24%, agriculture 62%) [27]. Agriculture was evenly distributed in the eastern and western parts of the studied area, while urban areas were mainly represented in the eastern part. The percentage of areas without agriculture and urban areas was higher in the eastern part, resulting in more streams with good ecological quality (32% natural areas in catchments to streams with DVFI 5–7 in the east compared with 23% in the west). Under the Weichsel Glaciation, 20% of the eastern part was covered by the ice cape, whereas most of the western area (80%) was affected by melting ice. This means that the soil in the east contains moraine clay, and sand in the west. The same area distribution applies to streams in the area (Figure 1B). A total of 1093 km streams are situated in the study area, of which 886 km are open streams and the remaining 207 km are piped. Almost half of the open streams (43.5%) are in good condition (DVFI 5–7). Most of the west-flowing streams fail to meet the environmental objective (60%), whereas only 33% of the east-flowing streams did not meet the goal of DVFI 5–7 (Figure 2).

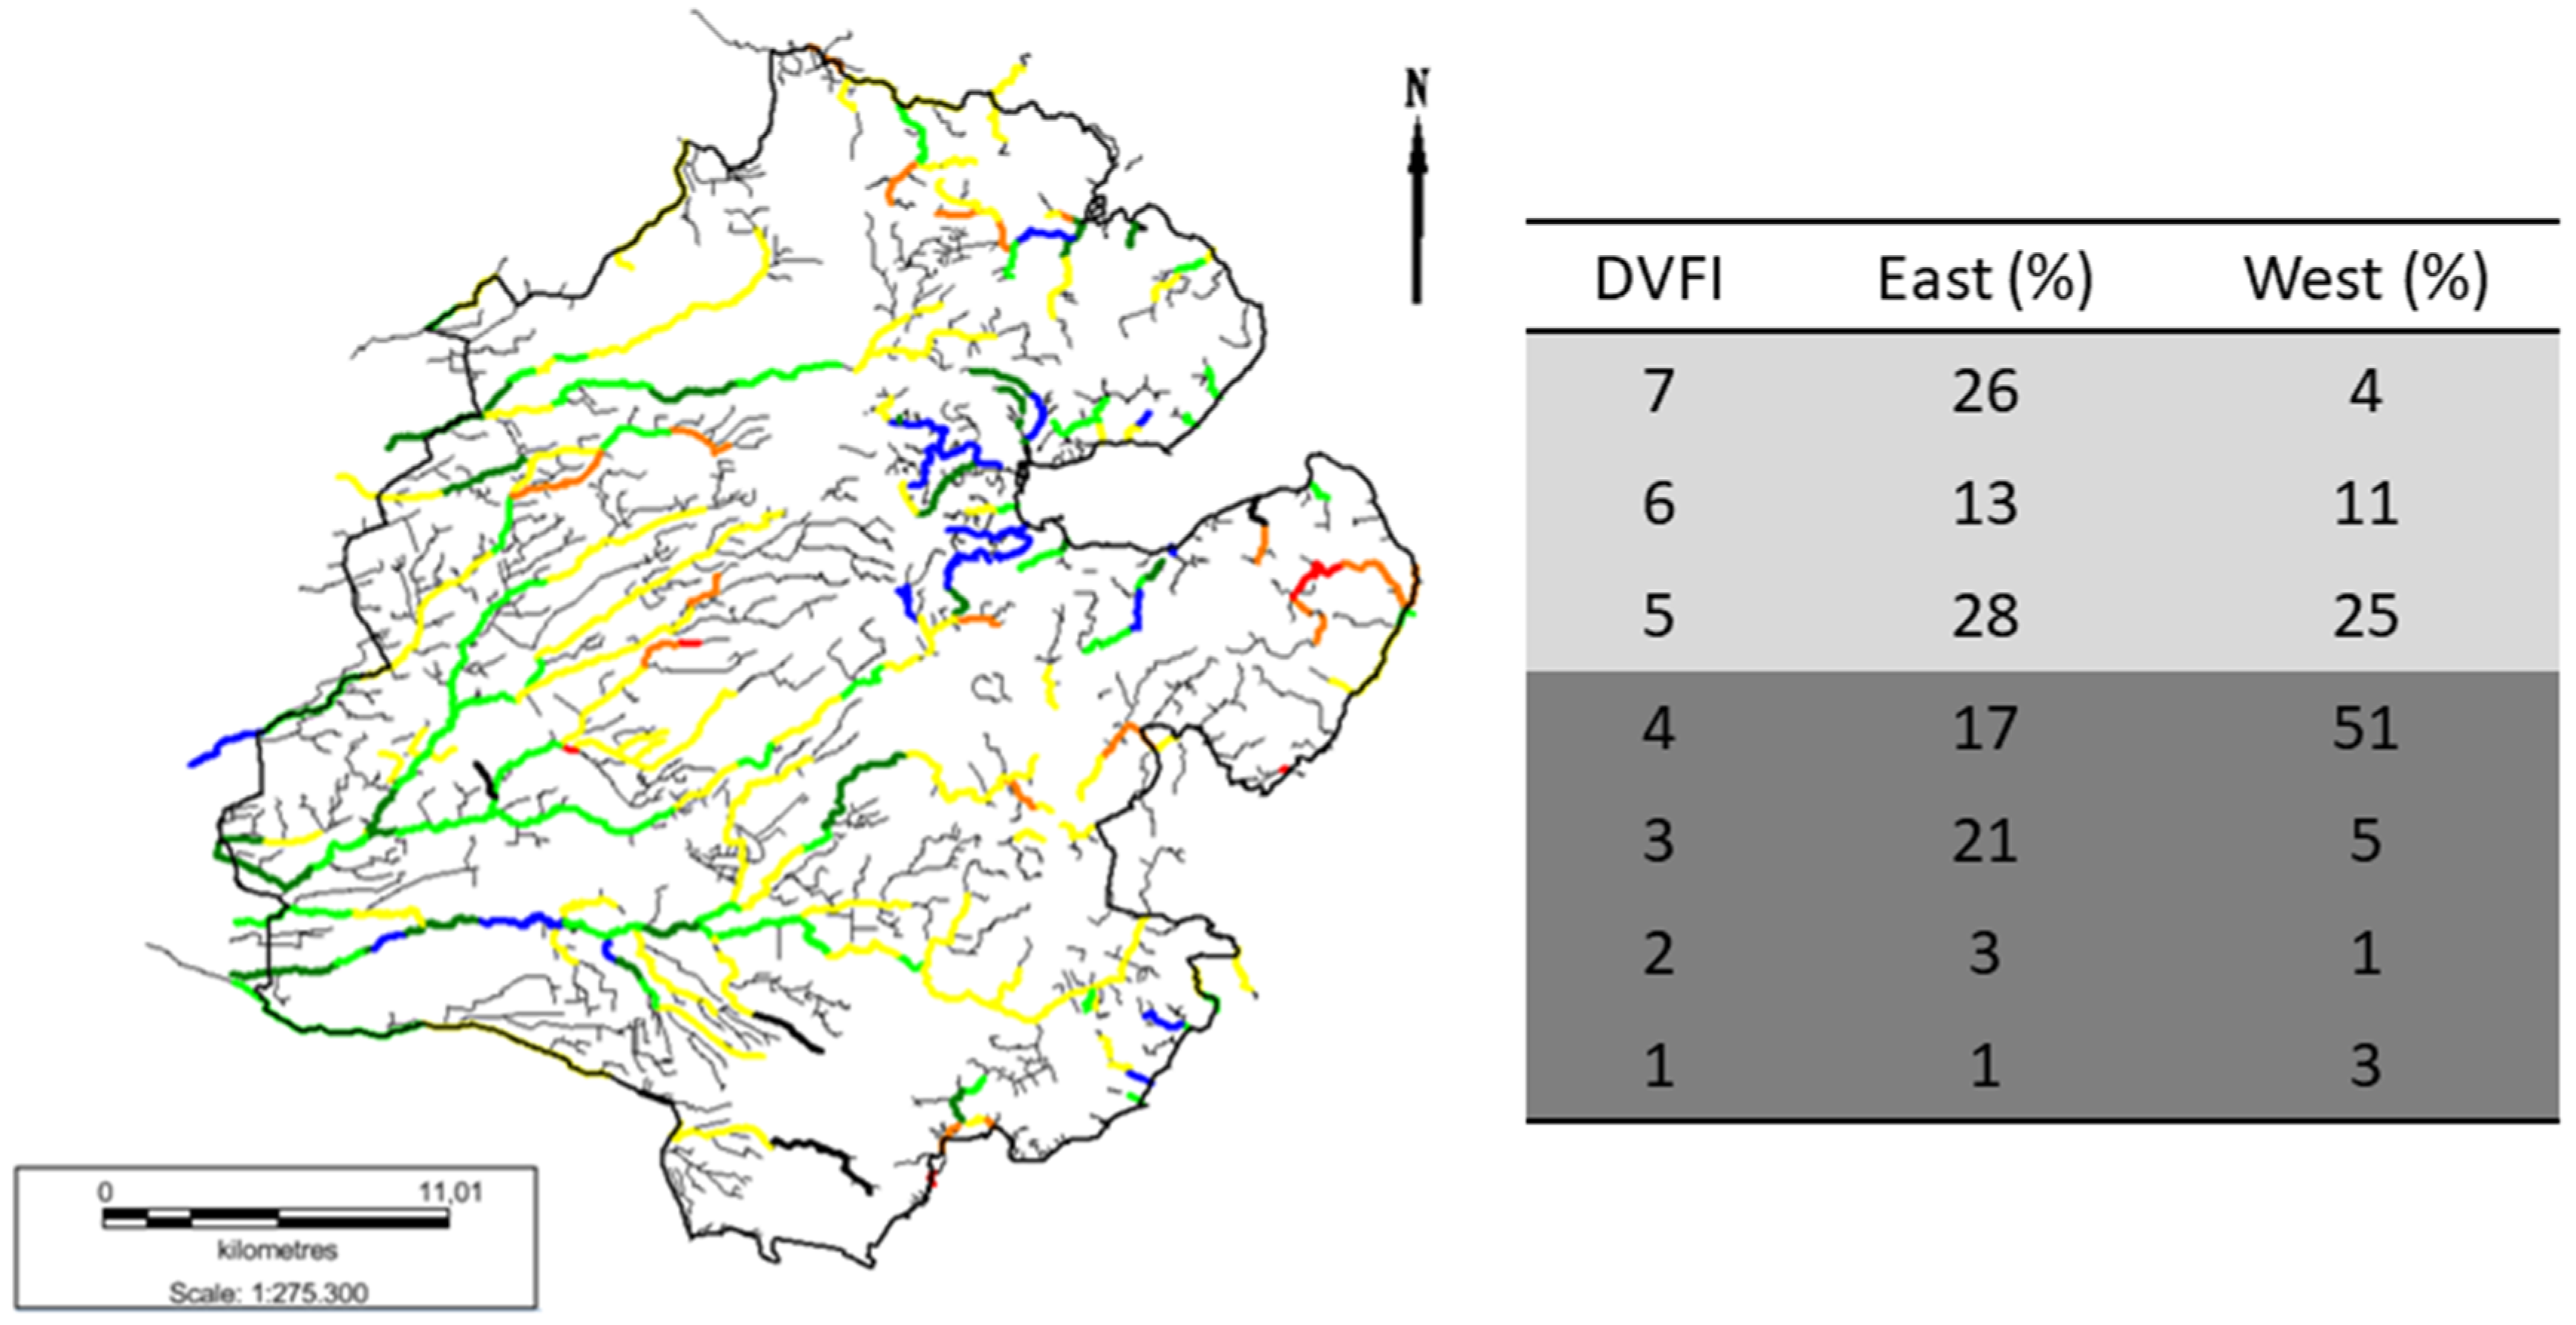
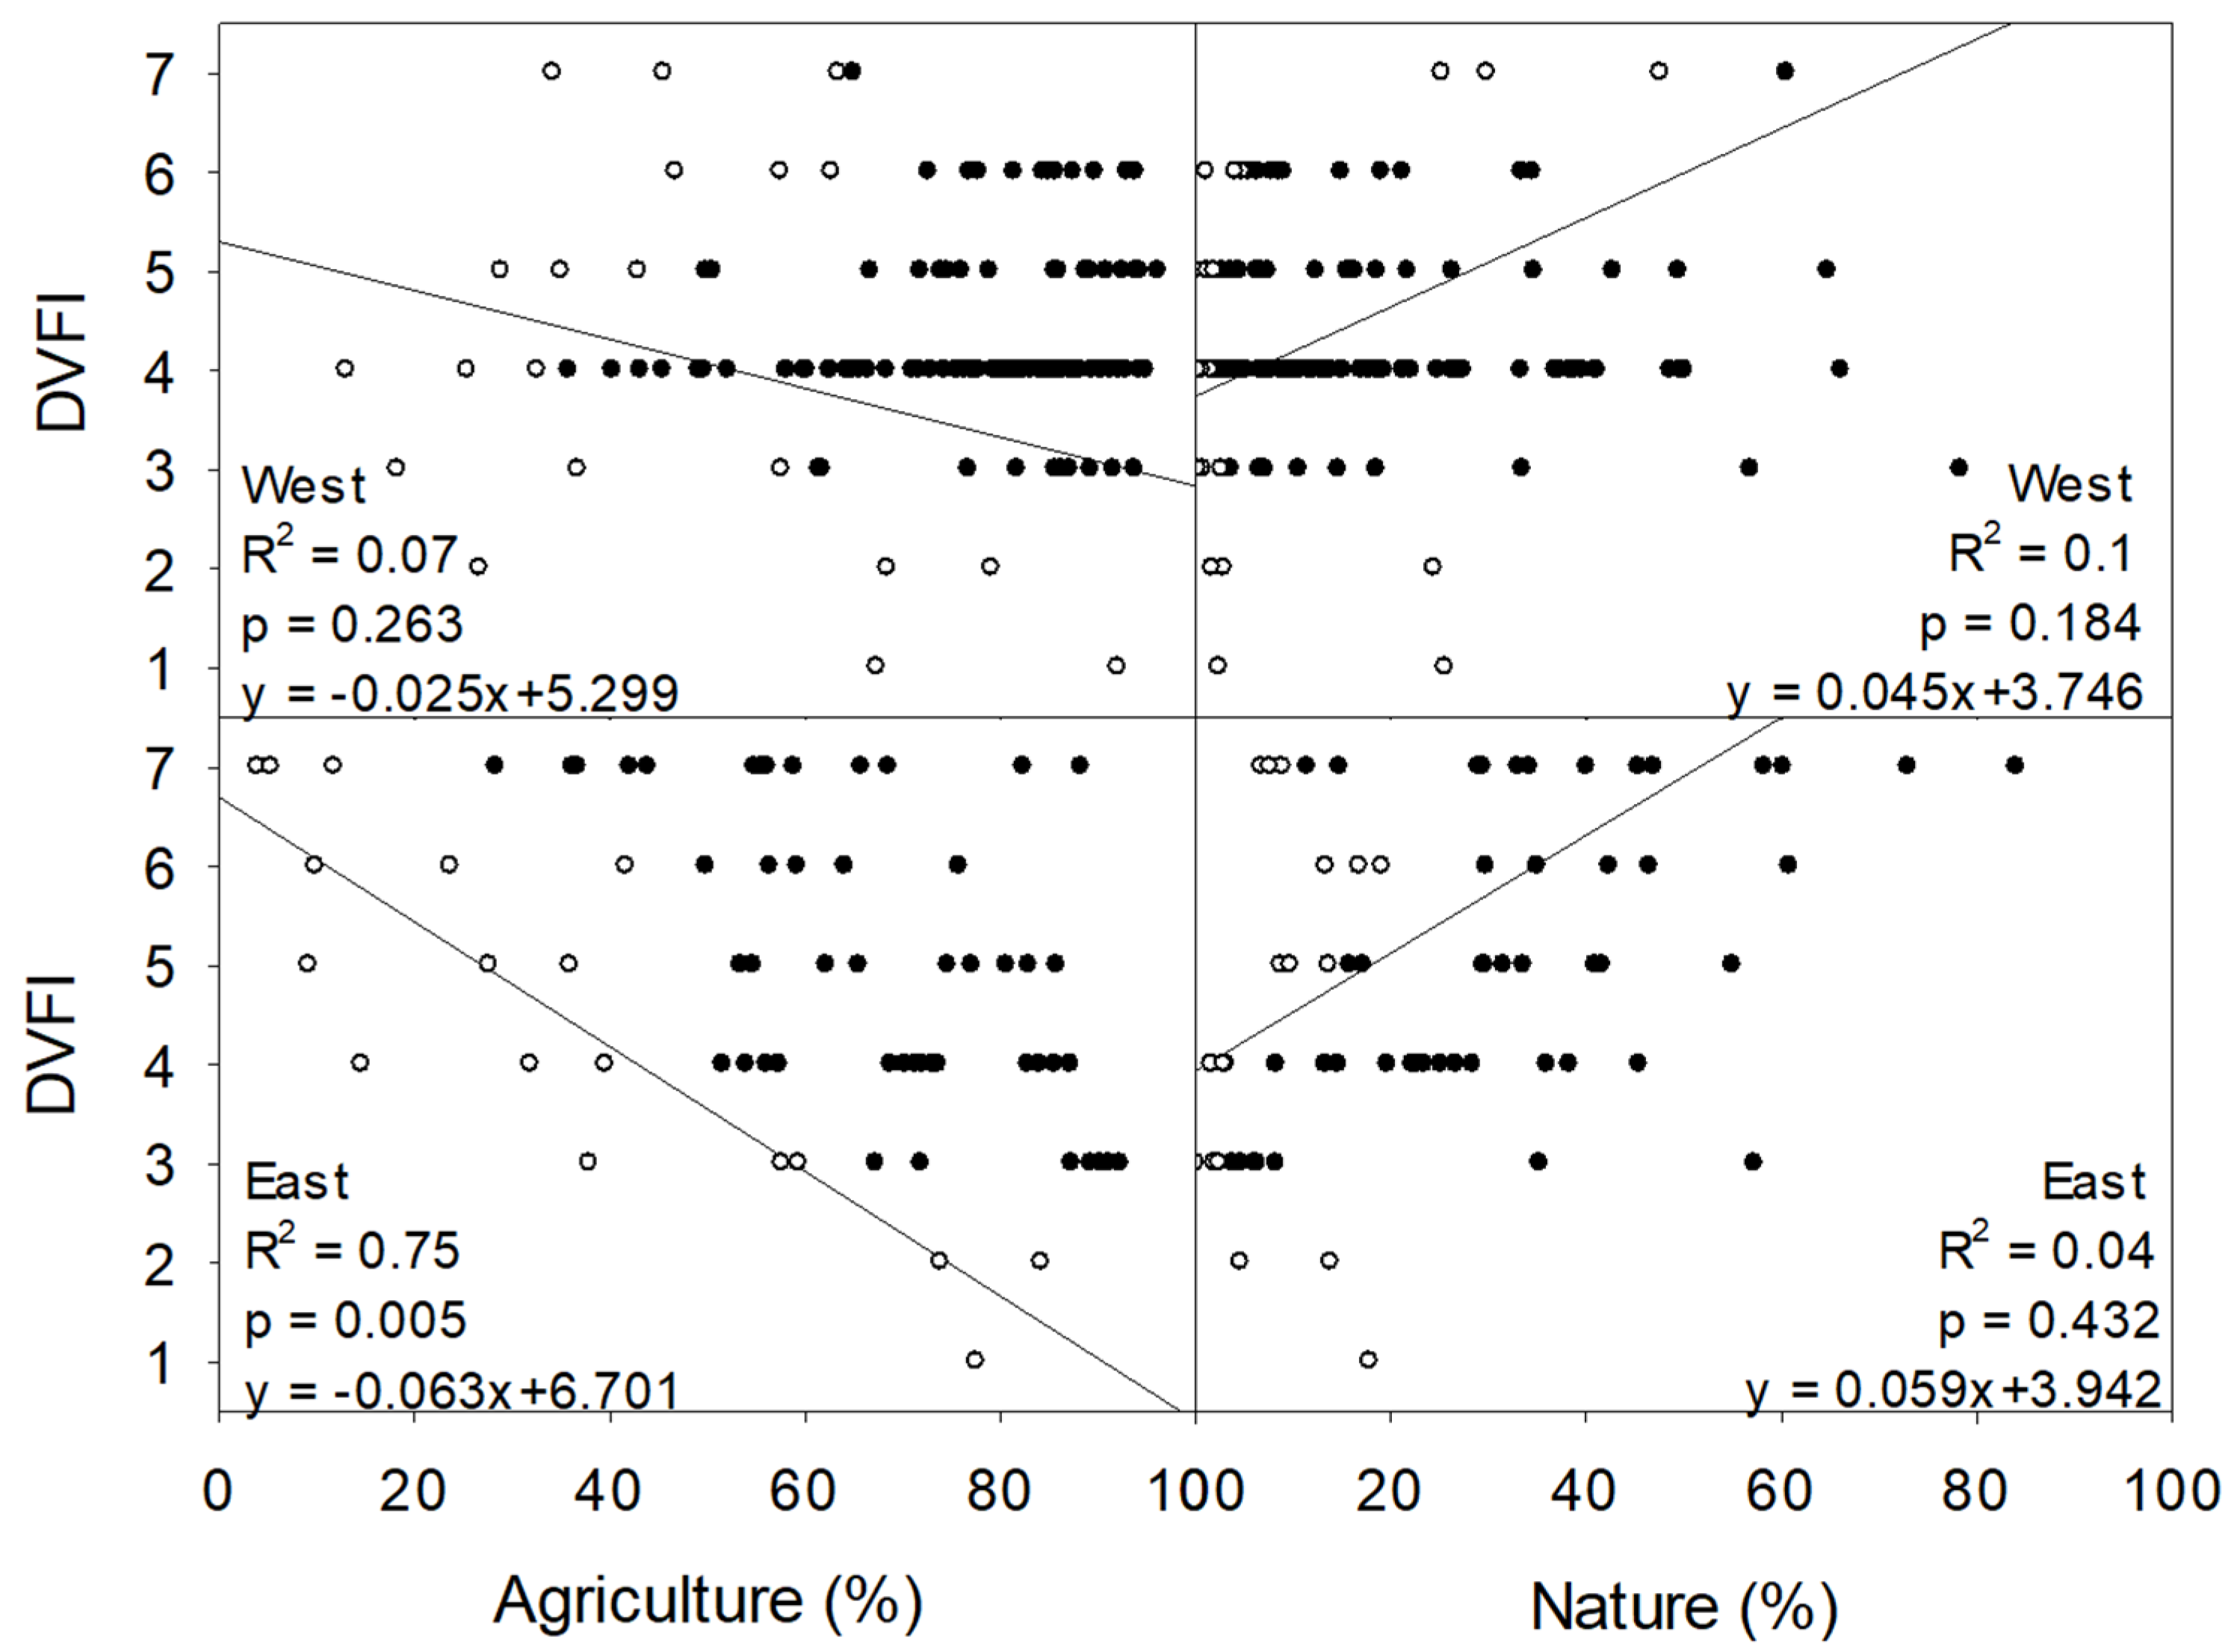
3.2. Stream Quality vs. Land Use

Generally, a large agricultural land use area in the catchments resulted in low DVFI. Stations with low DVFI also had a low amount of nature and forest in the entire catchment, the lowland area, and in the riparian zones. In streams with high DVFI, the percentage of area with agriculture was still high for the entire catchment, whereas nature and forest dominated in the lowland areas and riparian zones. In general, urban areas negatively influenced DVFI, but not nearly to the same degree as agriculture. Land use distribution in the catchments (Table 1) significantly affected the stream quality. Generally, the catchments were dominated by agriculture and nature and forest, whereas urban areas were more limited. At stations with DVFI 7, the catchments were dominated by agriculture (47%), whereas nature/forest constituted 37% and urban areas 15%. Focusing on the riparian zone at stations with DVFI 7, the land use was dominated by natural/forested areas (60%) and only 27% agriculture, whereas the proportion of urban catchment increased to 27%. At stations with DVFI 1, the total catchment and the riparian zone were, to an even greater extent, dominated by agriculture (79% and 67%, respectively).
A comparison between measured DVFI at all stream stations and the percentage of either nature/forest or agriculture in each catchment (Figure 3 and Figure 4) revealed a negative correlation between DVFI and agriculture, with a higher percentage of agriculture in catchments with low DVFI, when looking at the three lowest area percentages for each DVFI score. Additionally, we found a positive correlation between DVFI and nature/forest. In the entire catchment (Figure 3), the linear correlations were not significant in the west (P = 0.263 for DVFI vs, agriculture and P = 0.184 for DVFI vs. nature). In the east, the correlation between DVFI and agriculture were significant (P = 0.005), whereas the P-value was 0.432 for the correlation between DVFI and nature/forest. When focusing on the riparian zone (Figure 4), all four correlations were significant (P < 0.05). A comparison of land use distribution in the entire catchment and in the riparian zone showed that the slopes of the trend lines are generally steeper for the entire catchment, revealing that DVFI is more affected by the type of land use in the entire catchment than in the riparian zone.
For the streams to be of good ecological quality (DVFI 5–7), at least 30% of the total catchment area in the west should be without agriculture or urban areas, compared with only 20% in the east (Figure 3). In the riparian zones, the corresponding values are 40% in the west and almost 60% in the east (Figure 4). Streams in the east seemed to be more affected by land use in the catchment than in the west.

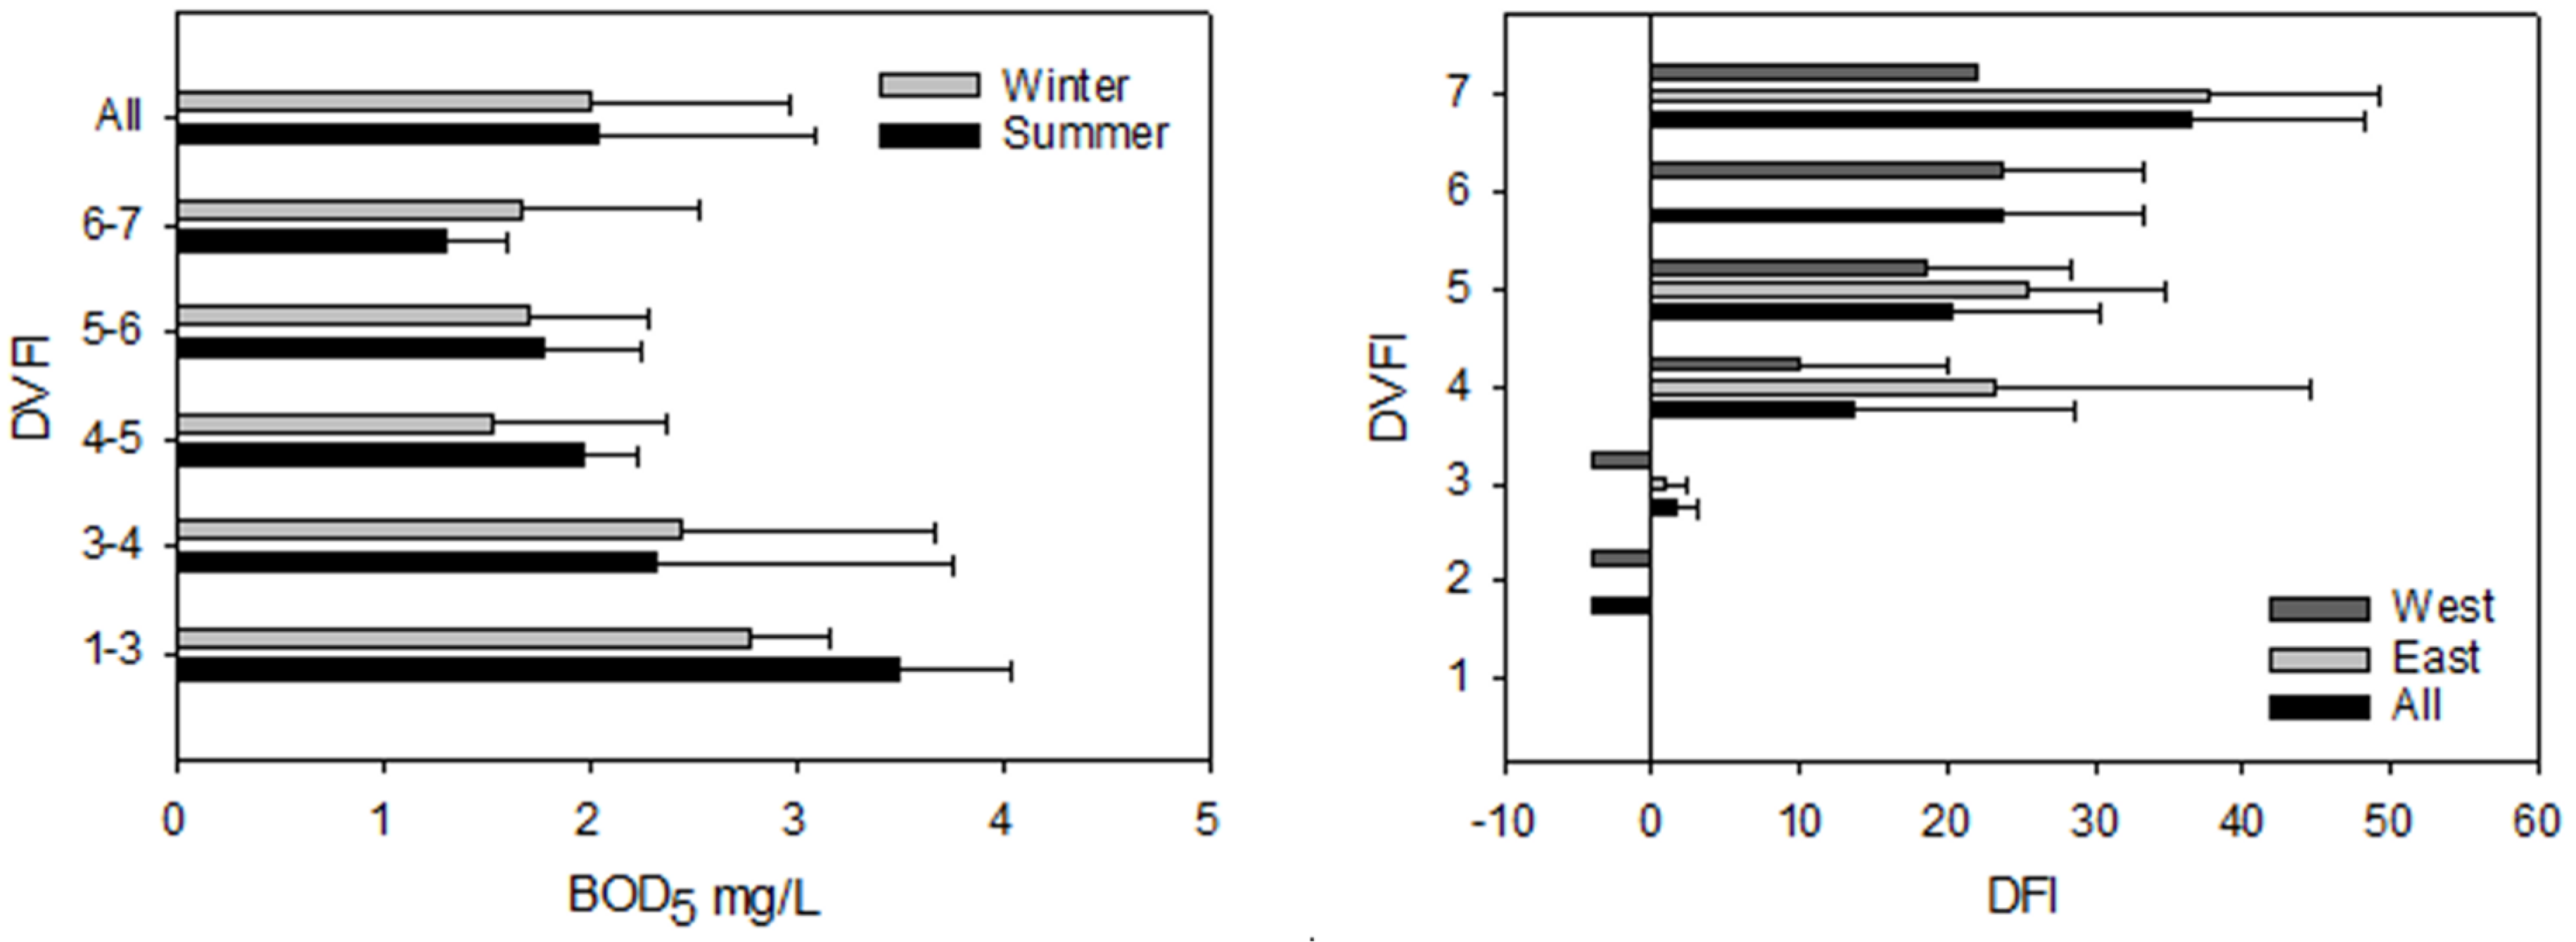
3.3. BOD5, Metals, and DFI

An analysis of 1036 BOD5 samples taken in 17 of the catchments showed a negative impact of BOD5 on DVFI (Figure 5, left) and a more negative impact in summer (May–September) than in winter (October–April). The data of selected metals showed significant negative correlations between total concentrations of chromium (Cr), aluminum (Al), and nickel (Ni) measured in the stormwater outlets and the streams’ DVFI (P = 0.033, 0.034, and 0.017, respectively, data not shown). Metals are often particulate bound and therefore a positive correlation was found between suspended solid (SS) and Al (P < 0.0001). Streams in the east were generally in better physical conditions than streams in the west, and a positive correlation between DFI and DVFI was found (Figure 5, right). There were no DFI measurements in stations with DVFI 1 and only one with DVFI 2, but for DVFI 7, the DFI was significantly higher than for DVFI 3 (P < 0.001) and DVFI 4 (P = 0.005), including all measurements.

3.4. Influence from Nature/Forest and Urban Areas

Focusing on the uncultivated and non-urban areas, which are important for the good ecological quality of streams, forest (a mixture of conifer and deciduous trees) was the dominant land use (70% in east and 57% in the west on average). Forests with conifer trees were the dominating type, whereas natural areas like moors, meadows, coastal meadows, commons, heaths, lakes, and streams constituted 27% in the east and 39% in the west. Table 2 focuses only on nature, forest, and urban areas, excluding the overall negative influence from agriculture. Nature and forest were more dominant types than urban areas in catchments with streams with high ecological quality (DVFI 5–7). In contrast, low ecological quality (DVFI 1–4) was found in streams with catchments containing outlets from sewer systems. Urban areas were divided into areas with either combined sewers (with occasional wastewater overflow) or separate sewer systems (constant stormwater outlet). Catchments containing a large percentage of separate sewer systems had lower DVFI (4–5) and catchments with combined sewer systems had even lower DVFIs (1–4).
Most of the urban areas are connected with wastewater treatment plants with tertiary treatment. Small villages and scattered houses discharge wastewater directly to the receiving waters with only physical treatment and therefore negatively influence the stream quality. This was observed in the data as a negative relationship between DVFI and the number of scattered houses/km2 (Table 2). As an example, there were, on average, 2.4 houses/km2 at stations with DVFI 7, but 3.6 at DVFI 6 and 5.3 at DVFI 4.

4. Discussion

We found significant correlations between land use in the catchments and stream quality. The ecological stream quality was negatively influenced by the percentage of agriculture and urban areas, whereas nature and forest had positive impacts. Catchments with combined sewer systems more negatively influenced stream quality than catchments with separate sewer systems. This was supported by measurements showing negative impacts from metals originating from stormwater and BOD5 originating from wastewater. Finally, the results showed that management of the entire catchment influences the stream quality more than management in the riparian zone alone.
Runoff from different types of land use is crucial for the ecological quality in streams. Urban catchments are often located in the riparian zone and in lowland areas (Table 1), whereas agriculture, scattered houses, and small villages dominate the countryside. These are historically also located close to waterbodies and their nutrients, organic contamination, and xenobiotics in discharged stormwater negatively impact DVFI. Particulate material is often deposited in the stream systems and metals are often particulate bound (proved by, e.g., a relationship between SS and Al in this study). Significant negative correlations were found between DVFI and Ni, Cr, and Al. The metals can influence the biotopes due to, e.g., desorption, bioturbation, and direct uptake [28].
From a stream quality perspective, separate sewers should be preferred over combined sewers, as separate systems in the catchments resulted in better stream quality than combined systems. During heavy rain events, direct overflows from combined sewers to the receiving water occur if the pipe system and the treatment plant cannot handle the large amounts of diluted wastewater. The consequence is contamination with nutrients, organic matter, and xenobiotics. In separate systems, wastewater is never discharged; instead, all stormwater is discharged with its content of the above-mentioned substances, though at lower concentrations [29]. Therefore, outlets from catchments with separate sewers can still negatively influence DVFI due to hydraulic effects and contamination with, e.g., heavy metals, nutrients, hydrocarbons, and road salt. Overall, separate sewer systems are a successful climate adaption strategy and many municipalities have chosen to convert combined sewers into separate sewers to accommodate the increased precipitation caused by climate change [30]. Due to the hydraulic effects and the contained substances, stormwater is often treated and retained in wet ponds before outlet. Other sustainable urban drainage systems (SuDS), such as permeable surfaces or local infiltration, provide alternative solutions. The contamination in the discharged stormwater is dependent on various factors such as the design and age of the sewer system, eventual treatment of the water, and the level of pollution of the catchment, which, e.g., depends on activities and traffic intensity [26]. Wastewater from scattered houses deteriorates stream quality due to inadequate treatment. A solution to this is to connect scattered houses to public sewer systems, if feasible, or adopt an improved treatment method. This is currently an ongoing national process in Denmark. A correlation between urban runoff and low stream quality has also been studied by Paul and Meyer [24]. They found that the increasing population in urban areas has resulted in changes in the hydrology and geomorphology of streams and in declines in the richness of invertebrates and fish due to increased loadings of nutrients, pesticides, metals, and other contaminants.
Agriculture dominates in catchments with streams that have low DVFI and is less widespread in streams with high DVFI. In contrast, natural and forested areas in the catchments (both in the total area and in the riparian zone) always positively impact DVFI and thereby the ecological stream quality. A study in Lithuania showed the same tendency, where the ecological stream quality was significantly higher in natural forested streams [31]. The presence of nature belts along the streams seems to support the macroinvertebrate communities and thereby a good DVFI status. Chase et al. also concluded that relatively small increases in riparian forest cover will lead to statistically detectable and ecologically meaningful improvements in stream quality [32]. Increases in the riparian forest result in increases in physical quality, which positively influences DVFI.
The significant linear correlations between DVFI and both agriculture and nature in the riparian zone (Figure 4) indicate that stream quality is highly dependent on the land use in the riparian zone. Good quality in the riparian zone is insufficient on its own, since the stream receives runoff from the entire catchment. Steeper slopes of trend lines created from data from the entire catchment (Figure 3 and Figure 4) indicate that management in the entire catchment has a greater influence on stream quality than management in the riparian zone. Streams in east were more affected by agriculture than those in the west. This could be due to more intensive agricultural production in east, as this soil has a higher agricultural value and therefore receives higher amounts of fertilizer, leading to higher nutrient runoff. In the west, a large part of the farm land is grassland, and therefore does not receive the same high amounts of fertilizers and cultivation.
The overall lower negative impact of urban areas on DVFI can be explained by the percentage of urban areas in the studied area (11%). Despite this low percentage, a clear and visible impact was observed on DVFI, which means that stormwater clearly influences stream quality. This influence might not only be negative, as well-treated stormwater might dilute the drainage water in highly cultivated agricultural land. Stormwater is an extra water source to streams situated in areas with groundwater aquifers used for drinking water, which lowers the groundwater table and thereby the water level in the streams.
Catchments in the east contained the highest percentages of nature and forest and 33% of the east-flowing streams were not fulfilling the objectives, whereas this was the case for 60% of the west-flowing streams (Figure 2). The descending gradient is also larger for the east-flowing streams, which leads to higher DFI and thereby higher DVFI in the east. An important factor that affects DVFI is the hydraulic effects, i.e., sediment erosion, withdrawal of animals and plants, and higher dynamic flow. These depend on the composition of the catchment area, soil type, and shape of the stream.
Good ecological quality depends on the physical conditions. Animals and plants have demands on, for example, substrate, water flow, descending gradient, shade, banks, riffles, and meandering of the stream, to survive in and around the stream environment. As expected, high DFI resulted in high DVFI in this study (Figure 5, right). Due to different topographies, streams in the east with higher slopes (0–25‰) had better physical states than those in the west with lower slopes (0–2‰), which could explain why only 33% of streams in the east were not meeting the environmental goal.
Streams are usually in poor physical conditions when they have been exposed to straightening, dredging, and/or rough weed cutting [22]. Although the biotic response to some stressors is expected to be negative, several environmental stressors have positive influences at low to moderate concentrations. Odum et al. used riparian thinning and low intensity agriculture as examples [33]. The initial increase in nutrients, light, and water temperature increases the periphyton biomass and macroinvertebrate abundance, whereas further intensification of agriculture results in loss of diversity and sensitive species [34]. Along with poor physical conditions, BOD5 negatively influences the living conditions of plants and animals, and physical reaeration is suboptimal in streams with low slopes (Figure 5, left). The impact was greater in summer than in winter, caused by higher mineralization rates during the warm period. Richards et al. also found significant seasonal differences in BOD5. They found that septic tank effluent BOD5 concentrations were particularly higher in spring and summer [35].
Natural and forested areas in the catchments are crucial to high DVFI values in the streams. In this study, forest area was more dominant compared to the amount of natural areas, with the highest amount found in the west. This was due to tree planting in the west to reduce sand drift and because sandy soil is not as usable for cultivation. The results from another study showed that deciduous trees along the streams give higher DVFI than conifer trees due to shading and difference in nutrient input [36]. Since the sandy soil in the west has mostly conifer trees, deciduous trees in the east contribute to a higher DVFI. The natural areas in the study are different. There is original nature, culture-dependent nature (e.g. heaths) and reestablished nature on former farmland, but independently, the positive impact of all natural areas is clear.

5. Conclusions

Having large areas without agriculture and urbanization in both the riparian zone and the entire catchment is important for achieving good physical conditions (DFI) and high-quality ecological status (DVFI ≥ 5). Management of the entire catchment has a larger influence on stream quality than management in the riparian zone alone. A specific stream station needs a minimum of 20–30% nature/forest in the total catchment and 40–55% in the riparian zone to produce good ecological stream quality according to this study. These relationships are transferable to highly cultivated countries like Denmark.
The GIS study presented in this study can be transferred and replicated in other catchments, and is a valuable tool to provide an overview and understanding of the relationships between land use and stream quality in the area.
The ecological stream quality is negatively influenced by agriculture and outlets from urban areas. Untreated outlets from scattered houses should be avoided, and separate sewers should be preferred over combined sewers.

Author Contributions

Conceptualization, C.S.K., M.R.F., and S.E.; Data curation, C.S.K., M.R.F., M.J.S., M.H.M., and S.E.; Formal analysis, C.S.K. and M.H.M.; Funding acquisition, M.R.F. and S.E.; Investigation, C.S.K., M.J.S., and M.H.M.; Methodology, C.S.K., M.R.F., M.J.S., and S.E.; Project administration, C.S.K., M.R.F., and S.E.; Resources, M.R.F. and S.E.; Software, C.S.K., M.R.F., and M.H.M.; Supervision, M.R.F. and S.E.; Validation, C.S.K., M.R.F., and S.E.; Visualization, C.S.K., M.R.F., and S.E.; Writing—original draft, C.S.K., M.R.F., and S.E.; Writing—review & editing, S.E.

Funding

The study was funded by an industrial/commercial PhD project (Melanie J. Sønderup) granted by the Danish Ministry of Science, Innovation and Higher Education FI case number 11-109519.

Acknowledgments

Thanks to Arwos, for cooperation, background data, and information. Thanks to the laboratory technicians at the University of Southern Denmark for help with chemical analysis. Thanks to former master students; Anders S. Hansen and Anna Grudinina, for access to data.

Conflicts of Interest

The authors declare no conflict of interest. The funders had no role in the design of the study; in the collection, analyses, or interpretation of data; in the writing of the manuscript, or in the decision to publish the results.

References

  1. Chubb, C.; Griffiths, M.; Spooner, S. Regulation for water quality—How to safeguard the water environment. In Partnership with the European Union; Foundation for Water Research: Cambridge, UK, 2014; pp. 12–187. [Google Scholar]
  2. Ledin, A.; Auffarth, K.P.S.; Boe-Hansen, R.; Eriksson, E.; Albrechtsen, H.J.; Baun, A.; Mikkelsen, Å.S. Use of stormwater collected from roofs and paved areas—Identification of relevant parameters for measurements. Ecol. Urban. Renew. Wastewater Treat. 2004, 48, 11–29. (In Danish) [Google Scholar]
  3. Coleman, J.C.; Miller, M.C.; Mink, F.L. Hydrologic disturbance reduces biological integrity in urban streams. Environ. Monit. Assess. 2011, 172, 663–687. [Google Scholar] [CrossRef] [PubMed]
  4. Wang, B.X.; Liu, D.X.; Liu, S.R.; Zhang, Y.; Lu, D.Q.; Wang, L.Z. Impacts of urbanization on stream habitats and macroinvertebrate communities in the tributaries of Qiangtang River, China. Hydrobiologia 2012, 680, 39–51. [Google Scholar] [CrossRef]
  5. Mallin, M.A.; Johnson, V.L.; Ensign, S.H. Comparative impacts of stormwater runoff on water quality of an urban, a suburban, and a rural stream. Environ. Monit. Assess. 2009, 159, 475–491. [Google Scholar] [CrossRef]
  6. Seifert, A.G.; Roth, V.N.; Dittmar, T.; Gleixner, G.; Breuer, L.; Houska, T.; Marxsen, J. Comparing molecular composition of dissolved organic matter in soil and stream water: Influence of land use and chemical characteristics. Sci. Total Environ. 2016, 571, 142–152. [Google Scholar] [CrossRef] [PubMed]
  7. Pedersen, E.R.; Perkins, M.A. The use of benthic invertebrate data for evaluating impacts of urban runoff. Hydrobiologia 1986, 139, 13–22. [Google Scholar] [CrossRef]
  8. Davies, P.J.; Wright, I.A.; Findlay, S.J.; Jonasson, O.J.; Burgin, S. Impact of urban development on aquatic macroinvertebrates in south eastern Australia: Degradation of in-stream habitats and comparison with non-urban streams. Aquat. Ecol. 2010, 44, 685–700. [Google Scholar] [CrossRef]
  9. Walsh, C.J.; Roy, A.H.; Feminella, J.W.; Cottingham, P.D.; Groffman, P.M.; Morgan, R.P. The urban stream syndrome: Current knowledge and the search for a cure. J. North Am. Benthol. Soc. 2005, 24, 706–723. [Google Scholar] [CrossRef]
  10. Kronvang, B.; Laubel, A.R.; Larsen, S.E.; Iversen, H.L. Soil erosion and sediment delivery through buffer zones in Danish slope units. The Role of Erosion and Sediment Transport in Nutrient and Contaminant Transfer. In Proceedings of the Symposium, Waterloo, ON, Canada, July 2000; pp. 67–73. Available online: http://hydrologie.org/redbooks/a263/iahs_263_0067.pdf (accessed on 3 October 2019).
  11. Vietz, G.J.; Walsh, C.J.; Fletcher, T.D. Urban hydrogeomorphology and the urban stream syndrome: Treating the symptoms and causes of geomorphic change. Prog. Phys. Geog. 2016, 40, 480–492. [Google Scholar] [CrossRef]
  12. Blankenberg, A.B.; Haarstad, K.; Paruch, A.M. Agricultural Runoff in Norway: The problem, the regulations, and the role of wetlands. In The Role of Natural and Constructed Wetlands in Nutrient Cycling and Retention on the Landscape; Vyamazal, J., Ed.; Springer International Publishing: Basel, Switzerland, 2014; pp. 137–147. [Google Scholar]
  13. Mateo-Sagasta, J.; Zadeh, S.M.; Turral, H. Water Pollution from Agriculture: A Global Review—Executive Summary; The Food and Agriculture Organization of the United Nations Rome and the International Water Management Institute on Behalf of the Water Land and Ecosystems research program Colombo: Rome, Italy; The International Water Management Institute on Behalf of the Eater Land and Ecosystems Research program Colombo: Colombo, Sri Lanka, 2017. [Google Scholar]
  14. Schoumans, O.F.; Chardon, W.J.; Bechmann, M.; Cascuel-Odoux, C.; Hofman, G.; Kronvang, B.; Litaor, M.I.; Lo Porto, A.; Newell-Price, P.; Rubæk, G. Mitigation Options for Reducing Nutrient Emissions from Agriculture; A Study Amongst European Member States of Cost Action 869; Alterra-Report 2141; Alterra Wageningen UR: Wageningen, The Netherlands, 2011; pp. 11–143. [Google Scholar]
  15. The Ministry of Environment, Danish Nature Agency. Water Environment and Nature 2016; The Ministry of Environment: Copenhagen, Denmark, 2018; pp. 13–23.
  16. The Ministry of Environment, Danish Nature Agency. Point Sources 2013; The Ministry of Environment: Copenhagen, Denmark, 2015; pp. 9–36.
  17. Steedman, R.J. Modification and Assessment of an index of biotic integrity to quantify stream quality in Southern Ontario. Can. J. Fish. Aquat. Sci. 2011, 45, 492–501. [Google Scholar] [CrossRef]
  18. Hooper, R.P.; Aulenbach, B.T.; Kelly, V.J. The national stream quality accounting network: A flux-based approach to monitoring the water quality of large rivers. Hydrol. Process. 2018, 15, 1089–1106. [Google Scholar] [CrossRef]
  19. Li, S.; Gu, S.; Tan, X.; Zhang, Q. Water quality in the upper Han River basin, China: The impacts of land use/land cover in riparian buffer zone. J. Hazard. Mater. 2009, 165, 317–324. [Google Scholar] [CrossRef] [PubMed]
  20. Kelly, M.G.; Cazaubon, E.; Coring, A.; Dell’Uomo, L.; Ector, B.; Goldsmith, H.; Guasch, J.; Hürlimann, A.; Jarlman, B.; Kawecka, J.; et al. Recommendations for the routine sampling of diatoms for water quality assessments in Europe. J. Appl. Phycol. 1998, 10, 215. [Google Scholar] [CrossRef]
  21. Rotvit, L.; Jacobsen, D. Temperature increase and respiratory performance of macroinvertebrates with different tolerances to organic pollution. Limnologica 2013, 43, 510–515. [Google Scholar] [CrossRef]
  22. Friberg, N.; Baattrup-Pedersen, A.; Pedersen, M.L.; Skriver, J. The new Danish stream monitoring programme (NOVANA)—Preparing monitoring activities for the water framework directive era. Environ. Monit. Assess. 2005, 111, 27–42. [Google Scholar] [CrossRef]
  23. Kronvang, B.; Grant, R.; Larsen, S.E.; Svendsen, L.M.; Kristensen, P. Non-point-source nutrient losses to the aquatic environment in Denmark: Impact of agriculture. Mar. Freshw. Res. 1995, 46, 167–177. [Google Scholar] [CrossRef]
  24. Paul, M.J.; Meyer, J.L. Streams in the urban landscape. Annu. Rev. Ecol. Syst. 2001, 32, 333–365. [Google Scholar] [CrossRef]
  25. Egemose, S.; Sønderup, M.J.; Grudinina, A.; Hansen, A.S.; Flindt, M.R. Heavy metal composition in stormwater and retention in ponds dependent on pond age, design and catchment type. Environ. Technol. 2014, 36, 959–969. [Google Scholar] [CrossRef]
  26. Sønderup, M.J.; Egemose, S.; Hansen, A.S.; Grudinina, A.; Madsen, M.H.; Flindt, M.R. Factors affecting retention of nutrients and organic matter in stormwater ponds. Ecohydrology 2016, 9, 796–806. [Google Scholar] [CrossRef]
  27. Statistics Denmark. Available online: http://www.dst.dk/da/Statistik/nyt/NytHtml?cid=28143 (accessed on 22 August 2019).
  28. Kucuksezgin, F.; Uluturhan, E.; Batki, H. Distribution of heavy metals in water, particulate matter and sediments of Gediz River (Eastern Aegean). Environ. Monit. Assess. 2008, 141, 213–225. [Google Scholar] [CrossRef]
  29. Sørensen, S.; Petersen, B.; Kofod, N.; Jacobsen, P. Historical overview of the Copenhagen sewerage system. Water Pract. Technol. 2006, 1, 1–8. [Google Scholar] [CrossRef]
  30. Brombach, H.; Weiss, G.; Fuchs, S. A new database on urban runoff pollution: Comparison of separate and combined sewer systems. Water Sci. Technol. 2005, 51, 119–128. [Google Scholar] [CrossRef] [PubMed]
  31. Virbickas, T.; Pliuraité, V.; Kesminatas, V. Impact of Agricultural Land Use on Macroinvertebrate Fauna in Lithuania. Pol. J. Environ. Stud. 2011, 20, 1327–1334. [Google Scholar]
  32. Chase, J.W.; Benoy, G.A.; Hann, S.W.R.; Culp, J.M. Small differences in riparian vegetation significantly reduce land use impacts on stream flow and water quality in small agricultural watersheds. J. Soil Water Conserv. 2016, 71, 194–205. [Google Scholar] [CrossRef]
  33. Odum, E.P.; Finn, J.T.; Franz, E.H. Perturbation theory and the subsidy-stress gradient. BioScience 1979, 29, 349–351. [Google Scholar] [CrossRef]
  34. Quinn, J.M. Effects of pastoral development. In New Zealand Stream Invertebrates: Ecology and Implications for Management; Collier, K.J., Winterbourn, M.J., Eds.; Caxton Press: Christchurch, New Zealand, 2000; pp. 208–229. [Google Scholar]
  35. Richards, S.; Withers, P.; Paterson, E.; Stutter, M.I. Temporal variability in domestic point source discharges and their associated impact on receiving waters. Sci. Total Environ. 2016, 571, 1275–1283. [Google Scholar] [CrossRef]
  36. Hart, S.K.; Hibbs, D.E.; Perakis, S.S. Riparian litter inputs to streams in the central Oregon Coast Range. Freshw. Sci. 2013, 32, 343–358. [Google Scholar] [CrossRef] [Green Version]
Figure 1. (A) Studied area and land use distribution. Red areas = cities, green and blue areas = terrestrial and aquatic nature including forests, and orange areas = agriculture; (B) illustration of streams running either eastward (dark blue) or westward (light blue). Black dots represent the location of the stream stations.
Sustainability 11 05479 g001
Figure 2. Stream quality in the studied area. Colors in the figure indicate the Danish water fauna index (DVFI value). Black: 1, Red: 2, Orange: 3, Yellow: 4, Light green: 5, Dark green: 6, Blue: 7, Gray: Streams that were not targeted. The table shows percentages (%) of streams in the eastern and western part of the area that meet the environmental objectives (light grey) and those that do not (dark grey).
Sustainability 11 05479 g002
Figure 3. Distribution of agriculture (%) and nature (%, nature/forest) versus DVFI in the western and eastern parts of the study area. Data (n = 67) cover the entire catchment area for each station. White dots indicate the three lowest values for each DVFI score. The trend line follows these data. Black dots represent all the measurements of every DVFI score. One outliner was removed due to being near the outlet from a treatment plant in the catchment.
Sustainability 11 05479 g003
Figure 4. Distribution of agriculture (%) and nature (%, nature/forest) versus DVFI in the western and eastern parts of the study area. Data (n = 67) cover the riparian zone of the streams (a 10 m buffer zone). White dots show the three lowest values for every DVFI score. The trend line follows these data. Black dots represent all the measurements for every DVFI score.
Sustainability 11 05479 g004
Figure 5. Left: Concentrations of BOD5 (mg/L) in summer (black) and winter (grey) divided after DVFI (n = 1036) with standard deviation. Right: DFI and corresponding DVFI (n = 77). Light grey represents east, dark grey represents west, and black represents both.
Sustainability 11 05479 g005
Table 1. Land use distribution (mean of agriculture, nature (nature, forest and freshwater) and urban) in percentages for every DVFI score in the entire catchment (total), in the lowland area (50 m on each side of the stream), and in the riparian zone (10 m on each side of the stream).
DVFICatchmentAgriculture (%)Nature (%)Urban (%)
7Total/50 m buffer/10 m buffer47/35/2737/52/6015/13/13
6Total/50 m buffer/10 m buffer67/41/3220/52/6013/8/8
5Total/50 m buffer/10 m buffer69/46/3820/44/5211/10/10
4Total/50 m buffer/10 m buffer70/64/5818/28/3113/9/11
3Total/50 m buffer/10 m buffer73/69/6516/25/2911/5/6
2Total/50 m buffer/10 m buffer66/70/6410/16/1724/14/20
1Total/50 m buffer/10 m buffer79/66/6715/28/236/6/10
Table 2. The percentage of areas with nature/forest, and combined and separate sewers in the catchment (n = 771) plus number of scattered houses/km2 and the influence on DVFI (n = 182) divided into DVFI scores including standard deviation. One outliner of the scattered houses in a small catchment close to the sea was removed as it was not representative.
DVFINature/Forest (%)Combined Sewer (%)Separate Sewer (%)Scattered Houses (houses/km2)
790 ± 130 ± 110 ± 132.4 ± 0.4
681 ± 201 ± 418 ± 203.7 ± 0.4
577 ± 264 ± 1019 ± 233.9 ± 0.6
474 ± 305 ± 1221 ± 265.4 ± 1
356 ± 3416 ± 2028 ± 254.9 ± 0.4
235 ± 2628 ± 2337 ± 242.3 ± 0.1
155 ± 3216 ± 2129 ± 295.4 ± 3.5

