Article

Multi-Objective Sizing of Hybrid Energy Storage System for Large-Scale Photovoltaic Power Generation System

1
State Key Laboratory of Hydraulic Engineering Simulation and Safety, Tianjin University, Tianjin 300350, China
2
Huanghe Hydropower Development Co., Ltd., Xining 810008, China
*
Author to whom correspondence should be addressed.
Sustainability 2019, 11(19), 5441; https://doi.org/10.3390/su11195441
Submission received: 9 September 2019 / Revised: 27 September 2019 / Accepted: 29 September 2019 / Published: 1 October 2019
(This article belongs to the Special Issue Photovoltaic Power)

Abstract

:
Hybrid energy storage systems (HESS) are an effective way to improve the output stability for a large-scale photovoltaic (PV) power generation systems. This paper presents a sizing method for HESS-equipped large-scale centralized PV power stations. The method consists of two parts: determining the power capacity by a statistical method considering the effects of multiple weather conditions and calculating the optimal energy capacity by employing a mathematical model. The method fully considers the characteristics of PV output and multiple kinds of energy storage combinations. Additionally, a pre-storage strategy that can further improve stability of output is proposed. All of the above methods were verified through a case study application to an 850 MW centralized PV power station in the upstream of the Yellow river. The optimal hybrid energy storage combination and its optimization results were obtained by this method. The results show that the optimal capacity configuration can significantly improve the stability of PV output and the pre-storage strategy can further improve the target output satisfaction rate by 8.28%.

Highlights

  • Generic multi-objective sizing methodology for hybrid energy storage systems.
  • Selection of energy storage systems by comparing multiple energy storage combinations.
  • Optimal life cycle solutions considering the effects of multiple weather conditions.
  • Concept of pre-storage strategy for higher satisfaction is proposed and presented.

1. Introduction

To improve the energy supply and reduce carbon emission, accelerating the development and utilization of renewable energy has become the focus of energy development [1]. In recent years, solar energy has been one of the fastest growing energy sources among renewable energy sources [2,3]. In 2017, the global installed capacity of PV increased by 97 GW with 403 GW as the total installed capacity. However, power output fluctuations of large-scale PV power stations result into a decline in power quality. Consequently, power output fluctuations may pose a threat to the grid security for large penetration of PV in power systems. The other disadvantage is the unavoidable energy loss from power curtailment or unacceptable lower power quality due to output variations [4]. To mitigate the above issues, operation limits for grid-connected PV/wind plants were implemented. For example, output fluctuations per minute should be limited to 10% of the rated power of the plant in China [5]. In Puerto Rico and Mexico, the corresponding value were 10% and 1–5% of the rated power [6,7]. In recent years, with the improvement of energy storage technology and cost reduction, equipping energy storage systems (ESS) for PV power generation system has become one of the economical and effective ways to smoothen PV output fluctuations and mitigate their impact [8,9]. ESS can suppress the unstable PV output through charging and discharging, and can also realize energy storage at different time scales [10]. To date, there have been many kinds of energy storage technologies developed, including mechanical energy storage, chemical energy storage, electrochemical energy storage, superconducting magnetic energy storage, thermal energy storage, etc. The characteristics of these ESS, such as power density, energy density and cycle lifetime, are different [11]. None of these energy storage devices has advantages in all aspects [12]. However, PV output fluctuations consist of high- and low frequency fluctuations that require an energy storage system with both high power density and high energy density for securing large-scale penetration [13,14]. Therefore, equipping HESS for PV power generation systems remains an economical and viable solution for maximizing the benefits of different energy storage technologies [15,16,17].
HESS includes high power storage (HPS) and high energy storage (HES) [18]. HPS responds quickly and can provide short bursts of power injection or absorption. It is suitable for smoothing out high frequency fluctuations. However, the high cost of HPS restricts their large-scale application. HES with relative lower cost has large storage capacity and is suitable for smoothing out low frequency fluctuations. HPS mainly includes supercapacitors (SC), flywheels, superconducting magnetic energy storage (SMES), etc.; while HES mainly includes pumped hydro, compressed air, vanadium redox flow batteries (VRB), sodium-sulfur cells, lead-acid cells (PbAc), fuel cells (FC), etc. [19]. Some studies have reported various combinations of energy storage, for example, Hajiaghasi et al. [18] presented a large variety of energy storage combinations for HESS. Moreover, Zhao et al. [20] designed an improved coordinated control strategy of Flywheel/Battery HESS in PV power smoothing to extend the life expectancy of the battery and reduce operating costs. Aktas et al. [21] proposed a new Smart Energy Management Algorithm (SEMA) for SC/Battery HESS supplied from 3-phase 4-wire grid connected PV power system. Furthermore, Li et al. [22] developed a stand-alone micro-grid model including Battery/Hydrogen HESS and obtained the optimal size and operation strategy. Li et al. [23] proposed a HESS using battery energy storage and SMES to mitigate battery cycling while smoothing power flow. Destro et al. [24] studied the optimal design and management strategy of a tri-generation system with batteries and pumped hydro energy storage. To the authors’ knowledge, HESS has been an important part of improving power quality in renewable energy systems.
The capacity configuration of energy storage system affects total cost of the system and stability of the output. Several scholars have studied the ESS capacity allocation methods that are mainly classified as probabilistic, analytical and directed search-based methods [25]. Thus, probabilistic methods use the stochastic nature of renewable resources to optimize the size of ESS. For instance, Jia et al. [26] proposed a capacity statistical model composed of statistical analysis, time-domain simulation and a capacity determination algorithm. The capacity distribution of ESS was obtained by Monte Carlo simulation. Abbassi et al. [27] studied the capacity distribution of ESS in an autonomous PV/Wind power generation system. The statistical analysis of solar irradiance and wind speed cumulative levels was performed to determine the optimal size. However, analytical methods based on power system configuration analysis usually demand a lot of repeated calculations or simulations for their implementation. Additionally, Jacob et al. [28] proposed a sizing methodology using pinch analysis and design space for HESS in a PV-based micro-grid. The authors analyzed four different practical cases to illustrate the methodology. Esfahani et al. [29] studied capacity distribution of battery/hydrogen storages in PV-wind-biomass hybrid system. The authors used extended-power pinch analysis to determine the minimum required external electricity source, wasted electricity sources, and appropriate hydrogen storage system capacity. Directed search-based methods include mathematical optimization methods and heuristic methods. Compared to analytical methods, simulations in the entire configuration space may be unnecessary for obtaining the optimum solution in a computationally efficient manner. The optimization objectives among these directed search-based methods mainly include economic indicators [30,31,32,33] and stability indicators [31,33]. Berrueta et al. [30] designed a battery capacity optimization model with the objective of economic revenue maximization and solved it by employing dynamic programing and a region-elimination technique algorithm. Xu et al. [31] proposed a capacity optimization model for battery/supercapacitor system to maximize annual profit and minimize wind curtailment rate. Liu et al. [32] discussed the optimal sizing of SC/Battery HESS based on optimal energy management strategy for load-haul-dump vehicles (LHDs), which considered energy consumption and the total cost of HESS. Nojavan et al. [33] proposed bi-objective optimization model for optimal siting and sizing of an energy storage system in a microgrid, in which the total minimization cost and minimization of loss of load expectation (LOLE) were objectives.
There are significant differences in the daily output processes of PV power stations under different weather conditions, such as daily average output, fluctuation range and frequency, etc. In addition, the time ratios of multiple types of weather are different. Therefore, the impact of weather factors should be considered in the HESS configuration of PV power stations to improve applicability. Based on this, a hybrid method employing a statistical method to determine the power capacity of HESS and a mathematical model designed to determine the energy capacity of HESS considering system economy and output stability are proposed in this paper. The method considers the PV output characteristics and time ratios of four weather conditions (sunny, cloudy, rainy, snowy). Moreover, six HESS combinations consisting of two HPS (SC, Flywheel) and three HES (VRB, Li-ion, PbAc) were compared to determine the optimal energy storage combination. The Qinghai Gonghe PV power station was taken as a case study. The rest of the paper is structured as follows: Section 2 explains the sizing method of HESS; Section 3 presents a case study, including analysis of output characteristics and configuration result of HESS; Section 4 shows the concept of pre-storage and a sensitivity analysis; lastly, the conclusions are drawn in Section 5.

2. Methods of HESS Capacity Configuration

A statistical method was proposed to determine the power capacity of HESS and a mathematical model was developed to determine the energy capacity of HESS. As depicted in Figure 1, the framework of the method is as follows: Step1, the PV output of each typical weather condition was decomposed into target output curve, high frequency fluctuation and low frequency fluctuation; Step2, the high frequency fluctuation and low frequency fluctuation were analyzed considering the time ratio of each typical weather condition to determine the power capacity of HESS; Step3, a multi-objective mathematical model has been proposed considering system economy and output stability for the optimal sizing of the energy capacity of HESS.

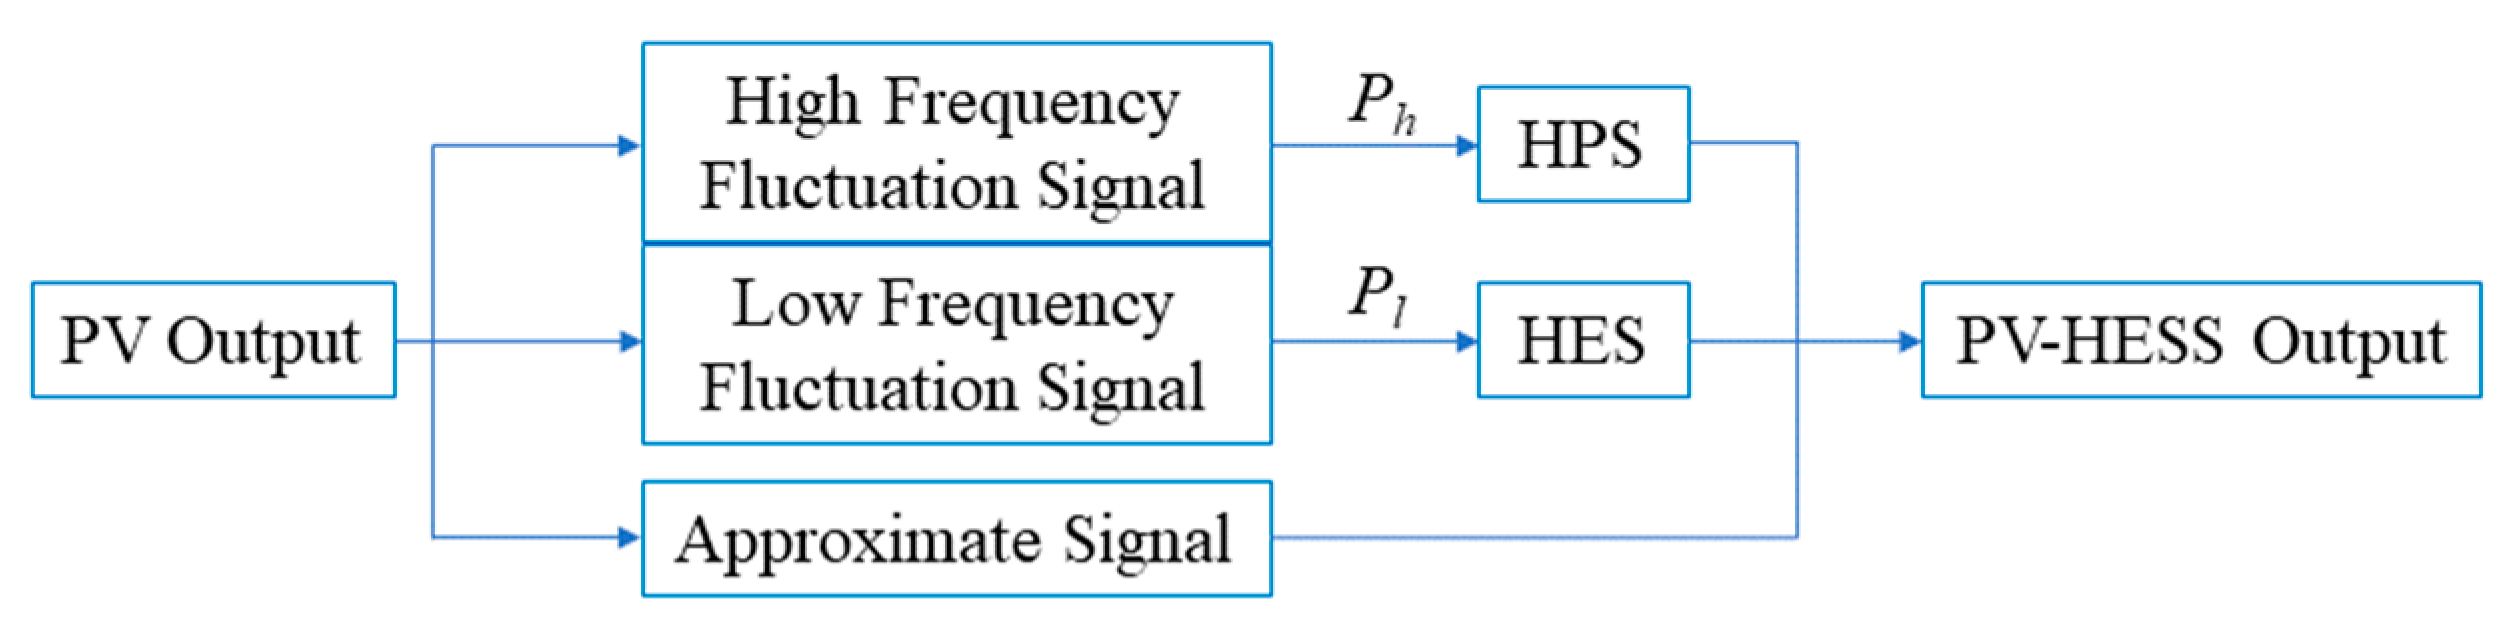
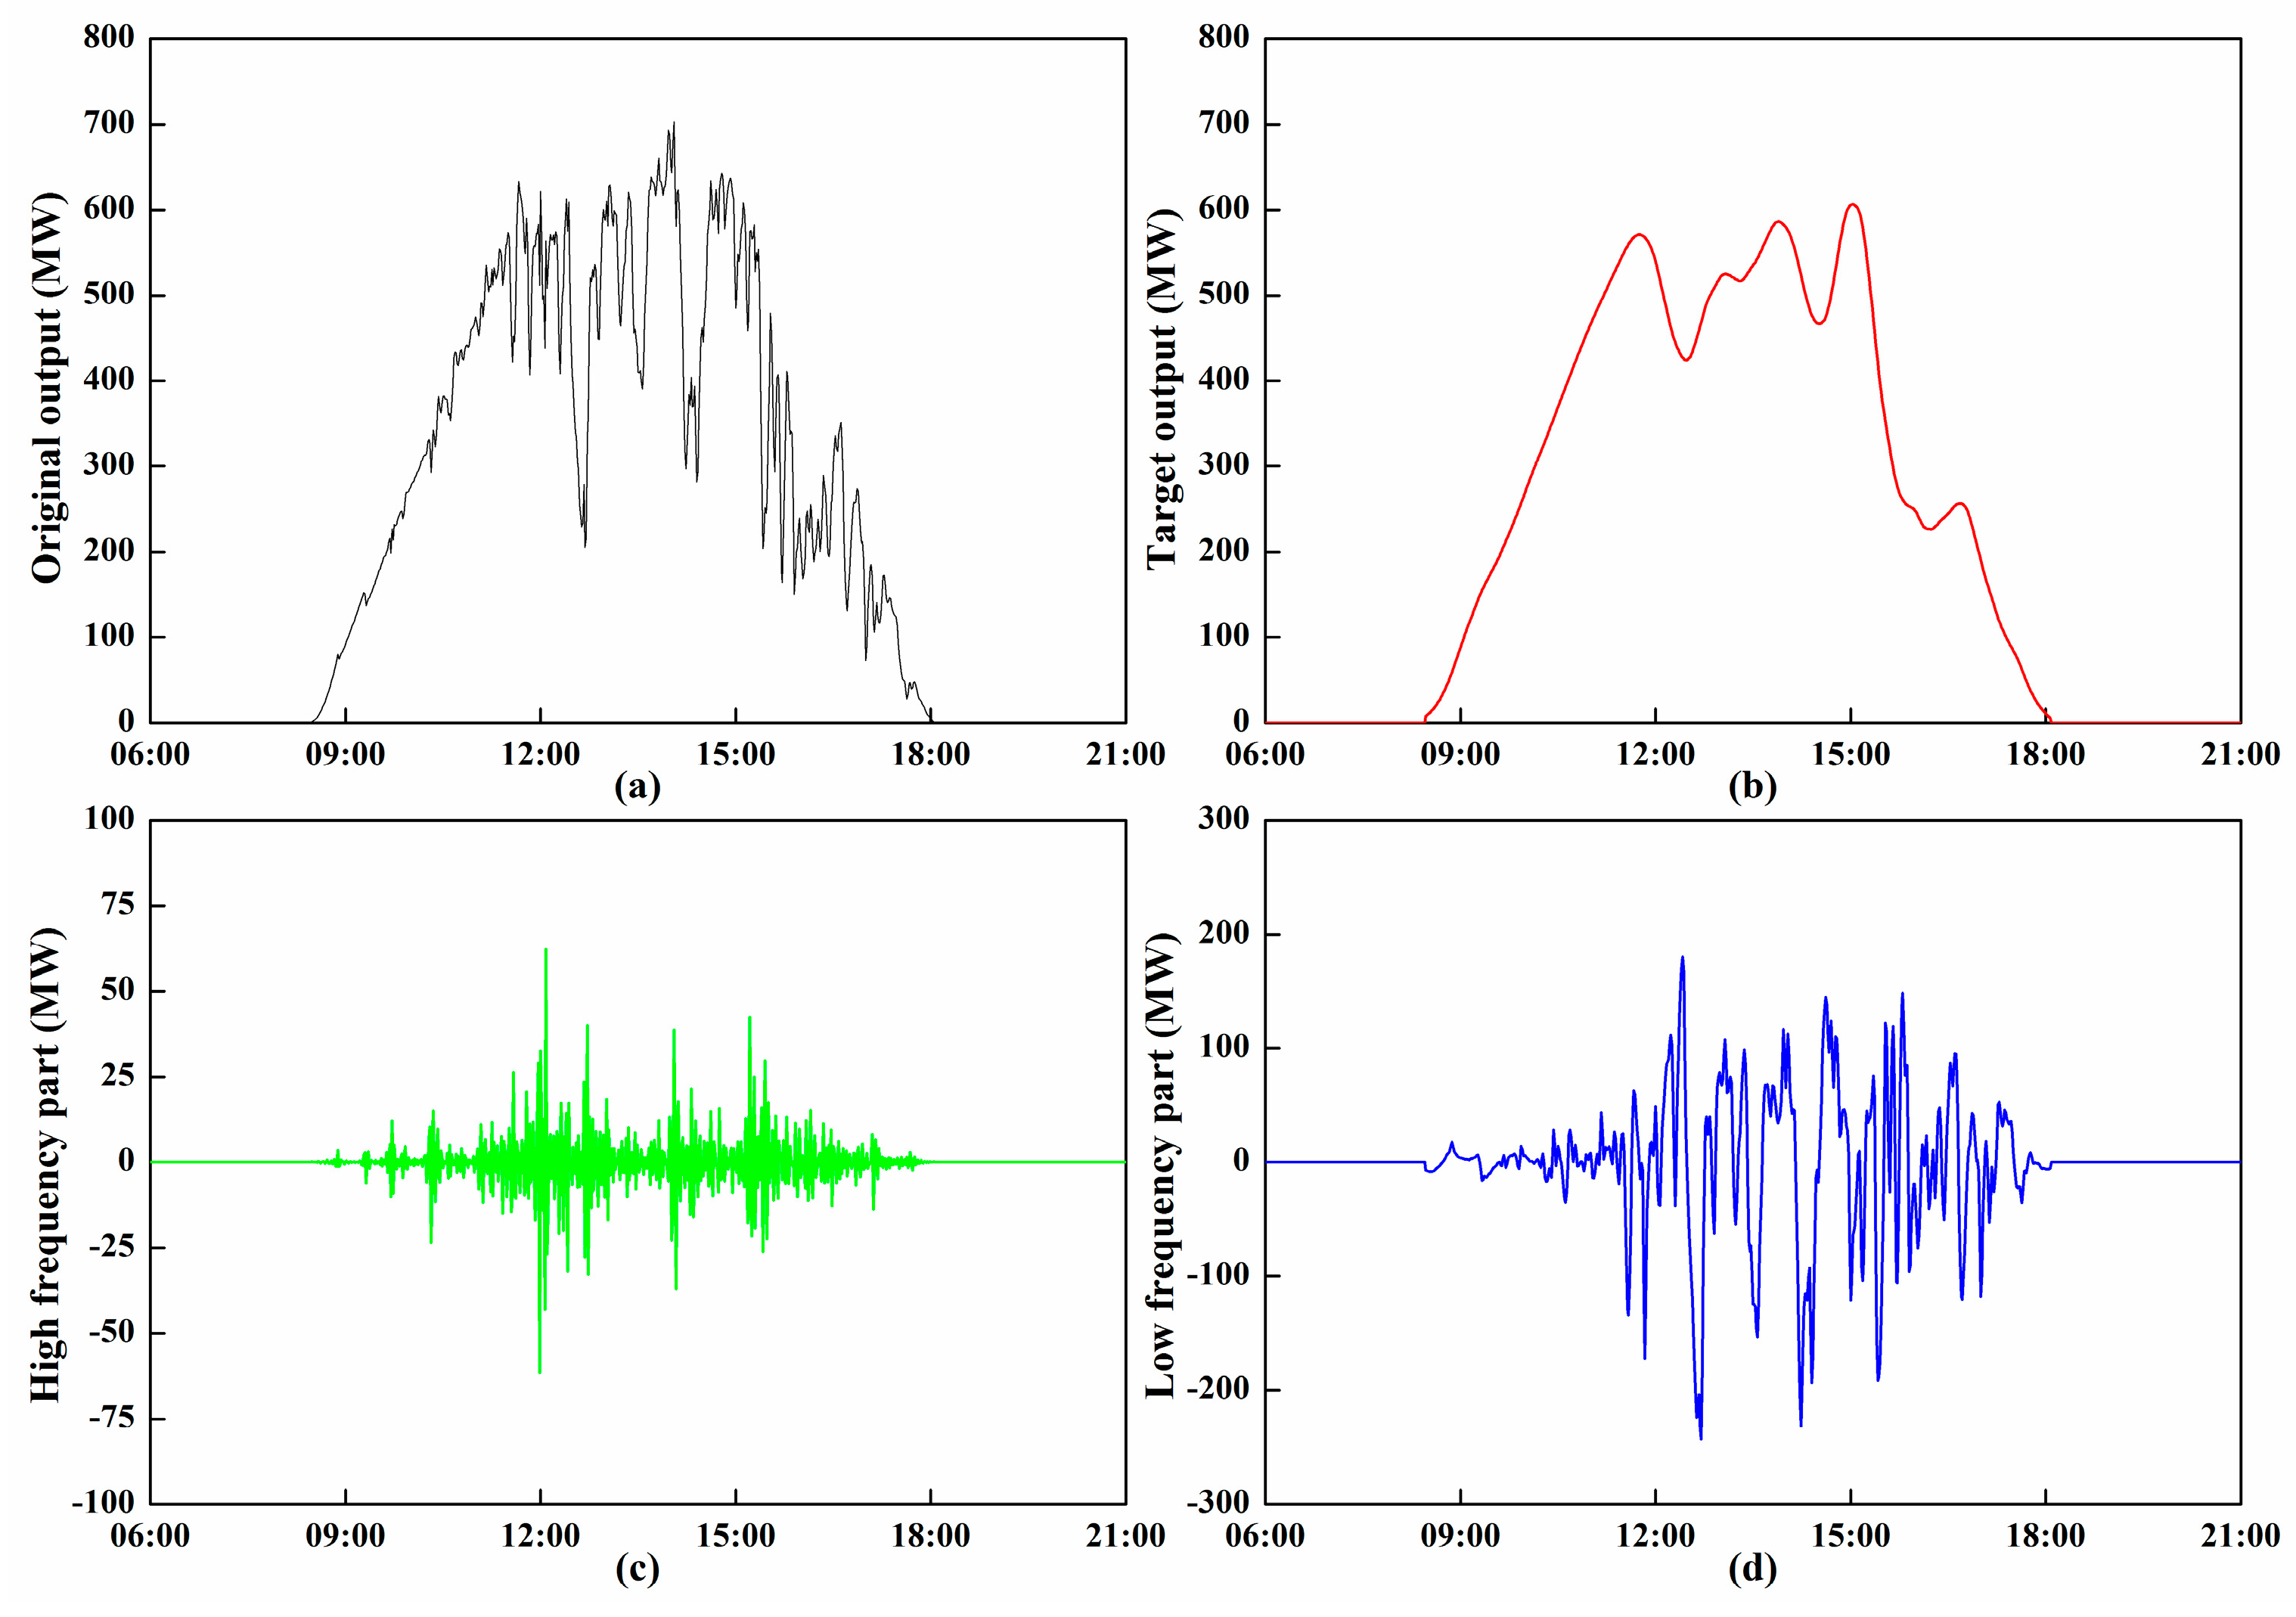
2.1. Decomposition of PV Outputs

Wavelet decomposition method was used to decompose the PV output into three parts: high frequency fluctuation signal, low frequency fluctuation signal and approximate signal, respectively. The first two signals have contrasting frequency and amplitude characteristics. However, the approximate signal is a smooth curve that reflects the overall trend of the original output. In addition, it is used as the target output delivered to the grid for a PV power station. Consequently, HESS in this study only needs to smoothen deviation fluctuations from the approximate signal. As shown in Figure 2, Ph and Pl are the power values of high and low frequency fluctuation signal, respectively. HPS and HES can eliminate fluctuations by tracking the power command from Ph and Pl respectively, thus bringing the PV-HESS output close to the approximate signal.

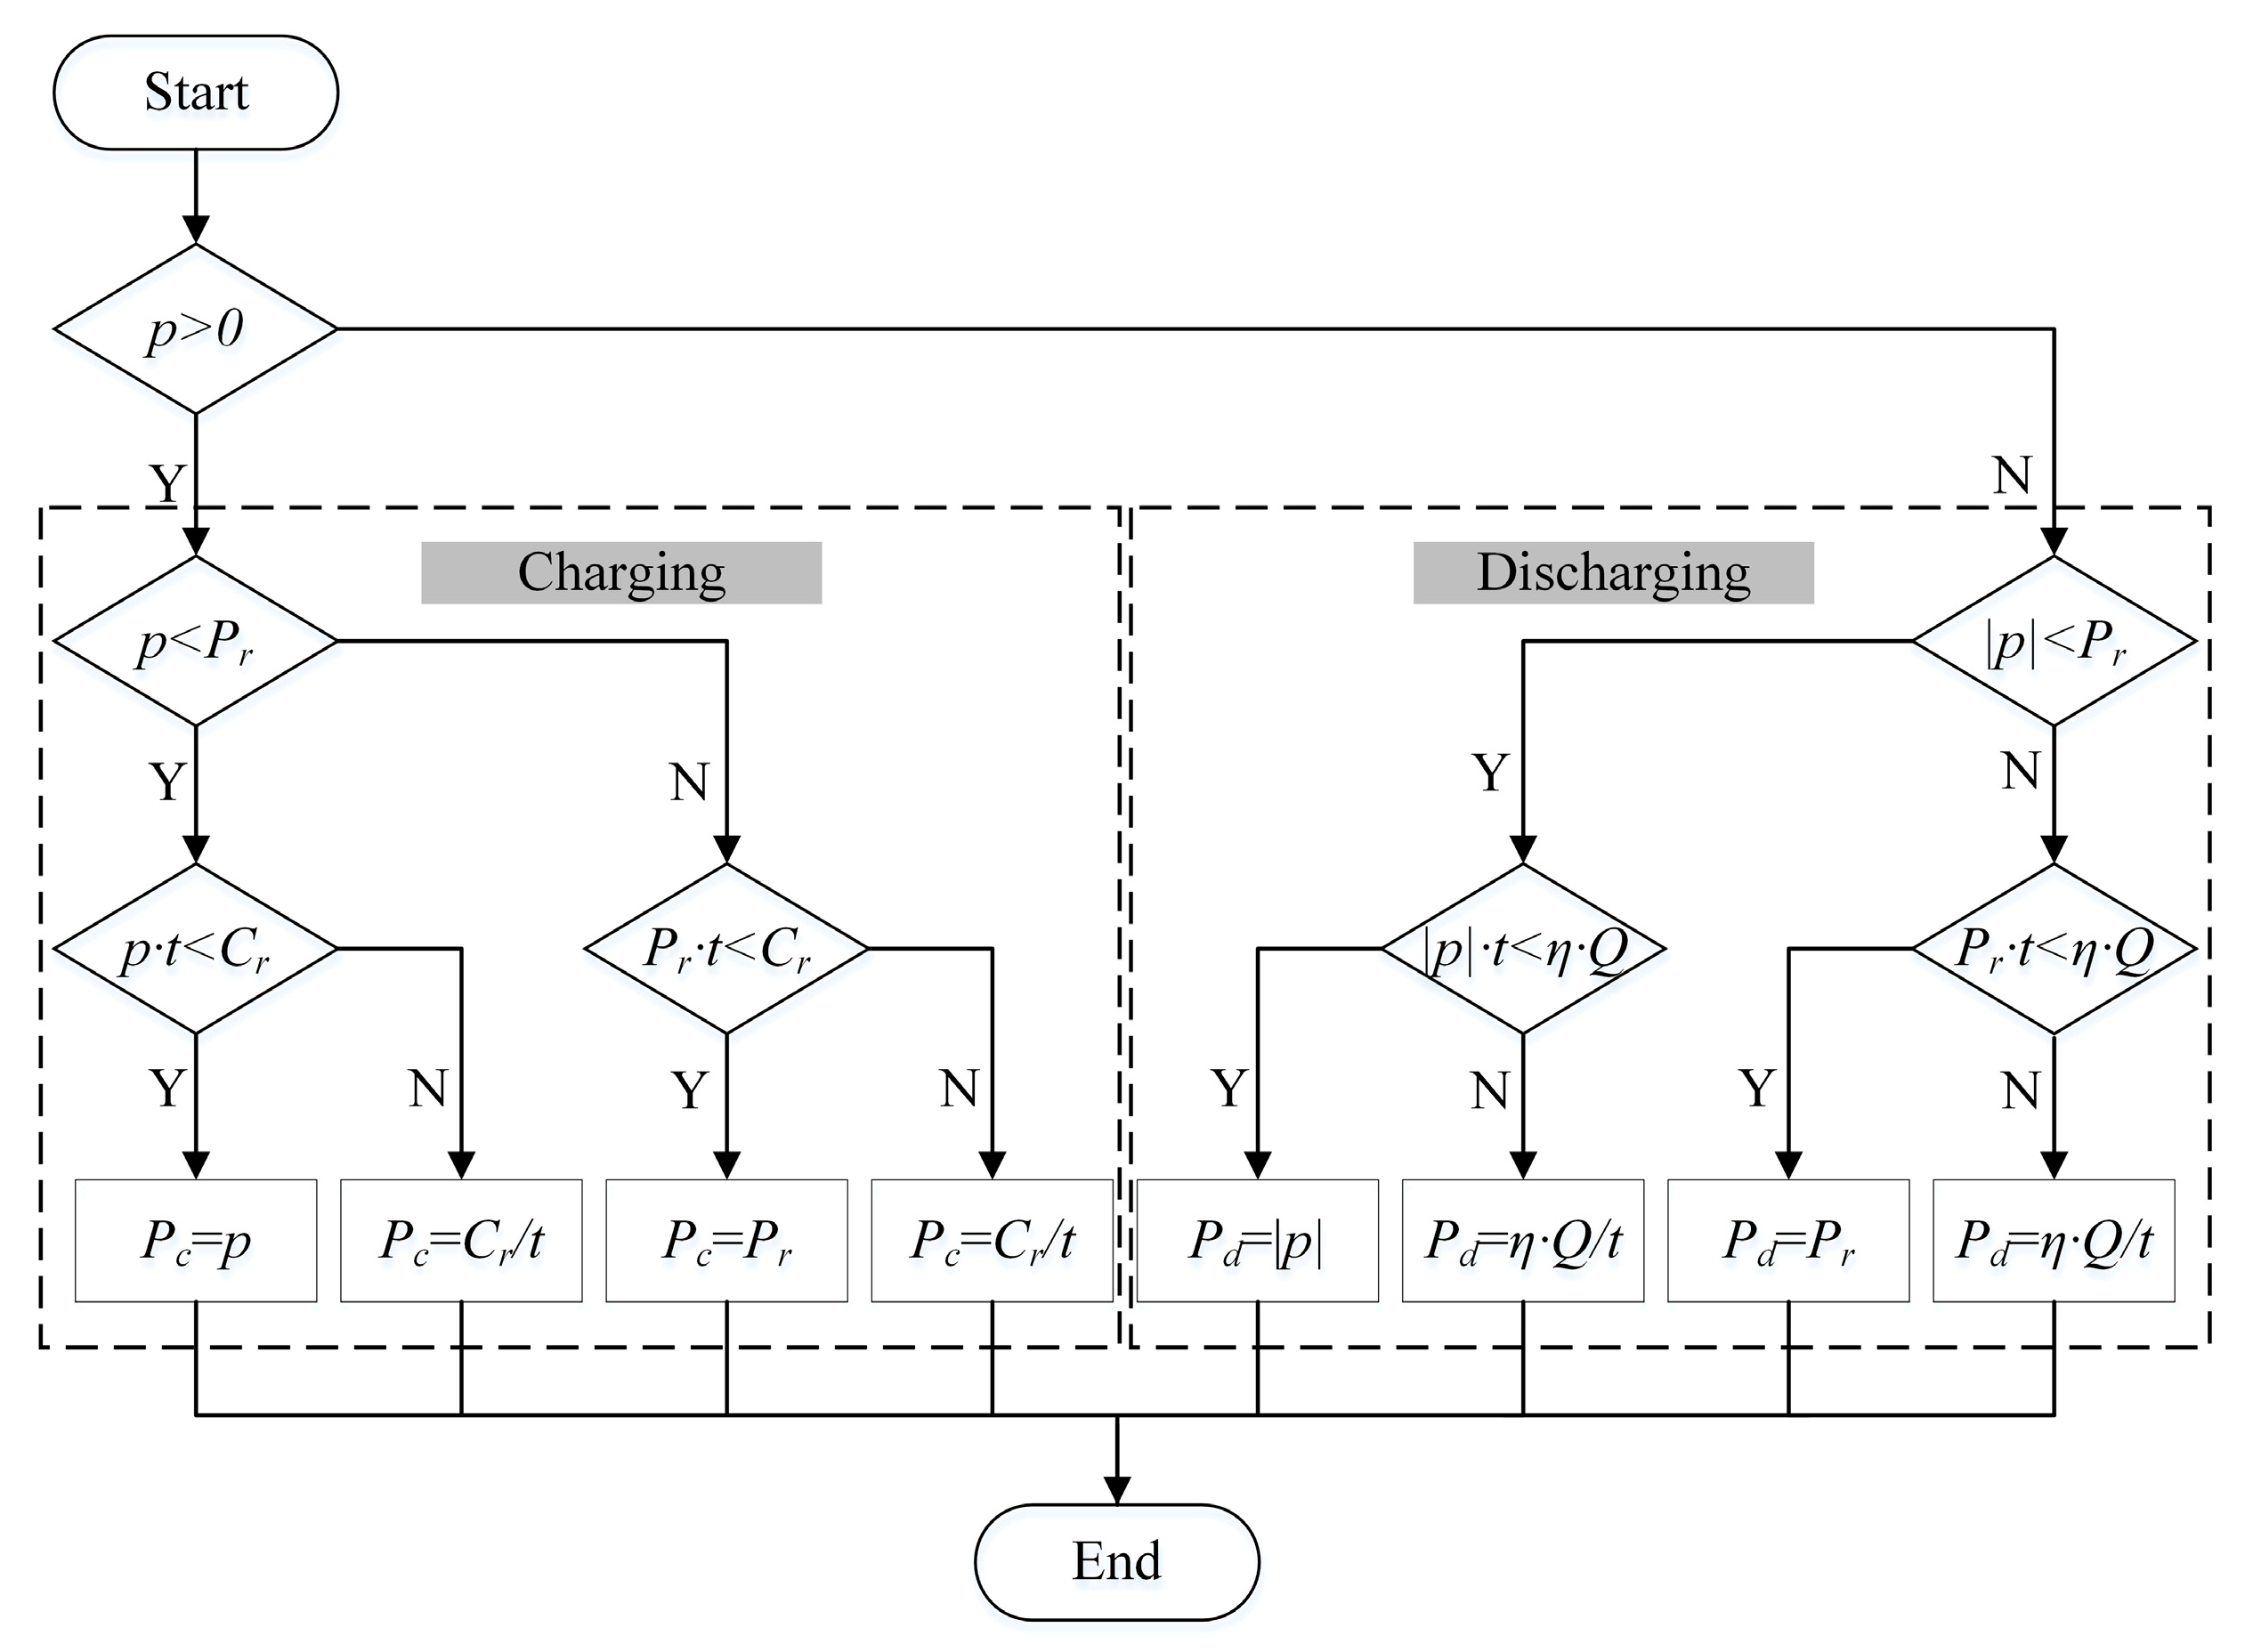
2.2. Determination of Power Capacity of HESS

For the determination of power capacities of HPS and HES, high/low frequency fluctuation data of typical weather conditions from decomposition was expanded to Dh/Dl by duplication with the time ratio of each weather condition as weighting factors, as shown in Equation (1). Then t Location-Scale distribution with good fitting effect [34] was used to fit the probability density curve to Dh and Dl, respectively, and the probability density function is shown in Equation (2). Thereby, the confidence intervals at different confidence levels can be calculated, and the maximum absolute value of boundary value at the selected confidence level was obtained as the power capacity, as shown in Equation (3).
{ D h = { ( F h s u , F h s u , 100 · w s u ) , ( F h c , F h c , 100 · w c ) , ( F h r , F h r , 100 · w r ) , ( F h s n , F h s n , 100 · w s n ) } D l = { ( F l s u , F l s u , 100 · w s u ) , ( F l c , F l c , 100 · w c ) , ( F l r , F l r , 100 · w r ) , ( F l s n , F l s n , 100 · w s n ) }
f ( x ) = Γ ( ν + 1 2 ) σ ν π Γ ( ν 2 ) [ ν + ( x μ σ ) 2 ν ] ( ν + 1 2 )
{ P C H P S = m a x { | B h , α l e f t | , | B h , α r i g h t | } P C H E S = m a x { | B l , α l e f t | , | B l , α r i g h t | }
where Dhigh and Dlow are the dataset of high and low frequency fluctuations; F h s u / F h c / F h r / F h s n are high frequency fluctuations of sunny/cloudy/rainy/snowy day respectively; F l s n / F l c / F l r / F l s n are low frequency fluctuation of sunny/cloudy/rainy/snowy day respectively; wsu/wc/wr/wsn are the time ratio of sunny/cloudy/rainy/snowy day in a year respectively, %; Γ(.) refers to the gamma function; −∞ < μ < + ∞, σ > 0, and v > 0 are, respectively, the parameters of location, scale, and shape; PCHPS and PCHES are the power capacity of HPS and HES, MW; B h , α l e f t and B h , α r i g h t are the left and right boundary value at α confidence value for high frequency fluctuation; B l , α l e f t and B l , α r i g h t are the left and right boundary value at α confidence level for low frequency fluctuation.

2.3. Optimal Energy Capacity Configuration Model

In this section, a multi-objective optimization model is proposed to determine the energy capacity of HESS. Objective functions, decision variables, constraints and Energy storage device control strategy have been described as follows. The standard genetic algorithm (GA) was selected to solve the model. The number of individuals in the initial population was 200 and the number of evolutions was 100. The selection probability, crossover probability and mutation probability were 0.05, 0.40 and 0.03, respectively.
(1) Objectives
The first objective is to minimize the life cycle cost of HESS including the installation cost and replacement cost, as expressed in Equation (4).
f 1 = m i n i m i z e i = 1 2 P i s · C i · ( 1 + λ · N i )
where P i s is the system cost of the ith energy storage device, CNY/kWh; Ci is the energy capacity of the ith energy storage device, kWh; λ is the ratio of replacement cost to installation cost, λ = 60% in this paper; Ni is the replacement times of the ith energy storage device in the life cycle of PV power station and can be calculated by Equation (5):
N i = j = 1 4 S i , j · w j · O p · 365 D O D i · C i · c y i 1
where Si,j is the stored electric quantity of the ith energy storage device under the jth typical weather condition, kWh; wj is the time ratio of the jth typical weather condition in a year; Op is the operation period of the PV power station, year; DODi is the depth of discharge of the ith energy storage device, %; cyi is the whole life cycle number of the ith energy storage device.
The second objective function is to maximize target output satisfaction rate, given by Equation (6):
f 2 = m a x i m i z e j = 1 4 [ ( k = 1 n j δ j , k ) · w j ] T ¯ · 60
where nj is the minute number of power generation under the jth typical weather condition; δj,k is a coefficient that determines whether the PV-HESS output value is equal to target output value in the kth minute under the jth typical weather condition determined by Equation (7); T ¯ is daily mean output duration, h.
δ j , k = { 1             i f     p j , k = p j , k t 0             i f     p j , k p j , k t
where pj,k is the PV-HESS output value in the kth minute under the jth typical weather condition, kW; p j , k t is the target output value in the kth minute under the jth typical weather condition, kW.
(2) Constraints
The two main constraints in this model are the electric quantity balance constraint, given by Equation (8), and the maximum charging and discharging power constraint, given by Equation (9).
E i , j , k = η i · S i , j , k
where Ei,j,k is the generated energy of the ith energy storage device in the kth minute under the jth typical weather condition, kWh; ƞi is the conversion efficiency of the ith energy storage device, %; Si,j,k is the consumed energy of the ith energy storage device in the kth minute under the jth typical weather condition, kWh.
P i , j , k P r i
where Pi,j,k is the output value of the ith energy storage device in the kth minute under the jth typical weather condition, kW; Pri is the rated power of the ith energy storage device determined in Section 2.2.
(3) Energy storage device control strategy
To model the energy storage system, the authors propose a control strategy applied to both HPS and HES, presented by Figure 3. Thus, the input is the power of high/low frequency fluctuation. Therefore, when p > 0, it means there is excess power and the excess electric quantity needs to be charged into energy storage device. In charging process, it is necessary to consider whether p exceeds the rated power and/or if the residual capacity of the energy storage device is sufficient. Conversely, p < 0 represents power shortage and the energy storage device must be discharged to compensate for the shortage of electric quantity. In the discharging process, the limits of the rated power and residual electric quantity are considered.
In Figure 3, p is the power of high/low frequency fluctuation, kW; Pr is the rated power of energy storage device; Pc is the charging power of energy storage device, kW; Pd is the discharging power of the energy storage device, kW; Cr is the residual capacity of energy storage device, kWh; Q is the residual electric quantity of energy storage device, kWh; t is the time step, h.

3. Case Study

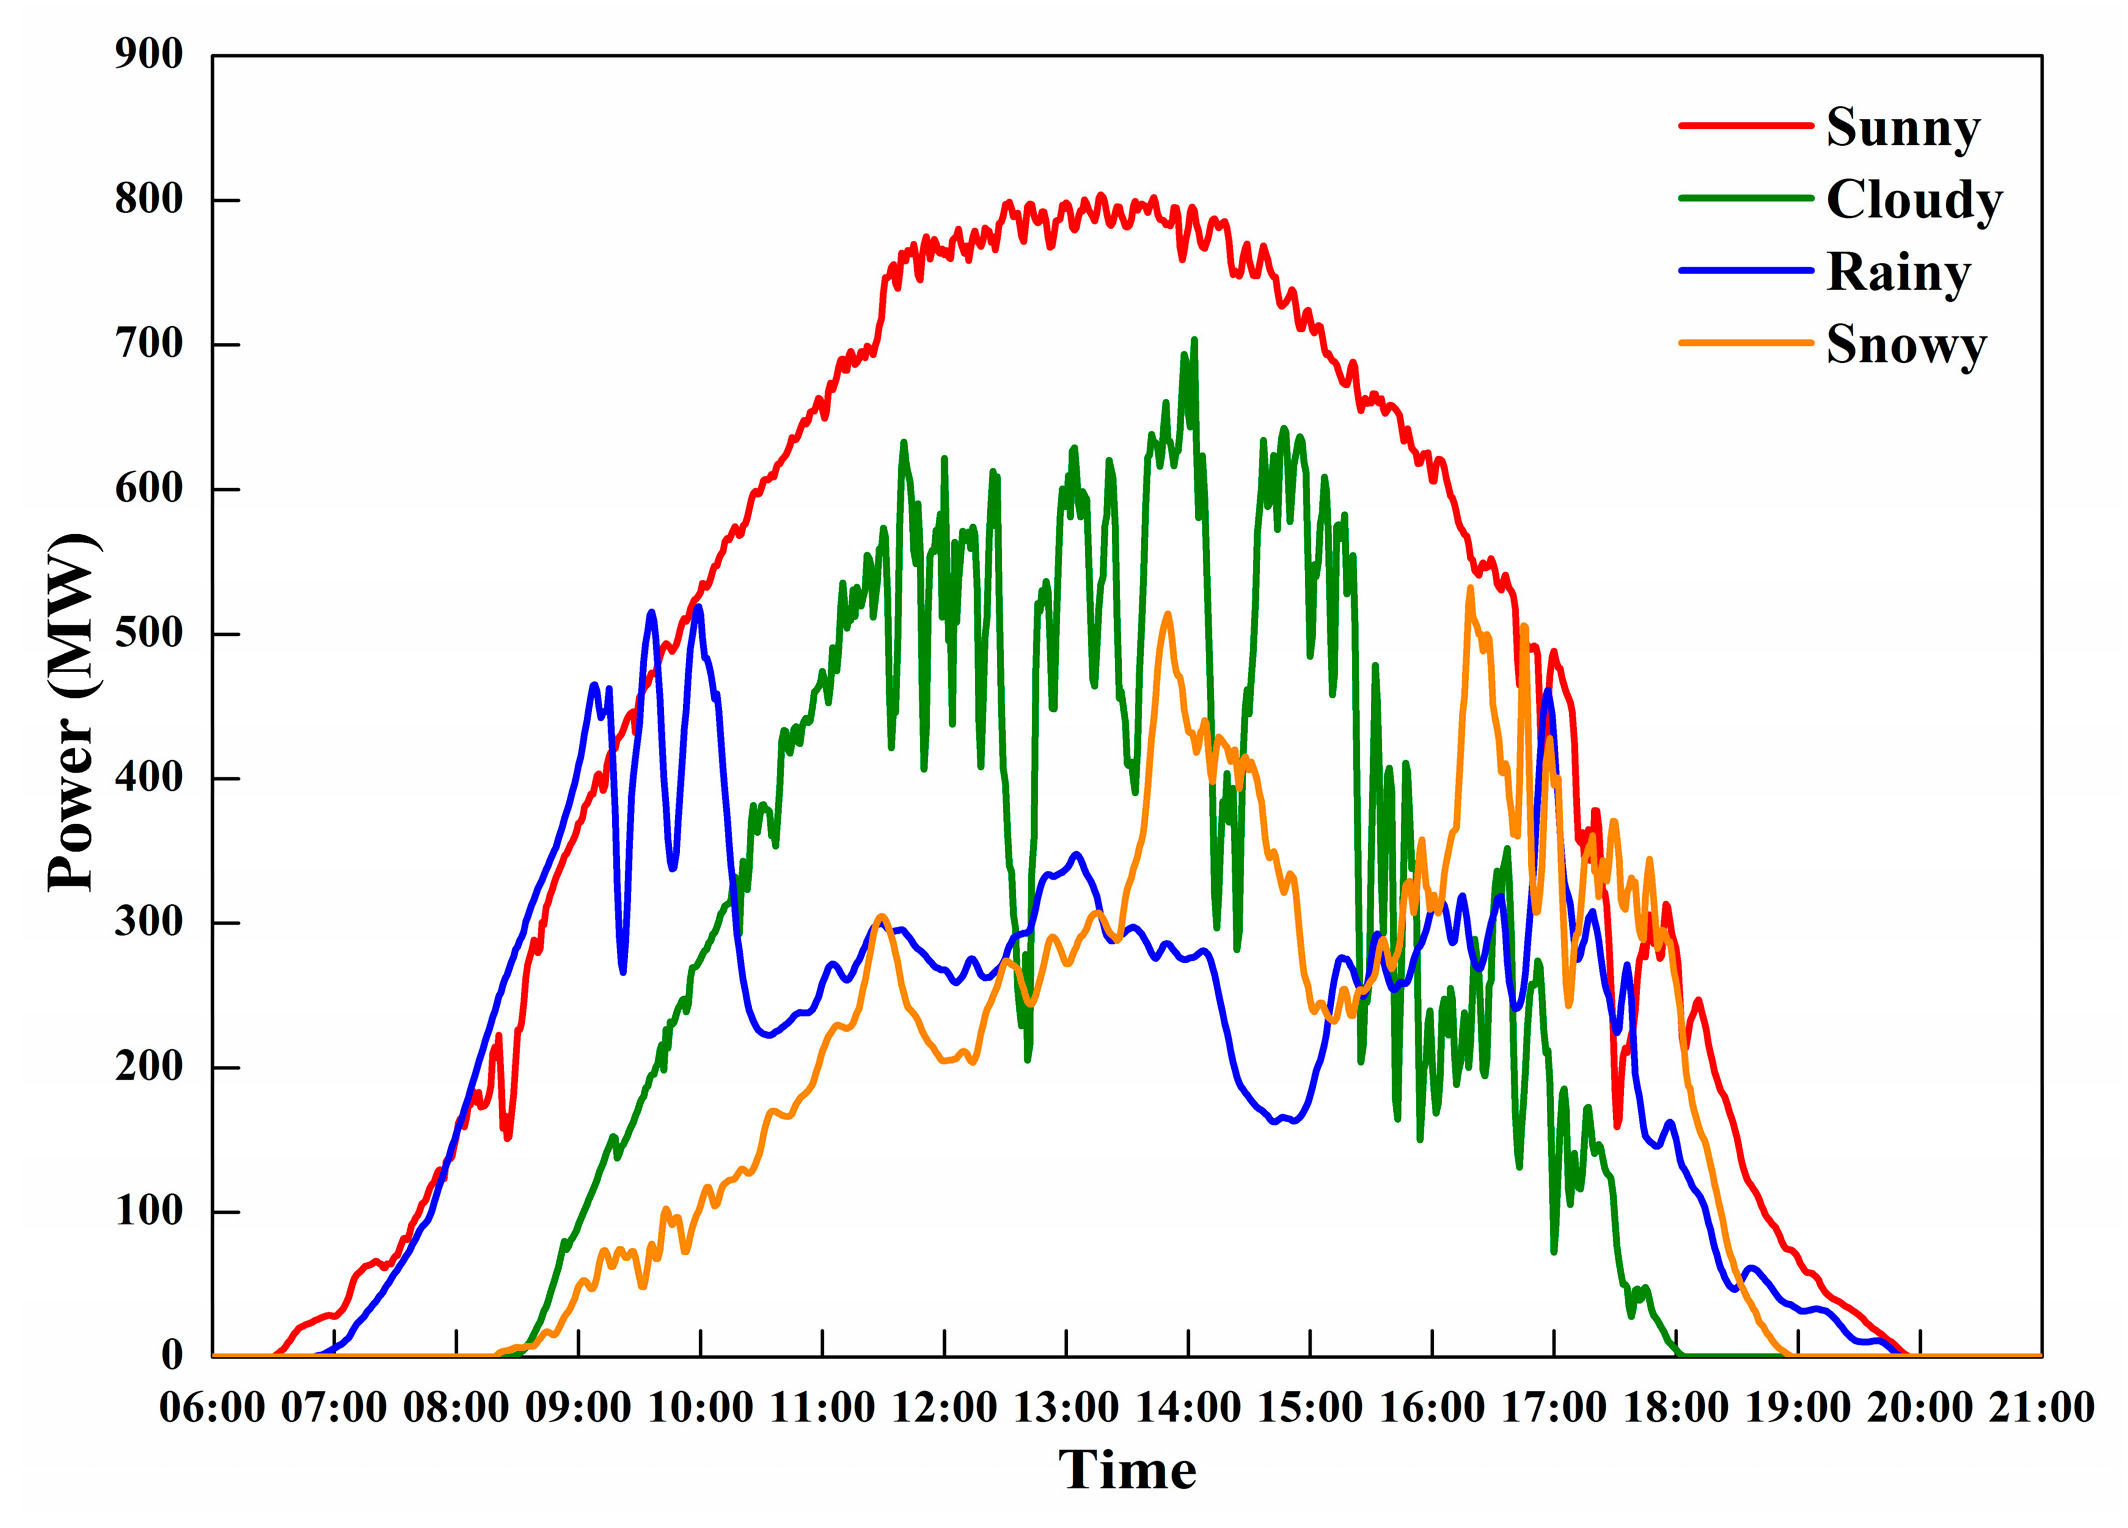
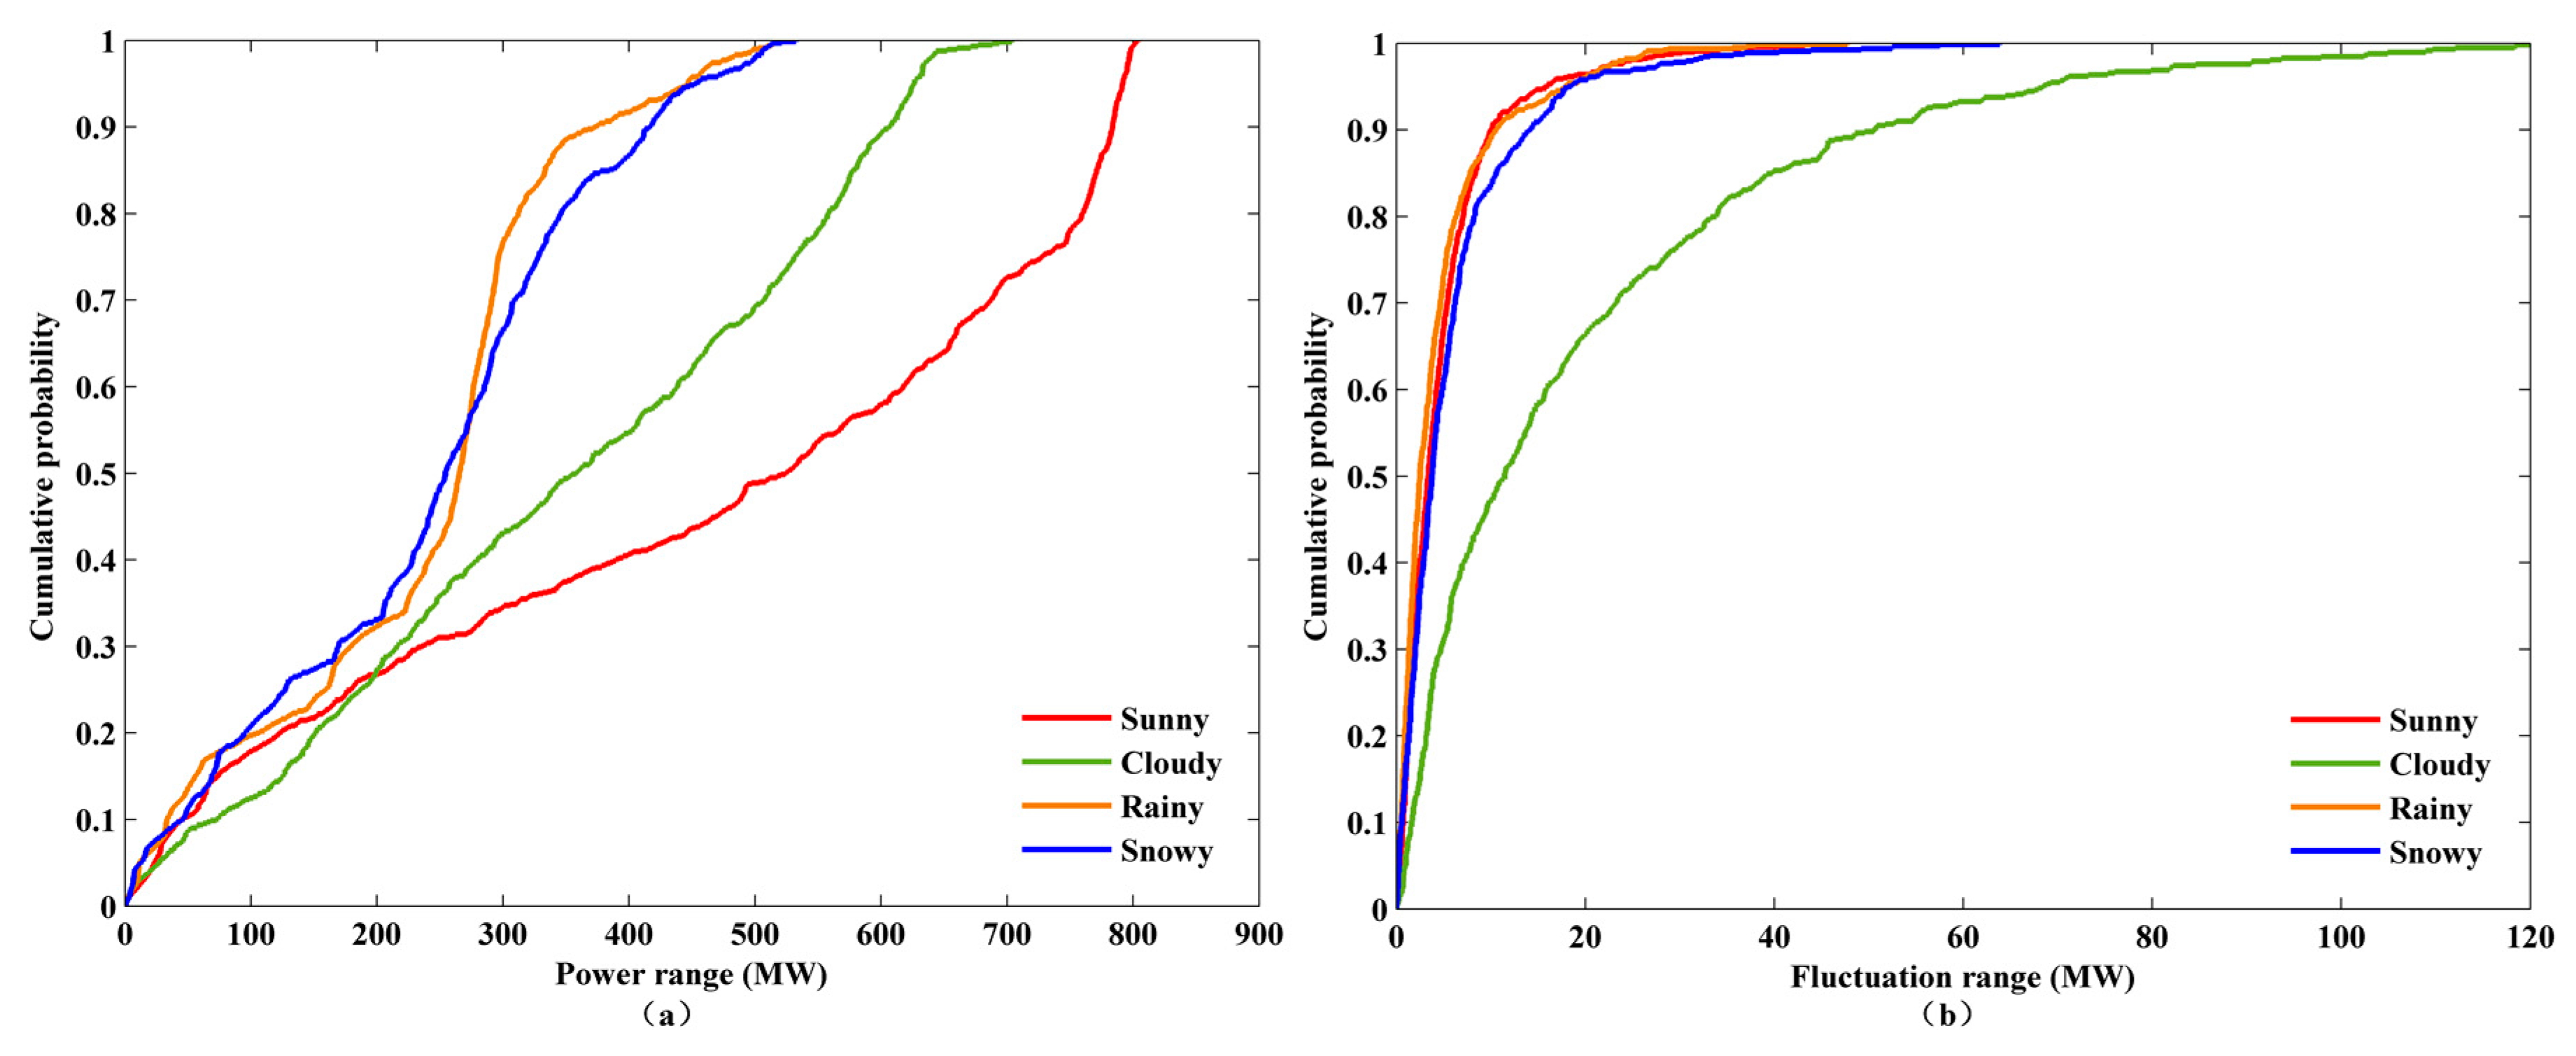
3.1. Characteristics of PV Output

The Gonghe PV power station in Qinghai province, China, was adopted as a case study to illustrate the design procedure of HESS. The total installed capacity of Gonghe PV power station is 850 MW. To reduce the simulation time, a few representative days were used instead of all 365 days. Thus, from the 1-min photovoltaic output data for one year, the most volatile output curve of each weather type was selected as the typical output through statistical analysis of the probability distribution of each day’s output fluctuation, which improved the adjustment ability of HESS. It can be observed from Figure 4 that weather has a significant impact on PV outputs, with a relatively stable sunny PV output as compared to the other outputs, which fluctuate frequently. The probability distributions of PV power and fluctuation of the four typical outputs that can reflect PV output characteristic under different weather conditions are presented in Figure 5. As shown in Figure 5a, there is great variation in PV power range in different weather conditions, and PV output is reduced significantly on rainy and snowy days. Figure 5b shows that PV output fluctuates considerably in cloudy days. To consider the impact of weather factors accurately, the time ratio of the four weather conditions was computed based on one-year meteorological data, given by Table 1.

3.2. Decomposition of PV Outputs

By using the db6 wavelet function in Matlab, the PV outputs of the four typical weather conditions were decomposed into three parts: target output, high frequency fluctuation and low frequency fluctuation, respectively. As an example, the decomposition result of the cloudy day is shown in Figure 6. As depicted in Figure 6, the target output is a smooth curve and is more stable than the original output between 11:00–18:00, while a large number of fluctuations with short amplitude can be observed for the high frequency fluctuation analysis with contrasting results being obtained in the low frequency fluctuation analysis.

3.3. Determination of Power Capacity

By using the method described in Section 2.2, the statistics for high and low frequency fluctuation data were obtained, as shown in Figure 7. According to the probability density curves in Figure 7, the power capacities, the maximum absolute values of boundary values, of HPS and HES at different confidence levels are shown in Figure 8. It can be observed from Figure 8 that both power capacities of HPS and HES surged after 95%, due to a small number of large fluctuations in both the high and low frequency fluctuations. In this study, the 95% confidence level was selected.

3.4. Energy Storage Combinations of HESS

To equip a more suitable HESS for PV power station, several commonly used energy storage devices were selected in this paper, including two HPS (SC, Flywheel) and three HES (VRB, Li-ion, PbAc), thus forming six different HESS combination schemes. In addition, the parameters of the energy storages involved in the optimal energy capacity configuration model are listed in Table 2.

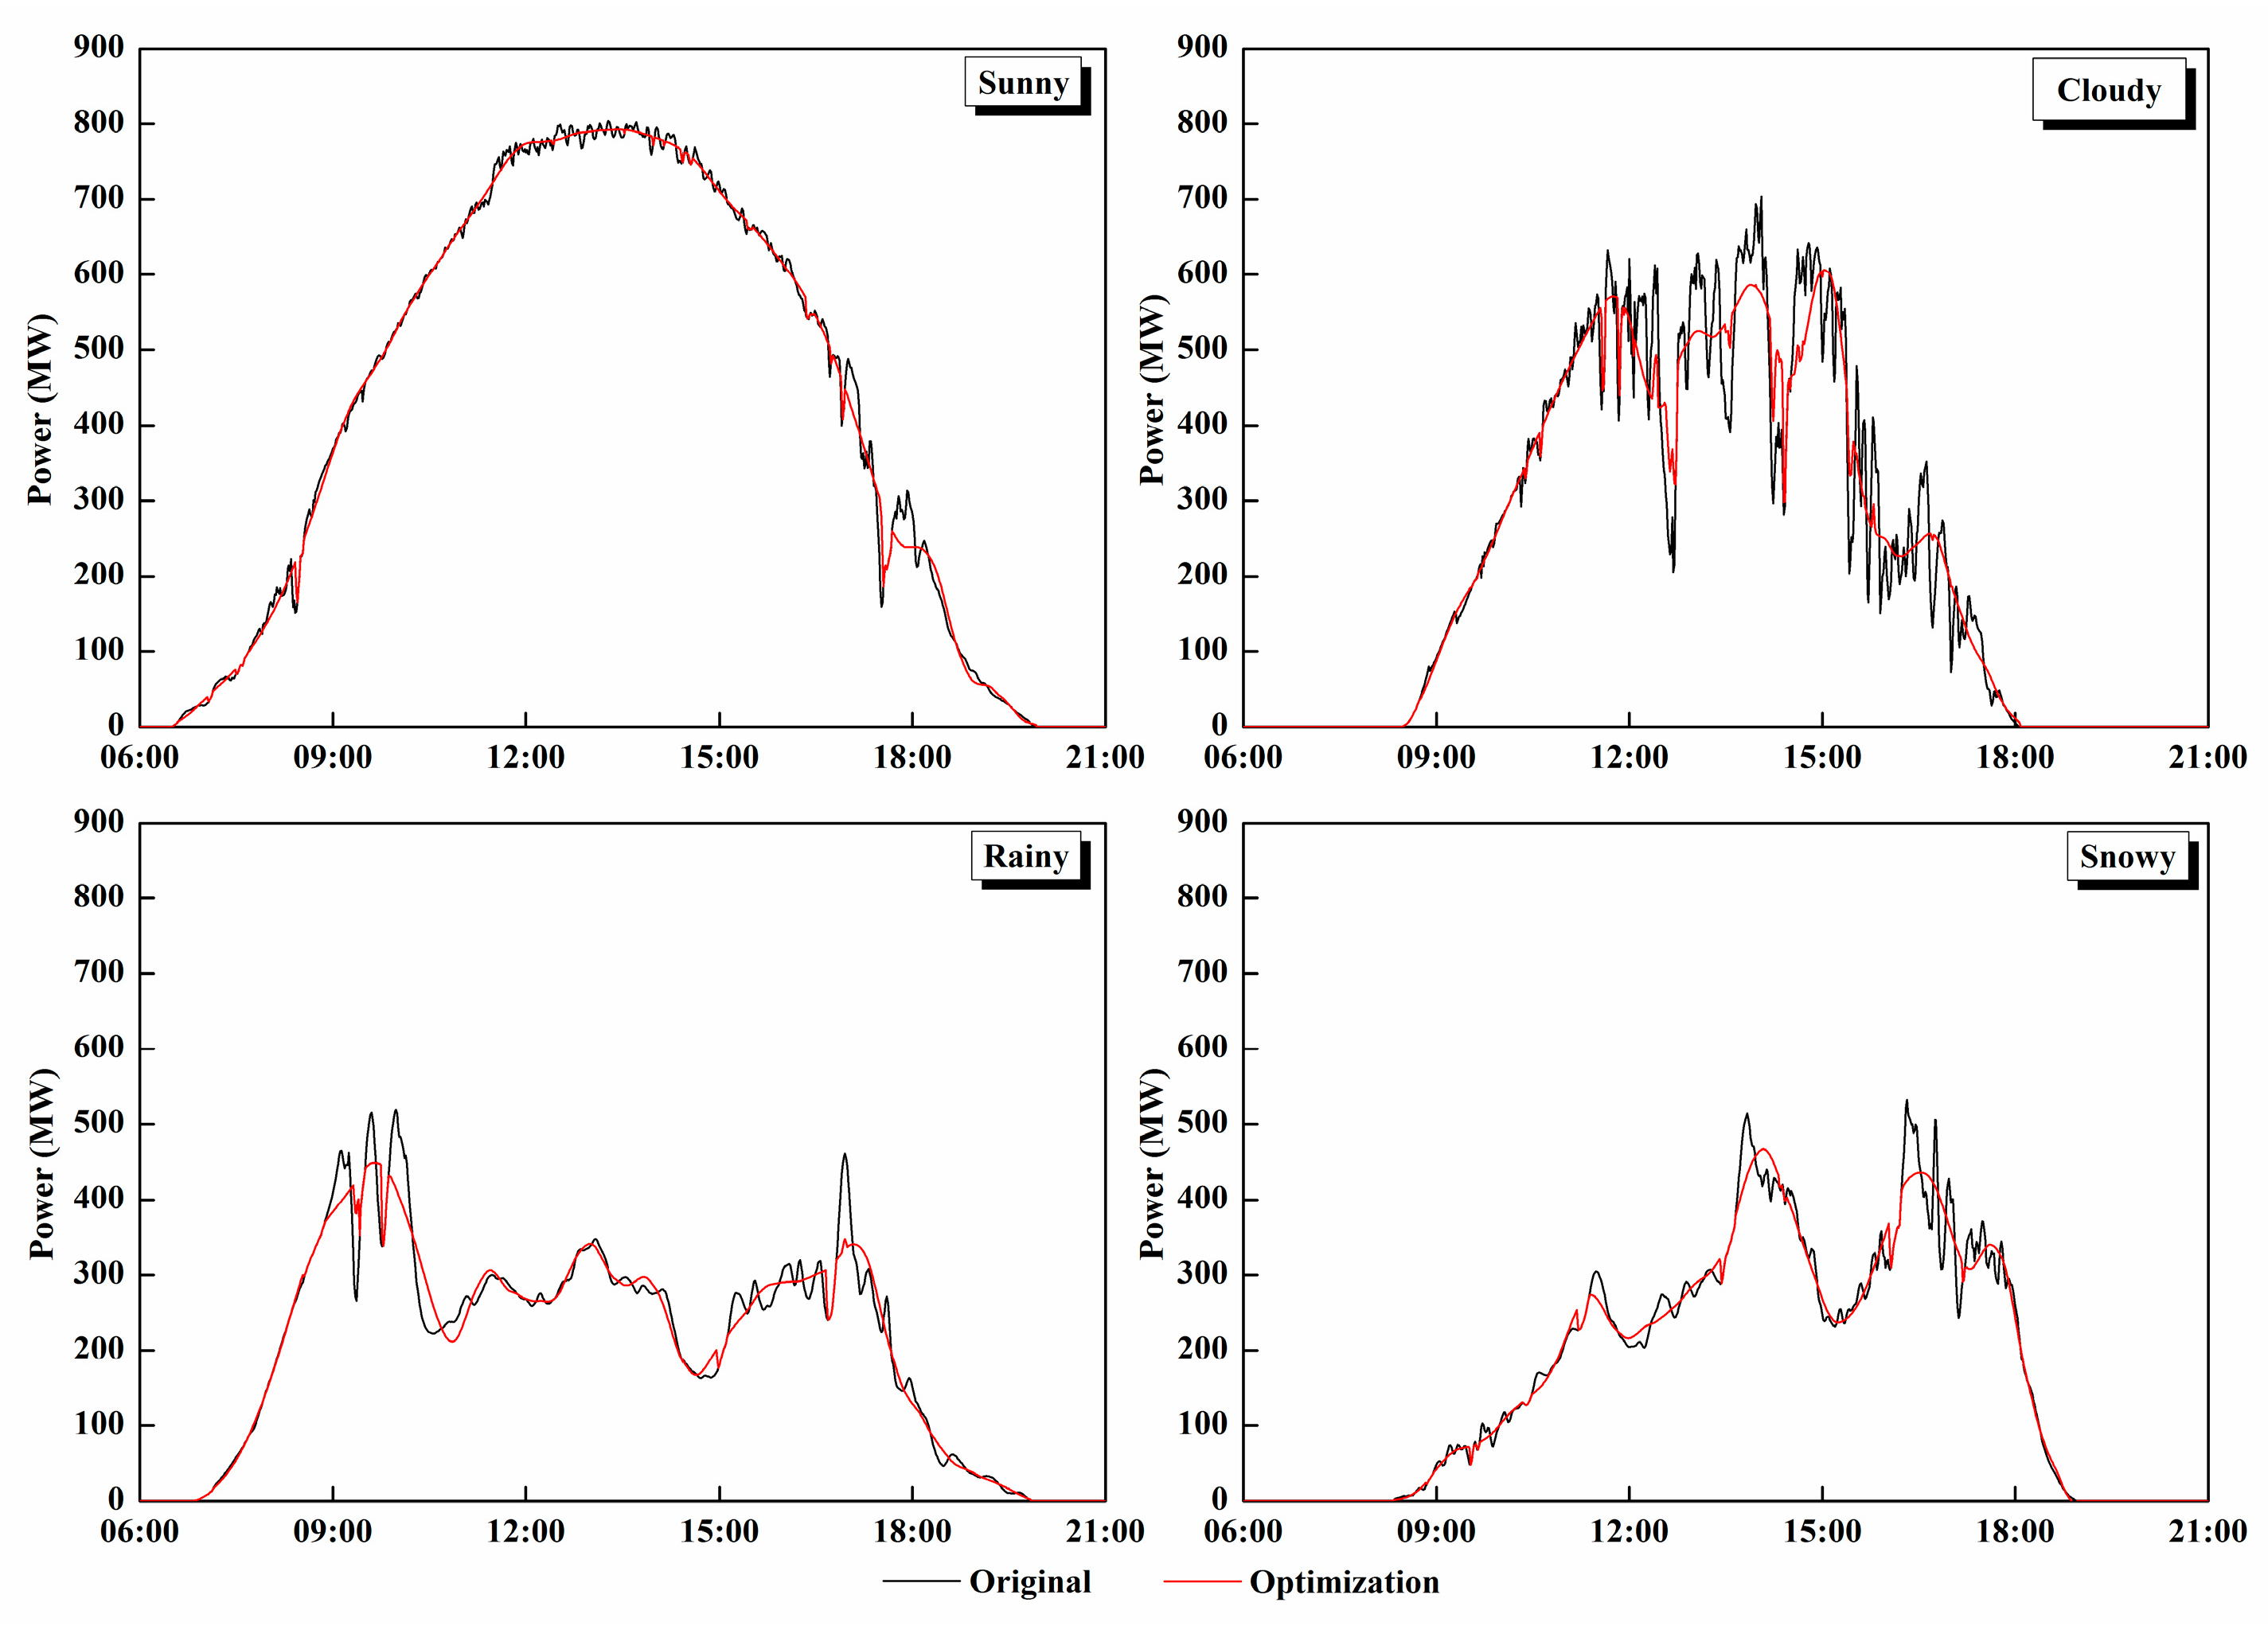
3.5. Optimization Results

Based on the obtained data and results, the optimal energy capacity configurations of the six combination schemes were calculated by the multi-objective optimization model proposed in Section 2.3, and the results are shown in Table 3. The target output satisfaction rate of the six combination schemes was similar, with a difference of less than 3.5%. However, the replacement times and life cycle cost varied greatly. Comparing two types of HPS, no difference in their energy capacities can be observed, but the replacement times of Flywheel is 6 times more than SC due to its short life cycle. Comparing three types of HES, because of the shallow depth of discharge and the short life cycle of PbAc, both replacement times and life cycle cost are the largest; the Li-ion has high round trip efficiency, with highest target output satisfaction rate; VRB’s target output satisfaction is the lowest, but both the replacement times and the life cycle cost are the lowest. In general, there is a slight difference in target output satisfaction rate of each combination, hence the SC-VRB was selected as the final solution due to its lowest replacement times and life cycle cost. Therefore, the optimal HESS configuration scheme is “SC (5.56 MW/0.57 MWh) + VRB (112.85 MW/40.61 MWh)”. As shown in Figure 9, adopting SC-VRB can reduce the output fluctuations significantly and obtain the expected stable output process. Furthermore, the number of PV output fluctuations decreased by 81.55% in sunny day, 68.97% in cloudy day, 61.29% in rainy day and 71.43% in snowy day for the SC-VRB scheme.
Some local parts of the optimization output curves still have fluctuations because of insufficient power resulting from excessive fluctuations and insufficient electric quantity due to the 0 daily initial storage and energy loss of HESS. As shown in Figure 10, low frequency fluctuations on sunny, rainy and snowy days are below VRB-rated power most of the time; thus, the fluctuations not tracked by VRB are mainly caused by the lack of energy in contrast to a cloudy day. As such, numerous excessive fluctuations that exceed the rated power of the VRB, which is due to the high power and high fluctuation frequency of PV output can be observed during cloudy days. As a remedy, two methods can be used to alleviate the effects of these excessive fluctuations: one is to limit the power exceeding the rated power by power curtailment [35], but this method cannot solve the power shortage of the fluctuation; the other method is to increase the power capacity of the energy storage device, which will significantly increase the cost. In the future, the improvement of energy storage technology and the further reduction of costs will alleviate this problem.

4. Discussion

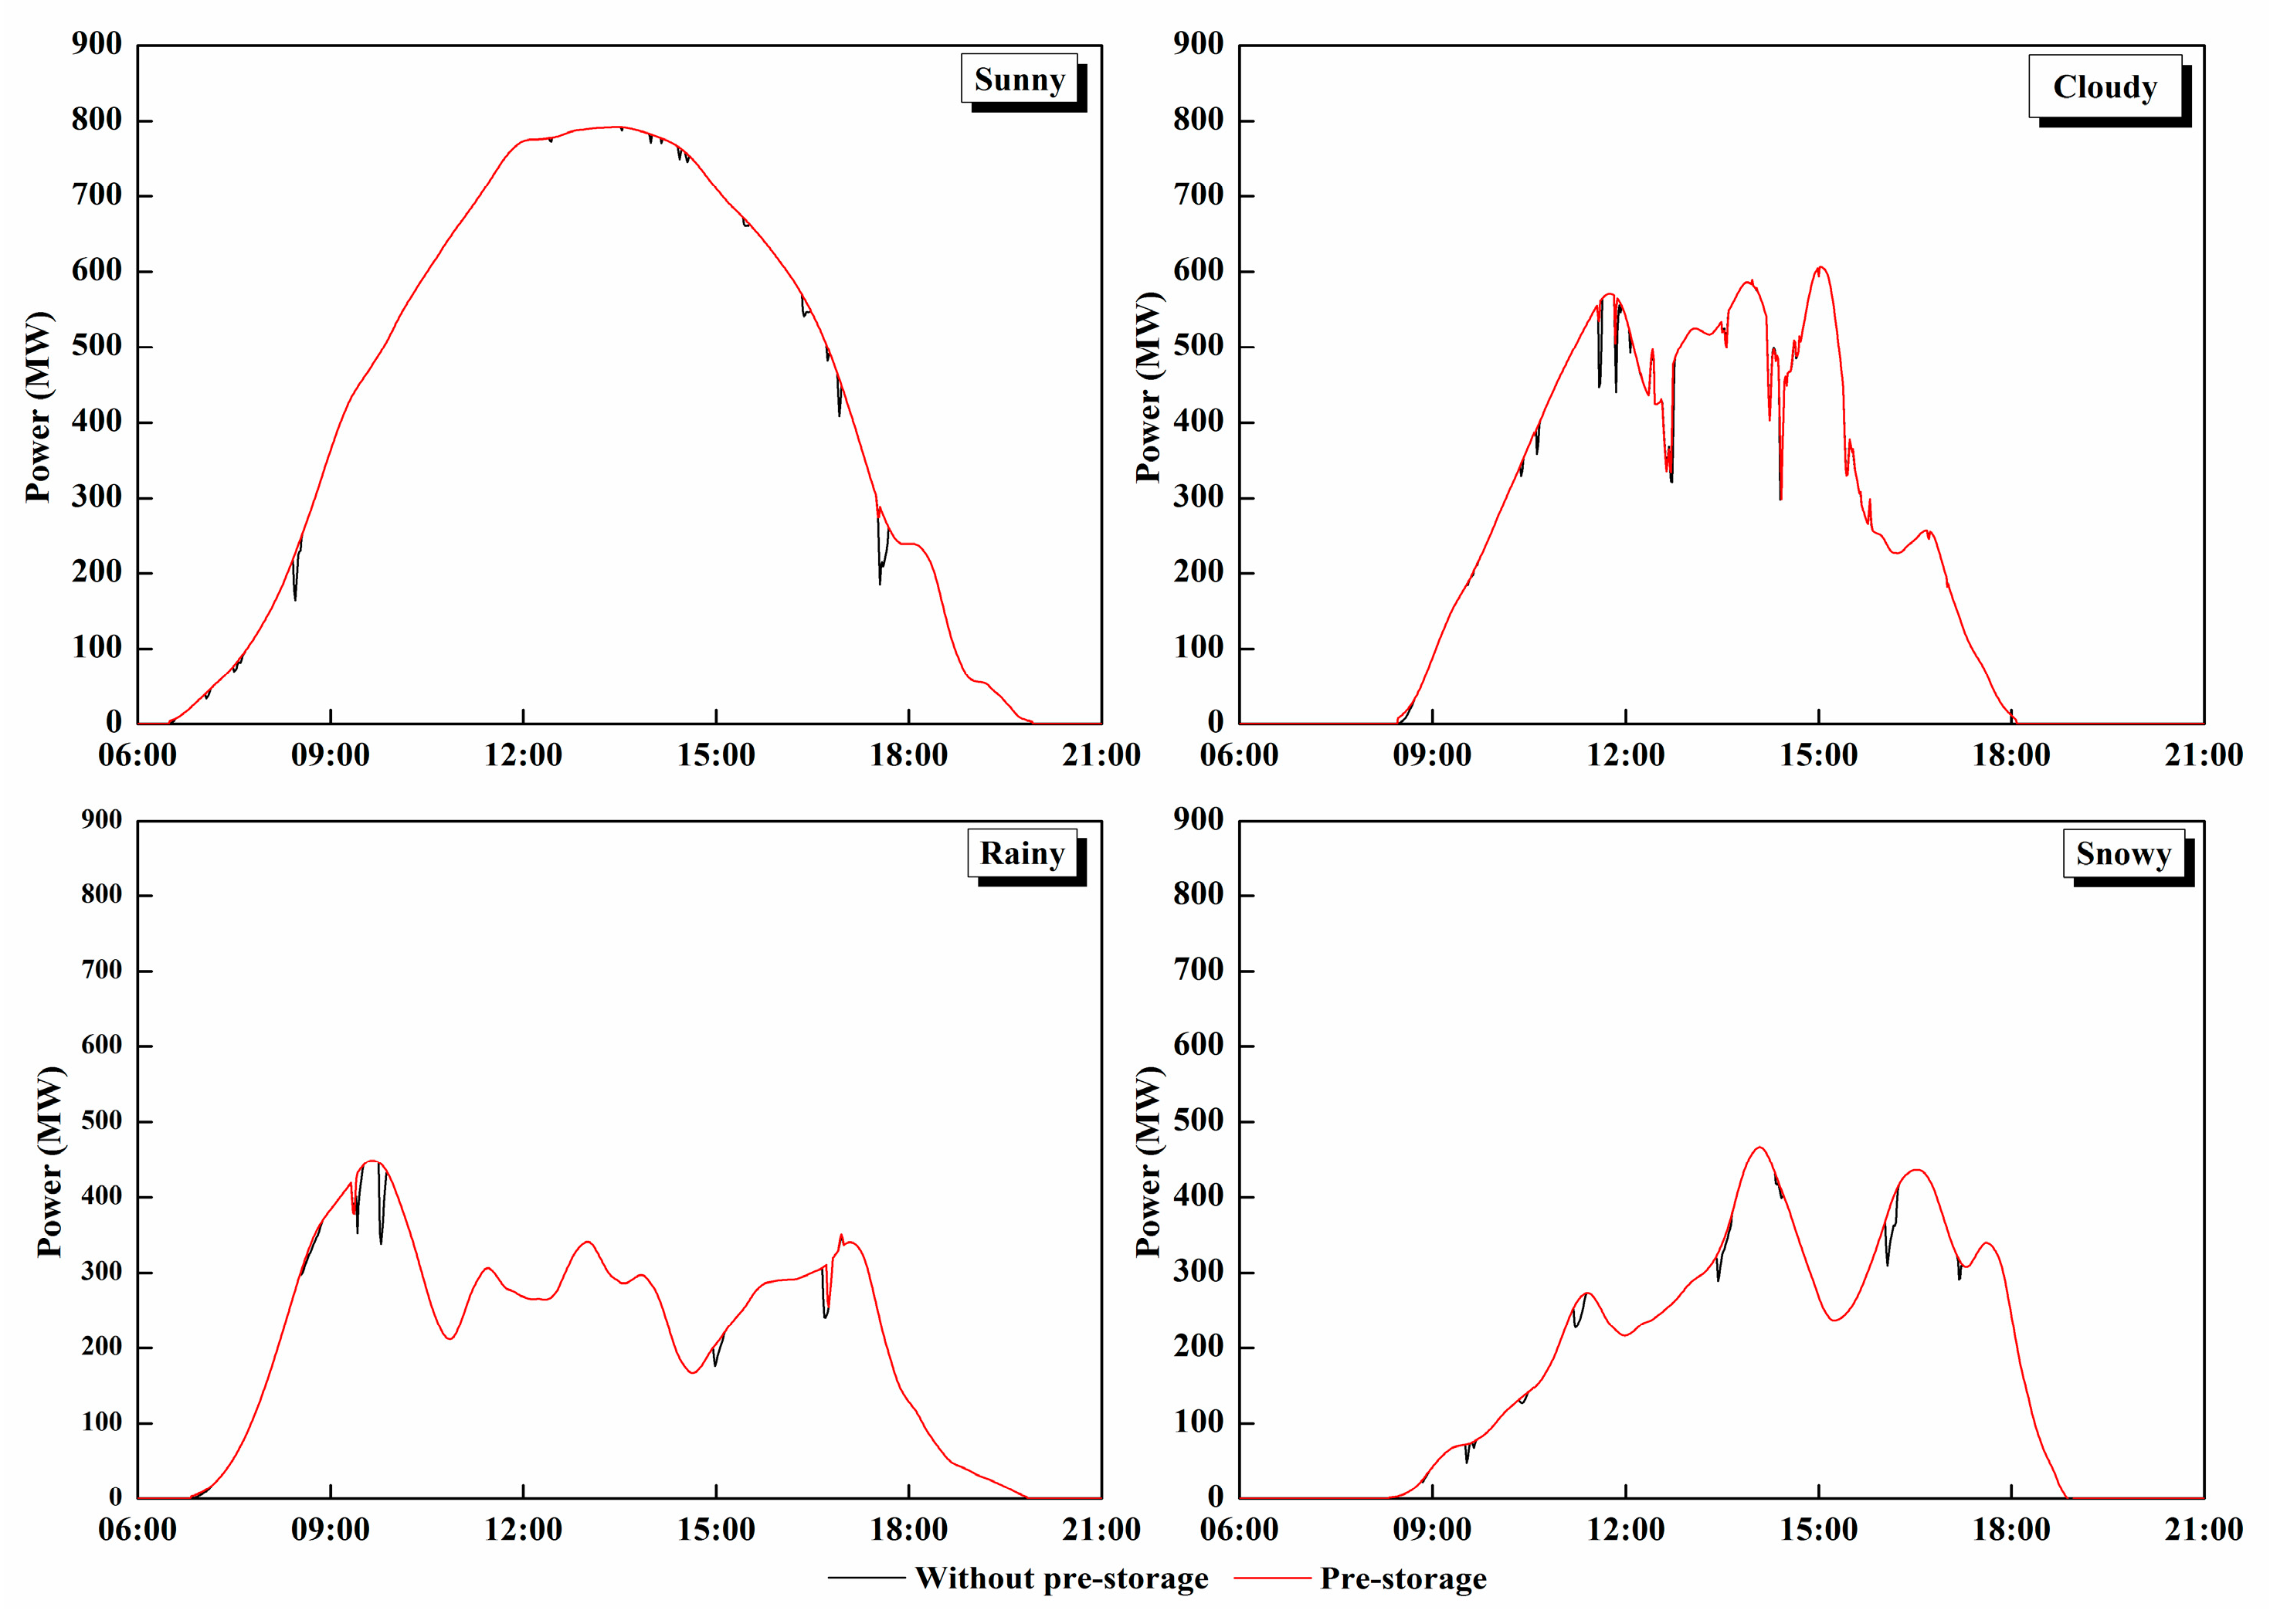
4.1. Pre-Storage Strategy

Energy loss during operation of energy storage devices can lead to energy shortage of the system. Furthermore, if the daily initial storage of the energy storage device is 0, the system regulation ability during the daily initial operation period will be reduced. A solution to these limitations is to set a certain amount of daily initial storage for the energy storage device. Therefore, a pre-storage operation strategy was proposed and discussed in this paper.
The strategy was proposed to reduce the fluctuation duration such that the determination of the daily initial storage of HES and HPS should use the minimum number of daily fluctuation minutes as the objective. In addition, the variable was daily initial storage ratio, which is the ratio of the daily initial storage to the total energy capacity of energy storage device. After calculating the daily fluctuation minutes under different daily initial storage ratios (Figure 11), the optimal intervals of daily initial electric quantity ratios with minimum number of daily fluctuation minutes can be obtained.
As illustrated in Figure 11, the daily fluctuation minutes were mainly affected by the change of the initial storage ratio of the VRB, and were less affected by SC. Therefore, the daily initial storage was only set for VRB in this study. The optimal ranges of the daily initial storage ratio of VRB under the four weather conditions were obtained (Table 4). In cases where the daily fluctuation minutes is the same, the daily initial storage should remain as low as possible. At this point, the minimum values of the intervals were selected as the optimal daily initial storage ratio.
The pre-storage strategy was incorporated into optimization model and the results are shown in Figure 12. Compared to the previous optimization results, fluctuations in the new optimization outputs were significantly reduced, except a small number of large power fluctuations on cloudy days. The target output satisfaction rate increased from 87.8% to 96.0%.

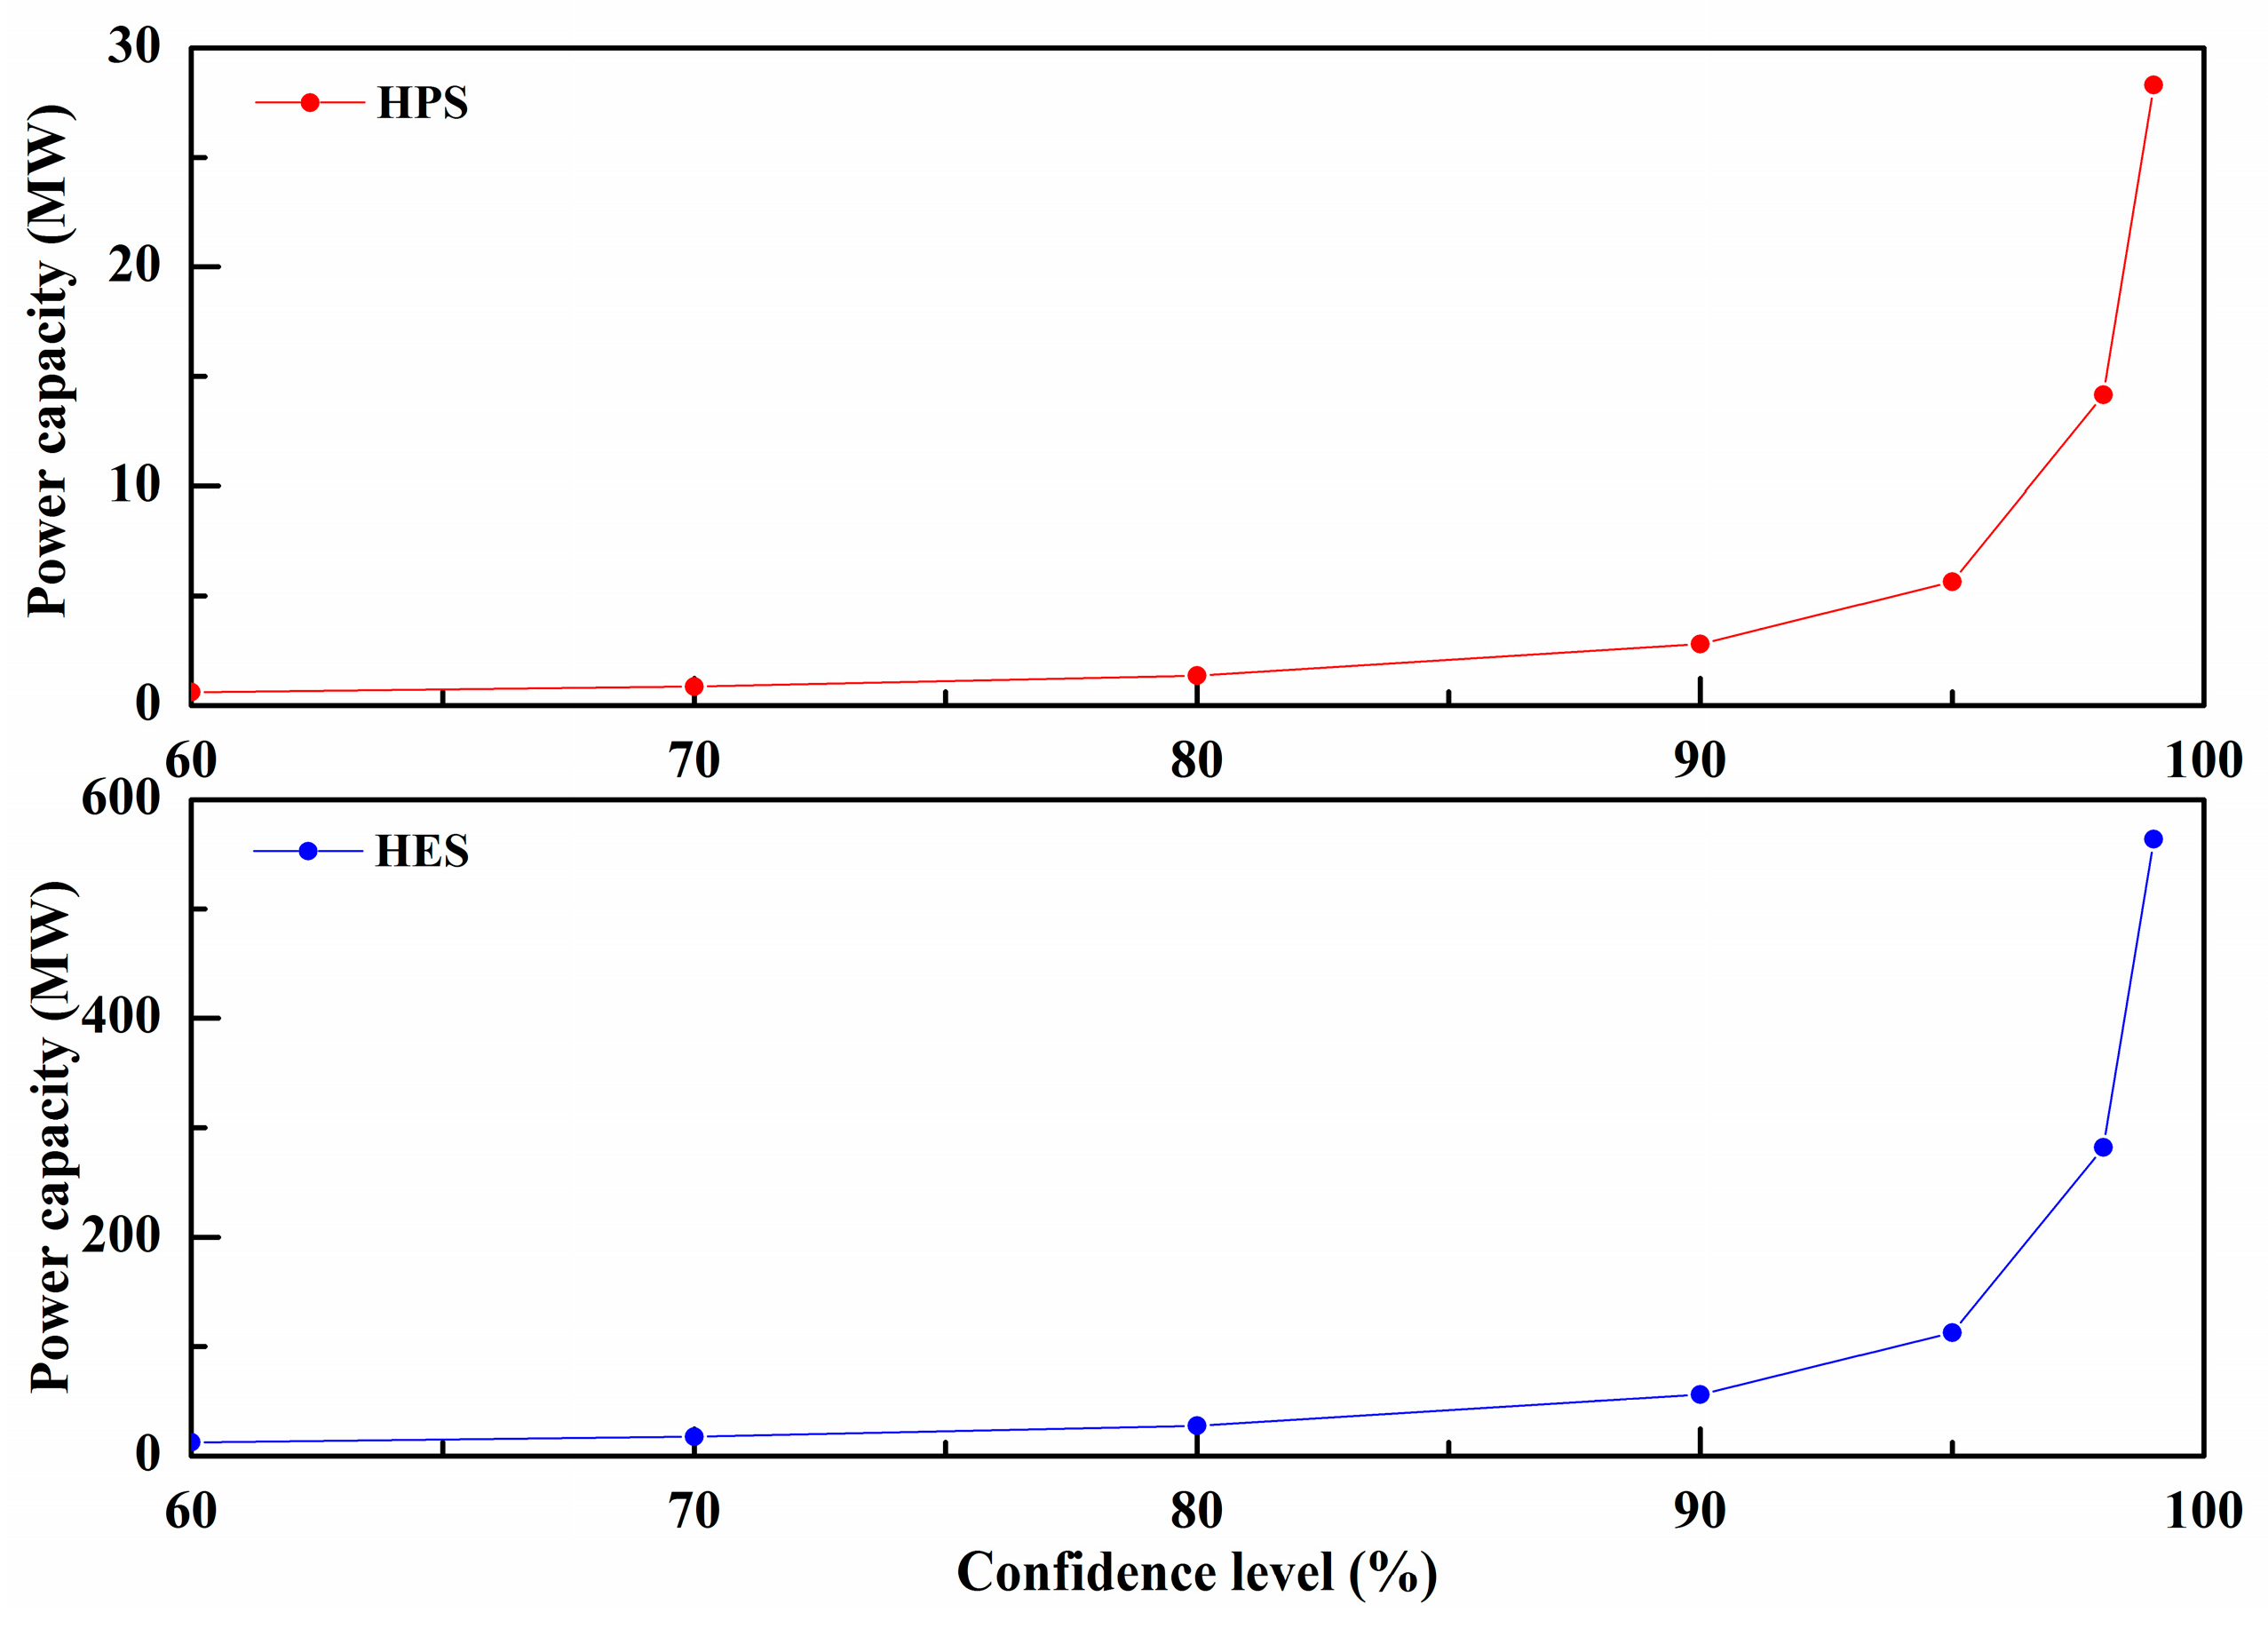
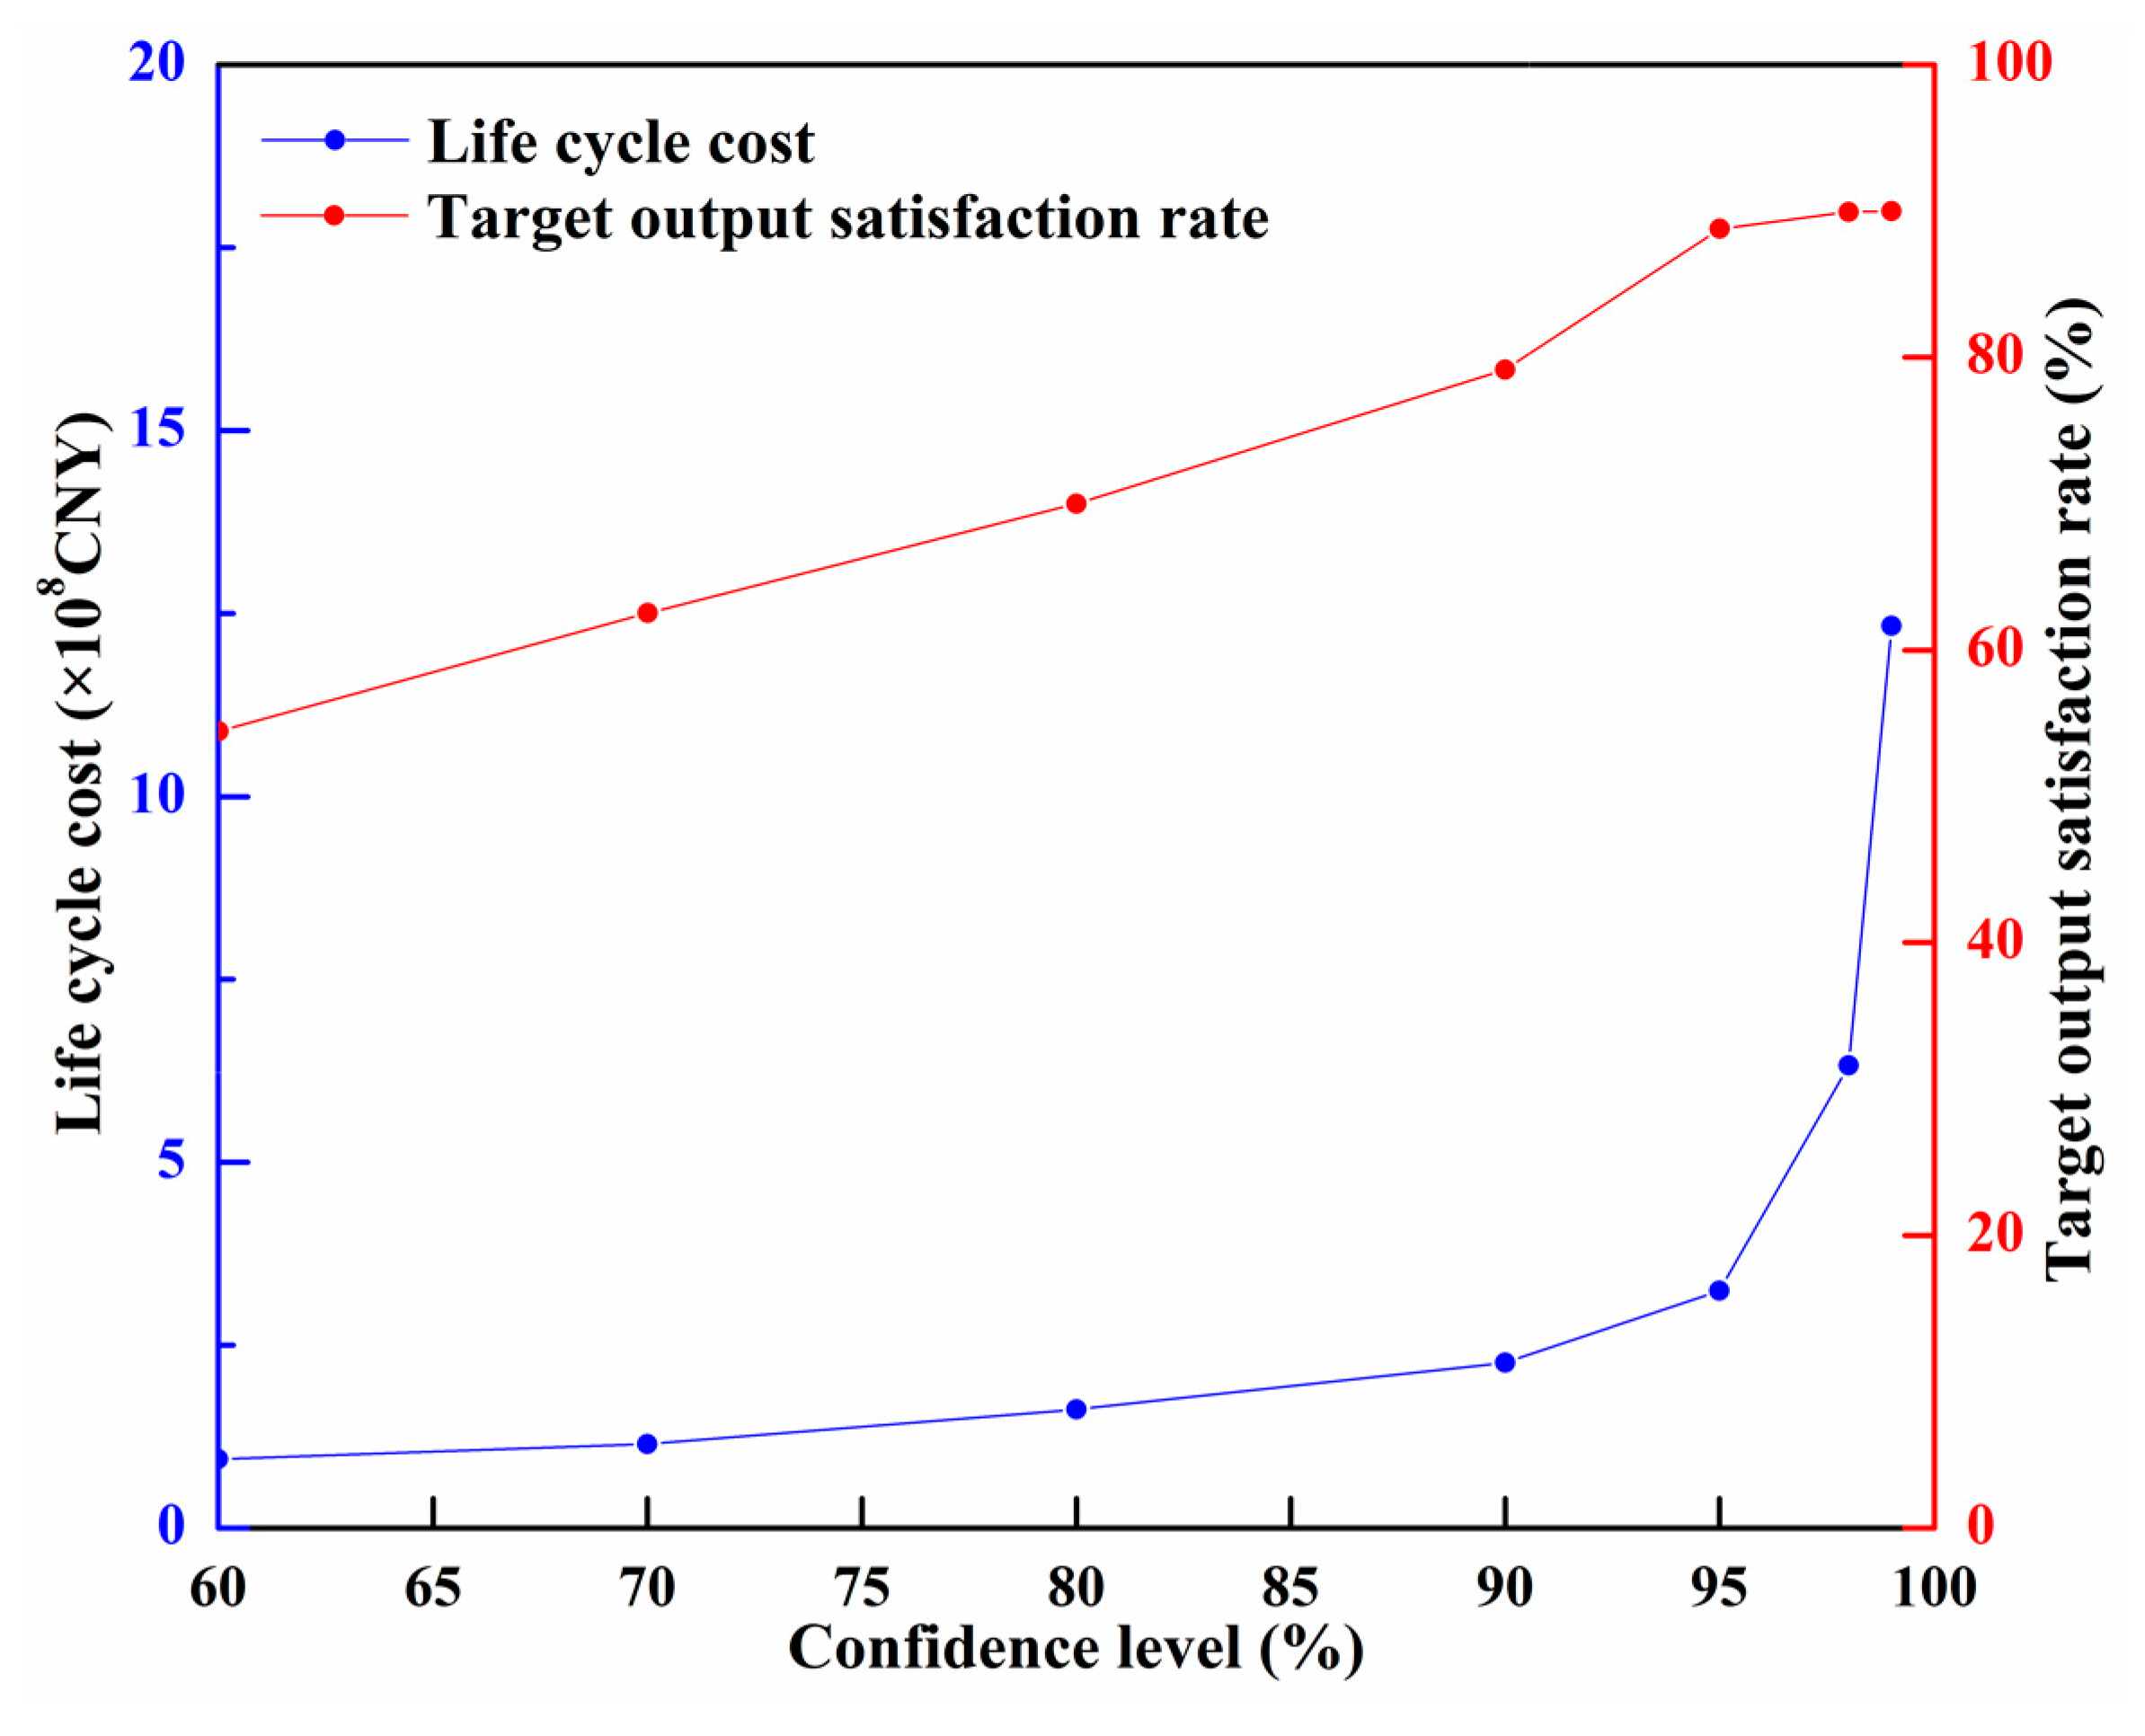
4.2. Sensitivity Analysis of Power Capacity Configuration

The effect of power capacities at different confidence levels on the two objectives are shown in Figure 13. It can be observed that the life cycle cost and target output satisfaction rate grow steadily with the increase of confidence level less than 90%. Furthermore, a sharp increase can be observed for both the life cycle cost and target output satisfaction rate between 90% to 95% confidence levels. After 95%, the life cycle cost is surged while the target output satisfaction rate grows small, indicating that the increase in power capacity has not improved satisfaction. Therefore, the 95% confidence level is the best choice considering higher satisfaction rate and lower cost.

5. Conclusions

This paper proposed a methodology for determining the capacity of HESS equipped for large-scale PV power stations that can aid in the planning of energy storage for PV power stations. The main conclusions are summarized as follows.
  • A statistical method for determining the power capacity was proposed in which the PV output characteristics and the weather factor were considered.
  • A multi-objective optimization model was established, in which the energy capacity of HESS was determined with the objectives of life cycle cost minimization and target output satisfaction rate maximization.
  • In the case study, all above established methods were applied to Qinghai Gonghe PV power station, and the optimal HESS combination and capacity configuration were obtained. The results showed that the optimal capacity configuration of HESS obtained by these methods can improve the stability of output significantly and the target output satisfaction rate is 87.8%.
  • A pre-storage strategy which can further improve the stability of PV output was discussed in which the optimal solution of the initial electric quantity of HESS was determined and the target output satisfaction rate increased by 8.28% compared with previous result.
  • A sensitivity analysis of power capacity configuration was conducted which demonstrated that the confidence level has a significant effect on life cycle cost and target output satisfaction rate. The power capacity at 95% confidence level was the best choice, considering it higher satisfaction rate and minimum cost.
The strength of the methodology is in fully considering the PV output characteristics, weather factor and multiple energy storage combinations. Due to its good performance in the case study, this methodology can be considered to be a useful tool or reference for sizing of hybrid energy storage systems equipped for large-scale PV power stations. Finally, a real-time control strategy for PV-HESS will be the next study.

Author Contributions

Conceptualization, C.M., S.D., J.L. and X.P.; methodology, C.M. and S.D.; software, S.D.; investigation, C.M., S.D., J.L. and X.P.; resources, C.M., J.L. and X.P.; writing—original draft preparation, C.M. and S.D.; writing—review and editing, C.M. and S.D.; project administration, C.M., J.L. and X.P.

Funding

This research was funded by “the National Natural Science Foundation of China, grant number 51722906” and “the Programme of Introducing Talents of Discipline to Universities, grant number B14012”.

Acknowledgments

We thank Feng Chong and Lun Wang of Huanghe Hydropower Development Co. Ltd. for collecting data for this manuscript. Finally, the authors are grateful to the editors and anonymous reviewers for their help in improving this article through their constructive comments and suggestions.

Conflicts of Interest

The authors declare no conflict of interest.

References

  1. Ellabban, O.; Abu-Rub, H.; Blaabjerg, F. Renewable energy resources: Current status, future prospects and their enabling technology. Renew. Sustain. Energy Rev. 2014, 39, 748–764. [Google Scholar] [CrossRef]
  2. Sun, H.; Zhi, Q.; Wang, Y.; Yao, Q.; Su, J. China’s solar photovoltaic industry development: The status quo, problems and approaches. Appl. Energy 2014, 118, 221–230. [Google Scholar] [CrossRef]
  3. Hua, Z.; Ma, C.; Lian, J.; Pang, X.; Yang, W. Optimal capacity allocation of multiple solar trackers and storage capacity for utility-scale photovoltaic plants considering output characteristics and complementary demand. Appl. Energy 2019, 238, 721–733. [Google Scholar] [CrossRef]
  4. Singh, S.; Singh, M.; Kaushik, S.C. Feasibility study of an islanded microgrid in rural area consisting of PV, wind, biomass and battery energy storage system. Energy Convers. Manag. 2016, 128, 178–190. [Google Scholar] [CrossRef]
  5. State Grid Corporation of China. Technical Rule for Connecting Photovoltaic Power Station to Power Grid; State Grid Corporation of China: Beijing, China, 2016. [Google Scholar]
  6. Puerto Rico Electric Power Authority. Minimum Technical Requirements for Photovoltaic (PV) Generation Projects; Puerto Rico Electric Power Authority: San Juan, Puerto Rico, 2012. [Google Scholar]
  7. C.R.E. Reglas Generales de Interconexión al Sistema Eléctrico Nacional. 2006. Available online: http://www.cre.gob.mx/documento/3380.pdf (accessed on 22 May 2012).
  8. Mazzeo, D.; Oliveti, G.; Baglivo, C.; Congedo, P.M. Energy reliability-constrained method for the multi-objective optimization of a photovoltaic-wind hybrid system with battery storage. Energy 2018, 156, 688–708. [Google Scholar] [CrossRef]
  9. Kocer, M.C.; Cengiz, C.; Cezer, M.; Gunes, D.; Cinar, M.A.; Alboyaci, B.; Onen, A. Assessment of Battery Storage Technologies for a Turkish Power Network. Sustainability 2019, 11, 3669. [Google Scholar] [CrossRef]
  10. Bocklisch, T. Hybrid energy storage approach for renewable energy applications. J. Energy Storage 2016, 8, 311–319. [Google Scholar] [CrossRef]
  11. Aneke, M.; Wang, M. Energy storage technologies and real life applications-A state of the art review. Appl. Energy 2016, 179, 350–377. [Google Scholar] [CrossRef]
  12. Gallo, A.B.; Simões-Moreira, J.R.; Costa, H.K.M.; Santos, M.M.; Moutinho Dos Santos, E. Energy storage in the energy transition context: A technology review. Renew. Sustain. Energy Rev. 2016, 65, 800–822. [Google Scholar] [CrossRef]
  13. Xia, Y.; Peng, Y.; Yang, P.; Li, Y.; Wei, W. Different Influence of Grid Impedance on Low- and High- frequency Stability of PV Generators. IEEE Trans. Ind. Electron. 2019, 66, 8498–8508. [Google Scholar] [CrossRef]
  14. Abbassi, A.; Dami, M.A.; Jemli, M. Statistical characterization of capacity of Hybrid Energy Storage System (HESS) to assimilate the fast PV-Wind power generation fluctuations. In Proceedings of the 2017 International Conference on Advanced Systems and Electric Technologies (IC_ASET), Hammamet, Tunisia, 14–17 January 2017; pp. 467–472. [Google Scholar]
  15. Itani, K.; De Bernardinis, A.; Khatir, Z.; Jammal, A. Comparative analysis of two hybrid energy storage systems used in a two front wheel driven electric vehicle during extreme start-up and regenerative braking operations. Energy Convers. Manag. 2017, 144, 69–87. [Google Scholar] [CrossRef]
  16. Wen, S.; Lan, H.; Yu, D.C.; Fu, Q.; Hong, Y.; Yu, L.; Yang, R. Optimal sizing of hybrid energy storage sub-systems in PV/diesel ship power system using frequency analysis. Energy 2017, 140, 198–208. [Google Scholar] [CrossRef]
  17. Jing, W.L.; Lai, C.H.; Wong, W.S.H.; Wong, M.L.D. Dynamic power allocation of battery-supercapacitor hybrid energy storage for standalone PV microgrid applications. Sustain. Energy Technol. Assess. 2017, 22, 55–64. [Google Scholar] [CrossRef]
  18. Hajiaghasi, S.; Salemnia, A.; Hamzeh, M. Hybrid energy storage system for microgrids applications: A review. J. Energy Storage 2019, 21, 543–570. [Google Scholar] [CrossRef]
  19. Zhang, Y.; Xu, Y.; Guo, H.; Zhang, X.; Guo, C.; Chen, H. A hybrid energy storage system with optimized operating strategy for mitigating wind power fluctuations. Renew. Energy 2018, 125, 121–132. [Google Scholar] [CrossRef]
  20. Zhao, Z.; Xiao, H.; Yang, Y. Improved coordinated control strategy of hybrid energy storages in PV Power Smoothing. Energy Procedia 2018, 145, 151–156. [Google Scholar] [CrossRef]
  21. Aktas, A.; Erhan, K.; Ozdemir, S.; Ozdemir, E. Experimental investigation of a new smart energy management algorithm for a hybrid energy storage system in smart grid applications. Electr. Power Syst. Res. 2017, 144, 185–196. [Google Scholar] [CrossRef]
  22. Li, B.; Roche, R.; Paire, D.; Miraoui, A. Sizing of a stand-alone microgrid considering electric power, cooling/heating, hydrogen loads and hydrogen storage degradation. Appl. Energy 2017, 205, 1244–1259. [Google Scholar] [CrossRef] [Green Version]
  23. Li, J.; Yang, Q.; Robinson, F.; Liang, F.; Zhang, M.; Yuan, W. Design and test of a new droop control algorithm for a SMES/battery hybrid energy storage system. Energy 2017, 118, 1110–1122. [Google Scholar] [CrossRef]
  24. Destro, N.; Benato, A.; Stoppato, A.; Mirandola, A. Components design and daily operation optimization of a hybrid system with energy storages. Energy 2016, 117, 569–577. [Google Scholar] [CrossRef]
  25. Yang, Y.; Bremner, S.; Menictas, C.; Kay, M. Battery energy storage system size determination in renewable energy systems: A review. Renew. Sustain. Energy Rev. 2018, 91, 109–125. [Google Scholar] [CrossRef]
  26. Jia, H.; Mu, Y.; Qi, Y. A statistical model to determine the capacity of battery–supercapacitor hybrid energy storage system in autonomous microgrid. Electr. Power Syst. Res. 2014, 54, 516–524. [Google Scholar] [CrossRef]
  27. Abbassi, A.; Dami, M.A.; Jemli, M. A statistical approach for hybrid energy storage system sizing based on capacity distributions in an autonomous PV/Wind power generation system. Renew. Energy 2017, 103, 81–93. [Google Scholar] [CrossRef]
  28. Jacob, A.S.; Banerjee, R.; Ghosh, P.C. Sizing of hybrid energy storage system for a PV based microgrid through design space approach. Appl. Energy 2018, 212, 640–653. [Google Scholar] [CrossRef]
  29. Janghorban Esfahani, I.; Lee, S.; Yoo, C. Extended-power pinch analysis (EPoPA) for integration of renewable energy systems with battery/hydrogen storages. Renew. Energy 2015, 80, 1–14. [Google Scholar] [CrossRef]
  30. Berrueta, A.; Heck, M.; Jantsch, M.; Ursúa, A.; Sanchis, P. Combined dynamic programming and region-elimination technique algorithm for optimal sizing and management of lithium-ion batteries for photovoltaic plants. Appl. Energy 2018, 228, 1–11. [Google Scholar] [CrossRef]
  31. Xu, F.; Liu, J.; Lin, S.; Dai, Q.; Li, C. A multi-objective optimization model of hybrid energy storage system for non-grid-connected wind power: A case study in China. Energy 2018, 163, 585–603. [Google Scholar] [CrossRef]
  32. Liu, J.J.; Jin, T.X.; Liu, L.; Chen, Y.J.; Yuan, K. Multi-Objective Optimization of a Hybrid ESS Based on Optimal Energy Management Strategy for LHDs. Sustainability 2017, 9, 1874. [Google Scholar] [Green Version]
  33. Nojavan, S.; Majidi, M.; Esfetanaj, N.N. An efficient cost-reliability optimization model for optimal siting and sizing of energy storage system in a microgrid in the presence of responsible load management. Energy 2017, 139, 89–97. [Google Scholar] [CrossRef]
  34. Etemad, S.; Amirmazlaghani, M. A New Multiplicative Watermark Detector in the Contourlet Domain Using t Location-Scale Distribution. Pattern Recognit. 2017, 77, 99–112. [Google Scholar] [CrossRef]
  35. Ma, W.; Wang, W.; Wu, X.Z.; Hu, R.N.; Tang, F.; Zhang, W.G. Control Strategy of a Hybrid Energy Storage System to Smooth Photovoltaic Power Fluctuations Considering Photovoltaic Output Power Curtailment. Sustainability 2019, 11, 1324. [Google Scholar] [CrossRef]
Figure 1. Flow chart for the method of capacity configuration of HESS.
Sustainability 11 05441 g001
Figure 2. PV-HESS operation mode.
Sustainability 11 05441 g002
Figure 3. Flow chart for HESS controlling strategy.
Sustainability 11 05441 g003
Figure 4. Typical outputs of Gonghe PV power station.
Sustainability 11 05441 g004
Figure 5. Probability distributions of PV power and fluctuation. (a) Power range (MW); (b) Fluctuation range (MW).
Sustainability 11 05441 g005
Figure 6. Decomposition of PV output (Cloudy). (a) Original output; (b) Target output; (c) High frequency part; (d) Low frequency part
Sustainability 11 05441 g006
Figure 7. Fitting probability density curve.
Sustainability 11 05441 g007
Figure 8. Power capacity of HPS and HES at different confidence levels.
Sustainability 11 05441 g008
Figure 9. Comparison of original output and optimization output.
Sustainability 11 05441 g009
Figure 10. Comparison of low frequency fluctuation and VRB output.
Sustainability 11 05441 g010
Figure 11. The daily fluctuation minutes of the four weather conditions under different daily initial storage ratios.
Sustainability 11 05441 g011
Figure 12. Comparison of optimization output without pre-storage and with pre-storage.
Sustainability 11 05441 g012
Figure 13. The sensitivity analysis of confidence level.
Sustainability 11 05441 g013
Table 1. Time ratio of typical weather conditions.
WeatherSunnyCloudyRainySnowy
Time ratio39%36%22%3%
Table 2. Parameters of energy storages.
ParameterSCFlywheelVRBLi-ionPbAc
System cost (CNY/kWh)12,0006500350023001300
Cycle life (cycles)100,00020,00016,00050001500
Round trip efficiency95%96%80%95%85%
Depth of discharge 100%100%90%95%65%
Table 3. Optimization results.
IndexSC-VRBSC-LiSC-PbAcFlywheel-VRBFlywheel-LiFlywheel-PbAc
HPS energy capacity (MWh)0.570.570.570.570.570.57
HES energy capacity (MWh)40.6141.0452.1340.6141.0452.13
HPS replacement times (Times)111777
HES replacement times (Times)26232623
Life cycle cost (CNY)3.24 × 1084.45 × 1081.01 × 1093.32 × 1084.53 × 1081.02 × 109
Target output satisfaction rate87.8%91.3%89.1%87.8%91.3%89.2%
Table 4. Optimal intervals of daily initial storage ratio of VRB.
WeatherOptimal Interval
Sunny[0.620, 0.839]
Cloudy[0.479, 0.591]
Rainy[0.651, 0.661]
Snowy[0.636, 0.872]

